a • • • » FEDERAL RESERVE statistical release ~ -fgHfc • • • » FEDERAL RESERVE...
23
a • • • » FEDERAL RESERVE statistical release ~ -fgHfc H.6(508) MONEY STOCK REVISIONS Measures of the money stock have been revised to incorporate the results of the annual benchmark and seasonal factor review. The attached tables compare growth rates of the old and revised series. This release includes revised monthly and weekly seasonal factors, as well as comparisons of the revised monetary aggregates with previously published data. Data for the monetary aggregates have been benchmarked using call reports through September 1991 and other sources. These benchmark revisions boosted the growth rate of M2 by nearly 1/2 percentage point over 1991, but had no effect on the annual growth rate of M3. The benchmark incorporates corrections for the previous mis- reporting of brokered time deposits by several large banks. Previously, these deposits had been misclassified as large time deposits, rather than as small time deposits. The reclassification of these deposits boosted both the level and growth rate of M2 in 1991, without affecting M3 as a whole. The benchmark also resulted in substantial upward revisions to IRA/Keogh accounts at credit unions since mid-1990. Because these accounts are netted out of small time deposits, the effect was to lower non-Mi M2 ; however, this effect was more than offset by upward revisions in other components of M2. In addition, there were some other minor downward revisions to non-M2 M3. Seasonal factors for the monetary aggregates have been revised using the X-11-ARIMA procedure that has been employed for this purpose since 1982. Following the method used last year, seasonal factors for deposit series have been constructed with data aggregated across banks and thrifts. Owing to changes in the deposit reports (FR2900) effective September 17, 1991, the series for savings deposits and MMDAs have been combined. Beginning with January 1990, seasonal factors have been constructed from this combined series. Up to December 1989, each of the four series--savings deposits at banks, savings deposits at thrifts, MMDAs at banks and MMDAs at thrifts-- continues to be seasonally adjusted individually. Through that date, the four adjusted bank and thrift series are then summed to yield the seasonally adjusted total savings deposits and MMDAs. Overall, the revisions to seasonal factors had little effect on the broad pattern of growth during 1991, though some growth was redistributed from the first half to the second half of the year. For example, on a second quarter to fourth quarter basis, the revised seasonal factors raised Ml growth by 0.5 percent, M2 growth by 0.3 percent, and M3 growth by 0.4 percent, while the growth rates over the first half of 1991 were reduced by like amounts. Digitized for FRASER http://fraser.stlouisfed.org/ Federal Reserve Bank of St. Louis
Transcript of a • • • » FEDERAL RESERVE statistical release ~ -fgHfc • • • » FEDERAL RESERVE...

a • • • »
FEDERAL RESERVE statistical release ~ - f g H f c
H.6(508)
MONEY STOCK REVISIONS
Measures of the money stock have been revised to incorporate the results of the annual benchmark and seasonal factor review. The attached tables compare growth rates of the old and revised series. This release includes revised monthly and weekly seasonal factors, as well as comparisons of the revised monetary aggregates with previously published data.
Data for the monetary aggregates have been benchmarked using call reports through September 1991 and other sources. These benchmark revisions boosted the growth rate of M2 by nearly 1/2 percentage point over 1991, but had no effect on the annual growth rate of M3.
The benchmark incorporates corrections for the previous mis-reporting of brokered time deposits by several large banks. Previously, these deposits had been misclassified as large time deposits, rather than as small time deposits. The reclassification of these deposits boosted both the level and growth rate of M2 in 1991, without affecting M3 as a whole. The benchmark also resulted in substantial upward revisions to IRA/Keogh accounts at credit unions since mid-1990. Because these accounts are netted out of small time deposits, the effect was to lower non-Mi M2 ; however, this effect was more than offset by upward revisions in other components of M2. In addition, there were some other minor downward revisions to non-M2 M3.
Seasonal factors for the monetary aggregates have been revised using the X-11-ARIMA procedure that has been employed for this purpose since 1982. Following the method used last year, seasonal factors for deposit series have been constructed with data aggregated across banks and thrifts. Owing to changes in the deposit reports (FR2900) effective September 17, 1991, the series for savings deposits and MMDAs have been combined. Beginning with January 1990, seasonal factors have been constructed from this combined series. Up to December 1989, each of the four series--savings deposits at banks, savings deposits at thrifts, MMDAs at banks and MMDAs at thrifts--continues to be seasonally adjusted individually. Through that date, the four adjusted bank and thrift series are then summed to yield the seasonally adjusted total savings deposits and MMDAs.
Overall, the revisions to seasonal factors had little effect on the broad pattern of growth during 1991, though some growth was redistributed from the first half to the second half of the year. For example, on a second quarter to fourth quarter basis, the revised seasonal factors raised Ml growth by 0.5 percent, M2 growth by 0.3 percent, and M3 growth by 0.4 percent, while the growth rates over the first half of 1991 were reduced by like amounts.
Digitized for FRASER http://fraser.stlouisfed.org/ Federal Reserve Bank of St. Louis

-2-
Complete historical data will soon be available from the Money and Reserves Projection Section, Mail Stop 72, Board of Governors of the Federal Reserve Reserve System, Washington, D.C. 20551, (202) 452-3062. Revised monthly historical data for Ml, M2, M3, and total nonfinancial debt also are available from the Economic Bulletin Board of the U.S. Commerce Department. Call (202) 377-1986 for information on how to access the Commerce bulletin board.
Digitized for FRASER http://fraser.stlouisfed.org/ Federal Reserve Bank of St. Louis

FEDERAL RESERVE statistical release These data are scheduled for release each Thursday at 4:30 p.M.
H.6 (508) Table 1
MONEY STOCK, LIQUID ASSETS, AND DEBT MEASURES Billions of dollars
&]£§&:•
••S35S??-
FEBRUARY 13, 1992
Date M1J M22 M33 DEBT5
Seasonally adjusted
1990-FEB. 800.7 MAR. 803.7 APR. 807.3 MAY 806.2 JUNE 809.7 JULY 810.1 AUG. 816.2 SEP. 822.9 OCT. 822.3 NOV. 823.8 DEC. 826.1
1991-JAN. 826.2 FEB. 836.2 MAR. 842.2 APR. 842.7 MAY 850.8 JUNE 857.2 JULY 860.0 AUG. 866.5 SEP. 872.0 OCT. 880.9 NOV. 891.4 DEC. 898.1
1992-JAN. p 910.6
3258. 3270. 3279. 3282. 3290. 3297. 3313. 3327. 3329. 3327. 3332.
3336.5 3361.4 3378.5 3385.7 3396.4 3402.8 3400.6 3403.6 3408.2 3420.1 3434.0 3441.6
3451.4
4073, 4074, 4079, 4079, 4083, 4090. 4106, 4115, 4117, 4115, 4114,
4125. 4159. 4165. 4168. 4170. 4167. 4157. 4157.4 4154.5 4161.7 4170.5 4174.6
4180.0
.1
.6
.3
.0
.0
.5
.2
4901.1 10225.4 4909.7 10299.4 4921.3 10360.2 4905.1 10411.9 4925.6 10478.9 4928.7 10541.3 4939.3 10606.1 4964.3 10658.5 4962.7 10696.5 4960.4 10750.7 4966.7 10791.0
4980.1 10821.1 5008.0 10871.6 5004.7 10905.6 4979.0 10924.5 4958.7 10974.5 4987.0 11022.9 4993.1 11060.1 4990.2 11106.8 4982.6 11154.5 4990.6 11206.5 5000.7 11257.5 4991.5 p 11292.4
Not seasonally adjusted
1990-FEB. 788.0 MAR. 795.9 APR. 817.6 MAY 796.9 JUNE 810.4 JULY 812.5 AUG. 814.2 SEP. 818.7 OCT. 817.6 NOV. 826.1 DEC. 844.1
1991-JAN. 832.7 FEB. 823.3 MAR. 835.0 APR. 853.0 MAY 841.6 JUNE 858.0 JULY 862.3 AUG. 864.5 SEP. 867.4 OCT. 875.4 NOV. 893.9 DEC. 917.3
1992-JAN. p 918.3
3247. 3270. 3294, 3265. 3286 3301 3312.8 3320. 3325. 3331. 3345.
3343. 3350. 3380. 3401. 3379. 3399. 3403. 3403. 3400. 3415. 3437. 3455.
4063. 4077. 4091. 4065. 4080.8 4092. 4109. 4108. 4109. 4118. 4124.
4128. 4150. 4171. 4182. 4156. 4164. 4158. 4160. 4146.8 4152.5 4172. 4185.
.9
.1
.0
.2
.5
.9
.4
.9
4896.1 10196.1 4914.5 10261.0 4931.5 10318.8 4889.8 10365.2 4914.4 10430.0 4920.1 10492.5 4934.3 10554.8 4956.1 10610.9 4954.0 10659.8 4968.1 10722.6 4986.5 10778.2
4998.0 10809.3 5002.8 10842.0 5011.9 10868.6 4991.4 10884.4 4943.7 10928.1 4975.0 10973.3 4984.5 11009.9 4984.6 11056.7 4973.5 11109.8 4980.6 11172.7 5008.6 11232.6 5012.6 p 11280.8
3459.3 4185.1
Footnotes appear on the following p—indicates preliminary data.
Digitized for FRASER http://fraser.stlouisfed.org/ Federal Reserve Bank of St. Louis

H.6 (508) Table 2
MONEY STOCK AND DEBT MEASURES Percent change at seasonally adjusted annual rates
Ml M2 M3 Debt]
3 Months from OCT. 1991 TO JAN. 1992
6 Months from JULY 1991 to JAN. 1992
12 Months from JAN. 1991 TO JAN. 1992
13.5
11.8
10.2
3.7
3.0
3.4
1.8
1.1
1.3
4.9
4.9
4.6
Thirteen weeks ending FEBRUARY 3, from thirteen weeks ending:
1992
NOV. 4, 1991 (13 weeks previous)
AUG. 5, 1991 (26 weeks previous)
FEB. 4, 1991 (52 weeks previous)
12.5
10.3
9.2
3.8
2.6
3.3
1.7
0.6
1.4
Growth rates for debt are based on periods beginning and ending one month earlier than for the monetary aggregates, namely, September 1991 to December 1991, June 1991 to December 1991, and December 1990 to December 1991, respectively.
Footnotes to Table 1
Consists of (1) currency outside the U.S. Treasury, Federal Reserve Banks, and the vaults of depository institutions! (2) travelers checks of nonbank issuers! (3) demand deposits at all commercial banks other than those due to depository institutions, the U.S. government, and foreign banks and official institutions, less cash items in the process of collection and Federal Reserve float! and (4) other checkable deposits (OCDs), consisting of negotiable order of withdrawal (NOW) and automatic transfer service (ATS) accounts at depository institutions, credit union share draft accounts and demand deposits at thrift institutions. Seasonally adjusted Ml is calculated by summing currency, travelers checks, demand deposits, and OCDs, each seasonally adjusted separately. Consists of Ml plus overnight (and continuing contract) RPs issued by all depository institutions and overnight Eurodollars issued to U.S. residents by foreign.branches of U.S. banks worldwide, savings deposits (including money market deposit accounts), small-denomination time deposits (time deposits—including retail RPs—in amounts of less than $100,000), and balances in both taxable and tax-exempt general purpose and broker/dealer money market mutual funds. Excludes individual retirement account (IRA) and Keogh balances at depository institutions and money market funds. Also excludes all balances held by U.S. commercial banks, money market funds (general purpose and broker/dealer), foreign governments and commercial banks, and the U.S. government. Seasonally adjusted M2 is computed by adjusting its non-Mi component as a whole and then adding this result to seasonally adjusted Ml. Consists of M2 plus large-denomination time deposits (in amounts of $100,000 or more) and term RP liabilities issued by all depository institutions, term Eurodollars held by U.S. residents at foreian branches of U.S. banks worldwide and at all banking offices in the United Kinadom and Canada, and balances in both taxable and tax-exempt institution-only money market mutual funds. Excludes amounts held by depository institutions, the U.S. government, money market funds, and foreign banks and official institutions. Also subtracted is the estimated amount ot overnight RPs and Eurodollars held by institution-only money market mutual funds. Seasonally adjusted M3 is obtained by adjusting its non-M2 component as a whole and then adding this result to seasonally adjusted M2. Consists of M3 plus the nonbank public holdings of U.S. savings bonds, short-term Treasury securities, commercial paper and bankers acceptances, net of money market mutual fund holdings of these assets. Debt of domestic nonfinancial sectors consists of outstanding credit market debt of the U.S. government, state and local
fDvernments and private nonfinancial sectors. Private debt consists of corporate bonds, mortgages, consumer credit including bank loans), other bank loans, commercial paper, bankers acceptances and other debt instruments. The data are derived from the Federal Reserve Board's flow of funds accounts. All data on debt of domestic nonfinancial sectors are presented in month-average form, derived by averaging adjacent month-end levels. These data have also been adjusted to remove statistical discontinuities that may arise in the underlying flow of funds statistics. The presentation of debt data in this release differs, therefore, from the quarterly flow of funds statistics contained in the Federal Reserve releases Z.7 and Z.l. In those releases, published levels of credit market debt are measured on a quarter-end basis and include discontinuities.
Digitized for FRASER http://fraser.stlouisfed.org/ Federal Reserve Bank of St. Louis

H.6 (508) Table 3
MONEY STOCK MEASURES Billions of dollars
Seasonally adjus ;ted
Ml M2 M3
13-week 4-week week 13-week 4-week week 13-week 4-week week Period er* ding
11
average average average average average average average average average
1991-NOV.
ding
11 876.0 885.2 888.9 3414.1 3424.6 3430.0 4159.3 4163.9 4167.5 18 878.0 887.7 891.6 3416.5 3427.7 3435.2 4160.3 4166.1 4171.2 25 880.0 890.2 893.9 3418.8 3432.0 3438.0 4161.3 4169.0 4174.6
DEC. 2 881.9 892.4 895.0 3421.5 3435.7 3439.6 4162.6 4171.8 4174.0 9 883.9 894.3 896.6 3423.9 3438.6 3441.6 4163.9 4173.6 4174.6 16 885.9 895.8 897.6 3426.7 3441.5 3446.8 4165.7 4176.8 4184.0 23 888.0 897.0 898.9 3429.4 3442.9 3443.4 4167.7 4177.3 4176.4 30 890.0 898.2 899.5 3432.0 3442.7 3439.0 4169.0 4175.1 4165.3
1992-JAN. 6 891.9 899.7 902.9 3434.1 3442.7 3441.4 4169.1 4170.9 4157.7 13 894.1 902.0 906.6 3436.1 3442.5 3446.2 4169.9 4168.8 4175.6 20 896.3 904.8 910.2 3438.4 3444.6 3451.7 4171.4 4170.1 4181.8 27p 898.7 908.7 915.2 3441.1 3448.9 3456.3 4173.7 4176.8 4192.1
FEB. 3p 901.4 913.4 921.7 3444.3 3455.2 3466.5 4176.3 4186.6 4196.8
Not seasonally adjusted
Ml M2 M3
13-week 4-week week 13-week 4-week week 13-week 4-week week Period en ding
11
average average average average average average average average average
1991-NOV.
ding
11 871.8 880.6 894.9 3412.8 3420.4 3439.0 4154.0 4156.7 4176.2 18 874.2 885.5 896.3 3415.2 3426.9 3444.1 4155.0 4162.9 4176.7 25 876.5 890.3 882.7 3417.4 3434.4 3428.4 4156.1 4170.0 4166.4
DEC. 2 879.9 894.6 904.3 3420.5 3438.4 3441.9 4158.2 4174.4 4178.1 9 882.3 899.7 915.4 3423.2 3444.3 3462.6 4159.9 4178.7 4193.4 16 885.3 904.3 914.9 3426.6 3449.2 3463.8 4162.5 4183.8 4197.4 23 890.1 913.0 917.2 3431.2 3454.6 3450.2 4166.5 4187.0 4179.1 30 895.1 917.0 920.6 3436.0 3455.9 3447.0 4170.1 4184.9 4169.8
1992-JAN. 6 899.7 924.0 943.3 3440.0 3459.0 3475.1 4171.7 4181.3 4178.8 13 903.4 927.2 927.6 3443.5 3460.8 3470.7 4174.3 4181.8 4199.3 20 906.4 926.6 914.9 3446.7 3463.1 3459.4 4177.1 4184.1 4188.4 27p 909.1 921.2 899.0 3449.9 3461.4 3440.3 4180.0 4185.4 4175.0
FEB. 3p 910.8 912.7 909.2 3452.0 3456.1 3453.8 4181.9 4187.4 4186.7
Note: Special caution should be taken in interpreting week-to-week changes in money supply data, which are highly volatile and subject to revision. p—indicates preliminary data.
Digitized for FRASER http://fraser.stlouisfed.org/ Federal Reserve Bank of St. Louis

H.6 (508) Table 4
COMPONENTS OF MONEY STOCK, LIQUID ASSETS, AND DEBT Billions of dollars, seasonally adjusted
Currency1 Travelers checks2
Demand deposits3
Other checkable deposits Nontransactions components
Date Currency1 Travelers checks2
Demand deposits3
At commercial banks*
At thrift
institutions5 Total In M26 In M3 only*
1990-SEP. 241.9 8.3 280.1 205.6 87.0 292.5 2504.4 788.1
OCT. NOV. DEC.
244.2 245.4 246.8
8.4 8.3 8.3
278.1 277.4 277.1
205.9 207.0 208.7
85.7 85.7 85.2
291.6 292.6 293.9
2507.4 2504.1 2506.3
787.3 787.7 782.1
1991-JAN. FEB. MAR.
251.5 254.6 256.0
8.3 8.2 8.1
271.8 275.9 276.9
209.5 211.6 214.6
85.2 85.8 86.6
294.6 297.5 301.2
2510.3 2525.2 2536.3
788.6 798.2 786.7
APR. MAY JUNE
256.3 256.6 257.6
7.8 8.0 7.9
276.1 278.4 280.1
215.4 220.2 223.5
87.0 87.5 88.1
302.5 307.7 311.6
2542.9 2545.6 2545.6
782.3 773.7 764.7
JULY AUG. SEP.
259.3 261.3 262.9
7.8 7.8 7.8
279.3 280.1 280.6
225.8 229.5 232.4
87.8 87.8 88.2
313.6 317.3 320.6
2540.6 2537.1 2536.2
756.6 753.8 746.3
OCT. NOV. DEC.
264.8 266.0 267.3
7.9 8.0 8.2
283.8 287.6 289.5
235.4 239.2 241.6
89.1 90.5 91.6
324.5 329.7 333.2
2539.2 2542.6 2543.4
741.6 736.5 733.1
1992-JAN. P 269.4 8.3 293.9 245.8 93.2 339.1 2540.8 728.6
Neek ending
1991-DEC. 9 16 23 30
266.9 267.2 267.2 267.9
8.1 8.2 8.2 8.3
289.4 289.3 289.9 289.4
241.7 242.3 242.0 240.3
90.5 90.7 91.6 93.6
332.2 333.0 333.6 333.9
2545.0 2549.2 2544.5 2539.5
733.0 737.2 733.0 726.4
1992-JAN. 6 13 20 27p
268.4 268.9 269.4 270.0
8.3 8.3 8.3 8.3
290.3 292.0 293.9 296.0
243.6 245.7 246.5 246.7
92.3 91.8 92.1 94.4
335.9 337.5 338.7 341.0
2538.5 2539.6 2541.5 2541.0
716.3 729.5 730.1 735.8
FE3. 5p 270.5 8.3 298.9 248.3 95.8 344.1 2544.8 730.3
1. Currency outside U.S. Treasury* Federal Reserve Banks and the vaults of depository institutions. 2. Outstanding amount of U.S. doliar-denominated travelers checks of nonbank issuers. Travelers checks issued by depository institutions are
included in demand deposits. 3. Demand deposits at commercial banks and foreion-related institutions other than those due to depository institutions, the U.S. government
and foreign banks and official institutions, less cash items in the process of collection and Federal Reserve float. 4. Consists of NON and ATS balances at commercial banks, U.S. branches and agencies of foreign banks, and Edge Act corporations. 5. Consists of NOH and ATS balances at thrifts, credit union share draft balances, and demand deposits at thrifts. 6. Sum of overniqht RPs and Eurodollars, money market fund balances (general purpose and broker/dealer), savings deposits (including
money market deposit accounts) and small time deposits. This sum is seasonally adjusted as a whole. 7. Sum of large time deposits, term RPs and Eurodollars of U.S. residents, money market fund balances (institution-only), less the estimated
amount of overniqht RPs and Eurodollars held by institution-only money market mutual funds. This sum is seasonally adjusted as a whole. e—indicates estimated data, p—indicates preliminary data.
Digitized for FRASER http://fraser.stlouisfed.org/ Federal Reserve Bank of St. Louis

H.6 (508) Table 4-continued
COMPONENTS OF MONEY STOCK, LIQUID ASSETS, AND DEBT B i l l i o n s of dol lars> seasonally adjusted
c
Savings deposits 1 Small-denomination time
At At commercial thrift
banks institutions
deposits2
Total
General purpose and broker/dealer money market funds
Institution-only money market funds
Large-denomination time
At At commercial thrift banks* institutions
deposits3
Date c
At sommercial
banks
At thrift
institutions Total
Small-denomination time
At At commercial thrift
banks institutions
deposits2
Total
General purpose and broker/dealer money market funds
Institution-only money market funds
Large-denomination time
At At commercial thrift banks* institutions Total
1990-SEP. 572.3 346.3 918.6 582.4 580.9 1163.3 341.8 124.1 384.9 130.1 515.1
OCT. NOV. DEC.
575.3 578.1 581.9
343.7 341.9 338.8
919.0 920.0 920.7
590.4 591.8 599.8
571.9 569.7 562.3
1162.3 1161.5 1162.1
344.6 345.2 348.9
127.8 128.8 133.7
383.8 384.5 380.4
128.0 125.1 120.9
511.8 509.6 501.3
1991-JAN. FEB. MAR.
583.6 590.2 596.8
338.4 340.5 344.6
922.0 930.7 941.4
603.4 608.8 611.8
558.6 553.0 546.1
1162.1 1161.7 1157.9
356.6 361.0 365.0
138.3 145.5 148.5
385.7 392.2 389.5
117.8 114.8 111.1
503.4 507.0 500.6
APR. MAY JUNE
602.5 609.3 617.0
350.2 356.5 359.5
952.7 965.8 976.5
609.1 607.4 609.4
541.8 534.7 522.6
1151.0 1142.1 1132.0
366.6 367.8 368.8
152.9 155.2 155.3
387.7 387.7 386.4
108.4 104.6 100.7
496.0 492.3 487.0
JULY AUG. SEP.
622.8 630.1 636.6
362.9 363.7 365.6
985.8 993.7 1002.2
611.3 615.0 614.7
511.8 499.3 491.3
1123.1 1114.3 1106.0
367.9 363.5 361.9
155.4 158.6 162.6
380.2 378.4 373.0
97.6 93.8 90.6
477.9 472.2 463.7
OCT. NOV. DEC.
645.7 655.4 664.9
369.3 373.3 377.7
1015.0 1028.7 1042.5
614.1 606.4 598.5
481.6 474.1 466.6
1095.6 1080.5 1065.1
361.7 361.4 361.5
168.2 173.6 179.1
362.6 357.1 354.0
87.4 85.1 83.1
450.0 442.2 437.1
1992-JAN. P 676.0 385.4 1061.4 587.6 457.3 1044.9 360.7 182.4 346.0 81.4 427.4
Meek ending
1991-DEC. 9 16 23 30
661.8 665.3 666.1 667.7
375.9 377.0 378.4 379.9
1037.8 1042.2 1044.5 1047.6
601.4 600.1 598.6 595.9
469.1 467.4 465.4 464.2
1070.5 1067.5 1064.0 1060.2
362.9 363.3 360.7 359.8
179.6 181.5 181.2 176.5
355.1 353.9 352.5 350.0
83.9 83.5 82.5 82.2
439.0 437.3 435.0 432.2
1992-JAN. 6 13 20 27p
669.1 674.1 677.0 679.4
381.4 383.3 385.3 387.9
1050.5 1057.4 1062.3 1067.3
593.2 590.3 587.7 583.9
463.0 459.7 456.5 454.2
1056.2 1050.0 1044.2 1038.0
356.1 358.7 360.5 364.0
165.2 182.3 185.4 188.3
348.5 345.8 345.8 345.8
82.3 81.8 81.2 81.0
430.8 427.6 427.0 426.8
FEB. 3p 682.2 390.5 1072.7 581.1 451.4 1032.5 365.2 191.8 343.5 80.4 423.9
1. 2. 3. 4.
P~
Savings deposits include money market deposit accounts. Small-denomination time deposits—including retail RPs—are those issued in amounts of less than $100,000. All IRA and Keogh account balances at commercial banks and thrifts are subtracted from small time deposits. Large-denomination time deposits are those issued in amounts of $100,000 or more, excluding those booked at international banking facilities. Large-denomination time deposits at commercial banks less those held by money market mutual funds* depository institutions* and foreign banks and" official institutions,
-indicates preliminary data.
Digitized for FRASER http://fraser.stlouisfed.org/ Federal Reserve Bank of St. Louis

H.6 (508) Table 4-continued
COMPONENTS OF MONEY STOCK, LIQUID ASSETS, AND DEBT Billions of dollars* seasonally adjusted
Non-M3 Components of L Debt components4
Date Savings bonds
Short-term Treasury securities1
Bankers acceptances2
Commercial paper3
Federal debt
Non-Federal debt
1990-SEP. 123.7 333.8 32.6 358.8 2433.4 8225.2
OCT. NOV. DEC.
124.5 125.2 126.0
330.6 330.6 333.0
32.9 33.8 34.0
357.7 355.2 359.3
2441.5 2470.9 2493.6
8255.0 8279.8 8297.3
1991-JAN. FEB. MAR.
126.9 127.9 129.0
331.5 331.1 326.8
35.3 34.6 32.1
361.2 354.9 351.6
2509.1 2537.5 2551.5
8312.0 8334.1 8354.1
APR. MAY JUNE
130.1 131.3 132.4
310.9 302.5 327.7
30.6 29.1 28.1
339.4 325.8 331.4
2547.4 2572.5 2606.7
8377.2 8402.0 8416.2
JULY AUG. SEP.
133.5 134.4 135.2
336.0 336.0 330.4
28.1 27.2 25.8
338.3 335.1 336.6
2633.2 2665.9 2693.5
8426.9 8441.0 8460.9
OCT. NOV. DEC. p
136.1 137.1 137.9
333.1 339.6 333.5
25.3 24.5 23.7
334.4 329.1 321.7
2724.0 2749.5 2766.9
8482.5 8508.0 8525.5
1. Consists of U.S. Treasury bills and coupons with remaining maturities of less than 12 months held by other than depository institutions* Federal Reserve Banks* money market mutual funds, and foreign entities.
2. Net of bankers acceptances held by accepting banks* Federal Reserve Banks* foreign official institutions* Federal Home Loan Banks* and money market mutual funds.
3. Total commercial paper less commercial paper held by money market mutual funds. 4. Debt data are on a monthly average basis* derived by averaging adjacent end-of-month levels* and have been adjusted to remove
discontinuities. p—indicates preliminary data.
Digitized for FRASER http://fraser.stlouisfed.org/ Federal Reserve Bank of St. Louis

H.6 (508) Table 5
COMPONENTS OF MONEY STOCK, LIQUID ASSETS, AND DEBT Billions of dollars* not seasonally adjustea
Currency * Travelers checks2
Demand deposits3
Other checkable deposits Nontransactions
components
Overnight RPs* Date Currency *
Travelers checks2
Demand deposits3
At commercial banks<
At thrift
institutions5 Total In M26 In M3 only*
Overnight RPs*
Overnight Eurodollars9
1990-SEP. 240.9 8.8 278.1 203.9 86.9 290.8 2501.4 788.8 64.6 16.6
OCT. NOV. DEC.
242.7 245.7 249.5
8.4 8.0 7.8
278.2 280.6 289.9
202.9 206.0 211.5
85.3 85.8 85.4
288.3 291.8 296.9
2508.0 2504.9 2501.1
783.5 787.4 779.3
66.0 60.5 55.0
17.7 17.4 19.7
1991-JAN. FEB. MAR.
249.8 252.6 255.6
7.8 7.8 7.8
277.4 268.0 270.1
213.6 211.5 215.8
84.2 83.4 85.8
297.7 294.9 301.6
2511.0 2526.9 2545.0
785.2 799.9 791.1
52.0 51.4 49.0
19.9 19.0 20.2
APR. MAY JUNE
256.0 257.4 259.1
7.5 7.8 8.1
277.7 271.7 279.8
222.6 217.2 222.0
89.2 87.6 89.0
311.8 304.8 311.0
2548.7 2538.0 2541.0
780.5 777.0 766.0
50.0 51.3 52.3
19.6 17.1 15.6
JULY AUG. SEP.
260.8 262.0 261.7
8.5 8.6 8.3
280.9 278.8 278.6
223.1 226.9 230.6
89.0 88.3 88.1
312.1 315.1 318.7
2541.4 2538.8 2533.0
754.7 757.7 746.4
51.0 52.8 51.8
13.8 14.5 14.6
OCT. NOV. DEC.
263.1 266.3 270.0
8.0 7.7 7.7
283.7 291.1 303.1
232.0 238.1 244.8
88.6 90.7 91.7
320.6 328.8 336.5
2540.1 2543.3 2538.1
737.0 735.5 729.9
53.0 53.3 52.5
16.3 19.5 22.5
1992-JAN. P 267.9 7.9 300.0 250.7 91.9 342.6 2541.0 725.8 55.2 21.9
Week ending
1991-DEC. 9 16 23 30
269.4 269.4 271.6 270.4
7.7 7.7 7.8 7.8
298.9 302.1 302.1 307.8
245.7 244.0 245.3 244.2
93.7 91.8 90.4 90.5
339.4 335.7 335.7 334.7
2547.2 2548.8 2533.0 2526.4
730.8 733.7 728.9 722.8
53.5 54.7 52.1 50.1
21.5 22.6 22.5 23.9
1992-JAN. 6 13 20 27p
269.7 268.5 268.0 266.5
7.8 7.8 7.9 7.9
315.3 303.9 296.5 290.3
255.5 254.3 251.3 245.3
94.9 93.1 91.1 89.0
350.4 347.3 342.4 334.3
2531.8 2543.1 2544.5 2541.3
703.7 728.6 729.1 734.7
53.5 53.7 55.8 56.0
25.1 21.9 21.2 20.2
FEB. 3p 267.1 7.9 295.2 247.3 91.6 338.9 2544.7 732.9 57.8 21.1
1. Currency outside U.S. Treasury* Federal Reserve Banks and the vaults of depository institutions. 2. Outstanding amount of U.S. dollar-denominated travelers checks of nonbank issuers. Travelers checks issued by depository institutions are
included in demand deposits. 3. Demand deposits at commercial banks and foreion-related institutions other than those due to depository institutions, the U.S. government
and foreign banks and official institutions, less cash items in the process of collection and Federal Reserve float. 4. Consists of NON and ATS balances at commercial banks, U.S. branches and agencies of foreign banks, and Edge Act corporations. 5. Consists of NON and ATS balances at thrifts, credit union share draft balances, and demand deposits at thrifts. 6. Sum of overnight RPs and Eurodollars, money market fund balances (general purpose and broker/dealer), savings deposits (including money market
deposit accounts) and small time deposits. 7. Sum of large time deposits, term RPs and Eurodollars of U.S. residents, money market fund balances (institution-only), less the estimated
amount of overnight RPs and Eurodollars held bv institution-only money market mutual funds. 8. Consists of overnight and continuing contract RPs issued by all depository institutions to other than depository institutions and money market
mutual funds (general purpose and broker/dealer). 9. Issued by foreign branches of U.S. banks worldwide to U.S. residents other than depository institutions and money market mutual funds
(general purpose and broker/dealer). e—indicates estimated data. p-~indicates preliminary data. Digitized for FRASER
http://fraser.stlouisfed.org/ Federal Reserve Bank of St. Louis

H.6 (508) Table 5-continued COMPONENTS OF MONEY STOCK, LIQUID ASSETS, AND DEBT Billions of dollars* not seasonally adjusted
Savings deposits 1 Small-denomination time
At At commercial thrift
banks institutions
deposits2
Total
General purpose and broker/dealer money market funds
Institution-only money market funds
Large-denomination time
At At commercial thrift banks* institutions
deposits3
Date
A* commercia
banks
At 1 thrift institutions Total
Small-denomination time
At At commercial thrift
banks institutions
deposits2
Total
General purpose and broker/dealer money market funds
Institution-only money market funds
Large-denomination time
At At commercial thrift banks* institutions Total
1990-SEP. 571.6 345.8 917.4 581.9 580.3 1162.2 340.7 120.2 386.6 130.7 517.3
OCT. NOV. DEC.
574.5 578.2 580.0
343.3 342.0 337.7
917.8 920.2 917.7
591.2 592.2 599.7
572.7 570.1 562.2
1163.9 1162.3 1161.9
342.6 344.5 346.8
124.2 128.4 134.4
384.2 384.6 379.4
128.1 125.2 120.6
512.3 509.8 500.0
1991-JAN. FEB. MAR.
580.8 587.1 598.0
336.7 338.7 345.3
917.5 925.8 943.4
605.1 610.4 612.2
560.2 554.4 546.4
1165.3 1164.8 1158.6
356.2 365.9 373.8
142.5 152.1 153.1
383.1 391.0 390.1
117.0 114.4 111.2
500.1 505.4 501.3
APR. MAY JUNE
604.6 609.1 619.7
351.4 356.4 361.1
956.0 965.5 980.8
608.6 605.7 607.4
541.4 533.2 520.8
1150.0 1138.9 1128.1
373.0 365.1 364.2
153.9 155.6 152.3
386.4 389.0 387.7
108.0 104.9 101.0
494.4 493.8 488.7
JULY AUG. SEP.
625.8 631.6 635.6
364.7 364.6 365.1
990.5 996.2 1000.8
611.2 614.5 614.3
511.7 499.0 491.0
1122.8 1113.5 1105.2
363.3 361.8 360.7
151.5 156.2 157.4
379.9 380.3 374.6
97.6 94.2 91.0
477.4 474.5 465.6
OCT. NOV. DEC.
644.6 655.3 662.3
368.7 373.2 376.3
1013.3 1028.5 1038.6
615.2 606.9 598.7
482.5 474.5 466.7
1097.6 1081.4 1065.4
359.8 360.6 359.1
163.4 172.7 180.3
362.8 356.9 352.8
87.4 85.1 82.8
450.2 441.9 435.5
1992-JAN. P 672.4 383.3 1055.6 589.4 458.7 1048.1 360.2 188.1 343.6 80.8 424.4
Heek ending
1991-DEC. 9 16 23 30
663.0 665.4 661.2 660.5
376.6 377.0 375.6 375.8
1039.6 1042.4 1036.7 1036.4
601.6 599.8 598.2 596.3
469.2 467.2 465.0 464.6
1070.8 1066.9 1063.2 1060.9
361.8 362.2 358.5 355.1
179.8 183.6 182.8 178.0
354.0 352.6 350.7 348.6
83.7 83.2 82.1 81.9
437.7 435.8 432.8 430.5
1992-JAN. 6 13 20 27p
667.0 673.2 673.6 672.8
380.2 382.9 383.4 384.1
1047.2 1056.1 1057.0 1056.8
595.0 592.4 589.6 585.4
464.4 461.3 457.9 455.4
1059.4 1053.7 1047.5 1040.8
346.7 357.7 362.9 367.5
162.1 189.0 193.8 197.2
346.5 343.8 343.2 343.0
81.8 81.4 80.6 80.3
428.3 425.2 423.9 423.3
FEB. 3p 675.9 387.0 1062.9 582.7 452.8 1035.5 367.4 199.3 340.7 79.7 420.4
1. 2. 3. 4.
p-
Savings deposits include money market deposit accounts. Small-denomination time deposits—including: retail RPs—are those issued in amounts of less than $100,000 commercial banks and thrifts are subtracted from small time deposits. Large-denomination time deposits are those issued in amounts of $100>000 or more, excluding Large-denomination time deposits at commercial banks less those held by money market mutual official institutions,
-indicates preliminary data.
All IRA and Keogh account balances at
those booked at international banking facilities, funds, depository institutions, and foreign banks and
Digitized for FRASER http://fraser.stlouisfed.org/ Federal Reserve Bank of St. Louis

H.6 (508) Table 5-continued
COMPONENTS OF MONEY STOCK, LIQUID ASSETS, AND DEBT Billions of dollars* not seasonally adjusted
c
Term RPs1
Term Eurodollars2
Non-M3 Components of L Debt components6
Date c
A* ommercial
banks
At thrift
institutions Total Term
Eurodollars2 Savings bonds
Short-term Treasury securities3
Bankers 1 acceptances4
Commercial paper5
Federal debt
Non-Federal debt
1990-SEP. 53.0 46.2 99.1 67.7 123.5 334.6 32.3 356.8 2411.8 8199.2
OCT. NOV. DEC.
51.3 53.1 48.1
44.3 42.5 41.5
95.6 95.6 89.6
67.8 67.5 68.7
124.2 125.0 125.8
334.8 339.9 345.4
32.8 34.6 35.7
353.0 350.3 355.1
2424.4 2461.5 2491.3
8235.4 8261.2 8286.9
1991-JAN. FEB. MAR.
48.4 48.5 48.1
40.3 38.2 35.4
88.7 86.7 83.5
69.2 69.8 68.2
126.8 127.9 129.1
340.7 332.6 327.8
36.1 34.3 31.5
365.5 358.0 352.6
2510.8 2540.7 2553.4
8298.5 8301.3 8315.2
APR. MAY JUNE
49.1 48.3 49.1
33.1 32.1 29.3
82.2 80.4 78.4
65.2 62.3 61.6
130.4 131.6 132.7
306.3 295.1 316.4
30.1 28.7 27.8
342.4 331.8 333.2
2544.5 2560.6 2586.4
8339.9 8367.5 8386.8
JULY AUG. SEP.
49.6 48.9 48.1
29.2 29.4 28.6
78.8 78.4 76.7
62.7 63.6 61.5
133.6 134.3 135.0
327.3 330.4 331.5
27.9 27.2 25.5
337.4 331.9 334.7
2609.3 2642.9 2673.1
8400.6 8413.9 8436.7
OCT. NOV. DEC.
48.7 47.4 46.0
27.0 26.4 25.1
75.6 73.8 71.2
63.0 62.3 58.5
135.9 136.8 137.7 p
337.3 349.0 346.6 p
25.1 25.2 25.0 p
329.8 325.0 318.0 p
2707.6 2740.7 2765.0 p
8465.1 8491.9 8515.9 p
1992-JAN. P 46.6 24.5 71.1 57.3
Heek ending
1991-DEC. 9 16 23 30
45.0 45.9 45.7 46.7
26.9 26.4 24.4 23.1
71.9 72.4 70.1 69.8
56.6 58.0 58.8 60.0
1992-JAN. 6 13 20 27p
46.0 47.5 46.7 46.4
23.7 24.7 24.6 24.9
69.7 72.2 71.3 71.3
57.8 57.4 55.8 57.8
FEB. 3p 46.5 24.4 70.9 58.3
1. Term RPs are those with original maturities greater than one day, excluding continuing contracts and retail RPs. 2. Term Eurodollars are those with original maturities greater than one day. Consists of those issued to U.S. residents by foreign branches of
U.S. banks world-wide and by all banking offices in the United Kingdom and Canada. Excludes those held by depository institutions and money market mutual funds.
3. Consists of U.S. Treasury bills and coupons with remaining maturities of less than 12 months held by other than depository institutions, Federal Reserve Banks, money market mutual funds, and foreign entities.
4. Net of bankers acceptances held by accepting banks, Federal Reserve Banks, foreign official institutions, Federal Home Loan Banks, and money market mutual funds.
5. Total commercial paper less commercial paper held by money market mutual funds. 6. Debt data are on a monthly average basis, derived by averaging adjacent end-of-month levels, and have been adjusted to remove discontinuities, p—indicates preliminary data.
Digitized for FRASER http://fraser.stlouisfed.org/ Federal Reserve Bank of St. Louis

H.6 (508) Table 6
MEMORANDUM ITEMS Billions of dollars, not seasonally adjusted 10
c
Demand deposits at banks due to
Time and savinas deposits due to foreian^banks and official institutions
U.S. government depos ;its IRA and Keogh Accounts
Date c Foreign commercial banks
Foreign official
institutions
Time and savinas deposits due to foreian^banks and official institutions
Demand deposits at commercial
banks
Balance at
Federal Reserve
Note balances at depository institutions
Total cash balance
Time and savings
deposits at commercial
banks
At commercia
banks
At 1 thrift
institutions
At money markei funds
Total
1990-SEP. 9.7 2.0 3.5 5.2 6.4 25.9 37.5 1.2 124.4 134.1 39.4 297.9
OCT. NOV. DEC.
9.3 9.2 9.0
1.6 1.5 1.5
4.0 3.9 4.1
3.5 3.8 5.0
5.5 5.6 5.2
17.5 15.4 18.1
26.4 24.8 28.2
1.4 1.4 1.4
126.8 128.6 130.3
133.9 133.8 133.4
40.5 41.8 43.3
301.2 304.2 307.0
1991-JAN. FEB. MAR.
9.3 8.2 8.0
1.6 1.6 1.6
4.5 5.1 5.7
4.9 4.2 5.1
7.8 11.5 6.8
24.5 35.1 23.3
37.2 50.8 35.1
1.3 1.3 1.3
132.1 133.6 135.3
133.5 134.0 134.5
43.5 43.5 44.0
309.1 311.1 313.8
APR. MAY JUNE
8.5 8.2 7.6
1.5 1.5 1.5
6.0 6.2 6.3
5.4 3.6 5.0
4.7 5.6 6.3
15.0 16.2 18.6
25.1 25.4 29.9
1.3 1.4 1.5
137.6 138.9 140.3
135.2 135.5 135.4
44.3 44.9 43.9
317.1 319.3 319.6
JULY AUG. SEP.
8.0 7.9 7.8
1.5 1.5 1.5
6.3 6.5 6.6
3.7 3.6 5.2
6.6 5.8 7.8
17.1 13.5 21.7
27.3 22.9 34.7
1.6 1.5 1.5
141.8 143.1 144.4
134.6 133.2 131.6
42.2 41.7 41.3
e 0
318.5 318.0 e 317.3 e
OCT. NOV. DEC.
7.7 7.9 8.1
1.5 1.5 1.7
6.7 6.7 6.6
3.6 4.4 4.8
5.7 6.0 7.4
25.0 24.2 20.5
34.4 34.6 32.8
1.5 1.6 1.5
145.9 147.0 147.7
130.7 129.8 129.0
• e e
41.0 41.1 41.3
0 e e
317.6 Q 317.9 e 318.1 e
1992-JAN. P 8.3 1.7 6.6 5.4 7.4 27.9 40.7 1.8 148.3 128.7 e 41.5 e 318.4 e
Week ending
1991-DEC. 9 16 23 30
7.7 8.4 8.0 8.3
1.7 1.7 1.6 1.9
6.7 6.7 6.6 6.6
3.4 7.2 4.4 4.1
5.2 4.7 9.2
10.8
10.3 6.5
30.9 33.5
19.0 18.4 44.5 48.3
1.5 1.5 1.5 1.5
1992-JAN. 6 13 20 27p
8.5 8.0 8.3 8.5
2.3 1.5 1.6 1.7
6.6 6.6 6.6 6.6
6.2 4.0 6.1 5.2
9.4 5.5 5.9 8.1
27.3 20.5 25.2 34.5
42.9 30.1 37.2 47.8
1.5 1.9 1.9 1.9
FEB. 3p 7.9 1.6 6.6 5.3 9.2 35.3 49.9 1.9
e—indicates estimated data, p—indicates preliminary data.
Digitized for FRASER http://fraser.stlouisfed.org/ Federal Reserve Bank of St. Louis

CL
rt
en
CD
0
CD
tJ
rt
p>
0 (B
CO
CO
H
-»
O
H-
P
rt
0 (A
CO
f
t H
* 13
* h
-PJ
(D
V
$ rt
K
P>
0
O
CL
0 P
*La
. a
CD
p
3 o
co
CD
**
rt
H
P>
CD
0
cr
CL
H
-H
-*
P>
(D
O
H-*
rt
C
L
pr
cr CD
(I>
P
>d
H
P
0
** CO
O
CO
H
- cr
•
rt
(D
CO
O
- **
P>
to
D
* (D
H
-»
P>
CD
CO
0 C
L
P
CD
P>
>d
>-
» o
»
-*
CO
Vj
H-
rt
(D
CO
CL
C
-u
Qj
P
rt
CO
rt
rt
CD
pr
0.
H
w
p.
Hi
p>
ft
p
w
CL to
CO
H
CD
CD
P>
co
o
-0
CD
p
H
CD
H
-i
- <
h-»
(D
v-
q.
a> o
> C
L C
O
c_
i.
P
rt
w
pr
rt
CD
CD
a.
CL
H
-0
Hi
ft
H»
sr
CD
CD
H
H
CD
P
0 O
P
* CD
CD
o
or
?
r CD
Co
rt
cr
s
H*
CD
CD
CD
P
I-*
H*
•^
I vo
V
O
VO
vo
VO
V
O
co
1 N
3 1 1
s *
j 1
d2
0M
>L
:L
, S
J?
S
*i
1
OZ
Ot
fl
>C
;L
;S
>S
^C
H
pi
CD §
CD
0 O
CD
P
P
P
CD
>0
P>
CD
P
CD
O
o
CD p
p
g
P
^d
P
CD
co
H
cr
§
O
< rt
^d
09
h-
» P
<<
H
H
cr
p
O
< rt
T3
00
h-»
P
vj
H
H
cr
p
i •
rt
• *<
CD
rt
*<
CD
n
o
o
O
h-»
K-*
O
O
i-
» »-»
H*
M
O
O
o
O
»-» >
-» o
O
»-*
H*
h-»
l-
» o
O
o
o
urr
vo
VO
V
O
O
o
VO
V
O
O
O
O
O
vo
VO
vo
vo
o
o
V
O
vo o
o
o
o
VO
V
O
VO
^
H*
urr
vo
vo
VO
O
o
V
O
vo
O
o
O
O
V
O
VO
vo
V
O
f-»
o
vo
vo o
o
o
o
vo
V
O
VO
vo
!
CD
<* t
o
J>
CO
o
L
n
^ h
o
ON
4>
L
0 V
O
VI
N3
4>
o
H-»
C
O
Cn
to
O
N
Cn t
o
CO
C
O
to
w
P
vl
co V
O
VO
•p
* H
* O
t
o
VJ
O
ON
L
O
O
4> C
O
H-»
h-
» vo
O
N
ON
o
oo
vo
V
O
CO
»-»
H*
{ o <
o
O
o
o
o
h-»
»-»
H->
l-
» H
* O
O
O
O
o
o
O
o
o
O
o
o
p-
H
Z
Pi
O
\D
vo
vo
VO
vo
O
O
H
-»
o
O
VO
V
O
VO
V
O
VO
vo
VO
o
O
h-
» o
o
vo
V
O
vo
vo
VO
a>
<
p
ON
O
N
Cn
4>
ON
O
O
N
O
VO
N>
O
N
Ln
O
N
ON
Ln
J>
ON
o
O
N
o
vo t
O
ON
C
n
ON
O
N
•>
ro
o
CD
cr
CO
to
L
0 to
H
-»
CO
j-
» L
n
tO
VI
00
4>
LO
N
> Y
-L
t-»
O
vl
H*
ON
J>
CO
V
O
4> t
o
O
VO
?r
CD
5
N> C
n
O
CO
O
N
)-»
-p*
vl
VI
Ln
V
O
Ln
O
h
-1 vo
vo
»v
j O
N
ON
V
I co
O
V
O
Cn
Ln
oo
co
'A
CD
5
H
?r
CO
CL
O
O
H*
H*
H-k
O
O
O
h
-*
O
O
H»
O
O
f-*
H»
H»
o
O
o
H-»
o
o
H*
O
o
H*
CD
a CD
1
VO
VO
O
O
o
vo
vo
vo
o
V
O
VO
O
V
O
VO
o
O
O
V
O
VO
V
O
O
VO
V
O
O
VO
vo
o
0
3 1
^ V
I to
4>
l-»
vo
vo
vo
o
V
O
vl
O
VI
vl
N>
-P*
H*
vo V
O
VO
O
vo
v
l O
v
l v
l to
C
O
M
P>
Cn
M
H*
•vl
to
V
O
to
Cn
Ln
C
O
Ln
L
/i
Ln h
-»
O
ON
to
V
O
N>
Cn
C
n
VO
C
n
Cn
C
n
h-»
O
1 H
-^
4>
N> L
0 h-
» J
> .p
- 0
0 .p
* C
O
CO
v
l L
O
Ln 4
> V
O
vo
H*
VO
oo
to
O
N
>-»
VI
vj
CO
•P
* C
n
ft
CO
CL
1 M O
j-
u H
» O
O
O
O
O
O
O
M
H
» O
H
* H
* o
o
o
o
O
O
O
H*
H-»
O
H
* O
rt
p
* |
o
vo
O
O
VO
V
O
VO
V
O
vo
VO
V
O
O
O
VO
O
O
V
O
VO
V
O
VO
vo
vo
vo
O
O
V
O
o
o
CD
o
vo
M
O
VO
C
O
VO
V
O
vo
VO
V
O
LO
O
V
O
t-*
H-*
V
O
00
VO
V
O
VO
V
O
VO
C
O
O
VO
>-*
J>
rt
" O
H
* o
O
V
O
vl
vl
£*
LO
•P
-C
O
O
O
f-»
H-*
o
o
v
l 0
0 4>
CO
C
n
00
O
O
H-»
H
* o
1
Pi
?r
4> V
O
H*
VO
to
V
O
.p*
N5
vo
-P-
ON
V
O
LO
H
-»
CO
o
to
H
» to
o
O
O
O
N
VO
h
->
CO
C
n
;
Pi
Other able de
H*
o
M
h-»
O
0
06
O
O
O
H*
K-*
O
H
* H
-»
O
O
o
o
O
o
o H
* H
» O
M
rt
fa
|
° V
O
O
O
VO
V
O
VO
V
O
VO
V
O
VO
O
O
V
O
O
o
VO
V
O
VO
V
O
vo V
O
VO
o
O
V
O
o
cr ^
1 CO
o
vo
M
J-»
VO
C
O
VO
C
O
CO
V
O
00
L0
O
VO
1-
^ M
vo
00
vo o
o
00
VO
C
O
CO
O
V
O
H*
Cn
P>
H
-I
Ln v
o V
O
10
Ln L
n
ho
C
O
VI
L0
0\
LO
Ln
VO
V
O
CO
Ln
Cn
ro
C
O
VI
CO
O
N
CO
C
n V
O
vo
P
rt
-P*
tO
Vl
H-*
4>
4>
to
£
* L
n
Ln
Ln
L
n
4>
CO
V
I to
4>
Cn
o
-p
* v
l C
O
ON
4>
CO
-P
* V
|
ks 1 in
i 1 s 1 Nontr
1 O
O
O
V
O
O
O
vo
O O
vo
vo
o
O
O
O
vo
O
O
V
O
o
O
vo
vo
O
O
o
O
o
\ ft
!
1 o
O
o
VO
O
O
V
O
O
O
vo
vo.
o
O
O
o
vo O
O
vo
o
O
vo
vo
O
O
o
O
1
s P
1
<•*>
O
o
vl
O
O
CO
O
O
0
0 v
l tvo
C
O
O
o
vl
O
O
00
o
O
00
vl
to
CO
o
o
to
CO
1 *"
Cn o
C
O
to
Ln
0
0 O
N
LO
to
O
4
* Ln
o\
H*
vo
CO
C
O
VI
ON
C
O
to
O
Co •
P-
VI
co
actions com
1 ̂* H
* o
o
O
O
O
)-
* O
H
* h
* O
H
» H
-» o
o
o
O
o
P
actions com
° O
V
O
vo
vo V
O
VO
O
V
O
o
O
VO
O
O
V
O
vo
vo
VO
o
o
V
O o
o
VO
O
o
vo
PS
actions com
° O
V
O
VO
V
O
VO
V
O
O
VO
o
O
V
O
O
O
VO
vo
vo
V
O
o
o
VO
o
o
VO
O
o
vo
V
I C
O P
O
N
10
o\
Ln C
O
LO
vo
Ln
V
I H
* 4
> 0
0 O
N
CO
O
N
Cn
CO
C
O
o
Cn v
l M
4>
VI
Cn
to
Cn
b
0
0 L vo
co
O
S
to
H-*
L
n
to
H*
CO
oo
ro
C
O
h-»
H-»
V
I O
N
VO
H
» to
Cn
vl
CO
v
l C
n
H*
V|
onlv _ 1
i nents 1
Digitized for FRASER http://fraser.stlouisfed.org/ Federal Reserve Bank of St. Louis

Appendix Table 2 Monthly Seasonal Factors for Selected Components of the Monetary Aggregates
| 1 I Deposits
| Small 1 Large Savings denomi | denomi Money market | and
1 MMDAs nation time
nation 1 time
1 mutual funds | and 1 MMDAs
nation time
nation 1 time in M2 [in M3 only)
' 1 2 1 3- 4 1 1 L
1991--Jan. | 0.9952 1.0028 | 0.9934 0.9989 | 1.0303 | Feb. ! 0.9947 1.0026 | 0.9969 1.0136 | 1.0453 | Mar. 1.0021 1.0006 1.0014 1.0242 ! 1.0310 | Apr. 1.0035 0.9992 0.9967 1.0175 | 1.0066 | May 0.9996 0.9972 1.0031 0.9925 ! 1.0027 | June 1.0044 0.9966 1.0034 0.9874 0.9805 j July 1.0048 0.9998 i 0.9991 0.9876 0.9749 j Aug. | 1.0024 0.9993 1.0048 0.9954 0.9848 j Sept. 0.9985 0.9993 1.0042 0.9965 0.9679 j Oct. 0.9983 1.0018 1.0005 0.9947 0.9719 j Nov. 0.9998 1.0008 0.9993 0.9976 0.9946 j Dec. 0.9962 1.0003 0.9965 0.9933 1.0064 j
1992--Jan. 0.9946 1.0031 0.9930 0.9988 1.0308 | Feb. 0.9946 1.0025 0.9968 1.0139 1.0461 j Mar. 1.0023 1.0004 1.0014 1.0249 1.0327 j Apr. 1.0040 0.9990 0.9968 1.0178 1.0087 j May 1.0000 0.9969 1.0038 0.9923 1.0037 j June 1.0047 0.9963 1.0042 0.9877 0.9800 j July 1.0050 0.9996 0.9994 0.9874 0.9735 j Aug. 1.0026 0.9993 1.0051 0.9952 0.9846 j Sept. 0.9986 0.9994 1.0038 : 0.9967 0.9668 | Oct. 0.9983 1.0019 1.0001 I 0.9952 0.9716 j Nov. 0.9995 1.0010 0.9987 | 0.9969 0.9935 j Dec. 0.9958 ; 1.0006 ; 0.9964 0.9927 1.0064 j
1993--Jan. 0.9942 | 1.0031 j 0.9929 0.9989 ! 1.0306 | Feb. | 0.9946 | 1.0025 | 0.9970 1.0141 | 1.0473 j Mar. 1.0024 1.0005 1.0016 1.0251 1.0341 j
1. These seasonal factors are applied to deposits data at both commercial banks and thrift institutions.
Digitized for FRASER http://fraser.stlouisfed.org/ Federal Reserve Bank of St. Louis

Appendix Table 3 Weekly Seasonal Factors Used to Construct Ml, M2 and M3
| Nonbank | Other 1
I Currency travelers
1 checks | Demand 1 deposits
[ checkable deposits j Nontransactions components 1 Week ending . I Currency
travelers 1 checks
| Demand 1 deposits 1 total | at banks 1 in M2 1 in M3 only 1
1 1 1 2 1 3 1 4 1 5 I 6. 1 7 |
1991--Dec. 2 | 1.0037 0.9402 f 1.0316 0.9990 | 0.9925 | 0.9972 | 1.0025 | 9 t 1.0095 | 0.9399 | 1.0331 | 1.0218 | 1.0165 | 1.0008 | 0.9970 j 16 | 1.0080 0.9412 | 1.0445 | 1.0084 1.0070 0.9999 0.9952 j 23 i 1.0165 I 0.9425 ! 1.0420 ! 1.0063 1.0137 0.9955 ! 0.9944 j 30 I 1.0092 | 0.9438 ! 1.0633 ! 1.0022 1.0161 0.9948 I 0.9952 |
1992--Jan. 6 ! 1.0048 0.9460 1.0863 1.0432 1:0487 0.9974 0.9824 | 13 0.9986 ! 0.9492 1.0410 1.0292 1.0349 1.0014 0.9988 j 20 0.9951 0.9524 1.0089 1.0111 1.0192 1.0012 0.9986 j 27 0.9871 0.9555 0.9807 0.9804 0.9946 1.0001 0.9984 j
Feb. 3 0.9877 0.9587 0.9877 0.9849 0.9958 1.0000 1.0035 | 10 0.9962 0.9603 0.9829 1.0015 1.0075 1.0006 1.0065 | 17 0.9945 0.9619 0.9760 0.9891 0.9979 1.0004 1.0008 j 24 0.9897 0.9635 0.9542 0.9826 0.9912 1.0005 1.0002 |
Mar. 2 0.9898 0.9651 0.9623 0.9911 0.9945 1.0012 1.0055 | 9 1.0010 0.9644 0.9795 1.0123 1.0119 1.0023 1.0052 j 16 0.9982 0.9634 0.9773 1.0006 1.0051 1.0038 1.0058 | 23 0.9968 0.9624 0.9627 0.9942 0.9997 1.0034 1.0067 j 30 0.9949 0.9614 0.9753 0.9954 1.0032 1.0045 1.0083 j
Apr. 6 1.0031 0.9596 1.0171 1.0336 1.0319 1.0074 1.0008 | 13 1.0035 0.9567 1.0211 1.0446 | 1.0471 ' 1.0076 0.9975 | 20 1.0006 0.9537 1.0169 ! 1.0498 | 1.0560 1.0010 0.9971 j 27 0.9950 ! 0.9508 | 0.9797 j 1.0105 1.0098 | 0.9973 0.9959 j
May 4 1.0001 0.9496 ! 0.9849 | 1.0019 | 1.0038 ] 0.9959 1.0023 | 11 1.0057 | 0.9587 | 0.9757 1.0023 0.9936 0.9960 1.0047 j 18 ! 1.0026 0.9678 | 0.9854 0.9884 0.9809 j 0.9976 ! 1.0011 j 25 i 1.0024 0.9768 0.9550 0.9818 0.9763 | 0.9975 1.0060 j
1. Seasonally adjusted other checkable deposits at thrifts are derived as the difference between total other checkable deposits, seasonally adjusted, and seasonally adjusted other checkable deposits at commercial banks.
Digitized for FRASER http://fraser.stlouisfed.org/ Federal Reserve Bank of St. Louis
CO
a •
s CM
IS 4-> o
o
O
0 w
H
P
> 10
co
a o
« o
rH
^
o
sd -P
H
^ •H w
0) (0
a
M
A
O
< -P
o
cd
cd
o
CO
<a a)
CO
CD
jj H
r-ij
^ tN
f
S
CO
V
O
en ^
\o
ON
co
O
N rs
C
M
CM
m
r
s r
H
rH
C
M
O
ON
O
N
<f
ON co
vo
I
§ R
O
N
en
V
O
CJN
vO
V
O
rH
<t O
N
is m
vo
m
CM
O
O
O
N
ON
m
vo o
o
C
O O
N VO
«<t I
a 01
o
o
o
ON a
\ O
N
ON
O
N
ON
o
o
o
o
o
O
O
ON
O
N
ON
O
N
ON
O
N
ON
ON
ON
ON
1
mpo
CO
N
o
o
o
O
N O
N
ON
O
N
ON
O
N
o
o
o o
o
O
O
O
N
ON
O
N O
N
ON
O
N
ON
O
N
ON
O
N
1 C
CD
CD
CD
rH
mpo
CO
N
»
H
r-H
i-H
O
O
O
O
O
O
rH
rH
rH
rH
rH
rH
r
H
O
O
O
O
O
O
do
do
C
CD
CD
CD
rH
o
&
rQ
el H
•H
•P
cd
CD
^ CO
rQ
O
H
CD
Q
CD
X
I Q
CD
X
I
H
O
O
-P
a u
CD
U
cd
CO
C
OH
H4
o
ov is rs
O
m
O
rH
VO
NO
O\
st
IS
>t
rH
0
0 r
H
VO
^
O
U
CD
co CM
] is
O
N
ON
rs is
00
rH
O
ON
rH
rH
rH
O
O
N
DO
NN
O
N
rH
rH
ON
O
O
r
H
rH
CD
X
a 2q
O
N
ON
O
N
ON
O
N
ON
O
O
O
N
O
O
O
O
ON
O
N
O
ON
O
N
ON
O
O
O
N
O
O
O
O
<4H
P
cd
vO
i O
N
ON
O
N
ON
O
N
ON
**m
» W
C
7N
o
o
o
o
ON
O
N
O
ON
O
N
ON
O
O
O
N
o
o
o
o
U-l
O
u
-p •H
•0
T3
u
-p o
o
o
o
o
O
rH
rH
O
r
H
rH
rH
rH
O
O
r
H
O
O
O
rH
rH
O
rH
rH
rH
rH
•H
•0
T3
a CD
o
CD
-P
z X
I CO
P
3
1-J
CO T
J cd cd
H
(0
in X
VO
C
M
U0
<T
* O
N
O
CO
O
O
O
N m
C
M co co
IS
O
N
rH
O
N
oo oo
rs <f
ON
rs ^
uo
•d 5
* +>
C
co
m
ON
in
vo
vt
N in
H
IS
V
O
rH
CM
O
oo
in oo
en
<f
CO
V
O
CM
O
N
rH
V
O
O
CD
rH
•H
cd ^ 0
0 O
O
N
CO
0
0 o
O
N co
rs
00
ON
O
N
00
CO
o
o
oo
is O
N
ON
oo
rs rs
o
ON
O
N
> rH
co o
o
Xi
ON
O
O
N
ON
O
N
O
ON
O
N
ON
O
N
ON
O
N
ON
O
N
O
O
ON
O
N
ON
O
N
ON
ON
O
N
O
ON
O
N
•H cd
u
a
CD
0
co o
o \ **
O
rH
O
O
O
rH
O
O
O
o
o
o
o
o
rH
r
H
O
O
O
O
O
O
O
rH
O
O
•H cd
u
a
CD
0 J-I
a) cd
*d co
CD
"O
cd
4J
fl) C
D
CD
U
CO
4
J fl)
CD
C
D
U
CO
O
rH
cd
rO
T3
cd f—
i co
rs
<t
CM
rs O
N rH
en
m
co
oo m
<f m
00
O
VO
C
O
CM
is
O
N V
O
*H m
en
o
co C
r
* cd
ON
C
M r^
co
o
ON
vo
en vo
in
rs
sf
CM
*H
rH
O
N
rH
rH
in vo
O
N.co
CM m
oo
en
P
cd
o
4-4 <f rs
T
H
O
ON
co
o o
O
N is
ON
o
ON
oo oo
rH
O
O
N
is
ON
O
N oo
rs 0
0 O
O
N
ON
<
p
a) 1 +•> 1
ON
O
O
O
N
ON
O
O
O
N
ON
O
N
O
ON
O
N
ON
O
O
O
N
ON
O
N O
N
ON
O
N
ON
O
O
N
ON
1
u *d
X
, CD
a) 1 +•> 1
O
rH
r
H
O
O
rH
rH
O
O
O
rH
O
O
O
rH
r
H
O
O
o
o o
o
O
rH
O
O
1
u *d
X
, CD
p
-p
CO
_Li
r* •p
p
Cd -r-> •o
CO
co cd
•d
-P
C
O
CO
<
fr C
O
<f
o
m <t
o
in o
o e
n co
O
N
vo e
n
CM
O
N
O
CO
C
O
O
CM
oo
en
m
P
d
-H
«<f
<r- co
rs
CM
m
o
CM
rs O
N
VO
C
O
rH
rH
CO
^ O
l^
VO
«sf
00
rH
r
H
rH
C
O
00
*H
>>
cd co
co
00
O
rH
0
0 0
0 co
CM
o
rs O
N
O
O
00
00
O
rH
C
O
VO
rH
O
N
O
CO
O
r
H
rH
O
N
CO
rH
E
0 <D
Q
ON
O
O
O
N
ON
o
o
o
O
N
ON
O
O
O
N
ON
O
O
O
N
ON
O
O
N
O
ON
O
O
O
O
N
0 rH
a
, cd
CD
C
E
0 <D
Q
O
rH
r
H
O
O
rH
rH
rH
O
O
rH
rH
O
O
rH
rH
O
O
rH
O
rH
O
T
H rH
rH
O
0 rH
a
, cd
CD
C
13
•o
o CO
f CD
cd
r
H
CD
CO
•Q
C
O
^ u
(
cd £
CD co
0
0 rH
|
s r
H
<t
rs in
<
f C
M
rH is
<$• o
r̂
CM m
rs
o
rH
rH
rH
CM
C
M
VO
rH
\
0 M
*
cd
H ^
lO
rH
00
VO
C
O
CO
H
^
IS
OC
O
N
H<
f <*- o
vo
co
o
ON
oo
rs \o
m
m
st o
co
^ Q
} O
C
M
oo
o
rH
co
m
VO
C
O
ON
O
C
M
rH
O
O
O
N
oo rs m
<fr C
O
rH
O
ON
co
rs \o
m
CD
P
• C
I >
CD
ON
O
O
O
O
O
O
O
r
H
rH
rH
rH
rH
O
o
o
o
o
O
O
O
O
N
ON
O
N
ON
O
N
X
"H
CO
o
c
d^
P
a co
^
o
c u
a
cd
o
cd
^
P
O
O
O
O
a co
^
o
c u
a
cd
o
cd
^
P
O
O
O
O
a co
^
o
c u
a
cd
CD
CD
X
JM
*0
P
rH
> 0
CD
cd
1 o
en
N en
co
o
co cn
ON st
rH
CO
C
M
CM
<
f rs vo
CM vo
C
O
CM
C
O
O
ON
0
0 O
O
N
rH
-H
i c
CO
M
O
CO
C
N
<t
rH m
o
r
H
00
CM
0
0 C
O
rH is en
oo
m
CO ^
f rH
r
H
CM
O
0
0 T
3 X
0
o
ON
O
O
O
O
rH
rH
O
O
O
O
O
O
N
ON
O
O
N
ON
0
0 O
N
ON
O
N
ON
O
N
O
O
ON
CD
cd
M
urr
rH
ON
O
O
O
O
O
O
O
O
O
O
O
O
N
ON
O
O
N
ON
O
N
ON
O
N
ON
O
N
ON
O
O
O
N
P
^5
CD
CO
O
E
3 CD
E
urr
rH
O
O
O
o
o o
o
O
r
H
rH
O
P
^5
CD
CO
O
E
3 CD
E
o
-^
)XJ
0 •d
o
a
cd 1
H
4J
>> o
cd
r
H
X
60
TH
co m
C
M
ON
vo
co
o
rs
CO
ON
^H
ts
<f
rH
00
m
CM
O
N vo
C
M
ON v
o e
n
rH
«P
CO
q
rH
C
M
CM
r
H
CM
C
M
rH
r
H
CM
C
O
rH
CM
C
M
rH
r
H
CM
rH
CM
<d
o
P
!
*H
CD
>N
•
• •
• a
-H
!
TJ
rH
6©
C
H
P
> 0
rH
CO
£ 2
3 3
CD
o
o
I CO
Cd
0
o
1 *->
< CO
o
2
5 Cd
P
0,
CD
0 CD
•* 1
CO
P
*0 CD
C
M
i CD
O
N
> O
N
•
Digitized for FRASER http://fraser.stlouisfed.org/ Federal Reserve Bank of St. Louis

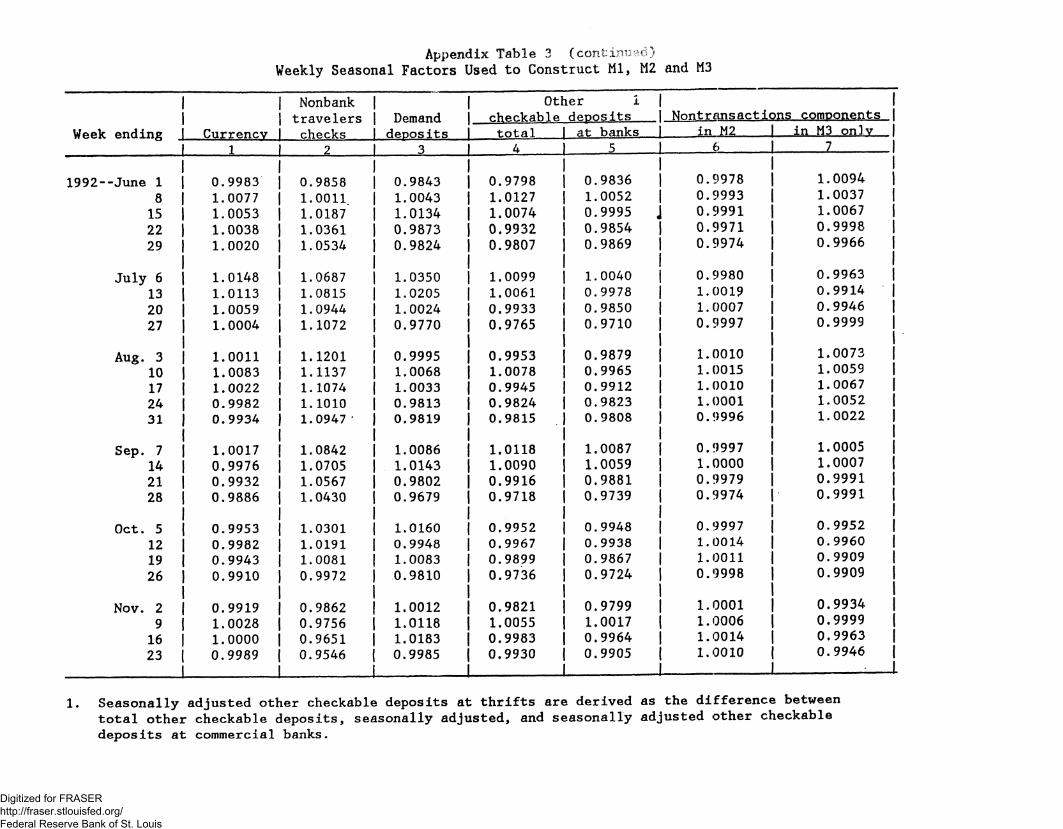
Appendix Table 3 (continued) Weekly Seasonal Factors Used to Construct Ml, M2 and M3
| Nonbank | Other 1
Currency j travelers [ checks
| Demand [ deposits
j checkable deposits I Nontransactions components I Week ending . Currency
j travelers [ checks
| Demand [ deposits | total | at banks 1 iiUiZ [ in M3 onlv j
1 1 1 2 1 3 1 4 | 5 | <5 | I j 1992--Nov.30 1 1.0007 | 0.9441 | 1.0188 | 0.9921 | 0.9934 I 0.9978 | 1.0033 j
Dec. 7 1 1.0072 0.9404. | 1.0352 I 1.0179 | 1.0157 I 1.0000 | 0.9949 | 14 1 1.0069 1 0.9418 1.0452 | 1.0107 | 1.0135 1 1.0001 0.9960 j 21 1.0120 | 0.9432 | 1.0480 i 1.0104 i 1.0125 0.9969 | 0.9911 j 28 1.0142 ! 0.9445 | 1.0460 ; 1.0012 1 1.0116 0.9941 ! 1.0002 |
1993--Jan. 4 1.0047 0.9462 | 1.1008 1.0225 1.0245 0.9982 | 0.9963 | ii 1.0007 0.9494 1.0510 1.0290 1.0320 1.0017 i 0.9904 j 18 0.9945 0.9525 1.0218 1.0151 1.0251 1.0007 ! 0.9957 j 25 0.9889 0.9557 0.9810 0.9965 1.0097 0.9995 0.9977 j
Feb. 1 0.9864 0.9589 0.9767 0.9866 1.0000 0.9990 1.0024 | 8 0.9941 0.9607 0.9816 1.0005 1.0051 0.9997 1.0016 j 15 0.9939 0.9620 0.9762 0.9905 0.9971 1.0003 1.0099 | 22 0.9913 0.9633 0.9628 0.9856 0.9956 1.0010 0.9971 j
Mar. 1 0.9909 0.9646 0.9634 j 0.9884 0.9960 1.0013 1.0077 | 8 1.0000 0.9644 j 0.9806 | 1.0138 j 1.0097 1.0022 1.0039 j 15 j 0.9991 0.9635 j 0.9811 | 1.0042 | 1.0063 j 1.0039 1.0069 j 22 | 0.9980 0.9627 i 0.9685 1.0004 1.0054 1.0035 1.0045 | 29 | 0.9954 | 0.9619 | 0.9635 | 0.9911 1.0032 1.0040 1.0114 |
Apr. 5 ] 1.0006 | 0.9596 ! 1.0044 | 1.0157 | 1.0185 | 1.0059 1.0077 |
1. Seasonally adjusted other checkable deposits at thrifts are derived as the difference between total other checkable deposits, seasonally adjusted, and seasonally adjusted other checkable deposits at commercial banks.
Digitized for FRASER http://fraser.stlouisfed.org/ Federal Reserve Bank of St. Louis
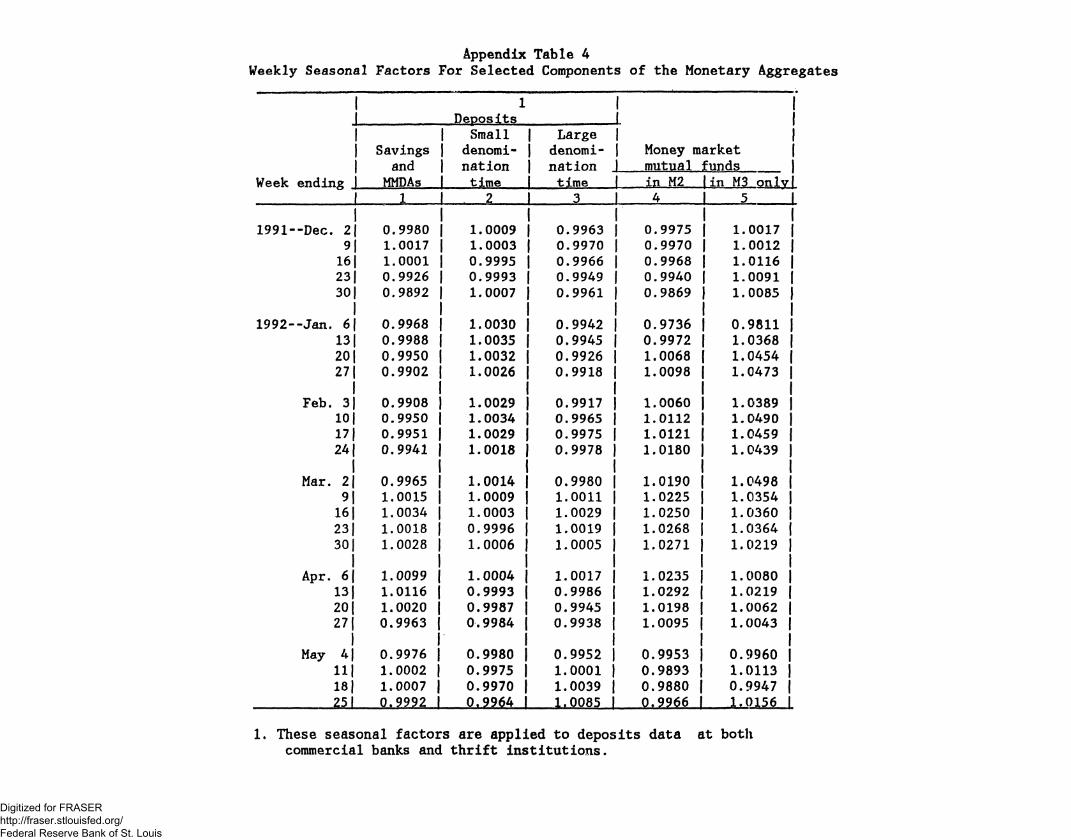
Appendix Table 4 Weekly Seasonal Factors For Selected Components of the Monetary Aggregates
| 1 j Deposits
| Small | Large j Savings | denomi- j denomi- | Money market | j and | MMDAs
| nation I time
| nation . 1 time
1 mutual . Funds | Week ending .
j and | MMDAs
| nation I time
| nation . 1 time 1 in M2 [in M3 onlvf
1 1 1 2 1 3 1 4 1 5 1
1991--Dec. 2 | 0.9980 | 1.0009 | 0.9963 i 0.9975 | 1.0017 | 9 | 1.0017 j 1.0003 | 0.9970 0.9970 | 1.0012 j 16 1.0001 | 0.9995 0.9966 0.9968 1.0116 j 23 I 0.9926 0.9993 0.9949 0.9940 1.0091 j 30 ! 0.9892 I 1.0007 ! 0.9961 0.9869 I 1.0085 j
1992--Jan. 6 0.9968 1.0030 0.9942 0.9736 0.9811 | 13 0.9988 1.0035 0.9945 0.9972 1.0368 j 20 0.9950 1.0032 0.9926 1.0068 1.0454 j 27 0.9902 1.0026 0.9918 1.0098 1.0473 j
Feb. 3 0.9908 1.0029 0.9917 1.0060 1.0389 | 10 0.9950 1.0034 0.9965 j 1.0112 1.0490 j 17 0.9951 1.0029 0.9975 j 1.0121 1.0459 j 24 0.9941 1.0018 0.9978 | 1.0180 1.0439 j
Mar. 2| 0.9965 1.0014 | 0.9980 | 1.0190 S 1.0498 | 91 1.0015 1.0009 j 1.0011 1.0225 ! 1.0354 j 161 1.0034 ! 1.0003 1.0029 1.0250 1.0360 j 231 1.0018 ! 0.9996 | 1.0019 j 1.0268 | 1.0364 j 30 j 1.0028 i 1.0006 1.0005 | 1.0271 1.0219 |
Apr. 6 1.0099 | 1.0004 | 1.0017 | 1.0235 | 1.0080 | 13 1.0116 0.9993 j 0.9986 j 1.0292 1.0219 j 20 1.0020 0.9987 0.9945 j 1.0198 1.0062 j 27 j 0.9963 | 0.9984 j 0.9938 j 1.0095 j 1.0043 j
May 4| 0.9976 | 0.9980 | 0.9952 | 0.9953 | 0.9960 | 11| 1.0002 | 0.9975 | 1.0001 j 0.9893 j 1.0113 j 18 j 1.0007 j 0.9970 j 1.0039 j 0.9880 j 0.9947 |
211 0.9992 1 0.9964 1 1-0085 1 Pt??66 | 1.0156 1
1. These seasonal factors are applied to deposits data at both commercial banks and thrift institutions.
Digitized for FRASER http://fraser.stlouisfed.org/ Federal Reserve Bank of St. Louis

Appendix Table 4 (continued) Weekly Seasonal Factors For Selected Components of the Monetary Aggregates
| 1 | Deposits
| Small [ Large Savings | denomi- denomi- Money market |
[ and 1 MMDAs
I nation I time
| nation . time
mutual 1 hinds | Week ending
[ and 1 MMDAs
I nation I time
| nation . time in M2 lin M3 onlvj
1 1 1 2 3 4 I 5_ L
1992--June 1 1.0015 0.9961 1.0082 0.9938 0.9969 | 8 1.0084 0.9957 1.0087 0.9918 0.9889 j 15 1.0082 0.9958 1.0091 0.9906 0.9806 j 22 1.0021 0.9957 1.0044 0.9859 0.9768 j 29 1.0002 0.9976 0.9951 0.9830 0.9737 j
July 6 1.0066 1.0001 0.9951 0.9785 0.9640 | 13 1.0085 0.9998 0.9978 0.9884 0.9684 | 20 1.0049 0.9995 1.0003 0.9903 0.9810 j 27 1.0014 0.9994 1.0022 0.9903 0.9802 j
Aug. 3 1.0027 0.9995 1.0026 0.9885 0.9719 | 10 1.0057 1.0000 1.0036 0.9937 0.9855 j 17 1.0045 0.9995 1.0041 0.9924 0.9873 j 24 1.0009 0.9990 1.0061 0.9993 0.9919 j 31 0.9992 0.9987 1.0077 0.9981 0.9794 |
Sep. 7 1.0031 0.9992 1.0050 0.9923 0.9745 | 14 1.0027 0.9987 1.0053 1.0002 0.9722 j 21 0.9960 0.9987 ! 1.0028 1 1.0016 0.9688 | 28 0.9926 1.0000 ! 1.0025 0.9946 0.9566 j
Oct. 5 0.9991 1.0028 1.0033 0.9906 0.9504 | 12 i 1.0013 ! 1.0030 1.0017 | 0.9956 0.9724 j 191 0.9990 | 1.0017 | 0.9990 j 0.9937 0.9631 | 26] 0.9953 | 1.0011 | 0.9988 1.0013 0.9838 |
Nov. 2 0.9964 | 1.0010 | 0.9981 | 0.9928 0.9864 |
9! 1.0019 | 1.0011 | 0.9993 0.9950 0.9874 j 16| 1.0018 1.0010 0.9991 0.9954 0.9883 j
_ 23j 0.9984 1 1.0009 1 0.9990 1 1,0011 1 \ 1.0026 1
1. These seasonal factors are applied to deposits data at both commercial banks and thrift institutions.
Digitized for FRASER http://fraser.stlouisfed.org/ Federal Reserve Bank of St. Louis

Appendix Table 4 (continued) Weekly Seasonal Factors For Selected Components of the Monetary Aggregates
| 1 | Deposits
| Small | Large | Savings | denomi- | denomi- | Money market | | and 1 MMDAs
| nation 1 time
| nation _ 1 time
1 mutual . funds | Week ending .
| and 1 MMDAs
| nation 1 time
| nation _ 1 time 1 in M2 [in M3 onlv|
L__J 1 2 1 3 4 1 5 1 1992--Nov.30 I 0.9968 I 1.0010 | 0.9976 0.9972 I . 0.9978 |
Dec. 7 | 1.0000 I 1.0010 | 0.9968 0.9954 | 0.9998 | 14 ' 0.9992 1 1.0005 ! 0.9974 0.9980 ' 1.0129 j 21 0.9927 1 0.9999 0.9964 0.9956 1.0173 j 28 0.9904 1.0002 0.9958 0.9875 1.0054 j
1993--Jan. 4 0.9976 1.0026 0.9947 0.9789 0.9838 | 11 1.0000 1.0037 0.9939 0.9887 1.0229 j 18 0.9946 1.0035 0.9930 1.0044 1.0374 | 25 0.9891 1.0029 0.9923 1.0079 1.0435 j
Feb. 1 0.9908 1.0028 0.9909 1.0070 1.0478 | 8 0.9947 1.0034 0.9947 1.0102 1.0462 j 15 0.9952 1.0030 0.9980 | 1.0148 1.0479 j 22 0.9942 1.0021 0.9978 1.0155 j 1.0416 j
Mar. 1 0.9950 1.0013 1 0.9985 | 1.0174 J 1.0542 | 8 1.0012 | 1.0012 | 1.0000 | 1.0210 1.0386 j
IS | 1.0038 | 1.0006 | 1.0022 j 1.0251 j 1.0413 | 221 1.0026 0.9995 1.0025 j 1.0274 1.0378 j 29| 1.0013 1.0003 j 1.0027 j 1.0276 j 1.0226 j
Apr. 5] 1.0081 1 1-0007 1 0.9998 1 1.0260 1 1.0105 1
1. These Seasonal factors are applied to deposits data at both commercial banks and thrift institutions.
Digitized for FRASER http://fraser.stlouisfed.org/ Federal Reserve Bank of St. Louis
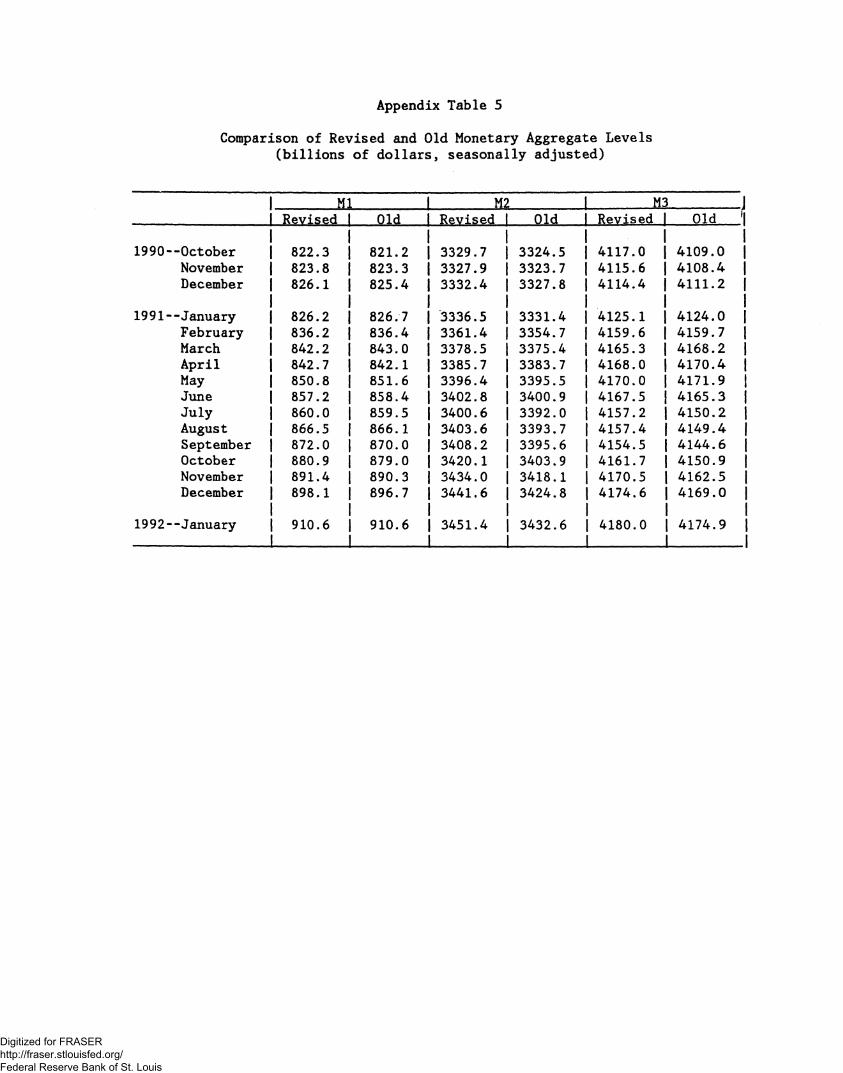
Appendix Table 5
Comparison of Revised and Old Monetary Aggregate Levels (billions of dollars, seasonally adjusted)
m i m i MJ | Revised Old Revised Old Revised 1 Old '1
1990--October 822.3 821.2 3329.7 3324.5 4117.0 4109.0 | November 823.8 823.3 3327.9 3323.7 4115.6 4108.4 j December 826.1 825.4 3332.4 3327.8 4114.4 4111.2 |
1991--January 826.2 826.7 3336.5 3331.4 4125.1 4124.0 | February 836.2 836.4 3361.4 3354.7 4159.6 4159.7 j March 842.2 843.0 3378.5 3375.4 4165.3 4168.2 j April 842.7 842.1 3385.7 3383.7 4168.0 4170.4 j May 850.8 851.6 3396.4 3395.5 4170.0 4171.9 | June 857.2 858.4 3402.8 3400.9 4167.5 4165.3 j July 860.0 859.5 3400.6 3392.0 4157.2 4150.2 j August 866.5 866.1 3403.6 3393.7 4157.4 4149.4 September 872.0 870.0 3408.2 3395.6 4154.5 4144.6 | October 880.9 879.0 3420.1 3403.9 4161.7 4150.9 November 891.4 890.3 3434.0 3418.1 4170.5 4162.5 December 898.1 896.7 3441.6 3424.8 4174.6 I 4169.0
1992--January 910.6 910.6 3451.4 3432.6 4180.0 | 4174.9
Digitized for FRASER http://fraser.stlouisfed.org/ Federal Reserve Bank of St. Louis
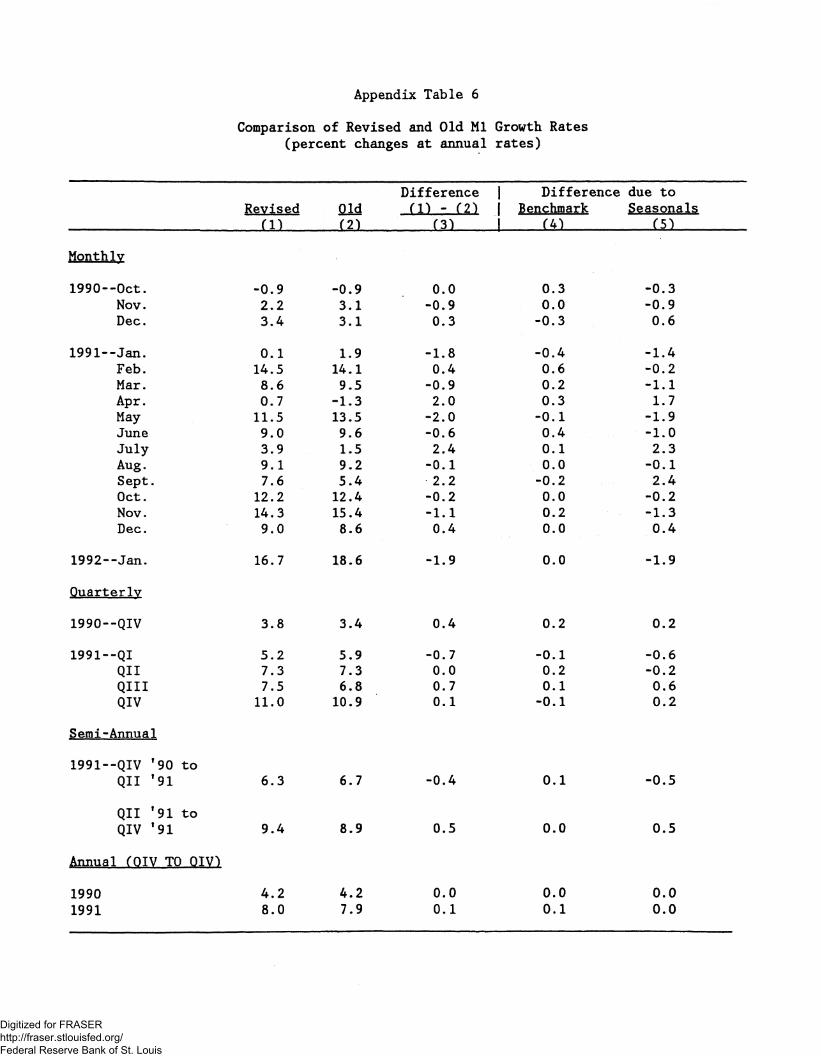
Appendix Table 6
Comparison of Revised and Old Ml Growth Rates (percent changes at annual rates)
Difference | | Difference due to Revised Old m - f2i | | Benchmark Seasonals
m (2} m i | f4) m Monthly
1990—Oct. -0.9 -0.9 0.0 0.3 -0.3 Nov. 2.2 3.1 -0.9 0.0 -0.9 Dec. 3.4 3.1 0.3 -0.3 0.6
1991--Jan. 0.1 1.9 -1.8 -0.4 -1.4 Feb. 14.5 14.1 0.4 0.6 -0.2 Mar. 8.6 9.5 -0.9 0.2 -1.1 Apr. 0.7 -1.3 2.0 0.3 1.7 May 11.5 13.5 -2.0 -0.1 -1.9 June 9.0 9.6 -0.6 0.4 -1.0 July 3.9 1.5 2.4 0.1 2.3 Aug. 9.1 9.2 -0.1 0.0 -0.1 Sept. 7.6 5.4 2.2 -0.2 2.4 Oct. 12.2 12.4 -0.2 0.0 -0.2 Nov. 14.3 15.4 -1.1 0.2 -1.3 Dec. 9.0 8.6 0.4 0.0 0.4
1992--Jan. 16.7 18.6 -1.9 0.0 -1.9
Quarterly
1990--QIV 3.8 3.4 0.4 0.2 0.2
1991--QI 5.2 5.9 -0.7 -0.1 -0.6 QII 7.3 7.3 0.0 0.2 -0.2 QUI 7.5 6.8 0.7 0.1 0.6 QIV 11.0 10.9 0.1 -0.1 0.2
Semi-Annual
1991—QIV ' 90 to QII ' 91 6.3 6.7 -0.4 0.1 -0.5
QII * 91 to QIV * 91 9.4 8.9 0.5 0.0 0.5
Annual fOIV ' TO QIV)
1990 4.2 4.2 0.0 0.0 0.0 1991 8.0 7.9 0.1 0.1 0.0
Digitized for FRASER http://fraser.stlouisfed.org/ Federal Reserve Bank of St. Louis

Appendix Table 7
Comparison of Revised and Old H2 Growth Rates (percent changes at annual rates)
Difference | | Difference due to Revised Old (1) - (2) | j PenchjparK geaspnals
m f2-) f31 1 I m (51
Monthly
1990--Oct. 0.9 1.0 -0.1 0.2 -0.3 Nov. -0.6 -0.3 -0.3 -0.1 -0.2 Dec. 1.6 1.5 0.1 -0.2 0.3
1991--Jan. 1.5 1.3 0.2 -0.4 0.6 Feb. 9.0 8.4 0.6 1.0 -0.4 Mar. 6.1 7.4 -1.3 0.1 -1.4 Apr. 2.6 3.0 -0.4 -0.4 0.0 May 3.8 4.2 -0.4 0.1 -0.5 June 2.3 1.9 0.4 0.2 0.2 July -0.8 -3.1 2.3 1.2 1.1 Aug. 1.1 0.6 0.5 0.1 0.4 Sept. 1.6 0.7 0.9 0.4 0.5 Oct. 4.2 2.9 1.3 1.7 -0.4 Nov. 4.9 5.0 -0.1 0.1 -0.2 Dec. 2.7 2.4 0.3 0.1 0.2
1992—Jan. 3.4 2.7 0.7 0.2 0.5
Quarterly
1990--QIV 2.1 2.0 0.1 0.1 0.0
1991--QI 3.5 3.4 0.1 0.1 0.0 QII 4.3 4.7 -0.4 0.0 -0.4 QUI 1.1 0.0 1.1 0.5 0.6 QIV 3.3 2.6 0.7 0.7 0.0
Semi-Annual
1991--QIV '90 to QII '91 3.9 4.1 -0.2 0.1 -0.3
QII '91 to QIV '91 2.2 1.3 0.9 0.6 0.3
Annual fOIV TO QIV)
1990 3.8 3.8 0.0 0.0 0.0 1991 3.1 2.7 0.4 0.4 0.0
Digitized for FRASER http://fraser.stlouisfed.org/ Federal Reserve Bank of St. Louis