International Statistical Release - EFAMA · International Statistical Release . This release and...
33
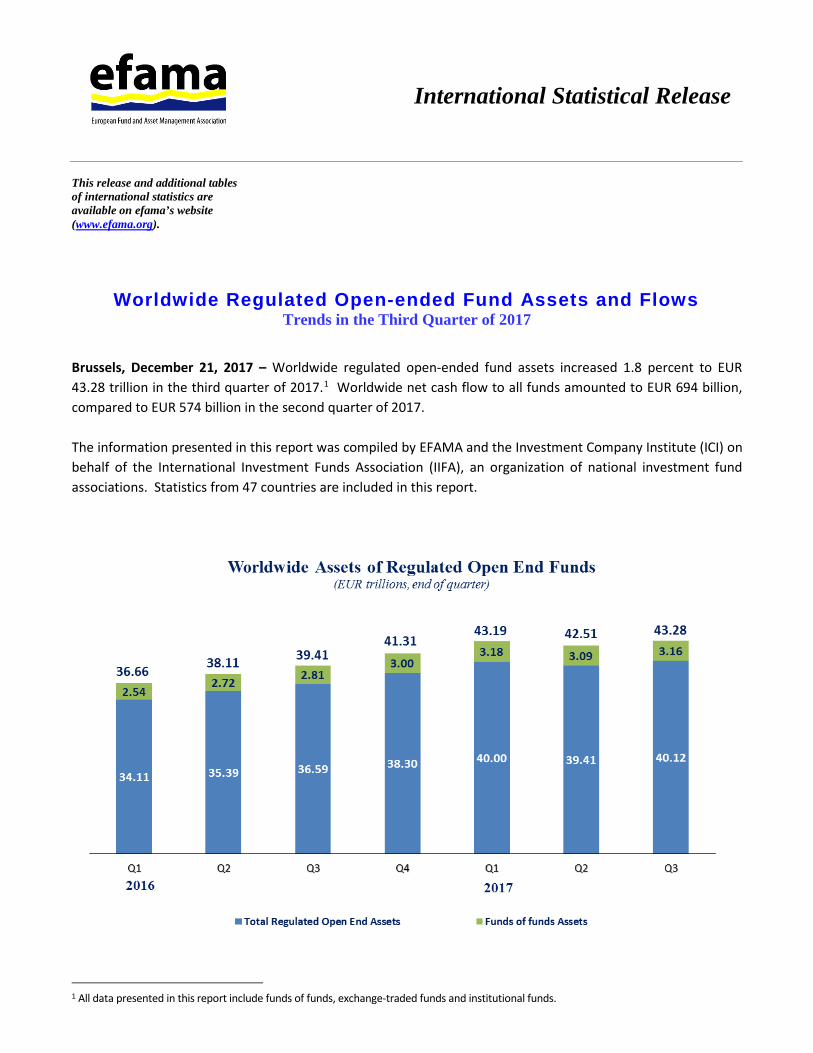
International Statistical Release This release and additional tables of international statistics are available on efama’s website (www.efama.org). Worldwide Regulated Open-ended Fund Assets and Flows Trends in the Third Quarter of 2017 Brussels, December 21, 2017 – Worldwide regulated open-ended fund assets increased 1.8 percent to EUR 43.28 trillion in the third quarter of 2017. 1 Worldwide net cash flow to all funds amounted to EUR 694 billion, compared to EUR 574 billion in the second quarter of 2017. The information presented in this report was compiled by EFAMA and the Investment Company Institute (ICI) on behalf of the International Investment Funds Association (IIFA), an organization of national investment fund associations. Statistics from 47 countries are included in this report. 1 All data presented in this report include funds of funds, exchange-traded funds and institutional funds.
Transcript of International Statistical Release - EFAMA · International Statistical Release . This release and...
International Statistical Release
This release and additional tables of international statistics are available on efama’s website (www.efama.org).
Worldwide Regulated Open-ended Fund Assets and Flows Trends in the Third Quarter of 2017
Brussels, December 21, 2017 – Worldwide regulated open-ended fund assets increased 1.8 percent to EUR 43.28 trillion in the third quarter of 2017.1 Worldwide net cash flow to all funds amounted to EUR 694 billion, compared to EUR 574 billion in the second quarter of 2017. The information presented in this report was compiled by EFAMA and the Investment Company Institute (ICI) on behalf of the International Investment Funds Association (IIFA), an organization of national investment fund associations. Statistics from 47 countries are included in this report.
1 All data presented in this report include funds of funds, exchange-traded funds and institutional funds.
EFAMA International Statistical Release (2017:Q3)
2
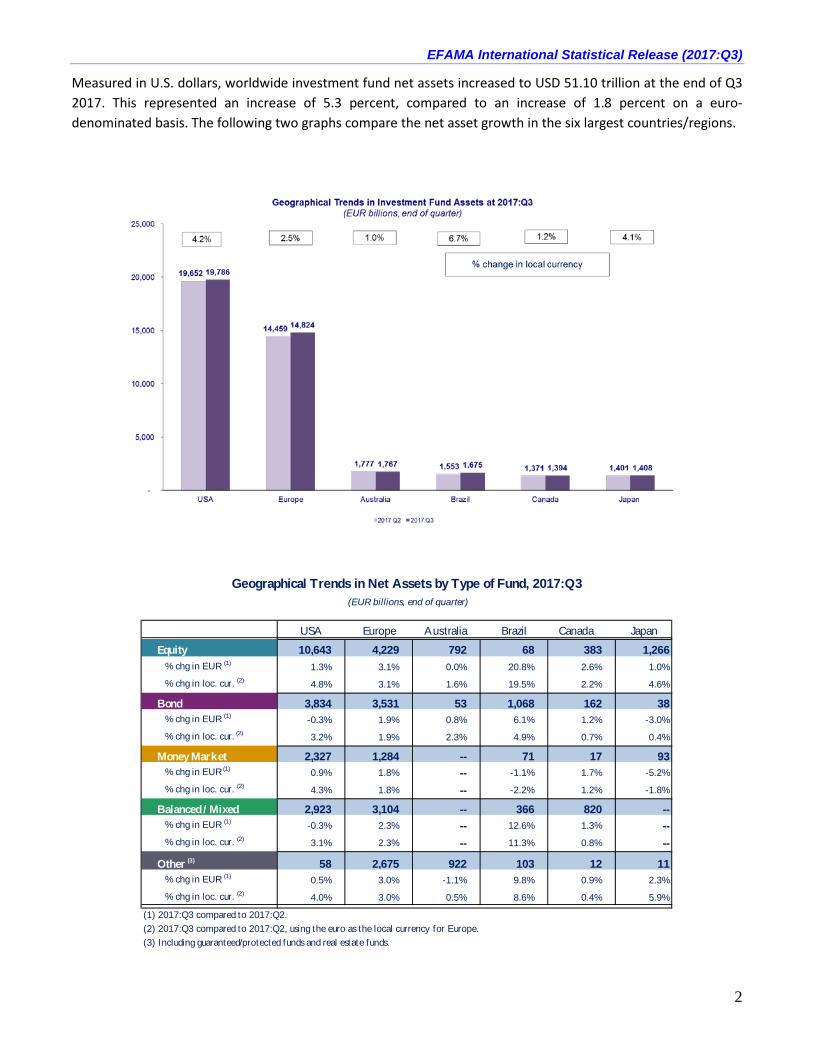
Measured in U.S. dollars, worldwide investment fund net assets increased to USD 51.10 trillion at the end of Q3 2017. This represented an increase of 5.3 percent, compared to an increase of 1.8 percent on a euro-denominated basis. The following two graphs compare the net asset growth in the six largest countries/regions.
Canada Japan
Equity 10,643 4,229 792 68 383 1,266 % chg in EUR (1) 1.3% 3.1% 0.0% 20.8% 2.6% 1.0%
% chg in loc. cur. (2) 4.8% 3.1% 1.6% 19.5% 2.2% 4.6%
Bond 3,834 3,531 53 1,068 162 38 % chg in EUR (1) -0.3% 1.9% 0.8% 6.1% 1.2% -3.0%
% chg in loc. cur. (2) 3.2% 1.9% 2.3% 4.9% 0.7% 0.4%
Money Market 2,327 1,284 -- 71 17 93 % chg in EUR (1) 0.9% 1.8% -- -1.1% 1.7% -5.2%
% chg in loc. cur. (2) 4.3% 1.8% -- -2.2% 1.2% -1.8%
Balanced / Mixed 2,923 3,104 -- 366 820 -- % chg in EUR (1) -0.3% 2.3% -- 12.6% 1.3% -- % chg in loc. cur. (2) 3.1% 2.3% -- 11.3% 0.8% --
Other (3) 58 2,675 922 103 12 11 % chg in EUR (1) 0.5% 3.0% -1.1% 9.8% 0.9% 2.3%
% chg in loc. cur. (2) 4.0% 3.0% 0.5% 8.6% 0.4% 5.9%
(1) 2017:Q3 compared to 2017:Q2.(2) 2017:Q3 compared to 2017:Q2, using the euro as the local currency for Europe.(3) Including guaranteed/protected funds and real estate funds.
Geographical Trends in Net Assets by Type of Fund, 2017:Q3 (EUR billions, end of quarter)
USA Europe Australia Brazil

EFAMA International Statistical Release (2017:Q3)
3
On a euro-denominated basis, equity fund net assets increased 1.7 percent to EUR 17.7 trillion at the end of Q3 2017. Bond funds net assets increased 1.2 percent to EUR 9.1 trillion. Balanced/mixed fund assets increased 1.4 percent to EUR 9.1 trillion, and money market fund assets increased 3.7 percent to EUR 4.8 trillion. At the end of Q3 2017, 41 percent of worldwide regulated open-ended fund net assets were held in equity funds. The net asset share of bond funds was 21 percent and the net asset share of balanced/mixed funds was 18 percent. Money market fund net assets represented 11 percent of the worldwide total.
Worldwide Regulated Open End Funds Net Assets by Type of Fund, 2017:Q3
Q1 Q2 Q3 Q4 Q1 Q2 Q3All Funds 36,657 38,108 39,408 41,305 43,190 42,509 43,283 Long Term 32,210 33,613 34,887 36,434 38,367 37,838 38,439 Equity 14,377 14,873 15,516 16,449 17,563 17,381 17,683 Bond 7,794 8,336 8,666 8,837 9,250 9,002 9,111 Balanced/mixed 6,578 6,861 7,054 7,343 7,707 7,555 7,662 Guaranteed 64 63 61 63 65 62 61 Real Estate 495 524 536 576 596 595 603 Other 2,901 2,956 3,054 3,166 3,185 3,242 3,318 Money Market 4,447 4,496 4,521 4,871 4,823 4,671 4,844 Memo Items Included Above: ETFs 2,472 2,592 2,852 3,145 3,509 3,506 3,626 Institutional 2,982 3,191 3,322 3,377 3,553 3,507 3,590
20172016
Net Assets of Worldwide Regulated Open End Funds(Billions of Euros)
EFAMA International Statistical Release (2017:Q3)
4
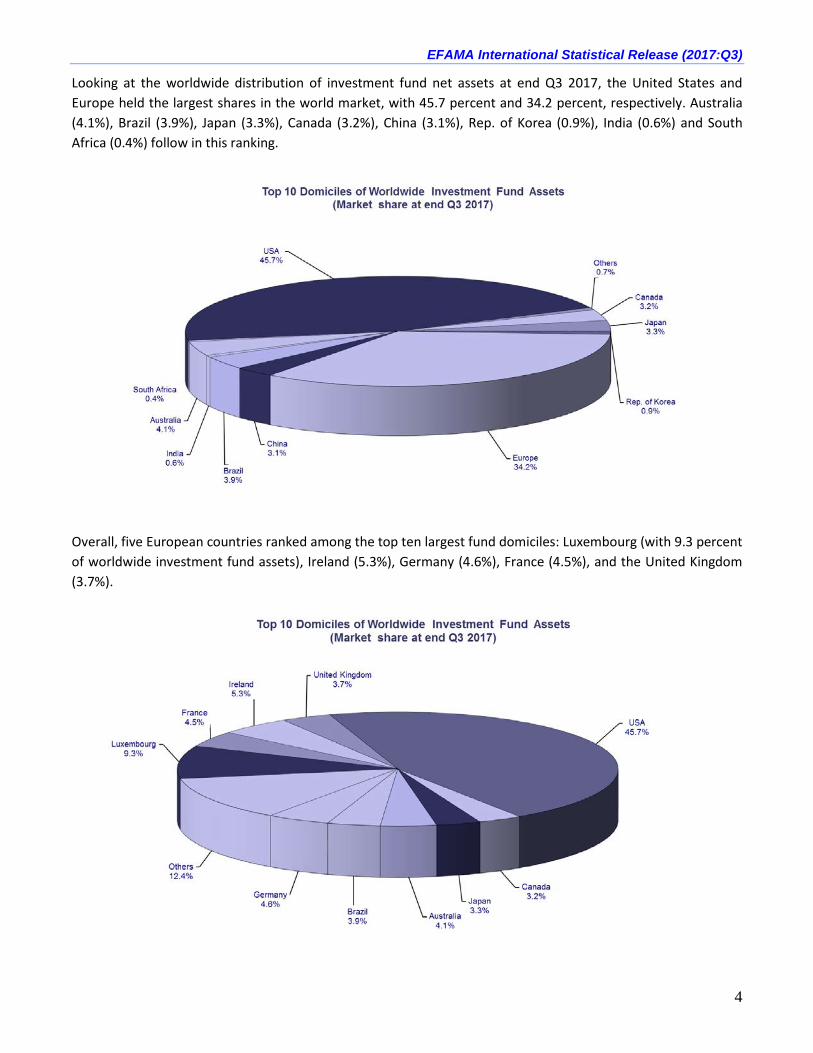
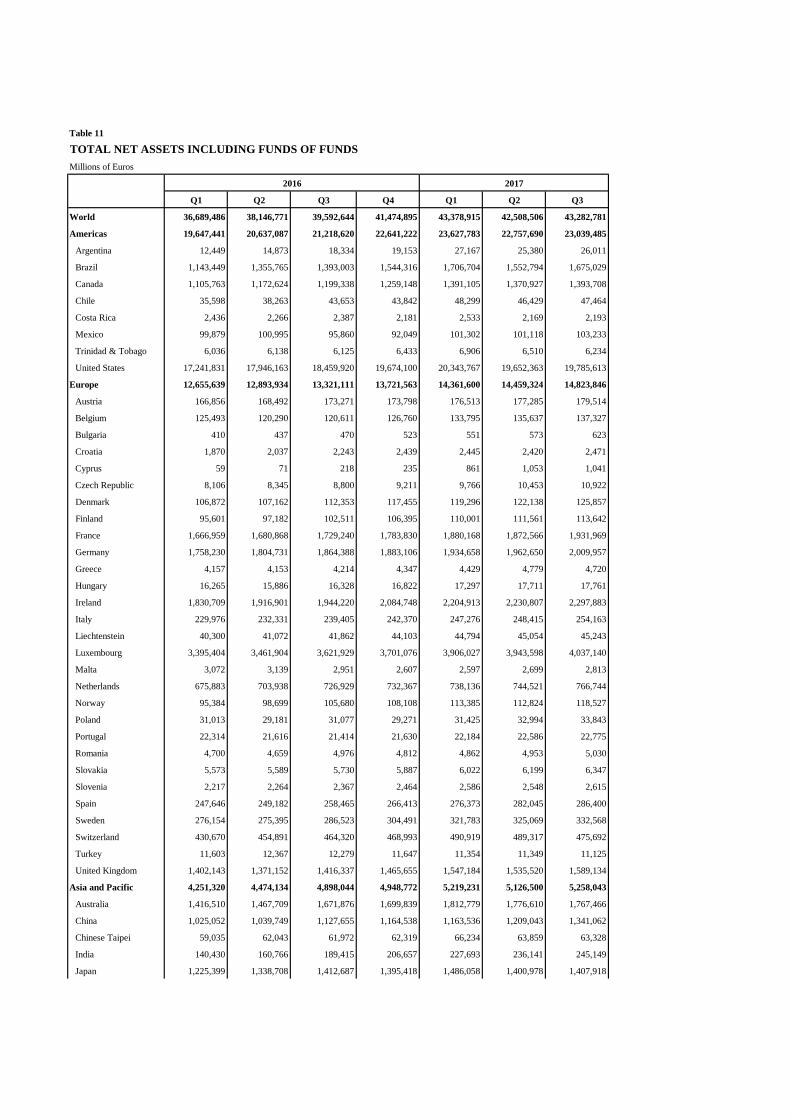
Looking at the worldwide distribution of investment fund net assets at end Q3 2017, the United States and Europe held the largest shares in the world market, with 45.7 percent and 34.2 percent, respectively. Australia (4.1%), Brazil (3.9%), Japan (3.3%), Canada (3.2%), China (3.1%), Rep. of Korea (0.9%), India (0.6%) and South Africa (0.4%) follow in this ranking. Overall, five European countries ranked among the top ten largest fund domiciles: Luxembourg (with 9.3 percent of worldwide investment fund assets), Ireland (5.3%), Germany (4.6%), France (4.5%), and the United Kingdom (3.7%).

EFAMA International Statistical Release (2017:Q3)
5
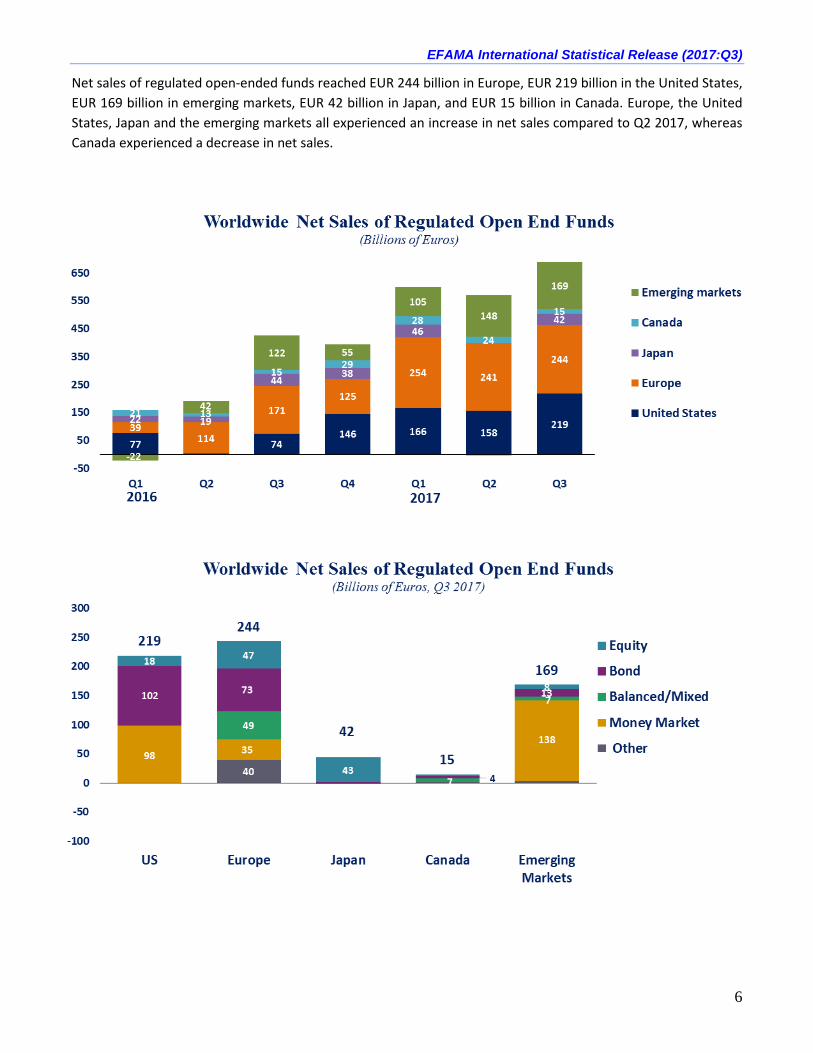
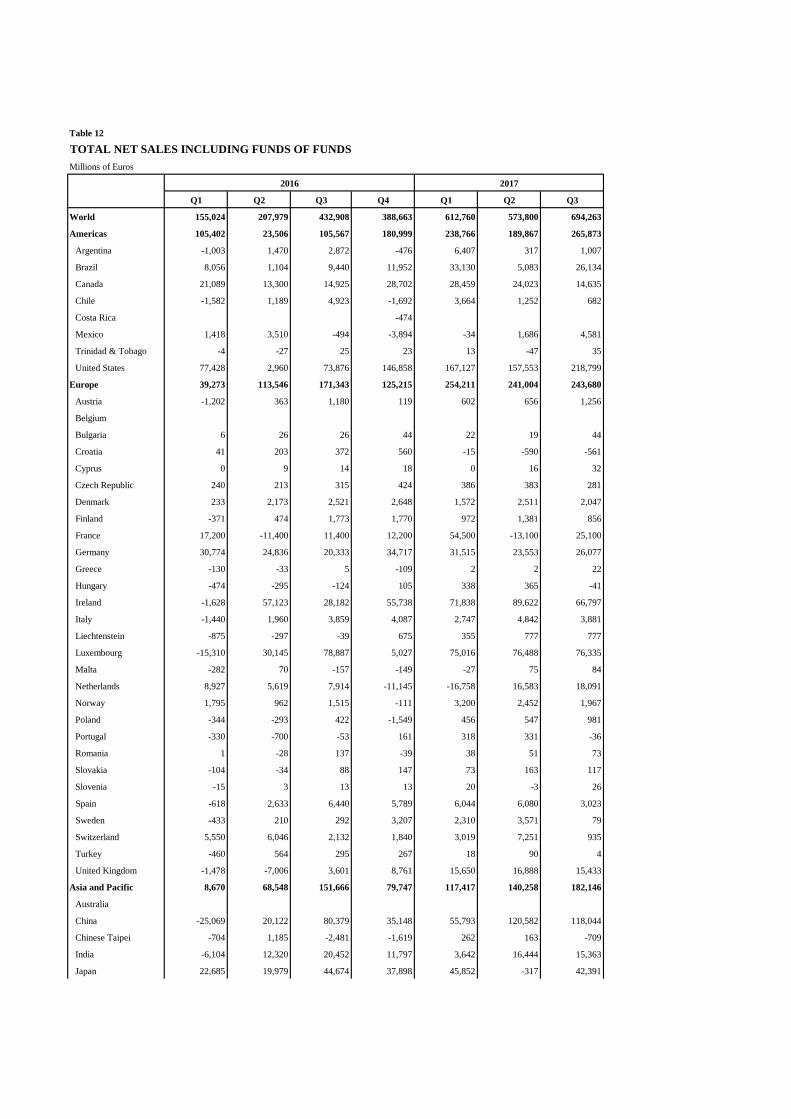
Net sales of regulated worldwide open-ended funds amounted to EUR 694 billion in the third quarter of 2017, compared to EUR 574 billion in the second quarter. Long-term funds recorded net sales of EUR 430 billion, down from EUR 460 billion in the previous quarter. Globally, equity funds recorded net sales of EUR 121 billion, compared to EUR 113 billion in Q2 2017. Bond funds recorded net sales of EUR 193 billion, compared to EUR 200 billion in the previous quarter. Net sales into balanced/mixed funds worldwide totalled EUR 65 billion, down from EUR 82 billion in the second quarter. Finally, net flows of money market funds equalled EUR 264 billion, up from EUR 114 billion in the previous quarter.
Q1 Q2 Q3 Q4 Q1 Q2 Q3All Funds 154 206 432 388 611 574 694 Long Term 192 218 390 299 583 460 430 Equity 48 -17 40 114 164 113 121 Bond 73 131 253 88 254 200 193 Balanced/mixed 35 58 59 64 102 82 65 Guaranteed -2 0 -1 2 2 -1 -3 Real Estate 9 7 5 7 11 8 9 Other 28 38 34 24 51 57 45 Money Market -38 -11 42 89 28 114 264 Memo Items Included Above: ETFs 57 37 109 126 174 132 107 Institutional 52 60 57 80 69 41 64
20172016
Note: Forty-four countries reported data from Q1 2016 through Q3 2016 and in Q1 2017 through Q3 2017; fourty-five countries reported data in Q4 2016. Assets of reporting countries represented 95 percent of assets of all jurisdictions at the end of Q3 2017. Net sales are calculated by subtracting redemptions from the sum of new sales, reinvested dividends and net exchanges. Components may not sum to total due to rounding or unclassified funds.
Net Sales of Worldwide Regulated Open End Funds(Billions of Euros)
EFAMA International Statistical Release (2017:Q3)
6
Net sales of regulated open-ended funds reached EUR 244 billion in Europe, EUR 219 billion in the United States, EUR 169 billion in emerging markets, EUR 42 billion in Japan, and EUR 15 billion in Canada. Europe, the United States, Japan and the emerging markets all experienced an increase in net sales compared to Q2 2017, whereas Canada experienced a decrease in net sales.

EFAMA International Statistical Release (2017:Q3)
7
In Europe, long-term funds attracted net sales of EUR 209 billion, down from EUR 259 billion in the second quarter of 2017. Equity funds recorded net sales of EUR 47 billion, compared to EUR 40 billion in the previous quarter. Bond funds recorded net sales of EUR 73 billion, compared to EUR 102 billion in the previous quarter. Net sales into balanced/mixed funds amounted to EUR 49 billion, down from EUR 65 billion in Q2 2017. Money market funds recorded net inflows of EUR 35 billion, compared to net outflows of EUR 18 billion in the previous quarter. In the United States, long-term open-ended funds recorded net sales of EUR 121 billion, compared to EUR 186 billion in the second quarter of 2017. Equity funds recorded net sales of EUR 18 billion, compared to EUR 71 billion in Q2 2017. Bond funds decreased from EUR 107 billion in Q2 2017 to EUR 102 billion in Q3 2017. Net sales of balanced/mixed funds amounted to EUR 1 billion, compared to EUR 6 billion in the second quarter of 2017. Money market funds posted net inflows of EUR 98 billion, compared to net outflows of EUR 29 billion in the previous quarter.
Regional Summary Table by Type of Fund, Q3 2017
Note: Includes funds-of-funds, ETFs and institutional funds in the totals and underlying categories. All funds are open-ended (i.e. redeemable), substantively-regulated and domiciled in the reporting country. New Zealand and Trinidad and Tobago include home and foreign domiciled funds.
Balanced/ Money Guaranteed/ Real O ther InstitutionalEquity Bond Mixed Market Protected Estate Funds ETFs Funds
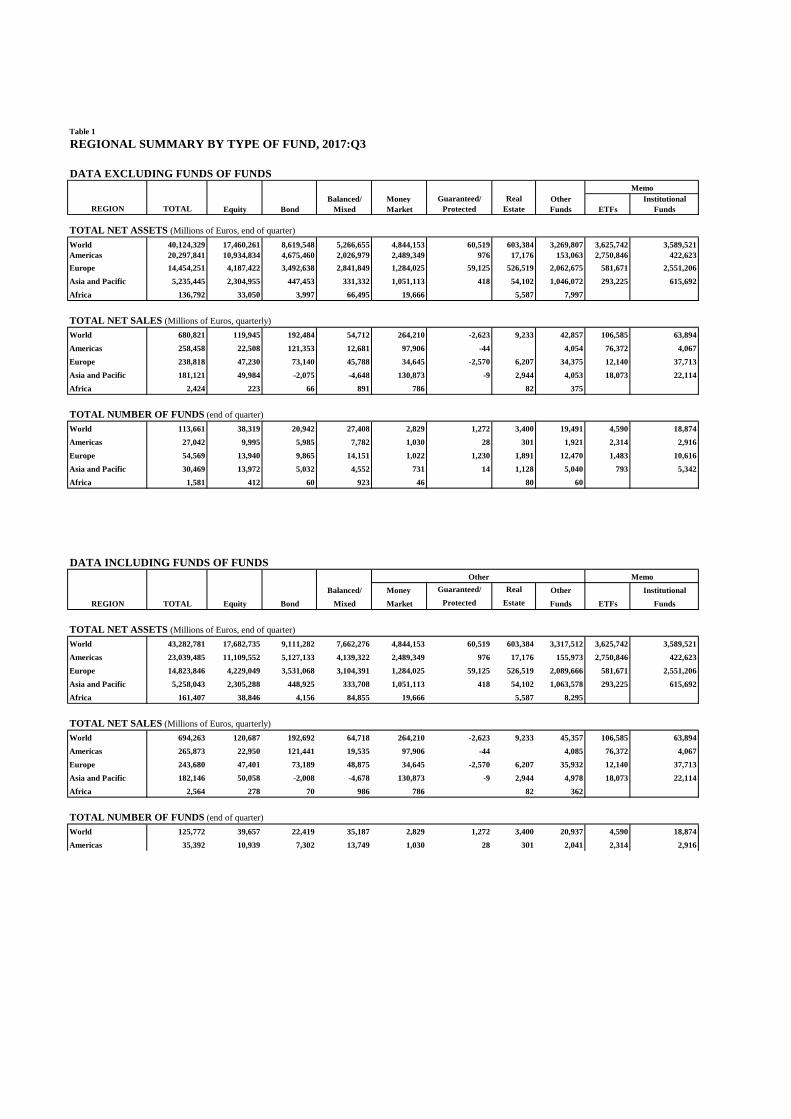
TOTAL NET ASSETS (Millions of Euros, end of quarter)World 43,282,781 17,682,735 9,111,282 7,662,276 4,844,153 60,519 603,384 3,317,512 3,625,742 3,589,521Americas 23,039,485 11,109,552 5,127,133 4,139,322 2,489,349 976 17,176 155,973 2,750,846 422,623Europe 14,823,846 4,229,049 3,531,068 3,104,391 1,284,025 59,125 526,519 2,089,666 581,671 2,551,206Asia and Pacific 5,258,043 2,305,288 448,925 333,708 1,051,113 418 54,102 1,063,578 293,225 615,692Africa 161,407 38,846 4,156 84,855 19,666 5,587 8,295
TOTAL NET SALES (Millions of Euros, quarterly)World 694,263 120,687 192,692 64,718 264,210 -2,623 9,233 45,357 106,585 63,894Americas 265,873 22,950 121,441 19,535 97,906 -44 4,085 76,372 4,067Europe 243,680 47,401 73,189 48,875 34,645 -2,570 6,207 35,932 12,140 37,713Asia and Pacific 182,146 50,058 -2,008 -4,678 130,873 -9 2,944 4,978 18,073 22,114Africa 2,564 278 70 986 786 82 362
TOTAL NUMBER OF FUNDS (end of quarter)World 125,772 39,657 22,419 35,187 2,829 1,272 3,400 20,937 4,590 18,874Americas 35,392 10,939 7,302 13,749 1,030 28 301 2,041 2,314 2,916Europe 56,649 14,275 9,992 15,523 1,022 1,230 1,891 12,716 1,483 10,616Asia and Pacific 31,682 13,988 5,059 4,589 731 14 1,128 6,104 793 5,342Africa 2,049 455 66 1,326 46 80 76
REGIO N TO TAL
O ther Memo

Euros
REGIONAL SUMMARY BY TYPE OF FUND
Worldwide Total Net Assets, Net Sales and Number of Funds Excluding and Including Funds of Funds Table 1
TABLES EXCLUDING FUNDS OF FUNDS
Total Net Assets by Type of Fund Table 2Total Net Sales by Type of Fund Table 3Number of Funds by Type of Fund Table 4Total Net Assets Time Series Table 5Total Net Sales Time Series Table 6Number of Funds Time Series Table 7
TABLES INCLUDING FUNDS OF FUNDS
Total Net Assets by Type of Fund Table 8Total Net Sales by Type of Fund Table 9Number of Funds by Type of Fund Table 10Total Net Assets Time Series Table 11Total Net Sales Time Series Table 12Number of Funds Time Series Table 13
Worldwide Public Tables, 2017:Q3
Table of Contents
REGIONAL SUMMARY BY TYPE OF FUND, 2017:Q3
DATA EXCLUDING FUNDS OF FUNDS
Balanced/ Money Guaranteed/ Real Other InstitutionalEquity Bond Mixed Market Protected Estate Funds ETFs Funds
TOTAL NET ASSETS (Millions of Euros, end of quarter)World 40,124,329 17,460,261 8,619,548 5,266,655 4,844,153 60,519 603,384 3,269,807 3,625,742 3,589,521Americas 20,297,841 10,934,834 4,675,460 2,026,979 2,489,349 976 17,176 153,063 2,750,846 422,623Europe 14,454,251 4,187,422 3,492,638 2,841,849 1,284,025 59,125 526,519 2,062,675 581,671 2,551,206Asia and Pacific 5,235,445 2,304,955 447,453 331,332 1,051,113 418 54,102 1,046,072 293,225 615,692Africa 136,792 33,050 3,997 66,495 19,666 5,587 7,997
TOTAL NET SALES (Millions of Euros, quarterly)World 680,821 119,945 192,484 54,712 264,210 -2,623 9,233 42,857 106,585 63,894Americas 258,458 22,508 121,353 12,681 97,906 -44 4,054 76,372 4,067Europe 238,818 47,230 73,140 45,788 34,645 -2,570 6,207 34,375 12,140 37,713Asia and Pacific 181,121 49,984 -2,075 -4,648 130,873 -9 2,944 4,053 18,073 22,114Africa 2,424 223 66 891 786 82 375
TOTAL NUMBER OF FUNDS (end of quarter)World 113,661 38,319 20,942 27,408 2,829 1,272 3,400 19,491 4,590 18,874Americas 27,042 9,995 5,985 7,782 1,030 28 301 1,921 2,314 2,916Europe 54,569 13,940 9,865 14,151 1,022 1,230 1,891 12,470 1,483 10,616Asia and Pacific 30,469 13,972 5,032 4,552 731 14 1,128 5,040 793 5,342Africa 1,581 412 60 923 46 80 60
DATA INCLUDING FUNDS OF FUNDS
Balanced/ Money Guaranteed/ Real Other InstitutionalEquity Bond Mixed Market Protected Estate Funds ETFs Funds
TOTAL NET ASSETS (Millions of Euros, end of quarter)World 43,282,781 17,682,735 9,111,282 7,662,276 4,844,153 60,519 603,384 3,317,512 3,625,742 3,589,521Americas 23,039,485 11,109,552 5,127,133 4,139,322 2,489,349 976 17,176 155,973 2,750,846 422,623Europe 14,823,846 4,229,049 3,531,068 3,104,391 1,284,025 59,125 526,519 2,089,666 581,671 2,551,206Asia and Pacific 5,258,043 2,305,288 448,925 333,708 1,051,113 418 54,102 1,063,578 293,225 615,692Africa 161,407 38,846 4,156 84,855 19,666 5,587 8,295
TOTAL NET SALES (Millions of Euros, quarterly)World 694,263 120,687 192,692 64,718 264,210 -2,623 9,233 45,357 106,585 63,894Americas 265,873 22,950 121,441 19,535 97,906 -44 4,085 76,372 4,067Europe 243,680 47,401 73,189 48,875 34,645 -2,570 6,207 35,932 12,140 37,713Asia and Pacific 182,146 50,058 -2,008 -4,678 130,873 -9 2,944 4,978 18,073 22,114Africa 2,564 278 70 986 786 82 362
TOTAL NUMBER OF FUNDS (end of quarter)World 125,772 39,657 22,419 35,187 2,829 1,272 3,400 20,937 4,590 18,874Americas 35,392 10,939 7,302 13,749 1,030 28 301 2,041 2,314 2,916
Table 1
REGION TOTAL
Memo
REGION TOTAL
Other Memo

Balanced/ Money Guaranteed/ Real Other Institutional
Equity Bond Mixed Market Protected Estate Funds ETFs Funds
40,124,329 17,460,261 8,619,548 5,266,655 4,844,153 60,519 603,384 3,269,807 3,625,742 3,589,521
20,297,841 10,934,834 4,675,460 2,026,979 2,489,349 976 17,176 153,063 2,750,846 422,623
Argentina 26,011 1,031 18,775 3,928 2,277
Brazil 1,072,539 52,503 620,685 228,417 70,639 976 17,176 82,143 1,582 422,621
Canada 1,061,448 370,951 157,084 504,922 16,771 11,719 91,811
Chile 47,464 2,901 16,951 7,311 19,518 783 107
Costa Rica 2,191 11 123 2,057
Mexico 97,989 11,182 22,988 13,111 50,707
Trinidad & Tobago 6,234 38 4,831 1,364 2
United States 17,983,965 10,496,217 3,834,023 1,267,926 2,327,380 58,418 2,657,346
14,454,251 4,187,422 3,492,638 2,841,849 1,284,025 59,125 526,519 2,062,675 581,671 2,551,206
Austria 147,240 19,994 67,581 46,482 57 1,147 7,304 4,676 84,123
Belgium 86,457 40,767 9,124 6,033 1,653 9,613 19,267 1,101
Bulgaria 620 126 72 372 41 10 16
Croatia 2,471 255 763 113 1,248 92
Cyprus 1,041 749 34 109 149
Czech Republic 9,998 1,520 3,042 4,512 61 13 852
Denmark 115,114 49,400 55,044 10,398 37 235
Finland 91,270 39,216 37,950 8,348 1,916 61 33 3,746 258
France 1,931,969 346,291 281,437 349,729 367,691 26,476 128,000 432,345 84,065
Germany 1,910,055 300,026 464,741 839,762 7,871 183 161,145 136,327 55,892 1,527,336
Greece 4,264 909 1,375 1,241 683 56 21
Hungary 13,978 848 3,686 867 2,328 136 3,041 3,073 5 769
Ireland 2,297,883 620,631 510,758 101,381 474,669 12,321 578,122 333,645 476,548
Italy 210,641 21,359 49,062 60,464 3,998 138 75,620 3,142
Liechtenstein 44,423 10,963 9,171 15,197 2,392 51 6,649 2
Luxembourg 4,037,140 1,178,261 1,216,671 875,215 325,848 57,097 384,048 97,374 459,079
Malta 2,804 245 1,098 791 64 18 588 147
Netherlands 766,744 316,218 258,500 17,587 90,172 84,267 1,430
Norway 118,527 59,028 41,097 6,958 10,321 1,122
Poland 32,504 6,868 8,697 6,931 9,396 612
Portugal 19,697 1,159 1,503 487 586 106 10,838 5,017
Romania 5,030 104 2,462 175 28 111 2,150 1
Slovakia 6,347 375 1,806 2,877 184 1,106 60
Slovenia 2,547 1,518 179 769 80 0Spain 286,400 67,950 78,804 94,601 7,971 20,521 16,553 328
Sweden 296,663 197,364 20,375 56,586 18,550 3,787 3,245
Switzerland 458,881 157,363 131,112 119,305 20,380 30,722 4,252
Turkey 11,125 470 5,386 1,069 3,190 43 966 38
United Kingdom 1,542,418 747,445 231,108 213,490 22,782 577 23,819 303,198
5,235,445 2,304,955 447,453 331,332 1,051,113 418 54,102 1,046,072 293,225 615,692
Australia 1,767,466 792,470 53,136 921,860
China 1,341,062 95,155 175,831 254,331 803,567 12,178 46,787
Chinese Taipei 58,995 15,560 8,307 2,780 21,885 411 414 9,639 9,232
India 244,238 72,885 89,074 17,500 46,116 18,663 7,826
Japan 1,407,918 1,266,038 37,842 92,932 11,107 207,086 615,692
Korea, Rep. of 358,973 54,417 78,108 22,402 79,705 42,581 81,760 22,273
New Zealand 47,602 4,918 3,462 33,190 4,258 1,774
Pakistan 4,299 1,766 9 524 1,794 7 198
Philippines 4,892 1,746 1,684 605 856 21
136,792 33,050 3,997 66,495 19,666 5,587 7,997
South Africa 136,792 33,050 3,997 66,495 19,666 5,587 7,997
Memo
World
Table 2
TOTAL NET ASSETS EXCLUDING FUNDS OF FUNDS BY TYPE OF FUND, 2017:Q3Millions of Euros, end of quarter
TOTAL
Americas
Europe
Asia and Pacific
Africa
Note: Components may not sum to total because of rounding or missing components. ETFs and Institutional Funds are included in the Totals and underlying categories. Croatia, France, Ireland, Japan, Luxembourg, Netherlands, Norway, Slovakia, and Turkey cannot exclude funds of funds. New Zealand and Trinidad and Tobago include home-and-foreign domiciled funds. An entry shown as zero indicates an amount that is less than 0.500 million.

Balanced/ Money Guaranteed/ Real Other Institutional
Equity Bond Mixed Market Protected Estate Funds ETFs Funds
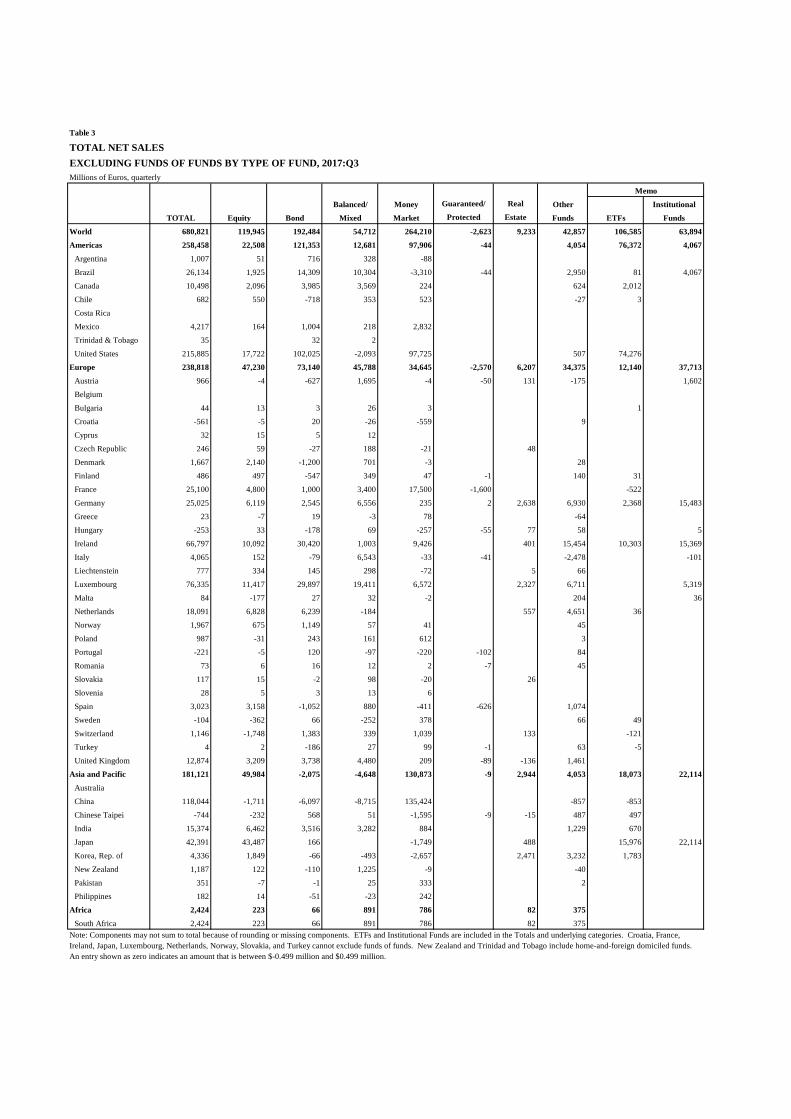
680,821 119,945 192,484 54,712 264,210 -2,623 9,233 42,857 106,585 63,894
258,458 22,508 121,353 12,681 97,906 -44 4,054 76,372 4,067
Argentina 1,007 51 716 328 -88
Brazil 26,134 1,925 14,309 10,304 -3,310 -44 2,950 81 4,067
Canada 10,498 2,096 3,985 3,569 224 624 2,012
Chile 682 550 -718 353 523 -27 3
Costa Rica
Mexico 4,217 164 1,004 218 2,832
Trinidad & Tobago 35 0 32 2 0United States 215,885 17,722 102,025 -2,093 97,725 507 74,276
238,818 47,230 73,140 45,788 34,645 -2,570 6,207 34,375 12,140 37,713
Austria 966 -4 -627 1,695 -4 -50 131 -175 1,602
Belgium
Bulgaria 44 13 3 26 3 0 1
Croatia -561 -5 20 -26 -559 9
Cyprus 32 15 5 12
Czech Republic 246 59 -27 188 -21 0 48
Denmark 1,667 2,140 -1,200 701 -3 28
Finland 486 497 -547 349 47 -1 0 140 31
France 25,100 4,800 1,000 3,400 17,500 -1,600 -522
Germany 25,025 6,119 2,545 6,556 235 2 2,638 6,930 2,368 15,483
Greece 23 -7 19 -3 78 -64 0Hungary -253 33 -178 69 -257 -55 77 58 0 5
Ireland 66,797 10,092 30,420 1,003 9,426 401 15,454 10,303 15,369
Italy 4,065 152 -79 6,543 -33 -41 -2,478 -101
Liechtenstein 777 334 145 298 -72 5 66
Luxembourg 76,335 11,417 29,897 19,411 6,572 2,327 6,711 5,319
Malta 84 -177 27 32 -2 0 204 36
Netherlands 18,091 6,828 6,239 -184 557 4,651 36
Norway 1,967 675 1,149 57 41 45
Poland 987 -31 243 161 612 3
Portugal -221 -5 120 -97 -220 -102 84
Romania 73 6 16 12 2 -7 45 0Slovakia 117 15 -2 98 -20 26 0Slovenia 28 5 3 13 6 0Spain 3,023 3,158 -1,052 880 -411 -626 1,074 0Sweden -104 -362 66 -252 378 66 49
Switzerland 1,146 -1,748 1,383 339 1,039 133 -121
Turkey 4 2 -186 27 99 -1 63 -5
United Kingdom 12,874 3,209 3,738 4,480 209 -89 -136 1,461
181,121 49,984 -2,075 -4,648 130,873 -9 2,944 4,053 18,073 22,114
Australia
China 118,044 -1,711 -6,097 -8,715 135,424 -857 -853
Chinese Taipei -744 -232 568 51 -1,595 -9 -15 487 497
India 15,374 6,462 3,516 3,282 884 1,229 670
Japan 42,391 43,487 166 -1,749 488 15,976 22,114
Korea, Rep. of 4,336 1,849 -66 -493 -2,657 2,471 3,232 1,783
New Zealand 1,187 122 -110 1,225 -9 -40
Pakistan 351 -7 -1 25 333 0 2
Philippines 182 14 -51 -23 242 02,424 223 66 891 786 82 375
South Africa 2,424 223 66 891 786 82 375
Table 3
TOTAL NET SALES EXCLUDING FUNDS OF FUNDS BY TYPE OF FUND, 2017:Q3Millions of Euros, quarterly
TOTAL
Note: Components may not sum to total because of rounding or missing components. ETFs and Institutional Funds are included in the Totals and underlying categories. Croatia, France, Ireland, Japan, Luxembourg, Netherlands, Norway, Slovakia, and Turkey cannot exclude funds of funds. New Zealand and Trinidad and Tobago include home-and-foreign domiciled funds. An entry shown as zero indicates an amount that is between $-0.499 million and $0.499 million.
Memo
Americas
Europe
Asia and Pacific
Africa
World


Balanced/ Money Guaranteed/ Real Other Institutional
Equity Bond Mixed Market Protected Estate Funds ETFs Funds
113,661 38,319 20,942 27,408 2,829 1,272 3,400 19,491 4,590 18,874
27,042 9,995 5,985 7,782 1,030 28 301 1,921 2,314 2,916
Argentina 470 53 242 144 31
Brazil 9,624 1,157 1,818 4,682 123 28 301 1,515 14 2,915
Canada 3,831 1,938 586 974 104 229 516
Chile 2,660 582 658 1,085 250 85 1
Costa Rica 67 2 18 47
Mexico 546 163 182 84 117
Trinidad & Tobago 45 11 19 15 1
United States 9,799 6,089 2,462 751 405 92 1,783
54,569 13,940 9,865 14,151 1,022 1,230 1,891 12,470 1,483 10,616
Austria 1,579 269 530 675 3 38 12 52 877
Belgium 949 242 72 57 13 544 21 4
Bulgaria 112 34 8 57 7 6 1
Croatia 94 26 17 8 22 21
Cyprus 42 4 8 23 7
Czech Republic 139 26 38 66 2 3 4
Denmark 548 282 222 42 1 1
Finland 356 188 87 42 9 2 1 27 1
France 10,889 1,777 1,112 3,052 224 335 471 3,918 253
Germany 5,870 787 1,022 3,162 18 1 407 473 111 3,921
Greece 136 50 36 31 16 3 2
Hungary 306 59 44 44 45 11 12 91 1 46
Ireland 6,704 2,088 996 580 107 223 2,710 660 2,240
Italy 822 95 207 211 11 23 275 30
Liechtenstein 1,325 365 257 231 30 4 438 1
Luxembourg 14,712 3,797 3,145 4,029 260 337 3,144 385 3,468
Malta 143 30 24 21 1 5 62 29
Netherlands 994 373 258 85 125 153 14
Norway 738 392 178 77 45 46
Poland 418 143 95 98 58 24
Portugal 353 44 23 19 5 4 230 28
Romania 77 17 12 21 1 2 24 1
Slovakia 87 9 25 45 2 6 4
Slovenia 106 70 9 22 4 1
Spain 2,360 821 672 427 37 257 146 2
Sweden 532 323 76 89 31 13 14
Switzerland 881 406 251 173 20 31 21
Turkey 379 66 88 76 25 5 119 13
United Kingdom 2,918 1,157 353 688 25 5 23 667
30,469 13,972 5,032 4,552 731 14 1,128 5,040 793 5,342
Australia
China 4,236 763 982 2,011 347 133 165
Chinese Taipei 703 342 112 66 58 10 15 100 87
India 802 317 254 30 52 149 66
Japan 11,491 10,548 907 12 24 171 5,342
Korea, Rep. of 12,405 1,773 2,695 2,126 137 1,089 4,585 303
New Zealand 598 169 59 275 43 52
Pakistan 176 41 1 30 79 4 21
Philippines 58 19 22 14 3 1
1,581 412 60 923 46 80 60
South Africa 1,581 412 60 923 46 80 60
World
Memo
Table 4
NUMBER OF FUNDSEXCLUDING FUNDS OF FUNDS BY TYPE OF FUND, 2017:Q3End of quarter
TOTAL
Americas
Europe
Asia and Pacific
Africa
Note: Components may not sum to total because of missing components. ETFs and Institutional Funds are included in the Totals and underlying categories. Croatia, France, Ireland, Japan, Luxembourg, Netherlands, Norway, Slovakia, and Turkey cannot exclude funds of funds. New Zealand and Trinidad and Tobago include home-and-foreign domiciled funds.


TOTAL NET ASSETS EXCLUDING FUNDS OF FUNDS
Q1 Q2 Q3 Q4 Q1 Q2 Q3
34,145,449 35,424,823 36,778,163 38,473,009 40,195,900 39,413,951 40,124,329
17,434,332 18,258,824 18,761,859 20,010,444 20,841,616 20,073,524 20,297,841
Argentina 12,449 14,873 18,334 19,153 27,167 25,380 26,011
Brazil 749,467 886,644 909,025 1,006,454 1,102,504 996,284 1,072,539
Canada 833,631 882,997 900,695 944,967 1,063,857 1,044,883 1,061,448
Chile 35,598 38,263 43,653 43,842 48,299 46,429 47,464
Costa Rica 2,434 2,264 2,385 2,179 2,531 2,167 2,191
Mexico 95,286 96,472 91,476 87,686 96,418 96,208 97,989
Trinidad & Tobago 6,036 6,138 6,125 6,433 6,906 6,510 6,234
United States 15,699,431 16,331,173 16,790,166 17,899,730 18,493,934 17,855,663 17,983,965
12,361,032 12,587,596 13,003,738 13,392,714 14,010,963 14,095,771 14,454,251
Austria 138,167 139,912 143,444 143,192 144,620 145,440 147,240
Belgium 83,736 76,317 75,764 79,968 84,233 84,096 86,457
Bulgaria 407 434 467 520 548 570 620
Croatia 1,870 2,037 2,243 2,439 2,445 2,420 2,471
Cyprus 59 71 218 235 861 1,053 1,041
Czech Republic 7,441 7,640 8,089 8,444 8,934 9,555 9,998
Denmark 101,197 101,322 106,205 110,909 112,297 112,142 115,114
Finland 79,605 80,892 85,566 88,945 91,788 89,805 91,270
France 1,666,959 1,680,868 1,729,240 1,783,830 1,880,168 1,872,566 1,931,969
Germany 1,683,607 1,726,294 1,781,803 1,796,530 1,843,184 1,864,759 1,910,055
Greece 3,709 3,708 3,772 3,900 3,981 4,325 4,264
Hungary 13,451 13,124 13,506 13,833 13,997 14,162 13,978
Ireland 1,830,709 1,916,901 1,944,220 2,084,748 2,204,913 2,230,807 2,297,883
Italy 181,493 183,095 189,630 192,946 199,092 204,828 210,641
Liechtenstein 39,392 40,187 41,062 43,282 43,950 44,217 44,423
Luxembourg 3,395,404 3,461,904 3,621,929 3,701,076 3,906,027 3,943,598 4,037,140
Malta 3,063 3,130 2,942 2,598 2,588 2,690 2,804
Netherlands 675,883 703,938 726,929 732,367 738,136 744,521 766,744
Norway 95,384 98,699 105,680 108,108 113,385 112,824 118,527
Poland 29,735 27,980 29,812 28,054 30,123 31,659 32,504
Portugal 19,746 19,138 18,936 19,077 19,468 19,718 19,697
Romania 4,700 4,659 4,976 4,812 4,862 4,953 5,030
Slovakia 5,573 5,589 5,730 5,887 6,022 6,199 6,347
Slovenia 2,159 2,202 2,305 2,398 2,520 2,480 2,547
Spain 247,646 249,182 258,465 266,413 276,373 282,045 286,400
Sweden 248,886 244,804 254,918 271,712 287,283 289,888 296,663
Switzerland 413,528 437,318 446,793 451,417 473,036 471,707 458,881
Turkey 11,603 12,367 12,279 11,647 11,354 11,349 11,125
United Kingdom 1,375,920 1,343,884 1,386,815 1,433,427 1,504,775 1,491,395 1,542,418
4,235,883 4,458,745 4,881,704 4,931,513 5,198,991 5,104,785 5,235,445
Australia 1,416,510 1,467,709 1,671,876 1,699,839 1,812,779 1,776,610 1,767,466
China 1,025,052 1,039,749 1,127,655 1,164,538 1,163,536 1,209,043 1,341,062
Chinese Taipei 55,502 58,248 58,342 58,603 61,863 59,618 58,995
India 139,454 159,772 188,410 205,678 226,670 235,207 244,238
Japan 1,225,399 1,338,708 1,412,687 1,395,418 1,486,058 1,400,978 1,407,918
Table 5
Millions of Euros
2016 2017
Americas
Europe
Asia and Pacific
World

Korea, Rep. of 327,398 344,234 368,470 351,580 390,260 366,140 358,973
New Zealand 38,177 41,758 45,464 46,127 47,722 47,921 47,602
Pakistan 3,757 3,742 4,231 5,085 5,304 4,474 4,299
Philippines 4,634 4,825 4,569 4,645 4,799 4,794 4,892
114,202 119,658 130,862 138,338 144,330 139,871 136,792
South Africa 114,202 119,658 130,862 138,338 144,330 139,871 136,792Note: New Zealand and Trinidad and Tobago include home-and-foreign domiciled funds. Croatia, France, Ireland, Japan, Luxembourg, Netherlands, Norway, Slovakia, and Turkey cannot exclude funds of funds. ETFs and Institutional funds are included in the totals. An entry shown as zero is less than .500 million.
Africa

TOTAL NET SALES EXCLUDING FUNDS OF FUNDS
Q1 Q2 Q3 Q4 Q1 Q2 Q3
131,938 188,028 415,880 353,281 579,101 552,690 680,821
86,632 7,882 95,195 153,747 213,455 177,995 258,458
Argentina -1,003 1,470 2,872 -476 6,407 317 1,007
Brazil 8,056 1,104 9,440 11,952 33,130 5,083 26,134
Canada 11,702 7,647 8,642 19,844 21,304 17,672 10,498
Chile -1,582 1,189 4,923 -1,692 3,664 1,252 682
Costa Rica -474
Mexico 1,329 3,513 -488 -3,806 -171 1,549 4,217
Trinidad & Tobago -4 -27 25 23 13 -47 35
United States 68,134 -7,014 69,781 128,376 149,108 152,169 215,885
36,282 109,962 165,191 117,830 247,731 234,251 238,818
Austria -1,217 324 762 -227 341 554 966
Belgium
Bulgaria 6 26 26 44 22 19 44
Croatia 41 203 372 560 -15 -590 -561
Cyprus 0 9 14 18 0 16 32
Czech Republic 204 179 286 392 353 321 246
Denmark 16 1,972 2,341 2,322 912 1,297 1,667
Finland -335 391 1,506 1,560 662 1,158 486
France 17,200 -11,400 11,400 12,200 54,500 -13,100 25,100
Germany 28,352 22,251 17,197 30,461 28,276 21,232 25,025
Greece -118 -22 18 -99 13 -11 23
Hungary -332 -251 -94 36 -11 97 -253
Ireland -1,628 57,123 28,182 55,738 71,838 89,622 66,797
Italy -1,404 2,071 3,733 4,588 4,381 5,813 4,065
Liechtenstein -871 -261 62 683 356 767 777
Luxembourg -15,310 30,145 78,887 5,027 75,016 76,488 76,335
Malta -282 70 -157 -149 -27 75 84
Netherlands 8,927 5,619 7,914 -11,145 -16,758 16,583 18,091
Norway 1,795 962 1,515 -111 3,200 2,452 1,967
Poland -204 -242 409 -1,497 469 523 987
Portugal -230 -598 -11 90 184 198 -221
Romania 1 -28 137 -39 38 51 73
Slovakia -104 -34 88 147 73 163 117
Slovenia -15 0 16 13 20 -2 28
Spain -618 2,633 6,440 5,789 6,044 6,080 3,023
Sweden -456 158 -211 2,668 1,816 2,779 -104
Switzerland 5,643 6,100 2,262 1,695 2,976 7,129 1,146
Turkey -460 564 295 267 18 90 4
United Kingdom -2,319 -8,002 1,802 6,799 13,034 14,447 12,874
7,527 68,193 151,702 79,020 115,760 137,876 181,121
Australia
China -25,069 20,122 80,379 35,148 55,793 120,582 118,044
Chinese Taipei -776 1,085 -2,192 -1,408 -136 82 -744
India -6,058 12,359 20,487 11,812 3,667 16,486 15,374
Japan 22,685 19,979 44,674 37,898 45,852 -317 42,391
Table 6
Millions of Euros
2016 2017
Americas
Europe
Asia and Pacific
World

Korea, Rep. of 16,151 14,024 6,662 -5,332 9,795 485 4,336
New Zealand 480 802 1,552 621 396 402 1,187
Pakistan 89 -191 227 117 247 -16 351
Philippines 25 13 -87 164 146 172 182
1,497 1,991 3,792 2,684 2,155 2,568 2,424
South Africa 1,497 1,991 3,792 2,684 2,155 2,568 2,424Note: New Zealand and Trinidad and Tobago include home-and-foreign domiciled funds. Croatia, France, Ireland, Japan, Luxembourg, Netherlands, Norway, Slovakia, and Turkey cannot exclude funds of funds. ETFs and Institutional funds are included in the totals. An entry shown as zero indicates an amount that is between $-0.499 million and $0.499 million.
Africa

NUMBER OF FUNDS EXCLUDING FUNDS OF FUNDS
Q1 Q2 Q3 Q4 Q1 Q2 Q3
106,832 108,032 109,300 110,252 111,943 112,901 113,661
25,346 25,559 25,726 25,898 26,597 26,865 27,042
Argentina 357 366 376 420 430 447 470
Brazil 8,906 9,057 9,126 9,224 9,354 9,479 9,624
Canada 3,255 3,275 3,296 3,298 3,758 3,825 3,831
Chile 2,476 2,452 2,507 2,539 2,567 2,625 2,660
Costa Rica 63 64 65 67 68 69 67
Mexico 506 508 516 524 532 544 546
Trinidad & Tobago 44 44 44 44 45 45 45
United States 9,739 9,793 9,796 9,782 9,843 9,831 9,799
53,173 53,167 53,395 53,438 54,024 54,282 54,569
Austria 1,598 1,583 1,585 1,575 1,583 1,589 1,579
Belgium 1,164 1,046 1,007 962 949 917 949
Bulgaria 106 108 112 110 111 112 112
Croatia 85 85 87 89 92 93 94
Cyprus 22 22 29 30 37 38 42
Czech Republic 129 131 131 129 129 132 139
Denmark 571 549 546 558 577 580 548
Finland 373 371 374 372 372 360 356
France 11,050 11,051 10,975 10,952 10,880 10,938 10,889
Germany 5,625 5,629 5,676 5,678 5,782 5,809 5,870
Greece 136 135 136 135 136 134 136
Hungary 324 318 319 306 324 315 306
Ireland 6,242 6,266 6,343 6,470 6,541 6,603 6,704
Italy 696 718 734 760 763 801 822
Liechtenstein 1,190 1,223 1,254 1,287 1,294 1,310 1,325
Luxembourg 14,179 14,208 14,283 14,211 14,586 14,674 14,712
Malta 127 122 123 126 132 138 143
Netherlands 1,039 1,030 1,030 1,014 1,014 1,030 994
Norway 684 691 720 720 715 726 738
Poland 403 415 422 423 402 414 418
Portugal 390 383 378 373 367 360 353
Romania 74 76 76 75 75 74 77
Slovakia 88 89 89 87 86 88 87
Slovenia 111 112 113 102 105 105 106
Spain 2,255 2,290 2,325 2,342 2,362 2,353 2,360
Sweden 462 472 474 496 518 518 532
Switzerland 861 863 865 858 863 876 881
Turkey 400 390 399 396 390 384 379
United Kingdom 2,789 2,791 2,790 2,802 2,839 2,811 2,918
26,953 27,903 28,718 29,396 29,800 30,198 30,469
Australia
China 2,723 2,909 3,168 3,564 3,852 4,022 4,236
Chinese Taipei 618 627 641 653 669 684 703
India 799 800 800 795 800 799 802
2017
Table 7
World
2016
Americas
Europe
Asia and Pacific

Japan 10,035 10,367 10,711 10,915 11,120 11,249 11,491
Korea, Rep. of 11,979 12,389 12,553 12,626 12,515 12,598 12,405
New Zealand 579 586 619 615 616 615 598
Pakistan 165 168 169 171 171 174 176
Philippines 55 57 57 57 57 57 58
1,360 1,403 1,461 1,520 1,522 1,556 1,581
South Africa 1,360 1,403 1,461 1,520 1,522 1,556 1,581
Africa
Note: New Zealand and Trinidad and Tobago include home-and-foreign domiciled funds. Croatia, France, Ireland, Japan, Luxembourg, Netherlands, Norway, Slovakia, and Turkey cannot exclude funds of funds. ETFs and Institutional funds are included in the totals.

Balanced/ Money Guaranteed/ Real Other InstitutionalEquity Bond Mixed Market Protected Estate Funds ETFs Funds
43,282,781 17,682,735 9,111,282 7,662,276 4,844,153 60,519 603,384 3,317,512 3,625,742 3,589,521
23,039,485 11,109,552 5,127,133 4,139,322 2,489,349 976 17,176 155,973 2,750,846 422,623
Argentina 26,011 1,031 18,775 3,928 2,277
Brazil 1,675,029 68,173 1,067,736 365,610 70,639 976 17,176 84,719 1,582 422,621
Canada 1,393,708 382,919 161,706 820,259 16,771 12,053 91,811
Chile 47,464 2,901 16,951 7,311 19,518 783 107
Costa Rica 2,193 11 123 2,057
Mexico 103,233 11,595 22,988 17,942 50,707
Trinidad & Tobago 6,234 38 4,831 1,364 2
United States 19,785,613 10,642,884 3,834,023 2,922,908 2,327,380 58,418 2,657,346
14,823,846 4,229,049 3,531,068 3,104,391 1,284,025 59,125 526,519 2,089,666 581,671 2,551,206
Austria 179,514 26,934 69,681 69,559 57 1,147 7,304 4,834 84,123
Belgium 137,327 41,733 13,205 51,805 1,653 9,613 19,318 1,101
Bulgaria 623 129 72 372 41 10 16
Croatia 2,471 255 763 113 1,248 92
Cyprus 1,041 749 34 109 149
Czech Republic 10,922 1,520 3,042 4,512 61 13 852 923
Denmark 125,857 50,461 58,253 15,979 37 1,127
Finland 113,642 42,494 43,716 21,676 1,916 61 33 3,746 258
France 1,931,969 346,291 281,437 349,729 367,691 26,476 128,000 432,345 84,065
Germany 2,009,957 304,563 465,032 930,965 7,871 183 161,145 140,198 55,892 1,527,336
Greece 4,720 1,143 1,429 1,408 683 56 21
Hungary 17,761 1,166 3,786 2,995 2,328 136 3,041 4,309 5 769
Ireland 2,297,883 620,631 510,758 101,381 474,669 12,321 578,122 333,645 476,548
Italy 254,163 21,783 50,192 99,793 3,998 138 78,259 3,142
Liechtenstein 45,243 10,963 9,222 15,197 2,392 51 7,417 2
Luxembourg 4,037,140 1,178,261 1,216,671 875,215 325,848 57,097 384,048 97,374 459,079
Malta 2,813 245 1,098 791 64 18 597 147
Netherlands 766,744 316,218 258,500 17,587 90,172 84,267 1,430
Norway 118,527 59,028 41,097 6,958 10,321 1,122
Poland 33,843 7,332 8,994 7,298 9,396 823
Portugal 22,775 1,159 1,541 2,726 586 106 10,838 5,817
Romania 5,030 104 2,462 175 28 111 2,150 1
Slovakia 6,347 375 1,806 2,877 184 1,106 60
Slovenia 2,615 1,583 179 771 80 0
Spain 286,400 67,950 78,804 94,601 7,971 20,521 16,553 328
Sweden 332,568 207,253 28,432 73,821 18,550 4,512 3,245
Switzerland 475,692 159,195 142,196 122,476 20,380 30,722 724 4,252
Turkey 11,125 470 5,386 1,069 3,190 43 966 38
United Kingdom 1,589,134 759,061 233,280 232,433 22,782 577 23,819 317,182
5,258,043 2,305,288 448,925 333,708 1,051,113 418 54,102 1,063,578 293,225 615,692
Australia 1,767,466 792,470 53,136 921,860
China 1,341,062 95,155 175,831 254,331 803,567 12,178 46,787
Chinese Taipei 63,328 15,893 9,779 5,156 21,885 411 414 9,791 9,232
India 245,149 72,885 89,074 17,500 46,116 18,663 7,826
Japan 1,407,918 1,266,038 37,842 92,932 11,107 207,086 615,692
Korea, Rep. of 375,831 54,417 78,108 22,402 79,705 42,581 98,618 22,273
New Zealand 47,602 4,918 3,462 33,190 4,258 1,774
Pakistan 4,795 1,766 9 524 1,794 7 694
Philippines 4,892 1,746 1,684 605 856 21
161,407 38,846 4,156 84,855 19,666 5,587 8,295
South Africa 161,407 38,846 4,156 84,855 19,666 5,587 8,295
Table 8
TOTAL NET ASSETS INCLUDING FUNDS OF FUNDS BY TYPE OF FUND, 2017:Q3Millions of Euros, end of quarter
TOTAL
Note: Components may not sum to total because of rounding or missing components. ETFs and Institutional Funds are included in the Totals and underlying categories. New Zealand and Trinidad and Tobago include home-and-foreign domiciled funds. An entry shown as zero indicates an amount that is less than 0.500 million.
Memo
Americas
Europe
Asia and Pacific
Africa
World
Other


Balanced/ Money Guaranteed/ Real Other InstitutionalEquity Bond Mixed Market Protected Estate Funds ETFs Funds
694,263 120,687 192,692 64,718 264,210 -2,623 9,233 45,357 106,585 63,894265,873 22,950 121,441 19,535 97,906 -44 4,085 76,372 4,067
Argentina 1,007 51 716 328 -88
Brazil 26,134 1,925 14,309 10,304 -3,310 -44 2,950 81 4,067
Canada 14,635 2,383 4,073 7,301 224 655 2,012
Chile 682 550 -718 353 523 -27 3
Costa Rica
Mexico 4,581 226 1,004 520 2,832
Trinidad & Tobago 35 0 32 2 0
United States 218,799 17,815 102,025 727 97,725 507 74,276
243,680 47,401 73,189 48,875 34,645 -2,570 6,207 35,932 12,140 37,713Austria 1,256 87 -604 1,870 -4 -50 131 -174 1,602
Belgium
Bulgaria 44 13 3 26 3 0 1
Croatia -561 -5 20 -26 -559 9
Cyprus 32 15 5 12
Czech Republic 281 59 -27 188 -21 0 48 34
Denmark 2,047 2,141 -1,012 889 -3 32
Finland 856 474 -417 613 47 -1 0 140 31
France 25,100 4,800 1,000 3,400 17,500 -1,600 -522
Germany 26,077 6,159 2,568 7,388 235 2 2,638 7,087 2,368 15,483
Greece 22 -7 15 0 78 -64 0
Hungary -41 39 -171 169 -257 -55 77 157 0 5
Ireland 66,797 10,092 30,420 1,003 9,426 401 15,454 10,303 15,369
Italy 3,881 151 -94 6,491 -33 -41 -2,594 -101
Liechtenstein 777 334 148 298 -72 5 64
Luxembourg 76,335 11,417 29,897 19,411 6,572 2,327 6,711 5,319
Malta 84 -177 27 32 -2 0 204 36
Netherlands 18,091 6,828 6,239 -184 557 4,651 36
Norway 1,967 675 1,149 57 41 45
Poland 981 -51 273 165 612 -19
Portugal -36 -5 122 32 -220 -102 137
Romania 73 6 16 12 2 -7 45 0
Slovakia 117 15 -2 98 -20 26 0
Slovenia 26 3 3 13 6 0
Spain 3,023 3,158 -1,052 880 -411 -626 1,074 0
Sweden 79 -346 -62 43 378 67 49
Switzerland 935 -1,732 1,115 388 1,039 133 -7 -121
Turkey 4 2 -186 27 99 -1 63 -5
United Kingdom 15,433 3,256 3,796 5,580 209 -89 -136 2,816
182,146 50,058 -2,008 -4,678 130,873 -9 2,944 4,978 18,073 22,114Australia
China 118,044 -1,711 -6,097 -8,715 135,424 -857 -853
Chinese Taipei -709 -158 635 21 -1,595 -9 -15 411 497
India 15,363 6,462 3,516 3,282 884 1,229 670
Japan 42,391 43,487 166 -1,749 488 15,976 22,114
Korea, Rep. of 5,299 1,849 -66 -493 -2,657 2,471 4,195 1,783
New Zealand 1,187 122 -110 1,225 -9 -40
Pakistan 389 -7 -1 25 333 0 40
Philippines 182 14 -51 -23 242 0
2,564 278 70 986 786 82 362South Africa 2,564 278 70 986 786 82 362
Table 9
TOTAL NET SALES INCLUDING FUNDS OF FUNDS BY TYPE OF FUND, 2017:Q3Millions of Euros, quarterly
TOTAL
Asia and Pacific
Africa
Note: Components may not sum to total because of rounding or missing components. ETFs and Institutional Funds are included in the Totals and underlying categories. New Zealand and Trinidad and Tobago include home-and-foreign domiciled funds. An entry shown as zero indicates an amount that is between $-0.499 million and $0.499 million.
Memo
World
Other
Americas
Europe

Balanced/ Money Guaranteed/ Real Other InstitutionalEquity Bond Mixed Market Protected Estate Funds ETFs Funds
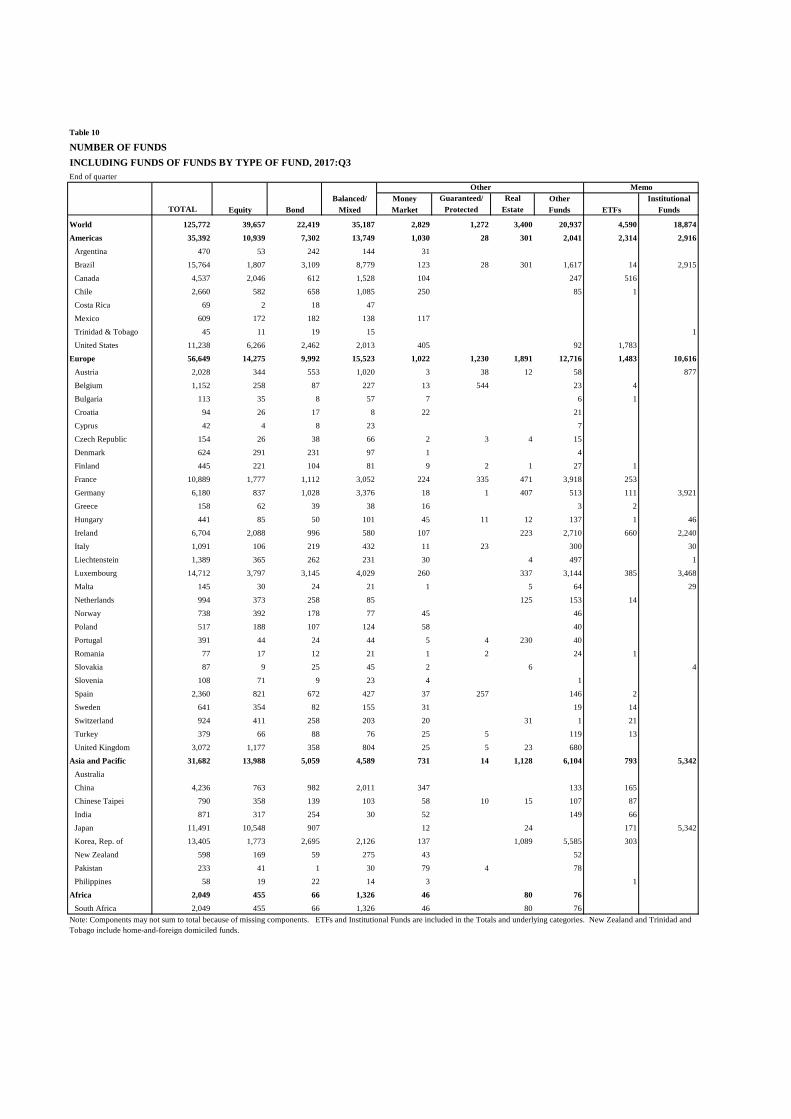
125,772 39,657 22,419 35,187 2,829 1,272 3,400 20,937 4,590 18,87435,392 10,939 7,302 13,749 1,030 28 301 2,041 2,314 2,916
Argentina 470 53 242 144 31
Brazil 15,764 1,807 3,109 8,779 123 28 301 1,617 14 2,915
Canada 4,537 2,046 612 1,528 104 247 516
Chile 2,660 582 658 1,085 250 85 1
Costa Rica 69 2 18 47
Mexico 609 172 182 138 117
Trinidad & Tobago 45 11 19 15 1
United States 11,238 6,266 2,462 2,013 405 92 1,783
56,649 14,275 9,992 15,523 1,022 1,230 1,891 12,716 1,483 10,616Austria 2,028 344 553 1,020 3 38 12 58 877
Belgium 1,152 258 87 227 13 544 23 4
Bulgaria 113 35 8 57 7 6 1
Croatia 94 26 17 8 22 21
Cyprus 42 4 8 23 7
Czech Republic 154 26 38 66 2 3 4 15
Denmark 624 291 231 97 1 4
Finland 445 221 104 81 9 2 1 27 1
France 10,889 1,777 1,112 3,052 224 335 471 3,918 253
Germany 6,180 837 1,028 3,376 18 1 407 513 111 3,921
Greece 158 62 39 38 16 3 2
Hungary 441 85 50 101 45 11 12 137 1 46
Ireland 6,704 2,088 996 580 107 223 2,710 660 2,240
Italy 1,091 106 219 432 11 23 300 30
Liechtenstein 1,389 365 262 231 30 4 497 1
Luxembourg 14,712 3,797 3,145 4,029 260 337 3,144 385 3,468
Malta 145 30 24 21 1 5 64 29
Netherlands 994 373 258 85 125 153 14
Norway 738 392 178 77 45 46
Poland 517 188 107 124 58 40
Portugal 391 44 24 44 5 4 230 40
Romania 77 17 12 21 1 2 24 1
Slovakia 87 9 25 45 2 6 4
Slovenia 108 71 9 23 4 1
Spain 2,360 821 672 427 37 257 146 2
Sweden 641 354 82 155 31 19 14
Switzerland 924 411 258 203 20 31 1 21
Turkey 379 66 88 76 25 5 119 13
United Kingdom 3,072 1,177 358 804 25 5 23 680
31,682 13,988 5,059 4,589 731 14 1,128 6,104 793 5,342Australia
China 4,236 763 982 2,011 347 133 165
Chinese Taipei 790 358 139 103 58 10 15 107 87
India 871 317 254 30 52 149 66
Japan 11,491 10,548 907 12 24 171 5,342
Korea, Rep. of 13,405 1,773 2,695 2,126 137 1,089 5,585 303
New Zealand 598 169 59 275 43 52
Pakistan 233 41 1 30 79 4 78
Philippines 58 19 22 14 3 1
2,049 455 66 1,326 46 80 76South Africa 2,049 455 66 1,326 46 80 76
Memo
World
Other
Table 10
NUMBER OF FUNDSINCLUDING FUNDS OF FUNDS BY TYPE OF FUND, 2017:Q3End of quarter
TOTAL
Americas
Europe
Asia and Pacific
Africa
Note: Components may not sum to total because of missing components. ETFs and Institutional Funds are included in the Totals and underlying categories. New Zealand and Trinidad and Tobago include home-and-foreign domiciled funds.

TOTAL NET ASSETS INCLUDING FUNDS OF FUNDS
Q1 Q2 Q3 Q4 Q1 Q2 Q3
36,689,486 38,146,771 39,592,644 41,474,895 43,378,915 42,508,506 43,282,781
19,647,441 20,637,087 21,218,620 22,641,222 23,627,783 22,757,690 23,039,485
Argentina 12,449 14,873 18,334 19,153 27,167 25,380 26,011
Brazil 1,143,449 1,355,765 1,393,003 1,544,316 1,706,704 1,552,794 1,675,029
Canada 1,105,763 1,172,624 1,199,338 1,259,148 1,391,105 1,370,927 1,393,708
Chile 35,598 38,263 43,653 43,842 48,299 46,429 47,464
Costa Rica 2,436 2,266 2,387 2,181 2,533 2,169 2,193
Mexico 99,879 100,995 95,860 92,049 101,302 101,118 103,233
Trinidad & Tobago 6,036 6,138 6,125 6,433 6,906 6,510 6,234
United States 17,241,831 17,946,163 18,459,920 19,674,100 20,343,767 19,652,363 19,785,613
12,655,639 12,893,934 13,321,111 13,721,563 14,361,600 14,459,324 14,823,846
Austria 166,856 168,492 173,271 173,798 176,513 177,285 179,514
Belgium 125,493 120,290 120,611 126,760 133,795 135,637 137,327
Bulgaria 410 437 470 523 551 573 623
Croatia 1,870 2,037 2,243 2,439 2,445 2,420 2,471
Cyprus 59 71 218 235 861 1,053 1,041
Czech Republic 8,106 8,345 8,800 9,211 9,766 10,453 10,922
Denmark 106,872 107,162 112,353 117,455 119,296 122,138 125,857
Finland 95,601 97,182 102,511 106,395 110,001 111,561 113,642
France 1,666,959 1,680,868 1,729,240 1,783,830 1,880,168 1,872,566 1,931,969
Germany 1,758,230 1,804,731 1,864,388 1,883,106 1,934,658 1,962,650 2,009,957
Greece 4,157 4,153 4,214 4,347 4,429 4,779 4,720
Hungary 16,265 15,886 16,328 16,822 17,297 17,711 17,761
Ireland 1,830,709 1,916,901 1,944,220 2,084,748 2,204,913 2,230,807 2,297,883
Italy 229,976 232,331 239,405 242,370 247,276 248,415 254,163
Liechtenstein 40,300 41,072 41,862 44,103 44,794 45,054 45,243
Luxembourg 3,395,404 3,461,904 3,621,929 3,701,076 3,906,027 3,943,598 4,037,140
Malta 3,072 3,139 2,951 2,607 2,597 2,699 2,813
Netherlands 675,883 703,938 726,929 732,367 738,136 744,521 766,744
Norway 95,384 98,699 105,680 108,108 113,385 112,824 118,527
Poland 31,013 29,181 31,077 29,271 31,425 32,994 33,843
Portugal 22,314 21,616 21,414 21,630 22,184 22,586 22,775
Romania 4,700 4,659 4,976 4,812 4,862 4,953 5,030
Slovakia 5,573 5,589 5,730 5,887 6,022 6,199 6,347
Slovenia 2,217 2,264 2,367 2,464 2,586 2,548 2,615
Spain 247,646 249,182 258,465 266,413 276,373 282,045 286,400
Sweden 276,154 275,395 286,523 304,491 321,783 325,069 332,568
Switzerland 430,670 454,891 464,320 468,993 490,919 489,317 475,692
Turkey 11,603 12,367 12,279 11,647 11,354 11,349 11,125
United Kingdom 1,402,143 1,371,152 1,416,337 1,465,655 1,547,184 1,535,520 1,589,134
4,251,320 4,474,134 4,898,044 4,948,772 5,219,231 5,126,500 5,258,043
Australia 1,416,510 1,467,709 1,671,876 1,699,839 1,812,779 1,776,610 1,767,466
China 1,025,052 1,039,749 1,127,655 1,164,538 1,163,536 1,209,043 1,341,062
Chinese Taipei 59,035 62,043 61,972 62,319 66,234 63,859 63,328
India 140,430 160,766 189,415 206,657 227,693 236,141 245,149
Japan 1,225,399 1,338,708 1,412,687 1,395,418 1,486,058 1,400,978 1,407,918
Table 11
Millions of Euros
2016 2017
Americas
Europe
Asia and Pacific
World

Korea, Rep. of 338,028 354,521 379,815 363,690 404,594 382,129 375,831
New Zealand 38,177 41,758 45,464 46,127 47,722 47,921 47,602
Pakistan 4,055 4,055 4,591 5,539 5,816 5,025 4,795
Philippines 4,634 4,825 4,569 4,645 4,799 4,794 4,892
135,086 141,616 154,869 163,338 170,301 164,992 161,407
South Africa 135,086 141,616 154,869 163,338 170,301 164,992 161,407Note: New Zealand and Trinidad and Tobago include home-and-foreign domiciled funds. ETFs and Institutional funds are included in the totals. An entry shown as zero is less than .500 million.
Africa
TOTAL NET SALES INCLUDING FUNDS OF FUNDS
Q1 Q2 Q3 Q4 Q1 Q2 Q3
155,024 207,979 432,908 388,663 612,760 573,800 694,263
105,402 23,506 105,567 180,999 238,766 189,867 265,873
Argentina -1,003 1,470 2,872 -476 6,407 317 1,007
Brazil 8,056 1,104 9,440 11,952 33,130 5,083 26,134
Canada 21,089 13,300 14,925 28,702 28,459 24,023 14,635
Chile -1,582 1,189 4,923 -1,692 3,664 1,252 682
Costa Rica -474
Mexico 1,418 3,510 -494 -3,894 -34 1,686 4,581
Trinidad & Tobago -4 -27 25 23 13 -47 35
United States 77,428 2,960 73,876 146,858 167,127 157,553 218,799
39,273 113,546 171,343 125,215 254,211 241,004 243,680
Austria -1,202 363 1,180 119 602 656 1,256
Belgium
Bulgaria 6 26 26 44 22 19 44
Croatia 41 203 372 560 -15 -590 -561
Cyprus 0 9 14 18 0 16 32
Czech Republic 240 213 315 424 386 383 281
Denmark 233 2,173 2,521 2,648 1,572 2,511 2,047
Finland -371 474 1,773 1,770 972 1,381 856
France 17,200 -11,400 11,400 12,200 54,500 -13,100 25,100
Germany 30,774 24,836 20,333 34,717 31,515 23,553 26,077
Greece -130 -33 5 -109 2 2 22
Hungary -474 -295 -124 105 338 365 -41
Ireland -1,628 57,123 28,182 55,738 71,838 89,622 66,797
Italy -1,440 1,960 3,859 4,087 2,747 4,842 3,881
Liechtenstein -875 -297 -39 675 355 777 777
Luxembourg -15,310 30,145 78,887 5,027 75,016 76,488 76,335
Malta -282 70 -157 -149 -27 75 84
Netherlands 8,927 5,619 7,914 -11,145 -16,758 16,583 18,091
Norway 1,795 962 1,515 -111 3,200 2,452 1,967
Poland -344 -293 422 -1,549 456 547 981
Portugal -330 -700 -53 161 318 331 -36
Romania 1 -28 137 -39 38 51 73
Slovakia -104 -34 88 147 73 163 117
Slovenia -15 3 13 13 20 -3 26
Spain -618 2,633 6,440 5,789 6,044 6,080 3,023
Sweden -433 210 292 3,207 2,310 3,571 79
Switzerland 5,550 6,046 2,132 1,840 3,019 7,251 935
Turkey -460 564 295 267 18 90 4
United Kingdom -1,478 -7,006 3,601 8,761 15,650 16,888 15,433
8,670 68,548 151,666 79,747 117,417 140,258 182,146
Australia
China -25,069 20,122 80,379 35,148 55,793 120,582 118,044
Chinese Taipei -704 1,185 -2,481 -1,619 262 163 -709
India -6,104 12,320 20,452 11,797 3,642 16,444 15,363
Japan 22,685 19,979 44,674 37,898 45,852 -317 42,391
Table 12
Millions of Euros
2016 2017
Americas
Europe
Asia and Pacific
World

Korea, Rep. of 17,226 14,290 6,929 -4,445 11,003 2,863 5,299
New Zealand 480 802 1,552 621 396 402 1,187
Pakistan 131 -163 248 183 323 -51 389
Philippines 25 13 -87 164 146 172 182
1,679 2,379 4,332 2,702 2,366 2,671 2,564
South Africa 1,679 2,379 4,332 2,702 2,366 2,671 2,564Note: New Zealand and Trinidad and Tobago include home-and-foreign domiciled funds. ETFs and Institutional funds are included in the totals. An entry shown as zero indicates an amount that is between $-0.499 million and $0.499 million.
Africa

NUMBER OF FUNDS INCLUDING FUNDS OF FUNDS
Q1 Q2 Q3 Q4 Q1 Q2 Q3
117,800 119,124 120,399 121,487 123,475 124,750 125,772
33,019 33,245 33,405 33,654 34,597 35,038 35,392
Argentina 357 366 376 420 430 447 470
Brazil 14,458 14,615 14,632 14,803 15,150 15,445 15,764
Canada 3,881 3,907 3,952 3,963 4,427 4,524 4,537
Chile 2,476 2,452 2,507 2,539 2,567 2,625 2,660
Costa Rica 64 66 67 69 70 71 69
Mexico 569 571 579 587 597 607 609
Trinidad & Tobago 44 44 44 44 45 45 45
United States 11,170 11,224 11,248 11,229 11,311 11,274 11,238
55,115 55,179 55,390 55,455 56,029 56,336 56,649
Austria 2,070 2,054 2,052 2,031 2,033 2,041 2,028
Belgium 1,351 1,252 1,213 1,163 1,152 1,132 1,152
Bulgaria 107 109 113 111 112 113 113
Croatia 85 85 87 89 92 93 94
Cyprus 22 22 29 30 37 38 42
Czech Republic 146 148 146 144 144 149 154
Denmark 587 586 583 595 613 635 624
Finland 458 455 458 459 459 449 445
France 11,050 11,051 10,975 10,952 10,880 10,938 10,889
Germany 5,930 5,938 5,983 6,001 6,093 6,120 6,180
Greece 160 159 160 158 159 157 158
Hungary 455 452 454 446 460 446 441
Ireland 6,242 6,266 6,343 6,470 6,541 6,603 6,704
Italy 939 968 987 1,019 1,026 1,065 1,091
Liechtenstein 1,270 1,302 1,320 1,352 1,360 1,374 1,389
Luxembourg 14,179 14,208 14,283 14,211 14,586 14,674 14,712
Malta 129 124 125 128 134 140 145
Netherlands 1,039 1,030 1,030 1,014 1,014 1,030 994
Norway 684 691 720 720 715 726 738
Poland 490 508 516 520 501 512 517
Portugal 428 420 412 408 404 397 391
Romania 74 76 76 75 75 74 77
Slovakia 88 89 89 87 86 88 87
Slovenia 114 115 116 105 107 107 108
Spain 2,255 2,290 2,325 2,342 2,362 2,353 2,360
Sweden 545 570 572 592 613 628 641
Switzerland 905 906 905 899 903 918 924
Turkey 400 390 399 396 390 384 379
United Kingdom 2,913 2,915 2,919 2,938 2,978 2,952 3,072
27,909 28,883 29,707 30,412 30,881 31,363 31,682
Australia
China 2,723 2,909 3,168 3,564 3,852 4,022 4,236
Chinese Taipei 689 699 712 725 747 766 790
India 870 870 870 865 870 869 871
2016 2017
Table 13
World
Americas
Europe
Asia and Pacific
Japan 10,035 10,367 10,711 10,915 11,120 11,249 11,491
Korea, Rep. of 12,761 13,194 13,366 13,463 13,408 13,558 13,405
New Zealand 579 586 619 615 616 615 598
Pakistan 197 201 204 208 211 227 233
Philippines 55 57 57 57 57 57 58
1,757 1,817 1,897 1,966 1,968 2,013 2,049
South Africa 1,757 1,817 1,897 1,966 1,968 2,013 2,049
Africa
Note: New Zealand and Trinidad and Tobago include home-and-foreign domiciled funds. ETFs and Institutional funds are included in the totals.


![CENSUS 2011 - Statistical Release [P030142011]](https://static.fdocuments.us/doc/165x107/577cdaf31a28ab9e78a6f8f6/census-2011-statistical-release-p030142011.jpg)