A Dynamic Macroeconomic Model for the US Telecommunications
20
1 A Dynamic Macroeconomic Model for the US Telecommunications Industry 1 Elias Aravantinos, Stevens Institute of Technology, Wesley J. Howe School of Management, Hoboken, NJ, USA 2 Dr. Fotios Harmantzis, Stevens Institute of Technology, Wesley J. Howe School of Management, Hoboken, NJ, USA ABSTRACT Dynamic models have been used in most businesses serving different purposes. The increased changes of the Telecommunications environment have created a dynamic industry emerging new dynamic economic models. We investigated the Telecom industry by conducting macroeconomic and infrastructure analysis. However, this paper uses recent data from the Telecommunications industry to reveal the infrastructure trends and predict the US wireless growth. The analysis is focused on several factors such as the infrastructure described by the Teledensity, the employment and the Telecom revenues in comparison with the Gross Domestic Product (GDP). The purpose of this analysis is to understand the industrys behavior during a specific period of time, 1984-2003, propose an appropriate economic dynamic model, wireless oriented that identifies the current driving forces and detects the impact of some critical events and trends. Keywords: Dynamic Economic Model, Macroeconomic Analysis, Telecom Act, Teledensity INTRODUCTION The US Telecommunications sector is going through several changes (Fransman 2002). The first and fundamental reason is the rapid technological change in the Telecommunications and computer-based services. The Telecommunication Act which follows is the most important event in Telecom that established a new era with changes and surprises for the Telecom incumbents. The 1996 Act, took about six years to pass without including the numerous follow-up rule-makings (Noam 2002). The intent of the 1996 Act was to promote competition and the public interest, on the fundamental assumption that competitive markets would emerge. Economides (Economides 2004) is pointing out the major driving forces in US Telecommunications today, such as dramatic and continuing reductions in the costs of transmission and switching, digitization, move of value from underlying services (transmission and switching) to interfaces and content and the existence of network effects. These effects are seen to be associated with a connection to a large network, which is more valuable for each customer considering the fact that small networks if unable to reach critical mass are unlikely to survive. The bubble that the industry experienced in 2001 was a shock, driving the companies to over-invest, expecting a potential high growth according to the markets analysts predictions. The result was less demand than predicted and high debt for the companies, hard to handle. The following overview of the Telecom industry as follows is showing a snapshot of the bubbles bursting impact. Since the beginning of the year 2000 (Atkinson 2001; and Noam 2003), the US industry alone has shed in excess of 130,000 jobs, lost over $1 trillion in stock market capitalization, and endured a continuous stream of bankruptcies. Losses have been much greater than for the savings and loan debacle of the late 1980s. And parts of the industry are mired in scandal. Worldwide, the Telecom industry has accumulated over $1 trillion in debt; investments have virtually come to a standstill; and stock values have declined by $4 trillion (Atkinson 2001). The total Industrys spending rose during the period 1999-2001 of a rate of 24,85% due to the large investments. The Telecom Services Companies did not generate the revenues needed to pay for the equipment they had bought and were trapped in high debt and bankruptcy issues. Some company officers resorted to misleading and illegal practices to hide these disappointing results (Harmantzis, 2004). Total spending in the U.S. telecommunications industry rose 7.9 percent in 2004 to an estimated $784.5 billion a 1 Do not cite without permission 2 Contact author: Elias Aravantinos, PhD student in Technology Management, [email protected] brought to you by CORE View metadata, citation and similar papers at core.ac.uk provided by Research Papers in Economics
Transcript of A Dynamic Macroeconomic Model for the US Telecommunications

1
A Dynamic Macroeconomic Model for the US Telecommunications Industry1
Elias Aravantinos, Stevens Institute of Technology, Wesley J. Howe School of Management, Hoboken, NJ,
USA2 Dr. Fotios Harmantzis, Stevens Institute of Technology, Wesley J. Howe School of Management, Hoboken,
NJ, USA
ABSTRACT
Dynamic models have been used in most businesses serving different purposes. The increased changes of the
Telecommunications environment have created a dynamic industry emerging new dynamic economic models. We investigated the Telecom industry by conducting macroeconomic and infrastructure analysis. However, this paper uses recent data from the Telecommunications industry to reveal the infrastructure trends and predict the US wireless growth. The analysis is focused on several factors such as the infrastructure described by the Teledensity, the employment and the Telecom revenues in comparison with the Gross Domestic Product (GDP). The purpose of this analysis is to understand the industry�s behavior during a specific period of time, 1984-2003, propose an appropriate economic dynamic model, wireless oriented that identifies the current driving forces and detects the impact of some critical events and trends. Keywords: Dynamic Economic Model, Macroeconomic Analysis, Telecom Act, Teledensity
INTRODUCTION
The US Telecommunications sector is going through several changes (Fransman 2002). The first and fundamental reason is the rapid technological change in the Telecommunications and computer-based services. The Telecommunication Act which follows is the most important event in Telecom that established a new era with changes and surprises for the Telecom incumbents. The 1996 Act, took about six years to pass without including the numerous follow-up rule-makings (Noam 2002). The intent of the 1996 Act was to promote competition and the public interest, on the fundamental assumption that competitive markets would emerge. Economides (Economides 2004) is pointing out the major driving forces in US Telecommunications today, such as dramatic and continuing reductions in the costs of transmission and switching, digitization, move of value from underlying services (transmission and switching) to interfaces and content and the existence of network effects. These effects are seen to be associated with a connection to a large network, which is more valuable for each customer considering the fact that small networks if unable to reach critical mass are unlikely to survive.
The �bubble� that the industry experienced in 2001 was a shock, driving the companies to over-invest,
expecting a potential high growth according to the markets analysts predictions. The result was less demand than predicted and high debt for the companies, hard to handle. The following overview of the Telecom industry as follows is showing a snapshot of the �bubble�s� bursting impact. Since the beginning of the year 2000 (Atkinson 2001; and Noam 2003), the US industry alone has shed in excess of 130,000 jobs, lost over $1 trillion in stock market capitalization, and endured a continuous stream of bankruptcies. Losses have been much greater than for the savings and loan debacle of the late 1980s. And parts of the industry are mired in scandal. Worldwide, the Telecom industry has accumulated over $1 trillion in debt; investments have virtually come to a standstill; and stock values have declined by $4 trillion (Atkinson 2001). The total Industry�s spending rose during the period 1999-2001 of a rate of 24,85% due to the large investments. The Telecom Services Companies did not generate the revenues needed to pay for the equipment they had bought and were trapped in high debt and bankruptcy issues. Some company officers resorted to misleading and illegal practices to hide these disappointing results (Harmantzis, 2004). Total spending in the U.S. telecommunications industry rose 7.9 percent in 2004 to an estimated $784.5 billion � a
1 � Do not cite without permission� 2 Contact author: Elias Aravantinos, PhD student in Technology Management, [email protected]
brought to you by COREView metadata, citation and similar papers at core.ac.uk
provided by Research Papers in Economics
2
significant improvement from gains of 3.6 percent in 2003 and 1.9 percent in 2002 � according to the Telecommunications Industry Association . (TIA's 2005 Telecommunications Market Review and Forecast)
The dynamic environment and the fluctuating volatility of the Telecom industry is encouraging the
development of new dynamic economic models. These models could serve several purposes, such as studying the impact of important events such as the Telecom Act and the infrastructure trends. �Dynamic models try to reflect changes in time and take into account model components that are constantly changing as a result of previous actions or future expectations� (Ruth 1997). The scope of Dynamic Economics according to Hicks is that �a dynamic condition is the opposite of the static condition, when the key variables are changing, and the dynamic theory is the analysis of the processes, by which they change�(Hicks 1985). Hence, economic modeling is at the heart of economic theory. Modeling provides a logical, abstract template to help organize the analyst's thoughts. Through the use of a model, we could produce different scenarios, attempting to evaluate the effect of alternative policy options, or weighing the logical integrity of arguments presented in prose. Scenarios have two essential purposes: to change the way people think and to envision the future. A model usually helps isolate and sort out complicated chains of cause and effect, and influences between the numerous interacting elements in an economy. Certain types of models are extremely useful for visually presenting the essence of economic arguments. The visual appeal of a model clarifies the exposition.
The Telecom industry was suffering shocks, discontinuities and changes preceding and after the �bubble� period
during the years 1990-2002. The production and consumption of Telecommunication services was becoming less predictable and more volatile, as downturns in demand and investment occur. Telecommunications firms, once operating in fairly predicable markets with long planning horizons, must now be managed as cyclical industries. Business cycles are recurring changes in the level of business and economic activity over time (Steven 1997). This business activity is measured via Real Income calculations, specifically Real GDP (RGDP). Quite often these cycles occur because spending in the economy differs from the ability of the economy to produce goods and services. One business cycle is defined as a period of economic decline or a contraction followed by a longer expansionary period. The phenomenon of business cycle in the Telecom industry seems to be new (Noam 2002b). The industry used to be less volatile than the whole economy. Noam argues that the emerging cyclicality continues to have an impact on Telecom companies, investments, and government. It is claimed that there is relation between the cycles and the GDP (Zanowitz 1992). Growth cycles are deviations of GDP from a long-run trend. Business cycles are upward and downward movements of the levels of GDP, but not deviation from a trend.
Economic analysis is used to help a country, firm or individual allocate scarce resources in order to optimize
efficiency. Telecommunications have been considered an essential factor of production for the output of a country, and both a catalyst and product of economic growth. There are two distinct analytical approaches conducted to review the impact of Telecommunications on economic development. One is macro-economic in orientation and the other is infrastructure in orientation. Both approaches have distinct advantages and disadvantages and can be used in complementary ways. Macro-economics studies are designed to present an overview of the economy based on national statistical data. Infrastructure studies are designed to identify the technological trends and the economic impact of the different Telecommunications services.
The Telecom industry economic analysis intends to introduce the status of the industry and isolate the parameters with the negative effect. The presented analysis describes macroeconomic factors, for example: employment, GDP and Consumer Price Index (CPI). The purpose of the analysis is to identify the key industrial parameters for the dynamic macroeconomic model (DMM). The CPI is a measure of the average change in prices over time in a market basket of goods and services. The Price Index for Gross Domestic Product measures the change in the average level of the prices paid for goods and services produced in the U.S. The GDP price index is useful for measuring real growth in the general economy. Deflation is defined as a sustained decline in an aggregate measure of prices such as the consumer price index or the GDP deflator. GDP is the market value of all final goods and services produced within a country during a given time period. Moreover we present an infrastructure analysis based on the Teledensity for several countries in 2003. The Teledensity is the number of telephones per 100 residents. The telephony density might be inflated by the number of the Internet users, that continue to use wireline telephony circuits, an issue, that is discussed extensively. In the case of Internet and wireless it is the number of subscribers per 100 residents.
3
To explore the extent of our problem and seek clearer understanding of the relationships, we conducted two experiments with the same variables, applying linear and log-linear regression analysis respectively. We conclude that the log-linear model is describing better the Telecom Industry, while the linear model is describing the whole industry and economy in a broader view. The DMM aims to describe and explain the infrastructure needs as a comparison with the GDP of the economy and the Telecom Act. Using data from on-line sources and databases as dynamic model input for the period 1984-2003, we explained and predicted the future industry growth and services. There is a negative impact detected on the wireless growth from the Telecom Act. Moreover the telephone service is overall constant with rather declining trends. The contribution of this paper is that it expresses our first attempt to predict the wireless growth as an dependent variable identifying the relationships with Economic and Telecom variables.
This paper provides a glimpse at the infrastructure trends in the USA and other countries. It is organized as
follows. In Section 2, we describe the related work, highlighting the potential economic models that could serve the evolving Telecom industry and giving an overview of DMM�s key factors. In Section 3, we suggest and discuss a macroeconomic industrial version of Porter�s Five Forces model. Section 4 provides an economic analysis of the Telecom industry. Section 5 presents the design, implementation and results of the DMM, quantitative and qualitative approach. We close the paper in Section 6, with our conclusions and future work.
RELATED WORK
Recent studies (Madden and Savage, 1998; and Röller et al.2002) were conducted on the relationship of
Telecommunications infrastructure or investment to economic activity. The data consist of many countries, but neither study considers the unique relationship within the U.S. Average effects were measured using many diverse economies, but may not hold for any particular economy in the sample. A U.S. specific analysis focused on infrastructure and targeting the Telecommunications investment can provide more insight for domestic policies, strategies, allocation resources and investment decisions. Most of the studies are focusing on the telephony but not on the wireless growth. We follow the same metrics used in the previous studies such as Teledensity etc. A long series of studies, initiated first by Jipp (1963), demonstrated the positive relationship between measures of GDP per capita and telephone density indicators. From similar studies (Alleman et al, 1994; and Jeunhomme , Gwenaëlle C., 2000), the telephone density is assumed to be related to GDP per capita by the following relationship:
titi bYaD ,, **= or (1)
titi YbaD ,, log*log += (2)
Di,t is the telephone density and Yi,t is the GDP for the country in year t, respectively; a is the intercept and b is the slope, an indication of the relationship between telephone density relative to GDP. We only argue with the related papers of the last decade because these papers are closer to today�s industry profile. In 2000 a Master thesis was developed in MIT (Jeunhomme , Gwenaëlle C., 2000) based on the Jipp curve, aimed to develop a tool for cross-country comparisons in Telecommunications development. Such comparisons could help evaluate the needs in infrastructure and the opportunities in Telecommunication services in individual countries. One of the author�s major difficulties was the lack of reliable and relevant data about the Internet in 1997. Thus, the authors compared fixed and mobile telephony. According to our methodology and model hypotheses we preferred to evaluate the Internet as part of the telephony. We faced the same difficulties of defining Telecom metrics and determining how to measure broadband and DSL lines. We believe that the best approach to our problem involves evaluating different services having GDP as a common endogenous variable and conduct multiple linear regression, rather than single linear regression. We identified the interactions in the dynamic Telecom industry focusing on the wireless growth in a different time period, 1984-2003. We expand equations (1) and (2) adding Telecom and Economic indicators.
PORTER�S TELECOM INDUSTRIAL MODEL
Porter�s Five Forces Model is an ideal model for industry analysis (Porter 1980). The rise of the Internet and of various e-business applications has strongly influenced nearly all industries. Although there are many dynamic changes in today�s industry, this model is still a helpful framework to understand the Telecom industry.
4
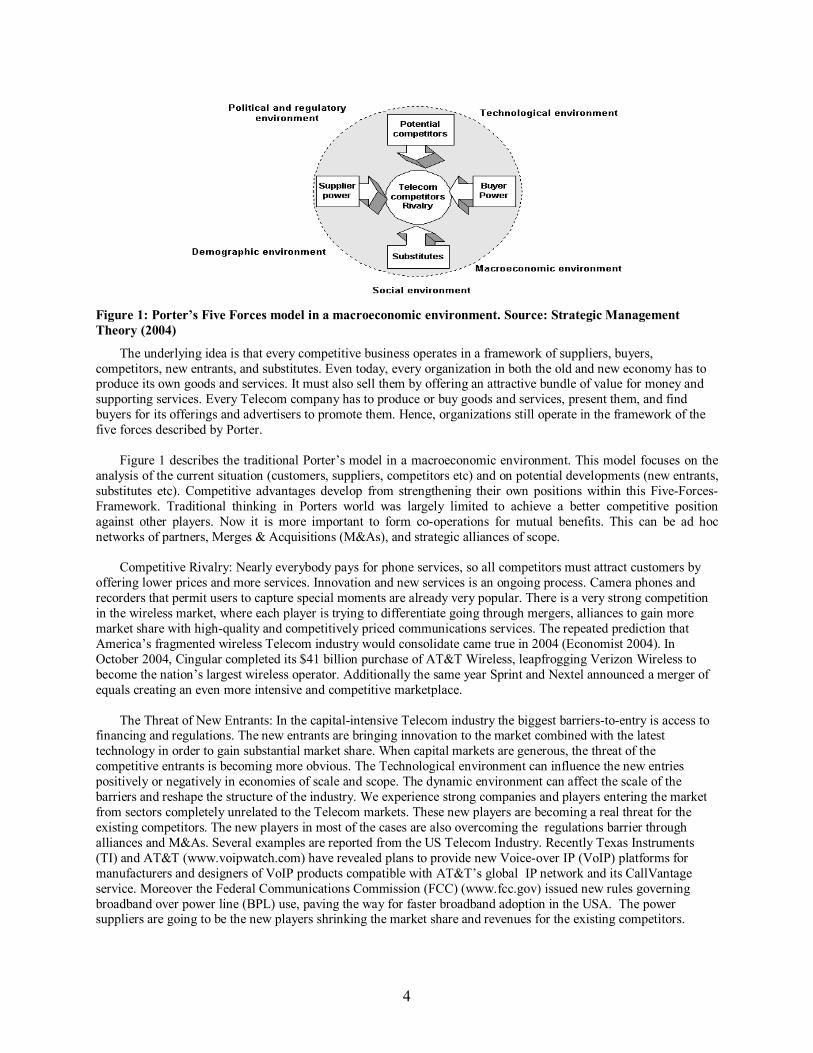
Figure 1: Porter�s Five Forces model in a macroeconomic environment. Source: Strategic Management Theory (2004)
The underlying idea is that every competitive business operates in a framework of suppliers, buyers, competitors, new entrants, and substitutes. Even today, every organization in both the old and new economy has to produce its own goods and services. It must also sell them by offering an attractive bundle of value for money and supporting services. Every Telecom company has to produce or buy goods and services, present them, and find buyers for its offerings and advertisers to promote them. Hence, organizations still operate in the framework of the five forces described by Porter.
Figure 1 describes the traditional Porter�s model in a macroeconomic environment. This model focuses on the
analysis of the current situation (customers, suppliers, competitors etc) and on potential developments (new entrants, substitutes etc). Competitive advantages develop from strengthening their own positions within this Five-Forces-Framework. Traditional thinking in Porters world was largely limited to achieve a better competitive position against other players. Now it is more important to form co-operations for mutual benefits. This can be ad hoc networks of partners, Merges & Acquisitions (M&As), and strategic alliances of scope.
Competitive Rivalry: Nearly everybody pays for phone services, so all competitors must attract customers by
offering lower prices and more services. Innovation and new services is an ongoing process. Camera phones and recorders that permit users to capture special moments are already very popular. There is a very strong competition in the wireless market, where each player is trying to differentiate going through mergers, alliances to gain more market share with high-quality and competitively priced communications services. The repeated prediction that America�s fragmented wireless Telecom industry would consolidate came true in 2004 (Economist 2004). In October 2004, Cingular completed its $41 billion purchase of AT&T Wireless, leapfrogging Verizon Wireless to become the nation�s largest wireless operator. Additionally the same year Sprint and Nextel announced a merger of equals creating an even more intensive and competitive marketplace.
The Threat of New Entrants: In the capital-intensive Telecom industry the biggest barriers-to-entry is access to
financing and regulations. The new entrants are bringing innovation to the market combined with the latest technology in order to gain substantial market share. When capital markets are generous, the threat of the competitive entrants is becoming more obvious. The Technological environment can influence the new entries positively or negatively in economies of scale and scope. The dynamic environment can affect the scale of the barriers and reshape the structure of the industry. We experience strong companies and players entering the market from sectors completely unrelated to the Telecom markets. These new players are becoming a real threat for the existing competitors. The new players in most of the cases are also overcoming the regulations barrier through alliances and M&As. Several examples are reported from the US Telecom Industry. Recently Texas Instruments (TI) and AT&T (www.voipwatch.com) have revealed plans to provide new Voice-over IP (VoIP) platforms for manufacturers and designers of VoIP products compatible with AT&T�s global IP network and its CallVantage service. Moreover the Federal Communications Commission (FCC) (www.fcc.gov) issued new rules governing broadband over power line (BPL) use, paving the way for faster broadband adoption in the USA. The power suppliers are going to be the new players shrinking the market share and revenues for the existing competitors.

5
Regulation plays a major role in the industry, since all the operators should receive approval and licensing either for spectrum expansion or new services.
Power of Suppliers: In order for the Telecom operators to exist and serve the demand of transmitting voice and
data, high-tech broadband switching equipment, fiber optic channels, cellular devices are required. Today�s business society and transactions rely on Telecom and Information Technology (IT) services and the potential danger of a mistake can be catastrophic. It is strongly believed that there is an aggressive competition between suppliers and competitors; This emerges, when suppliers become competitors. It is very straightforward, that without high-tech broadband switching equipment, fibre-optic channels and cellular devices, Telecom operators would not be able to exist and serve the demand of transmitting voice and data. According to several studies (Ling et al. 2002; Seaberg et al. 1997) it is strongly believed that there is an aggressive competition between suppliers and operators in the �datacom space�. �On the one hand incumbents like British Telecom have invested in IP networks aiming to provide a broader range of services, reducing costs, and entering new markets.� �On the other, the equipment suppliers are acquiring companies and providing new technologies; they are trying to retain competitiveness through accessing the latest technology and also providing a broader range of technological options to their customers� (Ling et al. 2002).
The Power of Buyers is rising due to the increased choice of Telecom products and services and also the
increased competition. The operators, Internet Service Providers (ISPs) for example should offer the latest cost-effective technology and support the most advanced and reliable services in order to be attractive to the customers. The Buyers could be individuals, businesses or large organizations. They still have the advantage to choose the low cost supplier, or the one that best matches their needs and cost. The overall Buyer�s decision is also influenced by macroeconomic factors, for example the growth rate of the economy , interest rates, inflation and currency exchange rates. High inflation with high volatility is a threat for the companies creating a very insecure and difficult to predict environment. Currency exchange rates are also very critical, because most of the companies are trading and importing their products in a global market.
Availability of Substitutes - Products and services from non-traditional Telecom industries pose serious
substitution threats. Cable TV and satellite operators compete for buyers. Wireless and VoIP threaten to substitute for traditional telephony. The substitutes are usually influenced by social trends and events, such as economic crises, saturated markets that are open to new trends and products. The demographic factor describes the characteristics of population segments, and then identifies the consumer markets and the needs for substitutes. Telecom companies are more young age oriented, approaching trends and preferences of the young population. This mass is getting more excited with the new cellular and Internet services than with the traditional telephony. The interactivity and depth of the Internet with the convenience and freedom of the mobile telephony have become the major features of our living style. The convergence of this superior technology is adding an invaluable dimension to modern life as it enables a unique service platform for any urgent, private and sudden service needs. There is also an almost universal desire to avoid personal contact, witnessing the popularity of any kind of impersonal invention, from email to automatic teller machines, and it is clear that alienation could prove a serious side effect of a technology. The technology�s selling point often has focused on slogans such as �It�s about communications between people� or �Connecting People�.
ECONOMIC ANALYSIS OF THE TELECOM INDUSTRY
The economic analysis is separated in two parts. The first part contains a macroeconomic US industrial analysis
of Telecom based on the suggested Bureau of Economic Analysis methodology (Moyer 2004). The second part contains a Telecom infrastructure analysis of three sectors, wireless, telephony and Internet compared to the GDP/capita. The second part adds a global profile to the analysis, since it investigates the infrastructure of several nations in different continents for 2003. The main reason is to compare the US infrastructure with the rest and make significant conclusions about the performance. Moreover we would like to investigate if the Telecom Act has any influence on the US performance and productivity comparing to the rest of the world and especially with countries that have similar GDP.
6
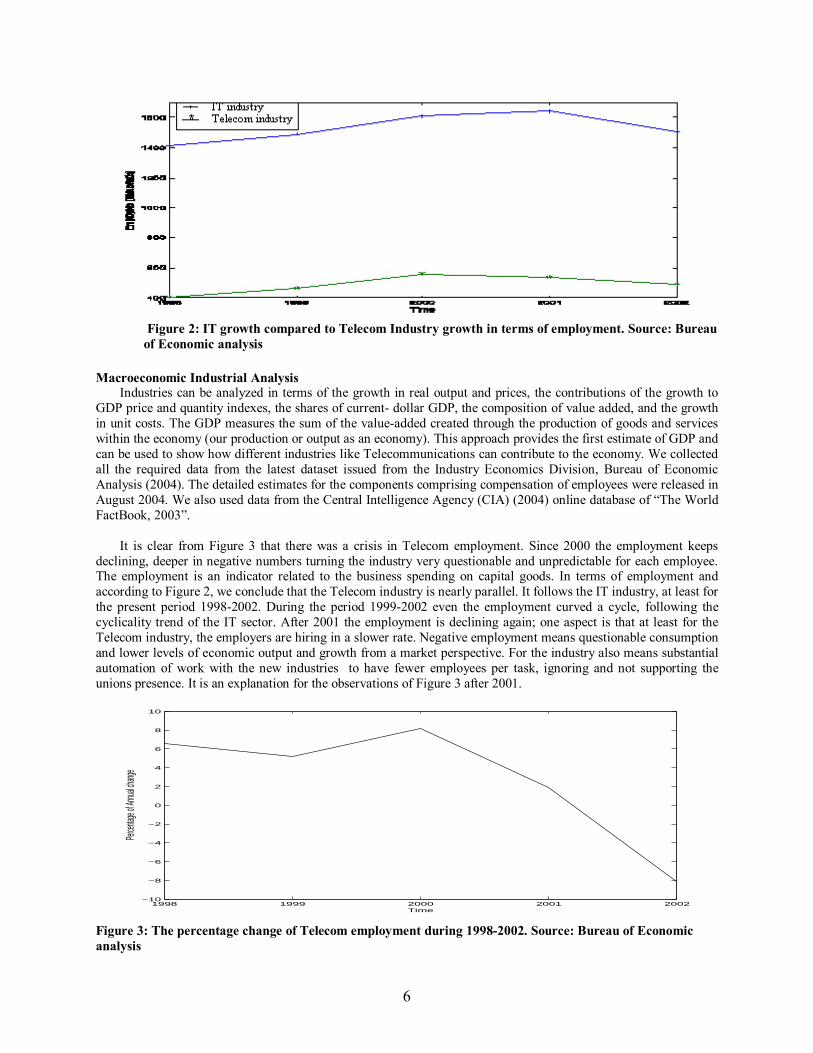
Figure 2: IT growth compared to Telecom Industry growth in terms of employment. Source: Bureau of Economic analysis
Macroeconomic Industrial Analysis
Industries can be analyzed in terms of the growth in real output and prices, the contributions of the growth to GDP price and quantity indexes, the shares of current- dollar GDP, the composition of value added, and the growth in unit costs. The GDP measures the sum of the value-added created through the production of goods and services within the economy (our production or output as an economy). This approach provides the first estimate of GDP and can be used to show how different industries like Telecommunications can contribute to the economy. We collected all the required data from the latest dataset issued from the Industry Economics Division, Bureau of Economic Analysis (2004). The detailed estimates for the components comprising compensation of employees were released in August 2004. We also used data from the Central Intelligence Agency (CIA) (2004) online database of �The World FactBook, 2003�.
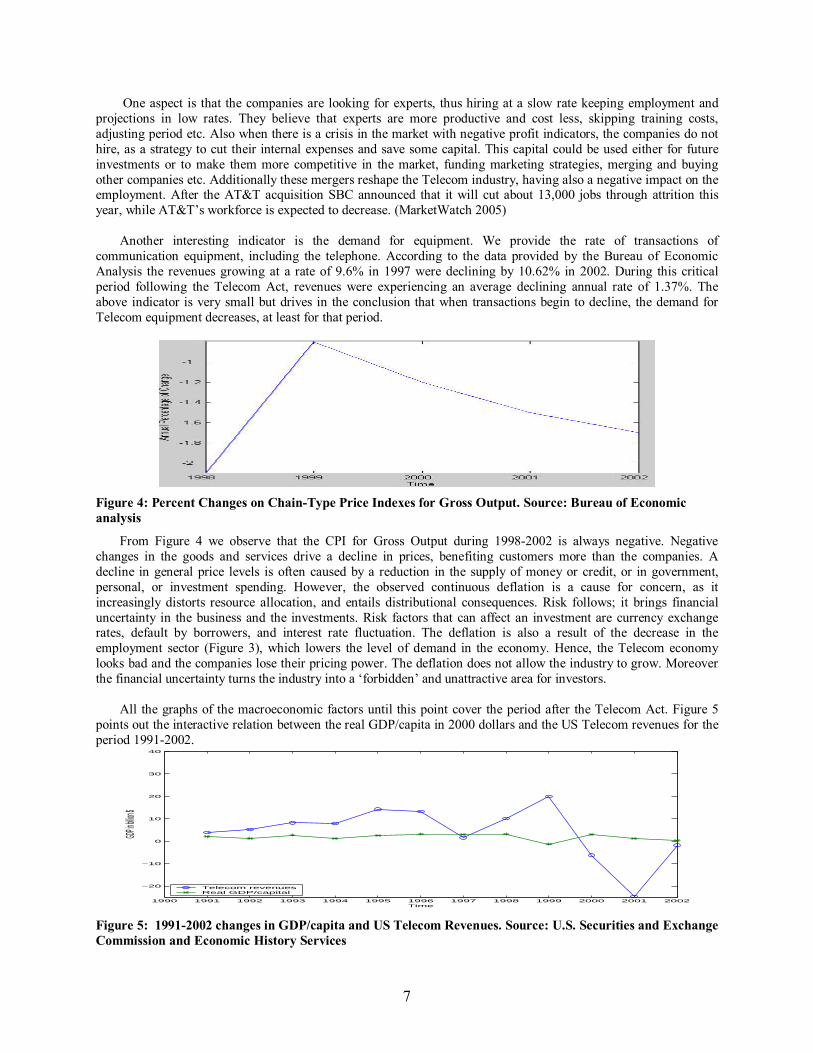
It is clear from Figure 3 that there was a crisis in Telecom employment. Since 2000 the employment keeps
declining, deeper in negative numbers turning the industry very questionable and unpredictable for each employee. The employment is an indicator related to the business spending on capital goods. In terms of employment and according to Figure 2, we conclude that the Telecom industry is nearly parallel. It follows the IT industry, at least for the present period 1998-2002. During the period 1999-2002 even the employment curved a cycle, following the cyclicality trend of the IT sector. After 2001 the employment is declining again; one aspect is that at least for the Telecom industry, the employers are hiring in a slower rate. Negative employment means questionable consumption and lower levels of economic output and growth from a market perspective. For the industry also means substantial automation of work with the new industries to have fewer employees per task, ignoring and not supporting the unions presence. It is an explanation for the observations of Figure 3 after 2001.
1998 1999 2000 2001 2002−10
−8
−6
−4
−2
0
2
4
6
8
10
Time
Percen
tage o
f Annua
l chang
e
Figure 3: The percentage change of Telecom employment during 1998-2002. Source: Bureau of Economic analysis
7
One aspect is that the companies are looking for experts, thus hiring at a slow rate keeping employment and projections in low rates. They believe that experts are more productive and cost less, skipping training costs, adjusting period etc. Also when there is a crisis in the market with negative profit indicators, the companies do not hire, as a strategy to cut their internal expenses and save some capital. This capital could be used either for future investments or to make them more competitive in the market, funding marketing strategies, merging and buying other companies etc. Additionally these mergers reshape the Telecom industry, having also a negative impact on the employment. After the AT&T acquisition SBC announced that it will cut about 13,000 jobs through attrition this year, while AT&T�s workforce is expected to decrease. (MarketWatch 2005)
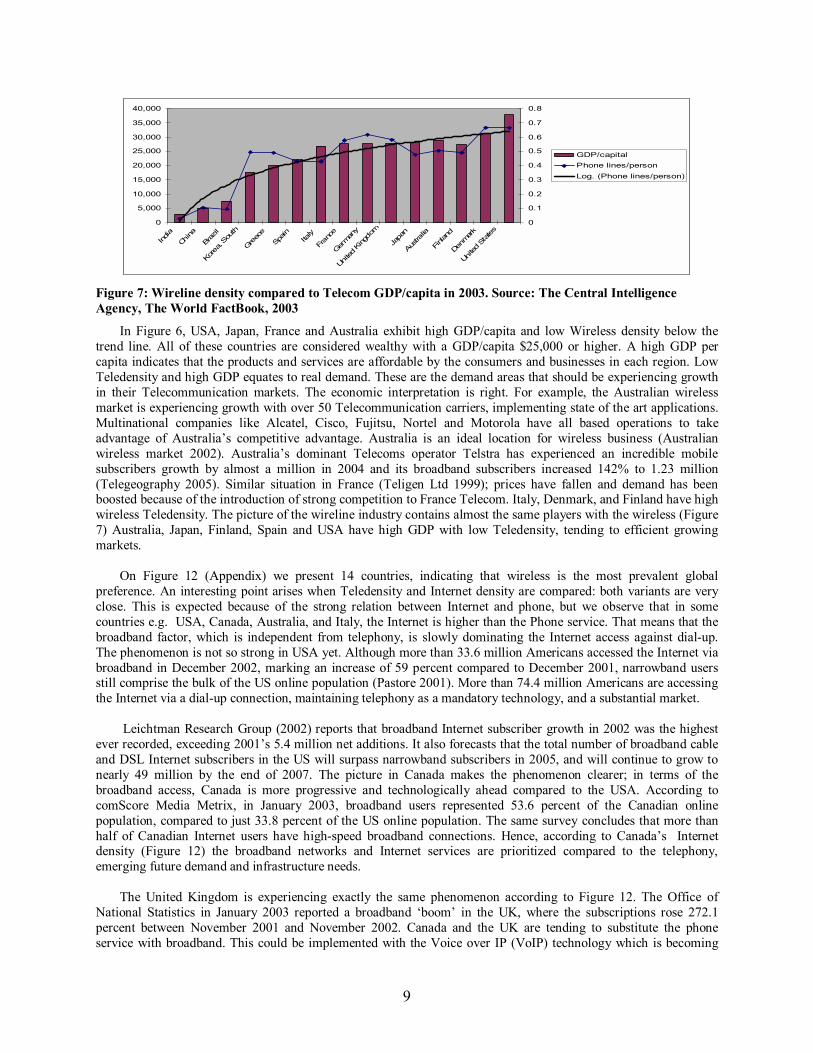
Another interesting indicator is the demand for equipment. We provide the rate of transactions of
communication equipment, including the telephone. According to the data provided by the Bureau of Economic Analysis the revenues growing at a rate of 9.6% in 1997 were declining by 10.62% in 2002. During this critical period following the Telecom Act, revenues were experiencing an average declining annual rate of 1.37%. The above indicator is very small but drives in the conclusion that when transactions begin to decline, the demand for Telecom equipment decreases, at least for that period.
Figure 4: Percent Changes on Chain-Type Price Indexes for Gross Output. Source: Bureau of Economic analysis
From Figure 4 we observe that the CPI for Gross Output during 1998-2002 is always negative. Negative changes in the goods and services drive a decline in prices, benefiting customers more than the companies. A decline in general price levels is often caused by a reduction in the supply of money or credit, or in government, personal, or investment spending. However, the observed continuous deflation is a cause for concern, as it increasingly distorts resource allocation, and entails distributional consequences. Risk follows; it brings financial uncertainty in the business and the investments. Risk factors that can affect an investment are currency exchange rates, default by borrowers, and interest rate fluctuation. The deflation is also a result of the decrease in the employment sector (Figure 3), which lowers the level of demand in the economy. Hence, the Telecom economy looks bad and the companies lose their pricing power. The deflation does not allow the industry to grow. Moreover the financial uncertainty turns the industry into a �forbidden� and unattractive area for investors.
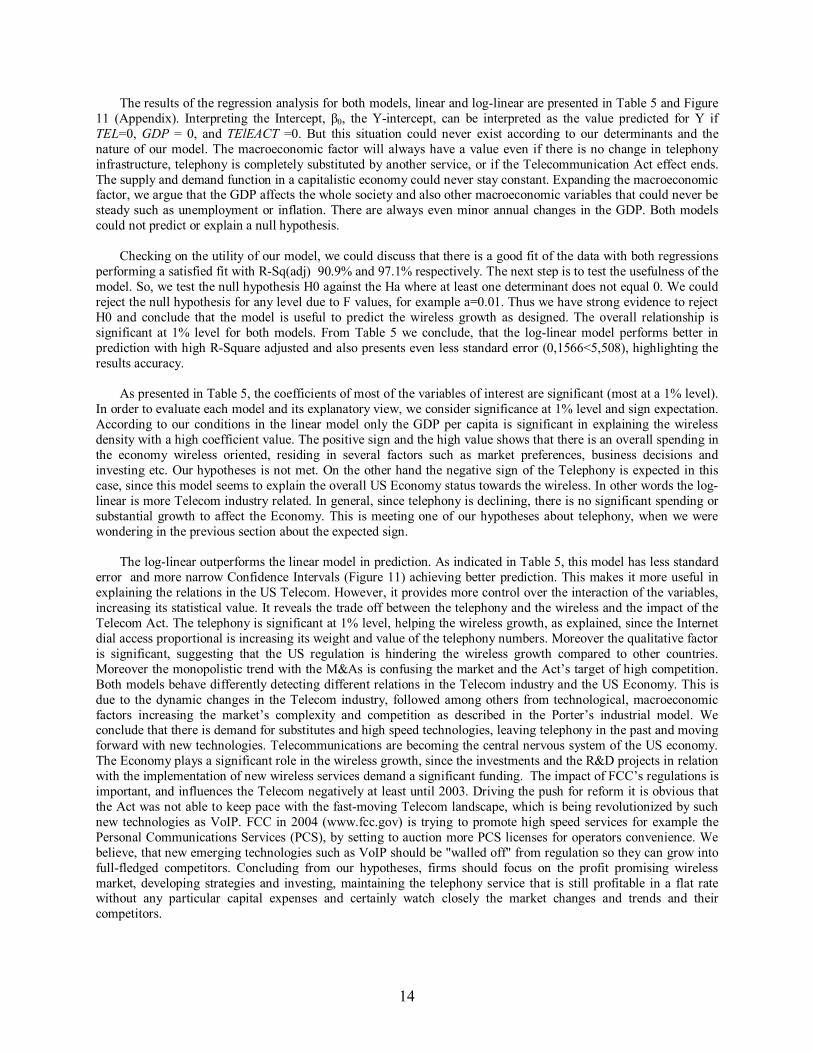
All the graphs of the macroeconomic factors until this point cover the period after the Telecom Act. Figure 5
points out the interactive relation between the real GDP/capita in 2000 dollars and the US Telecom revenues for the period 1991-2002.
1990 1991 1992 1993 1994 1995 1996 1997 1998 1999 2000 2001 2002
−20
−10
0
10
20
30
40
Time
GDP in b
illion $
Telecom revenuesReal GDP/capital
Figure 5: 1991-2002 changes in GDP/capita and US Telecom Revenues. Source: U.S. Securities and Exchange Commission and Economic History Services

8
There is a dogma (Odlyzko 2001) that supports that in the last 150 years, the growth per year of Telecom revenues was 2 percent faster than GDP. It is obvious that due to the dynamic changes of the industry things i.e. the �bubble�, technological change, during the last 5 years a delay in Telecom changes exists compared to GDP/Capita. This mainly affects the investments on the industry; late Return On Investments (ROIs) increase the risk and tend to create asymmetrical forecasts. As a result, the Telecom revenues are hard to predict. According to the graph, although the Telecom revenues used to be symmetric with the GDP/capita for the period 1991-1996, after 1996 they follow a completely different curve, due to the uneven regulations in different parts of the industry. Additionally, the phenomenon of cyclicality as described in previous section is fact according to Figure 5. The Telecom revenues exhibit on the graph compared to GDP/capita; we observe that the Telecommunications Act of 1996 was a shock, causing a decrease that was followed with a slight decrease in GDP. After that, the market re-entered a new cycle, characterized by negative numbers and loss in Telecom revenues and finally bounced back after 2001.
In 2002 a new cycle began: the revenues increased and Telecom experienced a mild growth, but still improving
the negative numbers. Slowly the demand for communications services and goods was increasing. Driving forces or trends like infrastructure and high-connectivity were returning and entering the market, forcing the rise of a new promising cycle, where growth is expected after the 1999-2001 period of continuous deflation. The massive deployment of infrastructure is a slow process. This is mainly due to the large investments that are required, which in our time of deregulation and market status is often hard to motivate, even for the largest �actors� on the Telecommunication scene. Big technological improvements, trends, and well taken applications might bring revenues to the industry. An example of infrastructure that could cover the most extreme demands could be an ad-hoc wireless network or Wi-Fi that encapsulates all of the Manhattan Downtown. Advanced robust infrastructures are the keys to help the industry grow; the Telecom business benefits in the on-going phenomenon of connectivity and globalization, becoming more attractive to the investors and profitable. Infrastructure Economic Analysis
Although the literature defines the Teledensity as a percentage number calculated as phone lines per 100 persons, we assume for comparison convenience that Teledensity is the phone lines per person. Through this assumptions it is possible to compare the infrastructure with the GDP/capita, since both variants are in the thousands scale. In Figures 6 and 7, we separately compare the Wireline and Wireless density to the national GDP/capita of each country. The logarithmic scale of the phones per person is introducing a trend line to separate the countries with high infrastructure.
0
5,000
10,000
15,000
20,000
25,000
30,000
35,000
40,000
India
China
Brazil
Korea,
South
Greec
eSpa
in Ita
ly
Fran
ce
German
y
United
King
dom
Japa
n
Austra
lia
Finlan
d
Denmark
United
Stat
es
00.10.20.30.40.50.60.70.80.91
GDP/capitalMobile phones/personLog. (Mobile phones/person)
Figure 6: Wireless density compared to Telecom GDP/capita in 2003. Source: The Central Intelligence Agency, The World FactBook, 2003
9
0
5,000
10,000
15,000
20,000
25,000
30,000
35,000
40,000
India
China
Braz
il
Korea,
South
Greec
eSp
ain
Italy
Fran
ce
German
y
Unite
d King
dom
Japa
n
Austr
alia
Finla
nd
Denm
ark
Unite
d St
ates
0
0.1
0.2
0.3
0.4
0.5
0.6
0.7
0.8
GDP/capitalPhone lines/personLog. (Phone lines/person)
Figure 7: Wireline density compared to Telecom GDP/capita in 2003. Source: The Central Intelligence Agency, The World FactBook, 2003
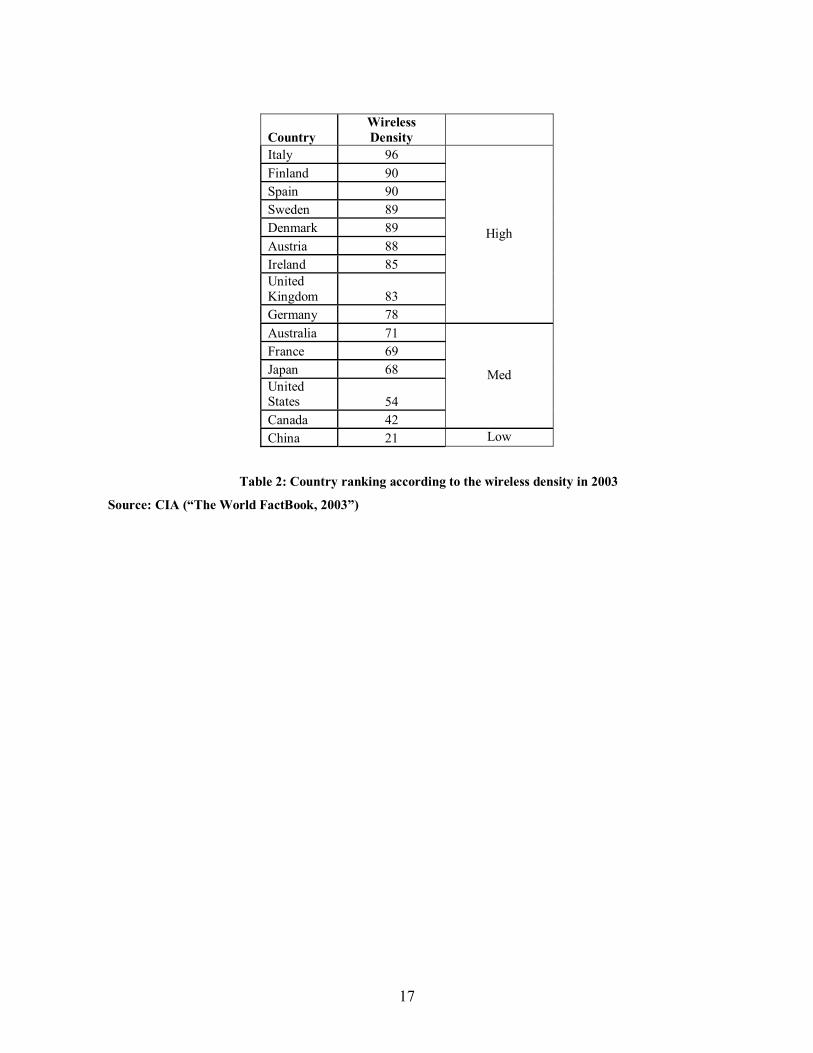
In Figure 6, USA, Japan, France and Australia exhibit high GDP/capita and low Wireless density below the trend line. All of these countries are considered wealthy with a GDP/capita $25,000 or higher. A high GDP per capita indicates that the products and services are affordable by the consumers and businesses in each region. Low Teledensity and high GDP equates to real demand. These are the demand areas that should be experiencing growth in their Telecommunication markets. The economic interpretation is right. For example, the Australian wireless market is experiencing growth with over 50 Telecommunication carriers, implementing state of the art applications. Multinational companies like Alcatel, Cisco, Fujitsu, Nortel and Motorola have all based operations to take advantage of Australia�s competitive advantage. Australia is an ideal location for wireless business (Australian wireless market 2002). Australia�s dominant Telecoms operator Telstra has experienced an incredible mobile subscribers growth by almost a million in 2004 and its broadband subscribers increased 142% to 1.23 million (Telegeography 2005). Similar situation in France (Teligen Ltd 1999); prices have fallen and demand has been boosted because of the introduction of strong competition to France Telecom. Italy, Denmark, and Finland have high wireless Teledensity. The picture of the wireline industry contains almost the same players with the wireless (Figure 7) Australia, Japan, Finland, Spain and USA have high GDP with low Teledensity, tending to efficient growing markets.
On Figure 12 (Appendix) we present 14 countries, indicating that wireless is the most prevalent global
preference. An interesting point arises when Teledensity and Internet density are compared: both variants are very close. This is expected because of the strong relation between Internet and phone, but we observe that in some countries e.g. USA, Canada, Australia, and Italy, the Internet is higher than the Phone service. That means that the broadband factor, which is independent from telephony, is slowly dominating the Internet access against dial-up. The phenomenon is not so strong in USA yet. Although more than 33.6 million Americans accessed the Internet via broadband in December 2002, marking an increase of 59 percent compared to December 2001, narrowband users still comprise the bulk of the US online population (Pastore 2001). More than 74.4 million Americans are accessing the Internet via a dial-up connection, maintaining telephony as a mandatory technology, and a substantial market.
Leichtman Research Group (2002) reports that broadband Internet subscriber growth in 2002 was the highest
ever recorded, exceeding 2001�s 5.4 million net additions. It also forecasts that the total number of broadband cable and DSL Internet subscribers in the US will surpass narrowband subscribers in 2005, and will continue to grow to nearly 49 million by the end of 2007. The picture in Canada makes the phenomenon clearer; in terms of the broadband access, Canada is more progressive and technologically ahead compared to the USA. According to comScore Media Metrix, in January 2003, broadband users represented 53.6 percent of the Canadian online population, compared to just 33.8 percent of the US online population. The same survey concludes that more than half of Canadian Internet users have high-speed broadband connections. Hence, according to Canada�s Internet density (Figure 12) the broadband networks and Internet services are prioritized compared to the telephony, emerging future demand and infrastructure needs.
The United Kingdom is experiencing exactly the same phenomenon according to Figure 12. The Office of
National Statistics in January 2003 reported a broadband �boom� in the UK, where the subscriptions rose 272.1 percent between November 2001 and November 2002. Canada and the UK are tending to substitute the phone service with broadband. This could be implemented with the Voice over IP (VoIP) technology which is becoming

10
very popular. The USA is following also the �boom�. According to the Yankee Group (Yankee Group 2004), VoIP will have close to 1 million subscribers by year-end 2004, and serve 17.5 million U.S. households by year-end 2008. They predict that by 2009 as many as 15% of American adults will have cut the cord of the traditional wireline. VoIP is offering low cost service, designed to meet customer�s expectations with new applications utilizing the latest network technology. With VoIP and broadband services we are close to experience a �cutting the cord� season. Since supply and demand is driving the economy and the market, new communication based changes are invading the industry and living style. Another interesting observation (Figure 12) is that the UK and Canada behave differently in the wireless sector. The UK is almost outperforming Canada�s medium wireless density of 42% (Table 2). Similarly Australia is experiencing the same phenomenon, outperforming Canada in the wireless sector.
This phenomenon is becoming stronger in Europe, especially in the UK and Italy, where Datamonitor
(Datamonitor survey 2003) predicts that over 41 million European households will be accessing the Internet via high-speed broadband connections by 2006. There is no doubt that we are at the beginning of a �spring� season for the Telecom, that demands infrastructure to support the increased broadband demand.
Although wireless is the growing technology, broadband is becoming very competitive in the short run, because
of its increasing popularity in the household sector. It seems that the surveys e.g. Datamonitor, Yankee Group are a good metric to measure the technological market trends and confirm our observations and conclusions.
1984 1986 1988 1990 1992 1994 1996 1998 2000 20020
10
20
30
40
50
60
70
80
90
100
Time
Wirel
ess Te
leden
sity
SwedenUSAItalyDenmarkFinland
Figure 8: USA wireless growth during the years 1984-2002 compared to the European outperformers. Source: ITU 2003
There are two major observations to be discussed from Figure 8. First of all, the wireless rise was the same for all countries from 1984 to 1996. At 1996, two countries were differentiated: the USA and Italy. The rest of the countries continued to outperform until 2002 due to advanced pricing and commercial strategies that were adapted. The USA experienced the Telecommunications Act that slowed down the growth. A similar event took place in Italy. In 1997 Telecom Italia (Rossant et al. 1999) was privatized. In 1999 it was eventually acquired by Olivetti in hostile takeover bid, including AT&T and Unisource as foreign partners. Telecom Italia maintains monopoly over local telephone calls. The privatization in Italy boosted the market expansion turning Italy in 2002 into world leader. There are around four major players in the Italian wireless, with Telecom Italia mobile to be the one, turning the market into an oligopoly. In Italy there are still some issues under discussion e.g. unbundling services from Telecom Italia.
Summarizing the two parts of our analysis macroeconomic and infrastructure, we conclude that US Telecom
experienced a deep crisis which has ended. In 2003 the Telecom industry is in a �spring� season and growth. The output growth is becoming stronger as advanced technology, e.g. broadband, VoIP, and increased competition, lower the prices for high-speed Internet access and wireless telephone services. Deregulation is an emerging issue that will allow the expansion of residential Telecommunication services offered. In addition, business demand is expected to rise as companies increasingly rely on new technologies in order to expand, differentiate, increase their market competitive advantage, and globalize their profile. Telecommunications systems will certainly help them to conduct electronic commerce, services, and transactions. The technology is already implemented to help them if they are willing to take advantage of it. The business expansion will be based more on technological improvements,

11
such as fiber-optic lines and advanced switching equipment, increasing the data transmission capacity of Telecommunications networks instead of the labor status. The employment will keep declining due to the market restructuring and technology automation issues. The increased services substitution is an analysis result. The preferences in most of the countries have changed, leaving the telephony behind and moving towards broadband and wireless services in a �cutting cord� season. The Telecom Act is a critical issue that is confusing and holding the industry�s expansion. It is also questionable if the Act has really accomplished its purpose. The economic indicators prove that the crisis and the declining numbers came on the heels of the Act after 1996.
MODEL AND METHODOLOGY
The proposed model consists of two modules. The first concerns a qualitative methodology that through a
conceptual framework intends to puzzle the pre-generated conclusions. The modular scenario analysis receives as input the conclusions and produces the future status of the Telecom industry. The first phase of the scenario is to identify the uncertainties and then to determine causal factors, making a range of assumptions and combine them into scenarios. Finally we analyze the industry behavior under each scenario and predict its behavior in the created environment. The second module concerns a quantitative analysis that aims to apply different models to the Telecom market and generate macroeconomic conclusions of the current industry behavior in the USA. We compare a linear and a log-linear model with the same variables, since in the literature (Godfrey 1981; and Gwyn 1980) is not clear which one fits better in a small dataset. Both studies applied Cox�s procedure to test logarithmic versus linear model, but there was no real evidence, proving which is better.
Qualitative Model
We assume the following future scenario: the market is developed and controlled by operators, highly differentiated service and pricing levels are developed, specialized service providers also provide equipment for specialized purpose, and global multi-purpose services compete with local specialized services. Additionally our hypothesis is that the phone hardly exists and is almost substituted by Internet (VoIP) and wireless services.
After defining and describing the driving forces in the previous section, we identify the variables and the causal
factors that will help model the scenario. The scenario variables are created from the causal factors. The causal factors are actually two: the Telecom Act and the deflation. The suggested variables are high deregulation, high differentiation substitution; differentiate pricing, open market, high competition in local and global sector from the same carriers. These variables are going to influence the rest of the model, indicating the rest of the input. It is obvious that the Input consists of two steps. Each object has two factors that are highly related. For example the Driving Forces are created from Industry analysis. Our suggested scenarios are created after considering the causal factors and the current analysis conclusions. Moreover the dependent element is representing the wireless factor that should describe an infrastructure metric or indicator. The constant elements represent traditional Telecommunication technologies like Internet, paging, and also macroeconomic factors such as GDP/capita. The qualitative approach is attempting to suggest an algorithm that could be followed each time we would like to evaluate the Telecom industry. We believe that the parts and the objects will be the same, but the sub-factors in the objects might change. The model is aiming to describe the future structure of the Telecom industry.
Figure 9: Conceptual framework

12
We intend to predict the Industry technologies after applying the virtual scenarios. Could the industry survive without traditional telephony? When the competition in the wireless technology and broadband services is so high, the telephony is flirting with substitution and future elimination.
Our conceptual framework�s construction presents the following schema: input, system, and output. In Figure 9, the first two steps describe the input. We believe that these two steps are necessary for the system to understand the status of the industry. All the variables of the input are trying to describe precisely the scenario. So in the next step we could more easily define the objects and its sub-factors. The part that is called �system� in this qualitative approach will be defined in the quantitative part with an appropriate equation. The output of the model is the status of the future Telecom industry in terms of infrastructure trends and �survived� technologies.
Quantitative Model
The objective of this paper is to develop and test some hypotheses with regards to the determinants of the time series heterogeneity in the market valuation and necessity of the wireless projects. Because of the limited data availability we will focus mainly on explaining the positive or negative changes in the suggested model. The industry provides enough variability in the variables hypothesized to be determinants, including the macroeconomic factor. We believe that is not ideal to work with the Internet variant and expect results, since the Internet is not that old, beginning to show real evidence in the early 90�s. This restricts our number of observations, disabling the Internet factor. It could not help us to create a consistent dataset in terms of time series continuity.
The model in the general mode, as it is produced in the Qualitative approach, for the US Telecom industry will describe a time-series model (Equation 3). The wireless density is the response variable instead of the Teledensity used in other studies as mentioned in the related work section. We believe that the wireless variable is critical and more investigation is required.
WLSSGRTH t = β0 + β1 * TEL t + β2* GDP t + β3*TELEACT t +e (3)
WLSSGRTH represents the annual wireless density, TEL represents the annual Teledensity, GDP represents the
logarithmic value of the real GDP per capita. TELEACT is a dummy variable that we introduce in order to describe the Telecommunications Act of 1996. It is obvious that post 1996 the value is 1 when the event is activated, and 0 in any other case. We assume that the slope coefficients, β1, β2, represent multipliers that are weighing the influence of each variable to the Wireless factor. The sample consists of 20 observations, one dependent variable, the Wireless density, and two dependent variables, Teledensity and GDP/capita and finally a qualitative factor that represents the Telecom Act. We compare the results of two models: linear and log-linear. The log-linear has the following form: Log (WLSSGRTH) t = β0 + β1 *Log( TEL)t + β2*Log( GDP) t + β3*TELEACT t +e (4) The Hypotheses
We consider a situation with a company in the US Telecom market of the scenario as described in the qualitative approach, when the telephony service hardly exists. Moreover the company offers a package bundle consisting of wireless, telephony, and Internet services. We attempt to evaluate the firm�s decisions on wireless infrastructure spending and investing based on the economy, regulations and telephony. These decisions could be influenced by the status of the economy expressed by the GDP per capita and the necessity of telephony infrastructure projects. As an overall factor we examine the influence of the Telecommunication Act of 1996. We aim to investigate the behavior of both models and form conclusions about the current US Telecom market and test the wireless factor. This firm could represent a US Telecom Services provider such as AT&T. We investigate the wireless factor from the early beginnings of 1984.
Hypothesis 1: Negative Telecommunication Act effect. We believe that the Telecommunications Act will have
a negative effect starting in 1996 and continuing until the end of 2003. The law is not broad enough to capture today�s technology needs; it lags the fast moving Telecom industry, trying to follow the dynamic changes. The current Telecom law is hopelessly flawed, stifles investment, prevents the creation of American jobs and slows the rise of the US Telecom. Gregg Sutherland, senior vice president of corporate strategy at Qwest Communications International Inc., believes in a hands-off approach to government intervention and complains that government regulations are hindering investment in telecom networks. He indicates in 2002: "Current regulations do not allow a

13
company to make money off of its investments. Let the people making the risk get a return on their investment." (Bryer 2002)
Hypothesis 2: Lower Telephony expenditure. According to the almost stabilized telephony (Figure 12) we
hypothesize that the telephony projects should be less important for the firm demanding less expenditure, represented by a negative sign. The telephony is not a demanding factor affecting negatively the wireless projects. The telephony expenditures should be the minimum able to maintain the service and cover the demand.
Variables Explanation Expected sign GDP per
capita The annual real US
GDP per capita -
Teledensity Number of
telephones per 100 inhabitants
? (+) or (-)
TeleAct Telecommunications Act of 1996 -
Table 1: Expected signs of the variables
Hypothesis 3: Positive effect of GDP. As we observed in the Telecom analysis, there is a difference between the GDP/capita and the Telecom revenues. This was also illustrated in the infrastructure Figure (Figure5). Whenever there are high changes in the economy, the new wireless projects and investments emerge. However they experience slow ROI, so when they become profitable there is already a change in the economy. Thus there should be a negative relationship between the GDP and the wireless. As we can observe on Figure 12, only during 1996-1998 there was a parallel consistency between the three variables. Moreover the coefficient value should be high, because the GDP is the one that explains the whole US economy and not just the value added from Telecom industry. Hence, the GDP is not so closely related to the Telecom economy, like the other variables, increasing the challenge of the model�s behavior.
Hypothesis 4: Internet influence. Although we have not used any Internet data, we could hypothesize that the Internet resides in the telephony factor. As we already mentioned a large share of the US Internet infrastructure and revenues are still based on the traditional telephony. This phenomenon should increase the weight of the telephony factor in the model, creating a positive impact on the wireless growth, since the Internet is also part of the wireless services. For example Verizon offers Internet connection through the cell phone in the "Express Network" providing speed of up to 144 kbps. (www.verizonwireless.com). This service is claimed to beat in speed 2G and the GPRS services. Table 1 summarizes the expected signs of our hypotheses. Data and Results
Data for the US Economy and Telecom for the period 1984-2003 are utilized. The following information sources are used to construct the operational measures of the variables: the infrastructure data of the US Telecom are collected from the �OECD Communications Outlook 1999 Edition�, �OECD Communications Outlook 2003 Edition�, and �International Telecommunications Union (ITU) World Indicators 2003� and the �The World FactBook, 2003� of the Central Intelligence Agency (CIA). The real US GDP/capita in 2000 dollars is collected from the Economic History Services (www.eh.net). One of our targets is to investigate the behavior of our model, by using the overall real GDP per capita of the US Economy. Our data are presented with descriptive statistics in Tables 3 and 4 (Appendix). The data ratios are presented in Figure 10.
Figure 10: Ratios of wireless density, Teledensity and GDP/capita during the period 1984-2003
14
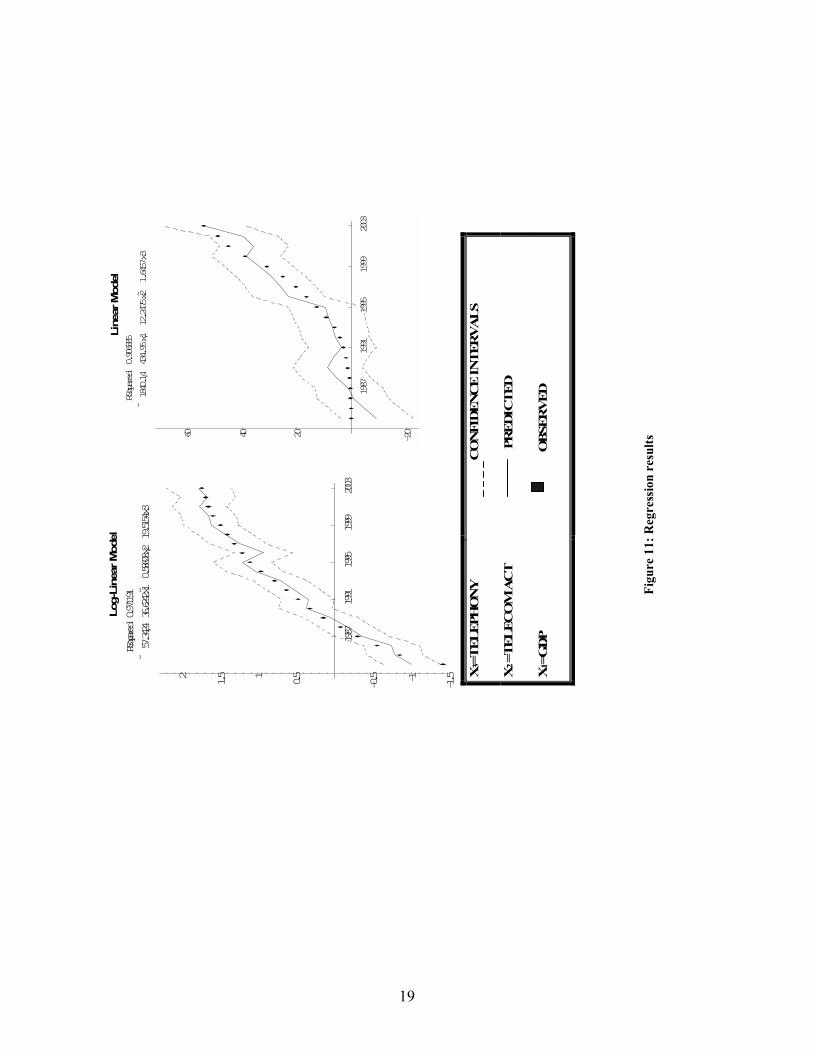
The results of the regression analysis for both models, linear and log-linear are presented in Table 5 and Figure 11 (Appendix). Interpreting the Intercept, β0, the Y-intercept, can be interpreted as the value predicted for Y if TEL=0, GDP = 0, and TElEACT =0. But this situation could never exist according to our determinants and the nature of our model. The macroeconomic factor will always have a value even if there is no change in telephony infrastructure, telephony is completely substituted by another service, or if the Telecommunication Act effect ends. The supply and demand function in a capitalistic economy could never stay constant. Expanding the macroeconomic factor, we argue that the GDP affects the whole society and also other macroeconomic variables that could never be steady such as unemployment or inflation. There are always even minor annual changes in the GDP. Both models could not predict or explain a null hypothesis.
Checking on the utility of our model, we could discuss that there is a good fit of the data with both regressions
performing a satisfied fit with R-Sq(adj) 90.9% and 97.1% respectively. The next step is to test the usefulness of the model. So, we test the null hypothesis H0 against the Ha where at least one determinant does not equal 0. We could reject the null hypothesis for any level due to F values, for example a=0.01. Thus we have strong evidence to reject H0 and conclude that the model is useful to predict the wireless growth as designed. The overall relationship is significant at 1% level for both models. From Table 5 we conclude, that the log-linear model performs better in prediction with high R-Square adjusted and also presents even less standard error (0,1566<5,508), highlighting the results accuracy.
As presented in Table 5, the coefficients of most of the variables of interest are significant (most at a 1% level).
In order to evaluate each model and its explanatory view, we consider significance at 1% level and sign expectation. According to our conditions in the linear model only the GDP per capita is significant in explaining the wireless density with a high coefficient value. The positive sign and the high value shows that there is an overall spending in the economy wireless oriented, residing in several factors such as market preferences, business decisions and investing etc. Our hypotheses is not met. On the other hand the negative sign of the Telephony is expected in this case, since this model seems to explain the overall US Economy status towards the wireless. In other words the log-linear is more Telecom industry related. In general, since telephony is declining, there is no significant spending or substantial growth to affect the Economy. This is meeting one of our hypotheses about telephony, when we were wondering in the previous section about the expected sign.
The log-linear outperforms the linear model in prediction. As indicated in Table 5, this model has less standard
error and more narrow Confidence Intervals (Figure 11) achieving better prediction. This makes it more useful in explaining the relations in the US Telecom. However, it provides more control over the interaction of the variables, increasing its statistical value. It reveals the trade off between the telephony and the wireless and the impact of the Telecom Act. The telephony is significant at 1% level, helping the wireless growth, as explained, since the Internet dial access proportional is increasing its weight and value of the telephony numbers. Moreover the qualitative factor is significant, suggesting that the US regulation is hindering the wireless growth compared to other countries. Moreover the monopolistic trend with the M&As is confusing the market and the Act�s target of high competition. Both models behave differently detecting different relations in the Telecom industry and the US Economy. This is due to the dynamic changes in the Telecom industry, followed among others from technological, macroeconomic factors increasing the market�s complexity and competition as described in the Porter�s industrial model. We conclude that there is demand for substitutes and high speed technologies, leaving telephony in the past and moving forward with new technologies. Telecommunications are becoming the central nervous system of the US economy. The Economy plays a significant role in the wireless growth, since the investments and the R&D projects in relation with the implementation of new wireless services demand a significant funding. The impact of FCC�s regulations is important, and influences the Telecom negatively at least until 2003. Driving the push for reform it is obvious that the Act was not able to keep pace with the fast-moving Telecom landscape, which is being revolutionized by such new technologies as VoIP. FCC in 2004 (www.fcc.gov) is trying to promote high speed services for example the Personal Communications Services (PCS), by setting to auction more PCS licenses for operators convenience. We believe, that new emerging technologies such as VoIP should be "walled off" from regulation so they can grow into full-fledged competitors. Concluding from our hypotheses, firms should focus on the profit promising wireless market, developing strategies and investing, maintaining the telephony service that is still profitable in a flat rate without any particular capital expenses and certainly watch closely the market changes and trends and their competitors.

15
CONCLUSIONS AND FUTURE WORK
Summarizing our work, we would say that the industrial analysis highlighted some of the future US and global trends and generated the driving forces for the DMM. US Telecom, according to the macroeconomic indicators experienced a deep crisis mainly due to the �bubble�, which is already past. In 2003 the Telecom industry is in a growth period. The output growth is becoming stronger as advanced technology, for example broadband, VoIP, and increased competition, lower the prices for high-speed Internet access and cellular services. Deregulation is an emerging issue that will allow the expansion of residential Telecommunication services offered. In addition, business demand is expected to rise as companies increasingly rely on new technologies in order to expand, differentiate, increase their market competitive advantage and globalize their profile. Telecommunications systems will certainly help them to conduct electronic commerce, services and transactions. The business expansion will be based more on the technological improvements such as fiber-optic lines and advanced switching equipment increasing the data transmission capacity of Telecommunications networks instead of the labor status. The employment will keep declining due to the market restructuring and technology automation issues. The increased substitution is also another analysis result. The preferences in most of the countries have changed, leaving the telephony behind and moving towards broadband and wireless services in a �cutting cord� season. The Telecom Act is a critical issue that is confusing and holding back the US industry�s expansion. It is also questionable if the Act has accomplished its purpose. The economic indicators prove that the crisis and the declining numbers came post the Act.
The contribution of this study is to expresses our first attempt to predict the wireless growth as an dependent
variable seeking for relationships with Economic and Telecom variables. The modeling of the Telecom industry was successful for both approaches. The quantitative analysis was more important capturing the significant relations between the wireless, the GDP and the Telecom Act. Both models are strong enough to reveal the complexities of the Telecom industry as hypothesized. We were able to detect the negative impact of the Telecom Act. The traditional telephony continues to decline and is helping the wireless growth, only if it is considered as the media to access the Internet. The excitement is in wireless and future trends the �cutting the cord� season where the VoIP and the broadband will dominate the voice and data communications respectively.
In the future we intend to test DMM in other Telecom industries that presented really interesting observations
such as Canada�s and Australia�s and examine its behavior and also expand our research in the Organization for Economic Co-operation and Development (OECD) countries. It is interesting to investigate if the algorithm we tried to create is still valid in other Telecom industries and examine the driving forces and the DMM�s determinants. Another challenging case study is Italy, by testing DMM on the Act of 1997 and investigate its impact. Finally, we aim to test the behavior of other determinants that characterize the Telecom and macroeconomic factors in a monthly basis. Finally we aim to generate additional scenarios that could be served from the tested models. Acknowledgement: Many thanks to Dr. Curtis, Director Telecommunications Management & Executive in Residence, for supporting this research and her valuable comments on the strategic aspects of the US Telecom sector.

16
REFERENCES
Alleman James, Carl Hunt, Donald Michael, Milton Mueller, Paul Rappoport, Lester Taylor (1994) Telecommunications and Economic Development: Empirical Evidence from Southern Africa. In: http://www.colorado.edu/engineering/alleman/, University of Colorado Atkinson Robert C. (2001). The Future of Competitive Telecommunications, In:www.citi.columbia.edu Bryer (2002). Does the telecom industry need government's help? In: Denver Business Journal, January 25, 2002 Bureau of Economic Analysis. In: www.bea.doc.gov Business Cycles. In www.digitaleconomist.com/ Cazzani S. (2003) More revenue, less competition � Italy, Telecommunications International, Oct, 2003 In: www.Telecommagazine.com Central Intelligence Agency (CIA), �The World FactBook, 2003� Charles Hill, Gareth Jones (2004). Strategic Management Theory. 4th edition, Houghton Mifflin Company Datamonitor survey. In: www.nua.ie/surveys Economic History Services. In: www.eh.net Economides Nicholas (2004), Telecommunications Regulation: An Introduction, Stern School of Business, NYU NET Institute Working Paper #04-20 Feng Li, and Jason Whalley (2002). Deconstruction of the Telecommunications industry: from value chains to value networks Telecommunications Policy, Volume 26, Issues 9-10 , October-November 2002, Pages 451-472 Fertig, D., Prince, C., & Walrod, D. (1999).What kind of telco is the fairest of them all? The McKinsey Quarterly, http://www.mckinseyquarterly.com/ Fransman M. (2002), Telecoms in the Internet Age, Oxford Univesity press, New York. Godfrey L.G., M.R. Wickens (1981).Testing Linear and Log-Linear Regressions for functional form. Review of Economic Studies XLVIII, 487-496 Gwyn Aneuryn-Evans (1980). Testing Linear versus Logarithmic Regression Models. Review of Economic Studies, vol 47, issue 1, 275-291. Hans-Martin Krolzig (2000). Business Cycle Measurement in the Presence of Structural Change: International Evidence. Department of Economics and Nuffield College, Oxford University. Harmantzis F. (2004). Inside the Telecom Crash: Bankruptcies, Fallacies and Scandals A Closer Look at the WorldCom Case, In International Telecommunications Society 15th Biennial Conference, Sept 05-07, 2004, Berlin, Germany Hicks R John. (1985) Methods of Dynamic Economics. International Telecommunications Union (ITU). (2003). Key global Telecom indicators for the world Telecommunication Jeunhomme , Gwenaëlle C., (2000). Measuring Telecommunication infrastructure needs and demand. Thesis for Master of Science in Technology and Policy, Massachusetts Institute of Technology, January 2000 Jipp A. (1963). Wealth of nations and telephone density. Telecommunication Journal, No.6, 199-201. LeictmanResearch Group survey. In: www.leichtmanresearch.com Madden, G. and S. J. Savage, (1998) CEE Telecommunications Investment and Economic Growth,� Information Economics and Policy, Vol. 10, pp. 173-195. MarketWatch (2005). SBC, AT&T to cut almost 12% of jobs In: MarketWatch Appendix, www.marketwatch.com Moyer Brian C, Mark A. Planting, Paul V. Kern, and Abigail M. Kish (2004). Improved Annual Industry Accounts for 1998�2003 Integrated Annual Input-Output Accounts and Gross-Domestic-Product-by-Industry Accounts. In: Bureau of Economic Analysis. Nielsen Netratings survey (2003). In: www.nua.ie/surveys Noam E.(2002b). How Telecom is becoming a cyclical industry and what to do about it, Columbia University Noam E.(2003). Remedies for Telecom Recovery Restoring Network Dynamism. Columbia Institute for Tele-Information. Noam Eli (2002).Regulating in order to deregulate Financial Times, May 29 2002 Odlyzko A. (2001). Digital Technology Center, Telecom economics and Telecom dogmas. In: Wireless Unleashed blog www.wiscnet.net/downloads/wiscnet.pdf Pastore Michael (2001). U.S. Households Dropping Additional Phone Lines, In: www.clickz.com/stats/markets/broadband/ Porter Michael E. (1980). Competitive Strategy : Techniques For Analyzing Industries And Competitors, The Free Press. Prechter Robert (2002). Conquer the Crash, You Can Survive and Prosper in a Deflationary Depression, Röller, L. and L. Waverman (2002) Telecommunications Infrastructure and Economic Development: A Simultaneous Approach, American Economic Review, Vol. 92, pp. 909- 923. Rossant, John. Kerry Capell. and Jack Ewing (1999). "Raiders at the Gate." Business Week. 8 March: 50-52 Ruth Matthias and Bruce Hannon (1997). Modeling Dynamic Economic Systems, Springer-Verlag, New York. Seaberg, J. G., Hawn, J., Dincerler, G. E., Eugster, C. C., & Rao, N. (1997). Attackers versus incumbents: The battle for value in an IP-networked world. The McKinseyQuarterly,4.,138�153. http://www.mckinseyquarterly.com/ service sector. Telecommunications Industry Association 2005. Telecommunications Market Review and Forecast In: www.tiaonline.org/ Teligen Ltd (1999). Competition in the French market. In www.teligen.com/files/art_fran.pdf The Australian wireless industry. In: United Online Network in Public Administration and Finance www.unpan.org Weber Steven (1997). The End of the Business Cycle. In: Foreign Affairs Vol. 76, No. 4 (July/August 1997), S. 65 � 82 Zarnowitz Victor (1992). Business Cycles: Theory, History, Indicators and Forecasting. University of Chicago Press
17
Country Wireless Density
Italy 96 Finland 90 Spain 90 Sweden 89 Denmark 89 Austria 88 Ireland 85 United Kingdom 83 Germany 78
High
Australia 71 France 69 Japan 68 United States 54 Canada 42
Med
China 21 Low
Table 2: Country ranking according to the wireless density in 2003
Source: CIA (�The World FactBook, 2003�)

18
Descriptive Statistics
20 .0388 54.1660 16.043045 18.233607420 48 67 58.30 6.63420 4.391 4.577 4.47692 .05176420 0 1 .40 .50320
Wireless growthTelephoneGDP/capitalTeleActValid N (listwise)
N Minimum Maximum Mean Std. Deviation
Table 3: Linear model
Descriptive Statistics
20 -1.411661052766 1.73372676540 .66837550302288 .9237641946425120 1.681241237376 1.82607480270 1.76295049377262 .0500732471644120 .642551780046 .660627574975 .65095154815271 .0050160397706620 0 1 .40 .50320
Wireless growthTelephoneGDP/capitalTeleactValid N (listwise)
N Minimum Maximum Mean Std. Deviation
Table 4: Log-linear model
Variables Linear Model
(N=20) Log-linear Model
(N=20)
Intercept *** -1840.14 (-4.621)
*** -57.342 (-4.084)
GDP *** 434.95 (4.436)
36.624 (0.199)
Telephony *-1.645 (-2.027)
***19.515 (6.934)
TeleAct **12.247 (2.302)
***-0.586 (-4.063)
R-sq adj 0.909 0.971 Standard Error of Estimate
5.508 0.156
F value *** 62.682 *** 214.506
Table 5: Determinants of US Wireless Growth, 1984-2003
Notes: t- statistics in parentheses; N=20 observations; *** significant at 1% level; ** significant at 5% level; * significant at 10% level
19
1987
1991
1995
1999
2003
-1.5-1
-0.50.51
1.52
RSquared
�0.971191
57.342436.6242x10.58608x219.5154x3
1987
1991
1995
1999
2003
-20204060
RSquared
�0.906885
1840.14434.95x112.2475x21.6457x3
Line
ar M
odel
Log-
Line
ar M
odel
X1=
GD
P 1.
OB
SER
VE
D
X2 =T
EL
EC
OM
AC
T
P
RE
DIC
TE
D
X3=
TE
LE
PHO
NY
CO
NFI
DE
NC
E IN
TE
RV
AL
S
Figu
re 1
1: R
egre
ssio
n re
sults

20
Nr.
1
2 3
4 5
6 7
8 9
10
11
12
13
14
Cou
ntry
U
SA
Den
mar
k A
ustr
ia
Can
ada
Irel
and
Aus
tral
ia
Japa
n U
K
Fran
ce
Ger
man
y Fi
nlan
d It
aly
Chi
na
Spai
n
Figu
re 1
2: C
ompa
ring
Wir
eles
s to
Tel
epho
ny a
nd In
tern
et fo
r 14
cou
ntri
es in
the
year
2003
Density(%)
Cou
ntri
es