A. Diaz Dissertation
172
SOLID-SUPPORTED PHOSPHOLIPID BILAYERS: SEPARATION MATRIX FOR PROTEOMICS APPLICATIONS A Dissertation by ARNALDO JOEL DIAZ VAZQUEZ Submitted to the Office of Graduate Studies of Texas A&M University in partial fulfillment of the requirements for the degree of DOCTOR OF PHILOSOPHY May 2008 Major Subject: Biochemistry
Transcript of A. Diaz Dissertation

SOLID-SUPPORTED PHOSPHOLIPID BILAYERS:
SEPARATION MATRIX FOR PROTEOMICS APPLICATIONS
A Dissertation
by
ARNALDO JOEL DIAZ VAZQUEZ
Submitted to the Office of Graduate Studies of Texas A&M University
in partial fulfillment of the requirements for the degree of
DOCTOR OF PHILOSOPHY
May 2008
Major Subject: Biochemistry

SOLID-SUPPORTED PHOSPHOLIPID BILAYERS:
SEPARATION MATRIX FOR PROTEOMICS APPLICATIONS
A Dissertation
by
ARNALDO JOEL DIAZ VAZQUEZ
Submitted to the Office of Graduate Studies of Texas A&M University
in partial fulfillment of the requirements for the degree of
DOCTOR OF PHILOSOPHY
Approved by:
Co-Chairs of Committee, Paul S. Cremer James C. Hu Committee Members, David H. Russell Gregory D. Reinhart Head of Department, Gregory D. Reinhart
May 2008
Major Subject: Biochemistry

iii
ABSTRACT
Solid-Supported Phospholipid Bilayers: Separation Matrix
for Proteomics Applications. (May 2008)
Arnaldo Joel Diaz Vazquez, B.S.,
University of Puerto Rico – Rio Piedras
Co-Chairs of Advisory Committee: Dr. Paul S. Cremer Dr. James C. Hu
This dissertation focuses on the development of biological platforms on which
the function and characterization of transmembrane proteins can be performed
simultaneously utilizing a biomembrane mimic consisting of a solid supported
phospholipid bilayer (SLB). The study centered on the platform development,
biophysical measurements of transmembrane proteins and membrane species
chromatography. Membrane proteins play an essential role in various cellular and
physiological processes. Their normal functions are essential to our health, and many
impaired proteins have been related to serious diseases. Gaining a better understanding
of membrane proteins is an essential step towards the development of more specific and
competent drugs.
This research study is divided into two main parts. The first part centered on the
creation of a new platform for allowing transmembrane proteins to freely move inside
supported lipid bilayers with the same mobility that can be found in vesicle systems.
SLBs have been extensively used as model systems to study cell membrane processes

iv
because they maintain the same two-dimensional fluidity of lipids within the membrane
found in live cells. However, one of the most significant limitations of this platform is its
inability to incorporate mobile transmembrane species. Our strategy involves supporting
the lipid bilayer on a double cushion, where we not only create a large space to
accommodate the transmembrane portion of the protein, but also passivate the
underlying substrate to reduce non-physiological protein-substrate interactions. High
diffusion constants and high mobile fractions were obtained for a transmembrane protein
reconstituted within this double cushion system.
The second area of this study focuses on the creation of a new method to rapidly
separate membrane components using electrophoresis in SLBs. This work showed that
even subtly different chemical isomers can be well-separated by a simple electrophoretic
technique when cholesterol is present in the separation matrix. As a first step towards the
purification of proteins, this work showed that streptavidin proteins doubly bound to a
bilayer by a biotinylated lipid can be separated from streptavidin proteins which are
singly bounded.

v
DEDICATION
Dedicated to the people who often believe in me more than
I do myself, my parents:
Maria M. Vazquez
and
Ramon L. Diaz
for their loving support in teaching me the value of an education
and
to my future wife Jessica Aud for all her loving support, patience and understanding
and
to my brother and sister, Raymi and Yiselie
and
my beautiful nieces, Alondra Nicole and Alanys Michelle

vi
ACKNOWLEDGEMENTS
This work would not have been possible without the help and contribution of
many people. First, I would like to give thanks to my advisor and mentor Dr. Paul S.
Cremer for his guidance, support, expertise, and more than anything for giving me the
chance of joining his group and motivating me during the process of my graduate career.
I sincerely thank Dr. James C. Hu for giving me the opportunity of joining the
Department of Biochemistry & Biophysics and to participate in the Chemical/Biology
Interface (CBI) Program. I want to express my appreciation to Dr. Gregory Reinhart and
Dr. David H. Russell for their cooperation and for serving as my committee members. I
greatly appreciate the time you have taken to guide me through my committee meetings,
preliminary examination, and defense. Thanks for all the helpful advice you have given
me.
I definitely owe a big thanks to Dr. Virginia Cornish for allowing me to do
research at Columbia University. Dr. Cornish was instrumental in motivating me to
pursue a career in science. She always has been a positive influence during my graduate
career. Her guidance as a scientist and as a mentor has been exceptional.
I sincerely thank my fellow Cremer group members and friends for their support,
motivation, and help during these years. Dr. Fernando Albertorio, thank you for your
help, guidance and so many hours of supportive and helpful discussions. Thanks to Dr.
Susan Daniel for her leadership and scientific contribution to my work. I especially
would like to thank, Mrs. Stacy Sherrod, for all of her help and contribution to my

vii
research. Her enthusiasm toward science is contagious and she has always been an
example of hard-work, dedication and creativity.
I also want to thank the National Institutes of Health (NIH) for financial support.
Other financial support was provided by the Defense Advanced Research Project
Agency (DARPA).
Last but not least, I would like to thank my family, my lovely fiancée, and my
good friends for all their love, support, and faith. Mom and Dad, thanks for your
unconditional love and support. Thank you for your understanding and countless
sacrifices. I love you both very much. Jessica thanks for all your help. I really appreciate
your understanding, love, and patience. I can’t wait to marry you. Raymi, Yiselie,
Alondra, and Alanys, I miss you and love you all. Gabriela thanks for keeping my spirits
up whenever things got a little out of control. Finally, thanks to all the friends I have
made over the past years. Your contributions have been crucial to my career.

viii
TABLE OF CONTENTS
Page
ABSTRACT............................................................................................................... iii
DEDICATION........................................................................................................... v
ACKNOWLEDGEMENTS....................................................................................... vi
TABLE OF CONTENTS........................................................................................... viii
LIST OF FIGURES.................................................................................................... x
LIST OF TABLES .................................................................................................... xv
CHAPTER I INTRODUCTION............................................................................................ 1
1.1. Purpose and Objectives ............................................................................ 1 1.2. The Cell Membrane.................................................................................. 3 1.3. Solid Supported Phospholipid Bilayers.................................................... 13 1.4. Polymer Cushioned Phospholipid Bilayers.............................................. 18 1.5. Summary .................................................................................................. 23
II EXPERIMENTAL ........................................................................................... 24 2.1. Synopsis ................................................................................................... 24 2.2. Conjugation of Fluorescently Labeled Proteins ........................................ 25 2.3. Preparation of Microfluidic Devices by Soft Lithography........................ 27 2.4. Fluorescence Recovery after Photobleaching (FRAP).............................. 30 2.5. Supported Lipid Bilayer Electrophoresis .................................................. 37 2.6. Thin-Layer Chromatography (TLC) ......................................................... 40 III DOUBLE CUSHIONS ENABLE THE FORMATION OF FLUID TRANSMEMBRANE PROTEINS IN SUPPORTED LIPID MEMBRANES ...................................................................................... 42
3.1. Synopsis ................................................................................................... 42 3.2. Introduction .............................................................................................. 43 3.3. Experimental ............................................................................................ 48

ix
CHAPTER Page
3.4. Results ...................................................................................................... 52 3.5. Discussion ................................................................................................ 64 3.6. Summary and Conclusions....................................................................... 68
IV ELECTOPHORESIS IN SUPPORTED LIPID BILAYERS: SEPARATION, CHARACTERIZATION, AND IMAGING OF MEMBRANE BOUND SPECIES ................................................................... 69
4.1. Synopsis ................................................................................................... 69 4.2. Introduction .............................................................................................. 70 4.3. Experimental ............................................................................................ 72 4.4. Results and Discussion............................................................................. 79 4.5. Summary and Conclusions....................................................................... 92
V SEPARATION OF PERIPHERAL PROTEINS BY SOLID-SUPPORTED BILAYER ELECTROPHORESIS............................... 93
5.1. Synopsis ................................................................................................... 93 5.2. Introduction .............................................................................................. 93 5.3. Experimental ............................................................................................ 96 5.4. Results and Discussion............................................................................. 104 5.5. Summary and Conclusions....................................................................... 117
VI BIOPRESERVATION OF SUPPORTED PHOSPHOLIPID BILAYERS ...................................................................................................... 118
6.1 Synopsis ................................................................................................... 118 6.2 Introduction .............................................................................................. 119 6.3 Experimental ............................................................................................ 121 6.4 Results and Discussion............................................................................. 124 6.5 Summary and Conclusions....................................................................... 130
VII CONCLUSIONS ............................................................................................. 131
7.1 Synopsis ................................................................................................... 133 7.2 Introduction .............................................................................................. 140
REFERENCES............................................................................................................. 144 VITA ............................................................................................................................ 157

x
LIST OF FIGURES
FIGURE Page
1.1 A schematic picture of the cell membrane composed of a lipid bilayer and integral proteins. ............................................................................ 5 1.2 Schematic representation of the different types of membrane proteins ............................................................................................................. 8 1.3 Cartoon representation of a typical procedure for the purification of membrane proteins....................................................................................... 12 1.4 Schematic diagram of a supported lipid bilayer on a planar borosilicate glass substrate ............................................................................... 14 1.5 The assembly of a solid supported lipid bilayer by Langmuir-Blodget (A) followed by the Schaffer technique (B) ........................................................... 15 1.6 Spontaneous formation of a solid-supported lipid bilayer via vesicle fusion to a planar borosilicate substrate. .......................................................... 17 1.7 Exposed domains of transmembrane proteins can become immobilized and denatured on the underlying inorganic solid support. ............................... 19 1.8 Methods for preparing supported lipid membrane........................................... 22 2.1 Chemical structure of Alexa Fluor 594 carboxylic acid, succinimidyl ester............................................................................................. 26 2.2 Schematic representation of the soft lithography procedure used to prepare microfluidic devices ........................................................................ 28 2.3 Photograph of a 7-channel microfluidic device ............................................... 29 2.4 Physical processes involved in a fluorescence recovery after photobleaching experiment .............................................................................. 31 2.5 A FRAP curve showing the physical processes involved in a fluorescence recovery after photobleaching experiment.................................. 32

xi
FIGURE Page
2.6 Inverted fluorescence microscope system used to obtain fluorescence recovery after photobleaching data. ................................................................. 35 2.7 Fluorescence recovery after photobleaching for a membrane containing 99.9 mol % POPC bilayer with 0.1 mol% Texas Red DHPE as a fluorescent probe.. ............................................................................................ 36 2.8 Three-dimensional schematic representation of solid-supported bilayer electrophoresis for the purification of membrane species.................... 38 2.9 Procedure to form bilayer and separate a mixture of dye labeled lipids by electrophoresis................................................................................... 39 2.10 Schematic representation of a TLC experiment ............................................... 41 3.1 Schematic diagram of the supported bilayer systems used in this work.......... 47 3.2 FRAP curve from a BSA supported POPC bilayer with 0.1 mol% Texas Red DHPE... .......................................................................................... 53 3.3 Diffusion of Texas Red-labeled lipids in POPC bilayers as a function of the BSA incubation concentration.. ............................................................. 54 3.4 Employment of a double-cushion system for maintaining the two- dimensional lateral mobility of annexin V....................................................... 63 3.5 BSA coated glass coverslips ............................................................................ 67 4.1 Schematic diagram of a solid supported lipid bilayer before and after applying an electric field.......................................................................... 71 4.2 Procedure to form bilayer and separate a mixture of dye labeled lipids by electrophoresis................................................................................... 75 4.3 Diagram of the experimental set up used in the separation experiments ......... 77 4.4 Comparison of the band broadening of Texas Red-labeled lipids migrating in either pure POPC (left) or POPC doped with 25 mol% cholesterol (right). ............................................................................................ 80

xii
FIGURE Page
4.5 Chemical structure of Texas Red sulfonyl chloride ......................................... 82 4.6 Image of a TLC plate after Texas Red DHPE separation ................................ 83 4.7 Images of Texas Red DHPE migrating through a 75 mol % POPC/ 25 mol % cholesterol bilayer after TLC purification ....................................... 85 4.8 Mass spectra of each fraction of the TLC purified Texas Red DHPE isomers .................................................................................................. 86 4.9 Composite image of the separation of TR DHPE and BODIPY DHPE in a POPC bilayer containing 25 mol % cholesterol after 35 minutes of applying a 100 V potential ........................................................ 88 4.10 Schematic diagram of the sample preparation protocol used for MS analysis ...................................................................................................... 89 4.11 Mass spectrometry image of the separated species in a lipid bilayer............... 91 5.1 Schematic representation of streptavidin bound to a supported
lipid bilayer ...................................................................................................... 95
5.2 Procedure to form supported bilayer and separate streptavidin proteins by electrophoresis............................................................................................. 100
5.3 Top view of the supported bilayer electrophoretic device ............................... 102 5.4 Schematic representation of the movement of peripheral proteins by supported lipid bilayer electrophoresis ............................................................ 103 5.5 Fluorescence recovery as a function of time for streptavidin in POPC bilayers containing 2 mol % biotin .................................................................. 105 5.6 Schematic representation of the separation of streptavidin singly bound from doubly bound to POPC bilayers containing 3 mol % biotinylated conjugated lipids ............................................................................................... 107 5.7 A plot of peak velocity vs. voltage for streptavidin bands moving through 75 mol % POPC and 25 mol % cholesterol ...................................................... 108

xiii
FIGURE Page
5.8 Fluorescence recovery as a function of time for streptavidin singly-bound (A) and streptavidin doubly-bound (B) in POPC bilayers containing 3
mol % biotinylated conjugated lipids.............................................................. 111 5.9 Epifluorescence image of the separation of streptavidin singly bound from doubly bound to POPC bilayers containing 2.5 mol % biotinylated conjugated lipids after 20 minutes of applied potential ............... 113 5.10 Schematic representation of the electrophoresis of streptavidin singly bound to POPC bilayers containing 0.5 mol % biotinylated conjugated lipids .......... 114 5.11 Schematic representation of the electrophoresis of streptavidin doubly bound to POPC bilayers containing 3 mol % biotinylated conjugated lipids ............. 116 6.1 A) Chemical structure of α,α-trehalose. B) Dehydration of supported phospholipid bilayers in the presence (right) and in the absence (left) of α,α-trehalose................................................................................................ 120 6.2 Images of supported POPO lipid membranes doped with 1 mol % Texas Red DHPE before drying (A), after drying (B) from 20 w/w % solutions of trehalose, after drying (C) in the absence of trehalose................................. 125 6.3 Fluorescence recovery after photobleaching curve for a supported bilayer shipped to Washington, D.C. and analyzed 20 days later ................................ 126 6.4 Images of supported POPC lipid membranes before drying (A), after drying (B) from 20 w/w % solutions of trehalose, after returned (C) from the United Kingdom, and after rehydrated (D) with deionized water.................... 128 6.5 Fluorescence recovery after photobleaching curve for a supported bilayer shipped to the United Kingdom and analyzed 15 days later ............................ 129 7.1 Strategy to separate transmembrane proteins using double cushion to prevent immobilization ................................................................................ 134 7.2 Schematic representation of a T-form microfluidic device used for the electrophoresis experiment ................................................................... 135 7.3 Texas Red- DHPE labeled lipids migrating in pure POPC bilayer.................. 137

xiv
FIGURE Page
7.4 Schematic diagram of a microfluidic device for proteomic applications......... 138 7.5 Schematic illustration of an electrophoresis experiment inside a microfluidic device........................................................................................... 139 7.6 Chemical structure of ganglioside GM1 ........................................................... 141 7.7 Catalysis on a chip............................................................................................ 142

xv
LIST OF TABLES
TABLE Page 3.1 Lateral mobility of Texas Red-labeled lipids in glass-supported lipid bilayers containing PEG-PE .................................................................... 56 3.2 Lateral mobility of Texas Red-labeled lipids supported in the double cushion system ..................................................................................... 58 3.3 Effect of PEG2000 mole density on the two-dimensional lateral mobility of fluorescently labeled annexin V ........................................ 60 3.4 Effect of polymer length (PEG550, PEG2000, PEG5000) on the two-dimensional lateral mobility of fluorescently labeled annexin V............................................................................................. 62 3.5 Lateral mobility of fluorescently labeled annexin V in the double cushion system ........................................................................... 65

1
CHAPTER I
INTRODUCTION
1.1 Purpose and Objectives
Advances in sensor technology, proteomics and drug design have led to an
intense interest in developing better and more accurate techniques for the study and
characterization of membrane proteins. One third of the genome of any organism
encodes membrane proteins such as receptors, transporters and ion channels.1,2 These
proteins play an essential role in many cellular and physiological processes, such as cell
signaling, transport of ions and nutrients, viral entry and pathogen attack. Cell signaling
governs basic cellular activities and coordinates cell actions. The ability of cells to
perceive and correctly respond to their microenvironment is the basis of development,
tissue repair, and immunity. Errors in cellular information processing are responsible for
diseases such as cancer, autoimmunity, depression, heart disease, diabetes, addictions
and cystic fibrosis. Therefore, a significant effort is devoted by scientists around the
world to understand these proteins, i.e. determining their sequence, structure, and
function.
Membrane proteins are notoriously difficult to prepare in pure, correctly-folded
form in sufficient quantity for drug discovery purpose. Because they make up 60 percent
________________________
This dissertation follows the style and format of the Journal of the American Chemical Society.

2
of all drug targets,3 researchers are working to overcome the challenges. Current
methods to separate and purify membrane proteins require expression of the protein
within a host cell, lysis of the membrane, solubilizing the proteins with a detergent
(denaturing them, causing loss of structure and function), and their separation by gel
electrophoresis techniques. After this experimental procedure, the yield of
transmembrane proteins is small; these constraints make it difficult to simultaneously
study the function and determine the sequence and structure of the macromolecules.
Therefore, improvements within this field will be extremely helpful for biotechnological
industry and biomedical research.
This dissertation focuses on the development of a system in which the function
and characterization of transmembrane proteins can be done simultaneously, utilizing a
biomembrane mimic consisting of a solid supported phospholipid bilayer (SLB) lab-on-
a-chip. The study focuses on the platform development, biophysical measurements of
transmembrane proteins and membrane species chromatography. Supported
phospholipid membranes retain two-dimensional lateral fluidity and provide an excellent
environment for membrane proteins. These key parameters made this membrane
supported platform an ideal system for applications in biosensors and lab-on-a-chip
devices. My work is divided into two areas. The first area is centered in the creation of a
new platform for allowing transmembrane proteins to freely move inside supported lipid
bilayers with the same mobility that can be found in vesicle systems. The second area
focuses on the creation of a new method to rapidly separate membrane components
using electrophoresis in a solid supported bilayer.

3
The first chapter of this dissertation emphasizes the purposes and objectives of
this dissertation, as well as background information in the area of study. An overview of
the analytical techniques and experimental procedures employed throughout this study is
presented in Chapter II. A double cushion system which affords two-dimensional lateral
mobility for a transmembrane protein is described in Chapter III. Chapter IV focuses on
the development of a simple on chip supported bilayer separation matrix for use in
separating membrane-bound species. Chapter IV also includes the imaging of the
separated species by Mass Spectrometry. In Chapter V we move one step further and
expand supported bilayer electrophoresis for the movement of peripheral proteins.
Chapter VI focused on the biopreservation of supported lipid bilayers using trehalose.
Finally, Chapter VII contains a compilation of conclusions and suggestions for future
work in the field.
1.2 The Cell Membrane Structure and Properties of the Cell Membranes
The biological membrane plays a significant role in almost all cellular processes.
The membrane surrounding the living cell serves several functions, such as control of
solute permeability and recognition events.4,5 Membranes regulate the flow of ions,
water and other molecules entering and leaving the cell. They contain biomolecules that
aid in directing the flow of information between cells, either by recognizing signal
molecules received from other cells or by sending chemical or electrical impulses to
other cells via signal transduction pathways.

4
In 1972, Singer and Nicolson, presented the fluid mosaic model to explain the
arrangement of biological species in the cell membrane.6 The model states that the
membrane consists of a phospholipid bilayer with proteins of various lengths and sizes
interspersed with cholesterol among the phospholipid. The struture is highly fluidic and
the lipids and proteins are free to move in the plane of the membrane. Figure 1.1 shows a
diagrammatic representation of the general structure of the biological membrane.
The bilayer consists of a thin layer of amphipathic lipids which spontaneously
self-arrange so that the hydrophobic tails are protected from the surrounding aqueous
environment, causing the hydrophilic head groups to orient toward the cytosolic and the
extracellular medium.5 The forces that hold these structures together are weak Van der
Waals, hydrophobic, hydrogen-bonding and electrostatic interactions. There are three
major types of lipids found in bilogical membranes: phospholipids, glycolipids and
cholesterol. Phospholipid molecules are the major structural components of most
membranes, including phosphatidylcholine (PC), phosphatidylethanolamine (PE),
phosphatidylserine (PS), phosphatidylinositol (PI), and cardiolipin. These molecules,
also called glycerophospholipids, consist of a phosphate-containing head group with
saturated or unsaturated hydrocarbon chains connected to a glycerol via ester bonds.
The length and degree of unsaturation of fatty acids chains have a profound effect on the
membrane fluidity. Glycosphingolipids, another class of lipids in the membrane, which
include cerebrosides and gangliosides, differs from phospholipids in that glycolipids
have a sugar molecule, such as glucose or galactose, instead of the phosphate-containing

5
Figure 1.1 A schematic picture of the cell membrane composed of a lipid bilayer and
integral proteins.7

6
head groups. These kinds of lipids are found only on the outer surface of the membrane
with their sugar moieties exposed to the extracellular environment.
Cholesterol is a small molecule non-uniformly distributed throughout the cell
membranes of eukaryotic organisms.8 It has a structure significantly different from the
phospholipids and glycolipids. Cholesterol contains a four-ring steroid structure together
with a short hydrocarbon side-chain and a hydroxyl group. It is known that cholesterol
modifies the structure and dynamic properties of the membrane by changing the packing
properties within the bilayer. Increasing amounts of cholesterol lead to a decrease in the
fluidity and permeability of the membrane. The interaction between cholesterol and
lipids are thought to be essential for the formation of rafts in the cell membrane. It has
also been shown that cholesterol interacts more strongly with saturated lipids than with
the highly unsaturated lipids.
Bilayer fluidity is affected by different factors such as temperature, fatty acid
composition and cholesterol content. At low temperature, the hydrocarbon tails of the
lipids can pack closely together to form an ordered arrangement know as the gel state.
As the temperature is increased, the lipid molecules vibrate more rapidly causing the
bilayer to melt into a more disordered arrangement, which is more fluidic. The
temperature at which the lipid bilayer melts is called the phase transition temperature;
for most biological membranes this is in the range 10-40 °C.

7
Membrane Proteins
While the lipid bilayer determines the basic structure of biological membranes,
the majority of the cellular and physiological processes are carried out by membrane
proteins. About 25-30% of all proteins are membrane proteins.1,2,9 Membrane proteins
are classified based on their interaction with the cell membrane. Peripheral membrane
proteins are those proteins that temporarily adhering to the biological membrane through
electrostatic interactions and hydrogen bonding with other membrane proteins or lipids
head groups. Peripheral proteins can be easily removed from the membrane surface by
mild treatments such as changes in pH or ionic strength.10 Transmembrane proteins refer
to those proteins that span the whole biological membrane. The transmembrane regions
of the proteins are either beta-barrels or alpha-helical. These proteins are key players in
numerous biological processes, such as cell signaling and the transport of ions and
nutrients. They are more difficult to isolate than peripheral proteins, as they are strongly
bounded to the membrane by hydrophobic interaction between the membrane proteins
and the lipid bilayer. This strong interaction can only be disrupted by the use of
detergents, organic solvents, or denaturant. Other proteins are associated to the lipid
membrane via a covalent linkage between the protein and the lipid head groups. Figure
1.2 shows the different types of membrane proteins.11
The first evidence for the existence of integral membrane proteins was obtained
from freeze-fracture techniques. In this procedure, developed back in the 60’s by Daniel
Branton and coworkers,12 membranes are rapidly frozen in liquid nitrogen before being
fractured with a cold microtome knife. The bilayer comes apart into its two monolayers,

8
Figure 1.2 Schematic representation of the different types of membrane proteins. A)
Single-pass transmembrane protein ; B) Multiple-pass transmembrane protein; C) Lipid-
linked membrane protein; D) Peripheral proteins.

9
which can be examined by electron microscopy.
Membrane proteins act as receptors, transporters, channels, converters, and are
responsible for key functions such as development, cell-cell interactions, energy
conversion, nerve transmission, muscle contraction, signaling, and apoptosis. Mutations
or changes in membrane proteins cause a vast array of human diseases such as cystic
fibrosis, diabetes, Alzheimer’s, hypertension, and heart failure. Much signaling occurs
across the cell membrane via G-protein-coupled receptors (GPCRs). GPCRs are the
largest group of membrane receptors on a cell surface and play important roles in many
signal transduction pathways, such as those found in the photoreceptors that trigger the
visual pathway.13 GPCRs account for about 3-4% of the human genome.13,14 They
possess a common structural motif of seven α-helical membrane-spanning domains.15
Mutations in these protein receptors are implicated in a wide range of human diseases
such as cancer, neurological, cardiovascular, degenerative, metabolic, and inflammatory
diseases.16 Despite the fact that this group of proteins accounts for over 50% of current
drug targets there is only very little structural information on GPCRs.17,18 In 2000, the
first 3D structure for a single GPCR was published.14
Ion and water channels embody another group of significant membrane
proteins.19 Potassium channels represent the largest and most diverse group of ion
channels and are involved in a multitude of physiological functions. In 1998,
MacKinnon and coworkers published the first potassium channel structure.20 These
tetrameric integral membrane proteins are involved in numerous fundamental biological
processes, including signal transduction, maintenance of cellular osmotic balance, and

10
electrical signaling in the nervous system. Mutations in ion channels are associated with
diverse human disorders. Aquaporins are membrane water channels that play critical
roles in controlling the water content of cells.21 Movement of water across the cell
membrane needs to be regulated in order to maintain the internal pressure of the cell.
This group of proteins, discovered by Peter Agre in the early nineties,21 facilitates the
movement of water molecules into and out of cells across cell membranes, preventing
the cell from swelling or shrinking. Aquaporins are involved in numerous human
disorders such as abnormalities of kidney function and loss of vision.22
Although membrane proteins represent the most important drug targets,23 very
limited structural information is currently available on membrane proteins, their
mechanisms of action, and the roles they play in disease. Only a small percent of the
structures of proteins available belong to the group of membrane proteins.24 The 3D-
structures of the proteins are essential for understanding their biological functions and
for the development of new drugs. The low success in the crystallization of membrane
proteins can be accredited to the following problems;2,18 (1) it is hard to purify
membrane proteins in sufficient amounts; (2) it is difficult to find an effective
overexpression system; and (3) membrane proteins tend to denature during the
purification procedures.
Current methods to purify proteins require expression of the protein of interest
within a bacterial or mammalian host cell. The first step of a purification process
involves lysis of the cell, which can be done using chemicals and enzymes, sonication or
a French Press. Centrifugation is used to separate soluble proteins from cell membranes

11
and other cellular components. The membrane proteins can be released from the
membrane by disruption of the cell membranes with ionic or non-ionic detergents. Non-
ionic detergents, such as Triton-X-100 and dodecyl-β-D-maltoside, are used most
commonly for extraction and purification of membrane proteins. After solubilization, the
proteins are commonly purified by different chromatographic techniques. These
techniques separate mixtures of proteins on the basis of their charge, their degree of
hydrophobicity, their binding affinity for certain molecules, or their size. Typically,
affinity chromatography is employed for the purification of proteins. In this
chromatographic technique, proteins are separated according to their ability to bind to a
specific ligand that is connected to a solid phase.10 Proteins that do not bind the ligand
are washed through the column; then the protein of interest is eluted from the column.
Other purification techniques such as ion exchange chromatography, gel filtration
chromatography, and size exclusion chromatography can also be employed for the
purification of proteins.10 Finally, the purity of the protein of interest is judged by
sodium dodecyl sulfate polyacrylamide gel electrophoresis (SDS-PAGE). In SDS-PAGE,
proteins are separated based on their size.10 Another way to separate a mixture of
proteins is by using two-dimensional gel electrophoresis.25 In 2-D electrophoresis
proteins are separated not only by their size but also by their charge. Figure 1.3 shows a
typical purification procedure used to purify membrane proteins.

12
Figure 1.3 Cartoon representation of a typical procedure for the purification of
membrane proteins.

13
1.3 Solid Supported Phospholipid Bilayers
Supported lipid bilayers (SLBs) have been widely employed as model systems
for mimicking native cellular structures. Pioneered by McConnell and coworkers, 26-28
this system has been used in fundamental and applied studies of lipid assembly,29,30
membrane structure,31,32 dynamics,33 multivalent ligand-receptor interactions,34,35
electrochemical properties of membranes,36 development of membrane-based
biosensors,37 and microscopic separation devices.38 Supported bilayers consist of a
continuous fluid membrane of lipids that is held near a surface, typically glass or SiO2,
as shown in Figure 1.4. The membrane is maintained by a balance of van der Waals,
electrostatic, hydrophobic, and steric interactions.39-41 A thin layer of water (Figure 1.4)
is trapped between the bilayer and the underlying solid support.42-45 This water layer
helps to maintain the lateral mobility of lipids in both leaflets of the bilayer, preserving
an important physical property of native biological membranes. This lateral fluidity
makes these platforms ideal for developing biosensors, because they can readily mimic
the same two-dimensional rearrangements that take place on cell surfaces during ligand-
receptor recognition events.41,46-48
Various methodologies can be employed to form solid supported lipid
bilayers.41,49-52 They may be readily formed by either Langmuir-Shafer methods53 or
through the fusion of small unilamellar vesicles (SUVs) to a planar solid substrate.26,28,29
The Langmuir-Shafer method has been used for the formation of hybrid-lipid bilayers,53
cushioned membranes,54,55 and for the incorporation of membrane species within the
solid-supported phospholipid membrane.27,54 This methodology involves the transfer of a

14
Figure 1.4 Schematic diagram of a supported lipid bilayer on a planar borosilicate glass
substrate. The membrane is separated from the underlying inorganic support by ~ 1 nm
thick layer of water. This water layer acts as a lubricant to maintain the fluidity of the
lipids in the bilayer.

15
Figure 1.5 The assembly of a solid supported lipid bilayer by Langmuir-Blodget (A)
followed by the Schaffer technique (B).

16
lower leaflet of lipids from the air-water interface by pulling a hydrophilic substrate
through a lipid monolayer, as shown in Figure 1.5.27,56 The hydrophobic tails of the
lipids will orient themselves toward the air, while the polar head groups orient towards
the hydrophilic substrate. The upper leaflet of the bilayer can be formed by horizontally
dipping the substrate through another lipid monolayer by a Shaefer technique or via the
fusion of vesicle.
The vesicle fusion method involves the spontaneous adsorption and fusion of
small unilamellar vesicles from an aqueous suspension with an appropriate substrate.
The process of vesicle fusion has been used to form supported bilayers on substrates,
such as borosilicate glass,27,41 oxidized silicon,27 titanium dioxide,57 mica,58-60 self-
assembled monolayers, oxide PDMS, polymers, and quartz. Figure 1.6 depicts a model
for the steps involved in the process of bilayer formation. In this model, small
unilamellar vesicles, having a diameter of 50 – 100 nm, will absorb, rupture, and
ultimately fuse together to form a continuous phospholipid bilayer on a solid substrate.
The process of vesicle fusion depends on a series of key parameters. The size of the
vesicles, concentration and charge will affect the vesicle curvature and their interaction
with the substrate. Surface charge, roughness and hydrophilicity also play important role
in the assembly of solid supported lipid membranes.
Supported lipid bilayers offer distinct advantages over other systems, such as
freestanding black lipid membranes and spherical lipid vesicles. Their planar geometry
stabilized the film’s. Also, they are easy to incorporate into microfluidics devices and
simple to analyze by many surface specific techniques, such as atomic force microscopy

17
Figure 1.6 Spontaneous formation of a solid-supported lipid bilayer via vesicle fusion to
a planar borosilicate substrate.

18
(AFM),61-65 total internal reflection fluorescence (TIRFM),66,67 vibrational sum
frequency spectroscopy (SFG),40 and surface plasmon resonance (SPR)68,69 can be
employed to monitor these solid -supported lipid bilayers.
While this system offers greater stability and robustness, the major disadvantage
is the successful incorporation of mobile transmembrane proteins within the solid
supported lipid bilayer.26,70 Many interfacial biochemical reactions on cell membranes
depend on the lateral mobility or fluidity of the membrane and its constituents. To
maintain these properties, the interaction between the membrane and the bare solid
surface should be minimal. However, the lipid membranes that are directly supported on
a substrate such as borosilicate, are only separated from the substrate by a thin (~ 1 nm)
layer of water. This water layer does not provide sufficient spacing between the
membrane and the substrate. (Figure 1.5). Thus, exposed functional extracellular
domains of an integral membrane protein can interact directly with the underlying
inorganic substrate (Figure 1.7), causing denaturation, loss of function, and inhibition of
lateral mobility. Due to this, such systems cannot be used to develop biological sensors
that can monitor change in protein interactions in response to extracellular stimulus.
1.4. Polymer Cushioned Phospholipid Bilayers
Although solid supported phosphoslipid membranes are excellent biological
platforms for the investigation of many cellular processes, such as multivalent ligand-
receptor binding, lipid micro-domain formation, membrane fusion, and pathogen attack,
they have difficulty mimicking an appropriate environment for transmembrane proteins.

19
Figure 1.7 Exposed domains of transmembrane proteins can become immobilized and
denatured on the underlying inorganic solid support.

20
Phospholipid membranes that are directly supported on a substrate, such as glass, are
only separated from the substrate by a thin (~ 1 nm) layer of water.27,43 This membrane-
substrate distance is usually not sufficient to avoid direct contact between
transmembrane proteins incorporated in the membrane and the underlying solid surface.
This problem is significant because transmembrane proteins can interact strongly with
the underlying substrate and can even become immobilized.
Efforts to overcome this problem have involved the use of soft polymeric
materials of typically less than 100 nm in thickness to separate the phospholipid
membrane from the bare substrate.55,70-72 The polymer film acts as a support, similar to
the cytoskeleton found in actual mammalian cell membranes. The addition of a polymer
cushion should significantly reduce the frictional coupling between the membrane
incorporated proteins and the solid support, avoiding the risk of protein denaturation.
The presence of the polymer cushion still allows for investigation by an array of surface
science techniques. Another potential advantage of polymeric platforms is the ability to
avoid nonspecific adsorption of aqueous proteins from solution. This kind of nonspecific
adsorption typically occurs at defect sites in a solid supported membrane lacking
polymer layers.
An important condition when choosing a successful polymer cushion is that the
supported lipid membrane must be thermodynamically and mechanically stable. Also,
the selected polymer should be very hydrophilic and should not engage in extensive
physical interactions with the membrane and the underlying solid support. Different
types of polymer cushions have been explored for supporting phospholipid bilayers.

21
These included chitosan, polyelectrolytes,73-76 cellulose,77 dextran,78 and lipopolymers
tethers.54,60,79-83 Also, some research groups have employed nanoporous materials84,85 as
a support for the lipid membrane.
One approach to separate the lipid membranes from the solid substrate is to use
hydrated polymers as cushions (Figure 1.8B). In 2003, Sackmann, Tanaka, and
coworkers used ultrathin layers of cellulose as a cushion for membranes with
incorporated, large transmembrane proteins, such as integrin receptors. Around 25 % of
the integrin receptors on the cellulose cushion retained their lateral mobility and
functionality. Integrins receptors incorporated in membranes, supported on bare glass
substrates were essentially immobilized. Another strategy used to overcome this problem
is to incorporate lipopolymers within the lipid bilayer (Figure 1.8C). Lipopolymers
consist of a soft hydrophilic polymer layer, presenting lipid like molecules at their
surface which insert into a phospholipid membrane and tether it to the polymer spacer.
Typically, the lipopolymer is chemically grafted to the underlying substrate via
photoreactive coupling, epoxy group linkage, silane bonding, or sulfur-metal bond
formation. Tamm and coworkers designed a tethered polymer-supported lipid bilayer, in
which PEG-conjugated phospholipids were covalently bonded to the silicate substrates.54
These lipopolymers cushions support lateral mobility of two membrane’s proteins,
cytochrome b5 and annexin V, that are not free to move on a membrane supported on a
bare glass substrate. Once again, only a small percent of the proteins (~20%) retain their
lateral mobility.

22
Figure 1.8 Methods for preparing supported lipid membrane. a) membrane supported on
solid substrate; b) membranes that are supported using a polymer cushion; c) membranes
that are supported using lipopolymer tethers.

23
1.5 Summary Membrane proteins are the targets of a large number of today’s pharmacological
and toxicological drugs and are responsible, in part, for their uptake, metabolism, and
clearance. Despite of their importance, the structure and function of membrane proteins
are not well understood, and only a small number of membrane proteins have been
studied in detail. Current methods employed for the purification of membrane proteins
are often laborious, and a high amount of functional protein is not easy to obtain. Due to
the transmembrane protein topology, detergents are required during the purification
procedures in order to maintain the correct folding of the protein. Detergents have a
negative impact on the yields and stability of the proteins and often interfere with the
crystallization process.
The main goal of the study reported herein is to develop novel biological
platforms that can be used in performing biophysical studies of transmembrane proteins
and in the purification of membrane species. This will open the door towards the study
of transmembrane proteins, the separation and “on-chip” purification for subsequence
proteomic analysis by, for example, mass spectrometry.
24
CHAPTER II
EXPERIMENTAL
2.1 Synopsis
This chapter provides a general overview of the main analytical and surface
analysis techniques used in this research project. The techniques presented here were
used to obtain physical, chemical and morphological data needed to obtain a better
understating of our model system.
Fluorescence recovery after photobleaching (FRAP)86 has been employed to
measure the two-dimensional lateral fluidity of different membrane components, such as
fluorescently labeled lipids and proteins. Supported lipid bilayer electrophoresis,87 a new
method for the purification and characterization of membrane species, will be introduced.
Methods to dry the supported bilayer and techniques, such as site specific
labeling of proteins, soft lithography for the preparation of microfluidic devices and thin
layer chromatography, will be explained.

25
2.2 Conjugation of Fluorescently Labeled Proteins
Specific dye labeling of proteins, such as streptavidin and IgG, was accomplished
by incubating the proteins with an amine reactive dye, such as Alexa Fluor-594. Alexa
Fluor dyes are generally brighter and less pH-sensitive than common dyes (e.g.
fluorescein, rhodamine) of equivalent excitation and emission. Also, the Alexa dyes
have high quantum efficiency, chemical and thermal stability, and high solubility in
aqueous solutions.
Figure 2.1 shows the chemical structure of Alexa Fluor 594. The Alexa Fluor 594
reactive dye has a succinimidyl ester moiety that reacts efficiently with primary amines
of proteins to form stable dye–protein conjugates. Succinimidyl esters react efficiently at
the pH 7.5–8.5. The labeling of proteins such as streptavidin and IgG has been
performed according to established procedures. Size exclusion chromatography (SEC)
was used to separate the labeled species from any unreacted dye present. Measurements
in a UV-absorption were done to calculate the concentration of the protein and the
degree of labeling. Alexa Fluor 594 dye–labeled proteins have an absorption and
fluorescence emission maximum of approximately 590 nm and 617 nm, respectively.

26
Figure 2.1 (Top) Chemical structure of Alexa Fluor 594 carboxylic acid, succinimidyl
ester (MW ~820).88 (Bottom) The Alexa Fluor 594 reactive dye has a succinimidyl ester
moiety that reacts efficiently with the primary amines of the proteins and thus allows for
the labeling of biomolecules.

27
2.3 Preparation of Microfluidic Devices by Soft Lithography Soft lithopgraphy, a microfabrication process developed by George Whitesides
and coworkers,89-91 refers to a set of methods for fabricating or replicating structures
using elastomeric stamps, molds, and conformable photomasks. This methodology has
some advantages over other forms of lithography, such as photolithography and electron
beam lithography. It is a convenient, effiencient, and low-cost method for carrying out
micro- and nanofabrication.92 This technique has been widely applied in the areas of
biotechnology and plastic electronics.
Figure 2.2 shows a schematic representation of the general procedure of the soft
lithography procedure used to prepare microfluidic devices.93,94 In the first step a desired
structure or pattern is transferred from a photomask to a photoresist polymer coated glass
slide by exposing the photoresist coated glass to UV radiation. S-1813, a low viscosity
positive photoresist is used to coat the microscope glass slides. Next, the exposed slides
are developed by chemical etching according to established procedures.90 Remaining
areas of undesired photoresist are removed with acetone. At this step, a profilometer is
used to characterize the quality of the product. In the last step, the device is created by
pouring a degassed resin, such as poly(dimethylsiloxane) PDMS, on the top of the
etched surface. After the curing process is done, a negative image of the photomaster is
transferred to the PDMS stamp. Figure 2.3 shows a picture of a 7-channel PDMS
microfludic device.

28
Figure 2.2 Schematic representation of the soft lithography procedure used to prepare
microfluidic devices.95

29
Figure 2.3 Photograph of a 7-channel microfluidic device. A red dye was used for
visualization purposes.

30
2.4 Fluorescence Recovery after Photobleaching (FRAP)
The technique of fluorescence recovery after photobleaching (FRAP) has long
been recognized as a powerful tool for investigating the two-dimensional lateral mobility
of fluorescent particles, for example, the motion of fluorescently labeled lipids and
proteins within membranes.86,96 Information obtained from FRAP experiments includes:
1) identification of transport process type; 2) determination of the diffusion constant; and
3) the fraction of total fluorophores, which is mobile.
A schematic representation of the technique is shown in Figure 2.4. First, a
specific region of the sample containing mobile fluorescent molecules is photobleached
by a high-intensity focused laser beam. This causes irreversible photochemical bleaching
of the fluorophores in that region. The exchange of bleached with unbleached molecules
leads to a recovery of the initial fluorescent intensity. The measured data from a FRAP
experiment is the time-dependent recovery of the fluorescence intensity inside the bleach
spot. Figure 2.5 shows a graphical representation of this phenomenon.
The fluorescence intensity before and throughout the experiment are normalized
using the following equation:
0FFFF
yi
to
−−
= (2.1)
where y is the normalized fluorescence intensity, Fi is the fluorescence intensity before
bleaching, Fo is the intensity of the photobleached region at times equal to 0, and Ft is
the intensity of the bleached region as a function of time. An assumption in our FRAP
experiments is that the fluorescently labeled species is uniformly distributed within an

31
Figure 2.4 Physical processes involved in a fluorescence recovery after photobleaching
experiment.

32
Figure 2.5 A FRAP curve showing the physical processes involved in a fluorescence
recovery after photobleaching experiment.

33
infinite two-dimensional plane and that we are only measuring the two-dimensional
diffusion of that species.86 Applying first order kinetics allows us to fit the FRAP curve
to a single exponential rise to maximum equation as follows:
)ktea(y −−= 1 (2.2)
where a is the mobile fraction of the species and k is a constant. The time at half
recovery, denoted as t1/2 may be calculated by t1/2 = ln(2/k) since the process follows first
order kinetics.
To calculate the lateral diffusion we will employ the following equation86:
DwD γτ 2/1
2
4=
where w is the full width at half-maximum of the Gaussian profile of the focused beam,
t1/2 is the half time of fluorescence recovery, and γD is a correction factor that depends
on the bleach time and the geometry of the laser beam and varies from 1.1 to 1.45.
It should be noted that the FRAP experiment depends on the control of various
parameters. The laser beam is typically Gaussian and circular; however, variants of this
technique may employ an elliptical beam.97 The laser power and bleach time must
remain constant in order to insure consistent results. For rapidly-diffusing molecules the
bleach time must be short and post-bleach images recorded rapidly. Other factors that
affect the diffusion measurements by FRAP include temperature and photobleaching of
the sample during data acquisition. This may be controlled by adjusting the image
acquisition time intervals during the time-laps imaging. The fluorophores that are used

34
as fluorescent markers should be bright and stable under low intensity illumination. This
is important during image acquisition in the pre- and postbleach phase. Also, the
fluorophores should bleach quickly and irreversibly under high intensity illumination
during the bleach phase.
The fluorescence recovery after photobleaching (FRAP) curves used for this
study were obtained by irradiating our samples with a 2.5 W mixed gas Ar+/Kr+ laser
beam (Stabilite 2018, Spectra Physics). 100 mW of power was directed onto the sample
for a time period of approximately one second. The beam, which was sent through a 10X
objective, had a full width of ~ 13 μm at the sample plane. The recovery of the
photobleached spot was followed as a function of time using time-lapse imaging under a
fluorescence microscope (Nikon Eclipse TE2000U) equipped with a Sensys CCD
camera (Photomatrics, Roper Scientific) and employing MetaMorph software (Universal
Imaging). The fluorescence inverted microscopy system used for making FRAP
measurements is shown in Figure 2.6.
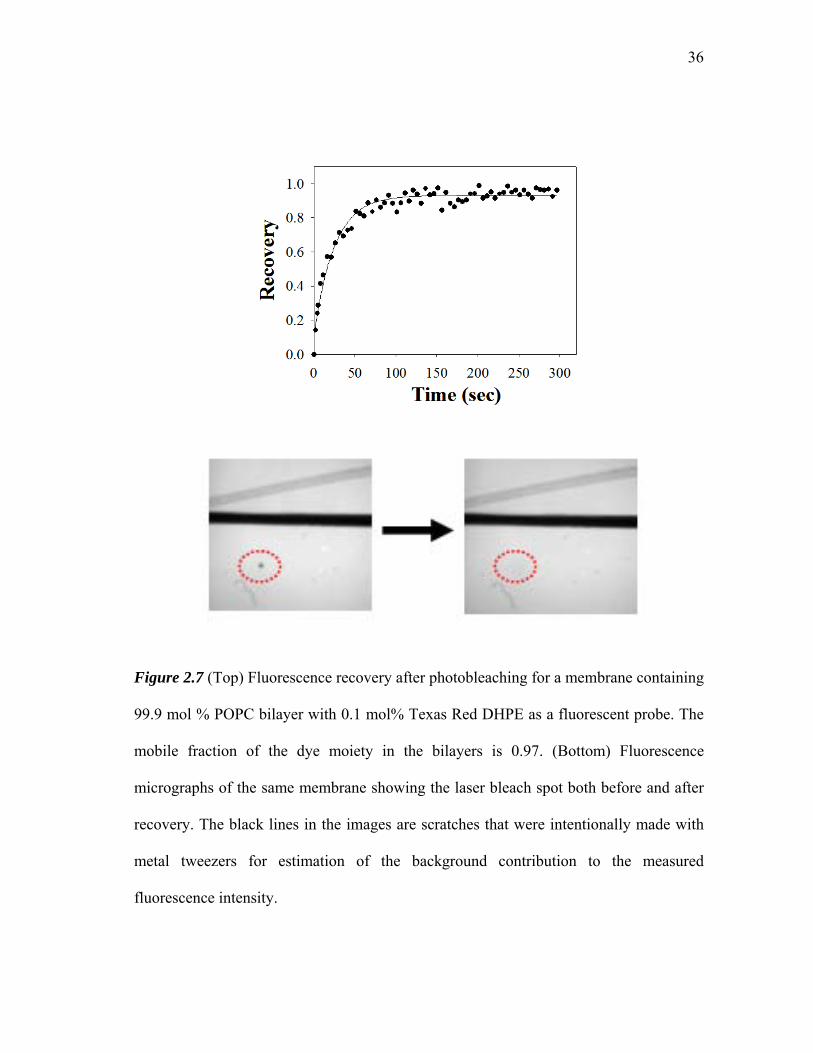
Figure 2.7 shows a typical FRAP curve for a phospholipid bilayer supported on a
hydrophilic glass substrate. The bilayer is composed of 99.9 mol %
phosphatidylcholine lipids and 0.1 mol % Texas Red DHPE as fluorescent probe. A
diffusion constant of 4.3 (±0.2) x 10-8 cm2/s with 97% recovery was obtained for labeled
phospholipids within the bilayer.

35
Figure 2.6 Inverted fluorescence microscope system used to obtain fluorescence
recovery after photobleaching data.
36
Figure 2.7 (Top) Fluorescence recovery after photobleaching for a membrane containing
99.9 mol % POPC bilayer with 0.1 mol% Texas Red DHPE as a fluorescent probe. The
mobile fraction of the dye moiety in the bilayers is 0.97. (Bottom) Fluorescence
micrographs of the same membrane showing the laser bleach spot both before and after
recovery. The black lines in the images are scratches that were intentionally made with
metal tweezers for estimation of the background contribution to the measured
fluorescence intensity.

37
2.5 Supported Lipid Bilayer Electrophoresis
Charged species within a supported phospholipid membrane have been manipulated
or separated by applying electric fields. Boxer and coworkers explored the use of electric
fields to induce the motion of glycan-phosphatidyl inositol (GPI) tethered proteins in
supported bilayers. Others charged species, such as lipids and adsorbed DNA molecules,
have been manipulated in this manner.
Recently, we have developed a method that can be used to separate charged species
using electrophoresis in a solid supported phospholipid bilayer. Figure 2.8 shows a
schematic representation of the electrophoresis device. The device consists of a planar
phospholipid bilayer supported on a hydrophilic substrate, such as glass (Fig. 2.9). On
one side of the bilayer, liposomes containing fluorescently-conjugated
phosphatidylethanolamine lipids (two isomers of Texas Red dye and a green dye,
BODIPY) were spliced. Then an electric field was applied across the supported
membrane laterally. The electric field induced an electrophoretic movement of the
charged species within the supported membrane. Species separated based on their charge,
size, and interaction with the surrounding bilayer medium. The device functions much
like a chromatographic separation, except here our separation medium is the bilayer
itself, which preserves the native environment of the species within it, avoiding
denaturation due to exposure of the species to external factors. This is an advantage over
conventional membrane protein purification techniques, such as gel electrophoresis.

38
Figure 2.8 Three-dimensional schematic representation of solid-supported bilayer
electrophoresis for the purification of membrane species. The top panel shows the solid-
supported bilayer with the left most side containing a mixture of species to be separated.
Two platinum electrodes are placed along the edge of the bilayer and a potential applied
across them. After a certain amount of time, the species separate into well-defined bands,
as shown in the lower panel.

39
Figure 2.9 Procedure to form bilayer and separate a mixture of dye labeled lipids by
electrophoresis. (1) First form a bilayer containing 25 mol% cholesterol (yellow) in
POPC lipids (gray) via vesicle fusion. (2) Gently press the edge of a glass coverslip slide
coated with Teflon tape into the bilayer and plow out a thin line of the bilayer. The
resulting region will be devoid of any bilayer. (3) Add vesicles containing the mixture of
fluorophores to be separated to the bulk aqueous phase above the supported bilayer.
These vesicles will fuse in the bare region. (4) Apply a potential laterally across the
bilayer and observe the resulting separation of fluorescent lipids, as indicated by the
colored arrows corresponding to each type of lipid.

40
2.6 Thin Layer Chromatography (TLC)
Thin Layer Chromatography, introduced in 1938 by Izmailov and Shraiber, is a
chromatographic technique commonly used to separate mixtures of substances into their
components. This chromatography technique consists of a stationary phase and a mobile
phase. The stationary phase is made of a thin layer of absorbent material, usually silica
gel, aluminum oxide, or cellulose coated onto a piece of glass, metal, or rigid plastic.
The mobile phase is an organic solvent or mixture of organic solvents. The mobile phase
moves up through the stationary phase via capillary action. As the mobile phase travels
up the plate, the different components of the mixtures travel at different rates and the
mixture is separated into the different components. TLC takes advantage of the different
affinity of the analyte with the mobile and the stationary phases to achieve separation of
the mixture.
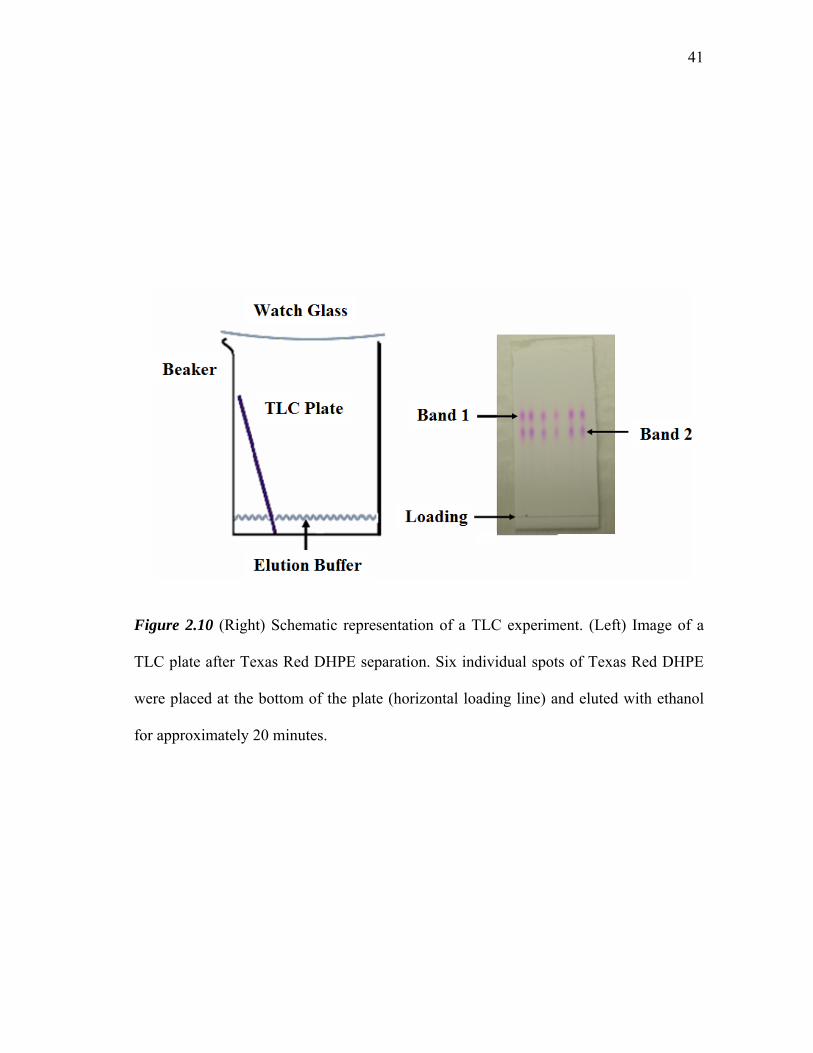
Herein, TLC was used to determine and purify the different isomers of Texas
Red-DHPE. Several small spots of Texas Red DHPE in chloroform were spotted on a
TLC plate and eluted with 100% ethanol (Figure 2.10). Texas Red labeled phospholipids
were recovered from the TLC plate by carefully scraping the separated bands with a
razor blade and resuspending in ethanol to extract the lipids from the silica beads. The
mixture was centrifuged at 13,500 RPM (5415, Eppendorf) for 5 minutes and the
supernatant was collected. This procedure was repeated until no Texas Red
phospholipids were detected in the pellet. In order to remove the ethanol, the samples
were dried with nitrogen, followed by desiccation under vacuum for 1 hour.
41
Figure 2.10 (Right) Schematic representation of a TLC experiment. (Left) Image of a
TLC plate after Texas Red DHPE separation. Six individual spots of Texas Red DHPE
were placed at the bottom of the plate (horizontal loading line) and eluted with ethanol
for approximately 20 minutes.

42
CHAPTER III
DOUBLE CUSHIONS ENABLE THE FORMATION OF FLUID
TRANSMEMBRANE PROTEINS IN SUPPORTED LIPID MEMBRANES
3.1 Synopsis
Supported lipid bilayers (SLBs) have been widely used as model systems to
study cell membrane processes because they preserve the same two-dimensional
membrane fluidity found in living cells. One of the most significant limitations of this
platform, however, is its inability to incorporate mobile transmembrane species. It is
often postulated that transmembrane proteins reconstituted in SLBs lose their mobility
because of direct interactions between the protein and the underlying substrate. Herein,
we demonstrate a high mobile fraction for a transmembrane protein, annexin V. Our
strategy involves supporting the lipid bilayer on a double cushion, where we not only
create a large space to accommodate the transmembrane portion of the macromolecule,
but also passivate the underlying substrate to reduce non-specific protein-substrate
interactions. The thickness of the confined water layer can be tuned by fusing vesicles
containing polyethyleneglycol (PEG)-conjugated lipids of various molecular weights to
a glass substrate that has first been passivated with a sacrificial layer of bovine serum
albumin (BSA). The two-dimensional fluidity of these systems was characterized by
fluorescence recovery after photobleaching (FRAP) measurements. Uniform and mobile
phospholipid bilayers with lipid diffusion coefficients around 3 × 10⁻⁸ cm2/sec and
percent mobile fractions over 95 % were obtained. Moreover, we obtained annexin V

43
diffusion constants around 3 x 10⁻⁸ cm2/sec with mobile fractions up to 75%. This
represents a significant improvement over bilayer platforms fabricated directly on glass
or using single cushion strategies.
3.2 Introduction
Supported lipid bilayers (SLBs), pioneered by McConnell et al.,26-28 have
successfully reproduced many aspects of cell membrane behavior. They possess the
same two-dimensional fluidity and have been employed to investigate lipid assembly,
29,30 membrane structure,31,32 dynamics,33 and multivalent ligand-receptor binding.34,35
They have even been used in the development of biosensors platforms37 and separation
devices.98 Despite this, the incorporation of transmembrane proteins into SLBs has not
yet been satisfactorily achieved. The problem lies in the limited space between the
bottom leaflet of the bilayer and the underlying solid support. This distance, which is
typically only on the order of one nanometer, is not usually sufficient to accommodate
species that protrude extensively beyond the lower leaflet of the bilayer. Several
research groups have explored methods to increase this spacing. Most strategies involve
the placement of a polymer cushion between the membrane and support.54,60,71,73-83,99-103
To date, however, these experiments generally report that proteins which protrude
extensively beyond the lower leaflet have a 25% mobile fraction or less. In other words,
more than three quarters of the protein molecules are immobilized by the underlying
support and perhaps partially denatured.
SLBs have a complex series of interactions with underlying planar glass

44
supports. These include van der Waals, electrostatic, hydrophobic, and steric
interactions.39-41 Such forces act together to leave a thin layer of hydration water trapped
between the bilayer and the substrate.42-45 This water layer helps to maintain the lateral
mobility of lipids in both leaflets of the bilayer. It would be important to extend this
same principle to membrane proteins. To this end, soft, hydrophilic polymeric materials
have been a popular choice for cushion materials because they readily imbibe large
amounts of water.55,70,71,104 Ideally, the polymer film should act like the cytoskeleton
found in mammalian cell membranes. Such an approach, in principle, should
significantly reduce frictional coupling and avoid protein denaturation. Methods for the
preparation of polymer supports include the chemical grafting of polymers, such as
cellulose or dextran directly onto the solid surface followed by the subsequent deposition
of lipid bilayers.77,78 A slightly different approach involves the reconstitution of
lipopolymers that also provide a spacer between the underlying substrate and the
phospholipid bilayer.54,60,71,79-83,101-103,105 The difference in this case is that alkyl side
chains emanating from the lipopolymer directly intercalate into a nascently transferred
lipid film.
Despite extensive work on cushion designs, only a few studies describe the use
of these systems to study the lateral mobility of transmembrane proteins.54,99,106,107
Tamm and coworkers54 designed a PEG-conjugated phospholipid membrane that could
be covalently bonded to silicate substrates. Lateral diffusion of cytochrome b5 and
annexin V were measured by FRAP in this system. Although lateral diffusion
coefficients were obtained, only 25% of the cytochrome b5 displayed a diffusion

45
constant value that was on the same order of magnitude as the lipids. The rest of the
cytochrome b5 molecules diffused several orders of magnitude more slowly or not at all,
due presumably to interactions between the proteins and the underlying polymer network.
Similar results were obtained for annexin V. Another protein mobility study was
performed by Tanaka, Sackmann, and coworkers.99 In this case human, platelet integrin
αIIbβ3 was investigated in a supported bilayer system that rested on a cellulose cushion.
Again, only about one quarter of the proteins were mobile in the presence of the cushion
and none were mobile without it. In a third example, Smith, Wirth, and coworkers107
studied the mobility of the human delta-opioid receptor on acrylamide cushions of
various thicknesses. In this case, however, only data for an individually mobile protein
molecule were reported rather than the mobile fraction for a population of membrane
embedded proteins. Finally, Brozik and coworkers used nanoporous microbeads rather
than a polymer cushion strategy to support lipid membranes with bacteriorhodopsin.85
High protein mobile factions were obtained (~78%) with D = 3.8 x 10⁻¹⁰ cm2/sec for
proteins in the pores of the bead. It would be important, if the same type of mobility can
be extended to systems with planar geometry.
In the work described herein, we investigate the two-dimensional fluidity of a
transmembrane protein, annexin V, reconstituted into a double cushion planar supported

46
membrane system. Annexin V is a multi-helical intracellular protein that binds to
negatively charged phospholipids in a Ca2+-dependent manner.108 The function of this
protein has been ascribed to different membrane-associated events including vesicular
trafficking, membrane fusion, and ion channel formation.109 It has been reported that
annexin V forms ion channels in phospholipid bilayers at mildly acidic pH values.110-112
Figure 3.1 illustrates our strategy for achieving high mobile fractions of annexin
V. A first cushion layer is formed by uniformly adsorbing BSA onto a planar glass
support. This protein monolayer passivates the substrate and thereby helps prevent
strong interactions with the underlying oxide surface. The second layer of the cushion is
formed when lipid vesicles containing (poly)ethyleneglycol-conjugated lipids are fused
on top of the first layer. The spacing between the BSA film and the lower leaflet of the
bilayer can be modulated by changing the number density and molecular weight of the
PEG lipopolymer incorporated into the lipid bilayer. The best results were achieved
when a 0.1 mg/ml BSA solution was incubated over the surface for 20 minutes and the
lipid bilayer consisted of 0.5 mol% PEG5000. In that case, the mobile fraction of annexin
V was ~ 75% with a diffusion constant of 3 x 10⁻⁸ cm2/sec.

47
Figure 3.1 Schematic diagram of the supported bilayer systems used in this work. (A) A
bilayer supported directly on a bare glass substrate. Membrane proteins, which protrude
beyond the lower leaflet of the bilayer, become immobilized by direct interactions with
the underlying glass surface. (B) The double cushion system creates more space
between the bilayer and support and also mitigates interaction with the substrate.
PEG layer
A B
BSA layer
Bilayer
Substrate Substrate
Transmembrane Protein

48
3.3 Experimental
Materials
1-Palmitoyl-2-oleoyl-sn-glycero-3-phosphocholine (POPC), bovine brain L-α-
phosphatidylserine (brain-PS), and 1,2-dioleoyl-sn-glycero-3-phosphoethanolamine-N-
[methoxy(poly(ethylene glycol))] (PEG-PE) were purchased from Avanti Polar Lipids
(Alabaster, AL) with PEG molecular weights of 550, 2000 and 5000. N-(Texas Red
sulfonyl)-1,2-dihexadecanoyl-sn-glycero-3-phosphoethanolamine (Texas Red DHPE)
was obtained from Molecular Probes (Eugene, OR). Bovine serum albumin (BSA) was
purchased from Sigma Aldrich (St. Louis, MO). Phycoerythrin-labeled recombinant
human annexin V with a molecular weight of 35,800 Da, was obtained from Alexis
Biochemicals (San Diego, CA).
Purified water from a NANOpure Ultrapure Water System (Barnstead, Dubuque,
IA) was used to prepare all buffer solutions. The water had a minimum resistivity of 18
MΩ⋅cm. Phosphate-buffered saline (PBS) was prepared using 10 mM sodium phosphate
with the addition of 150 mM NaCl (Sigma-Aldrich). The pH was adjusted to 7.4 by the
dropwise addition of NaOH (EMD, Germany). Tris(hydroxymethyl)aminomethane was
used to prepare 10 mM Tris (Fluka-BioChemika) buffer with 8 mM CaCl2 (Acros
Organic), and 100 mM sodium chloride (Sigma-Aldrich). Polydimethylsiloxane (PDMS)
was used to fabricate well structures. The polymer and cross-linker were purchased from
Dow Corning (Sylgard Silicone Elastomer-184, Krayden Inc.).

49
Small Unilamellar Vesicles
Small unilamellar vesicles (SUVs) were prepared as previously reported.29,113,114
Briefly, the desired amount of POPC, PEG-PE lipopolymer, and PS were mixed in
appropriate proportions from stock solutions in chloroform and allowed to dry under a
stream of nitrogen followed by desiccation under vacuum for 4 hours. In some cases 0.1
mol% Texas Red DHPE was used as a fluorescent probe. After evaporation of the
solvent, the lipids were reconstituted in Tris buffer and subjected to ten freeze-thaw
cycles by alternating between immersion in liquid nitrogen and a 30 ºC water bath. The
solution was then extruded five times through a polycarbonate filter (50 nm pore size) to
produce vesicles of uniform size. Small unilamellar vesicles prepared by this method
were 80 ± 10 nm in diameter as determined by dynamic light scattering using a 90Plus
Particle Size Analyzer from Brookhaven Instrument Corp.
Supported Lipid Membranes
Supported lipid bilayers were prepared by the adsorption and fusion of SUVs
onto clean planar borosilicate coverslips (VWR International).26,46,115,116 Polymer-
conjugated bilayers were prepared by the same vesicle fusion method, but using the
desired amount of PEG-PE as previously reported.113,117 Coverslips were cleaned with
7X detergent solution (MP Biomedicals, Solon, OH)66 and annealed in a kiln at 550 °C
for five hours to yield flat surfaces with room mean square roughness (RMS) values on
the order of ~0.13 nm over a 1 μm2 area as determined by atomic force microscopy.
Vesicle fusion was performed via the introduction of a 100 μL SUV solution onto the

50
clean glass. The solution was confined to a circular area (~8 mm in diameter) in the
center of the surface by a thin hydrophobic PDMS microwell.113 After a 10 min
incubation period, the bilayer was extensively rinsed with buffer to remove excess
vesicles.
Lipid bilayers supported on a protein film were prepared by fusing vesicles in a
manner similar to the one described above. In this case, however, a 100 μL BSA solution
in Tris was introduced to the microwell first, incubated for a period of 20 minutes,
followed by thorough rinsing with buffer. Solutions of BSA were prepared at
concentrations ranging from 0.001 mg/ml to 0.5 mg/ml. Prior to use, the protein
solutions were centrifuged at 13,500 RPM for 20 minutes (5415, Eppendorf) to remove
any aggregates from the bulk solution.
Reconstitution of Annexin V
Each supported bilayer was incubated for 20 minutes with Tris buffer containing
8 mM CaCl2 before the introduction of protein solution. It should be noted that the
divalent metal ion is required for annexin V incorporation into the membrane.54,108 At
this point, a solution of phycoerythrin-labeled annexin V (0.1 mg/ml) in Tris buffer was
introduced into the bulk solution above the surface and incubated for 30 minutes. The
bilayers were extensively washed with a buffer solution containing EDTA (10 mM Tris,
pH 6.0, 100 mM NaCl, and 5 mM EDTA) to remove any excess protein bound to the
upper leaflet. It has been previously shown that annexin V molecules, which are not
fully inserted into the bilayer, can be easily removed from the interface by exposing the

51
system to 5 mM EDTA.118,119 We, therefore, exposed our system to the same conditions
to remove all partially bound annexin V molecules from the interface before performing
FRAP experiments. In a final step, fresh Tris was flowed over the bilayer at pH 6.0 and
FRAP experiments were performed. Under these conditions, the annexin V should be
fully inserted into the membrane.110-112 By contrast, working at somewhat higher pH
does not lead to protein insertion.120
Fluorescence Recovery after Photobleaching
FRAP86,96 experiments were carried out with a 2.5 W mixed gas argon/krypton
ion laser (Stabilite 2018, Spectra Physics). Samples were irradiated at 568.2 nm with 100
mW of power for 1 second. A 13 μm full width at half-maximum bleach spot was made
by focusing the light onto the bilayer through a 10× objective. The fluorescence recovery
was measured using MetaMorph Software (Universal Imaging). The fluorescence
intensity of a bleached spot was determined as a function of time after background
subtraction and intensity normalization. All fluorescence recovery curves were fit to a
single exponential equation to obtain the mobile fraction of labeled lipids and proteins
and the half-time of recovery, t1/2. The equation employed to calculate the lateral
diffusion constant of dye-labeled lipids and proteins was as follows:86
D = (w2/ 4t1/2) γD (3.1)
where w is the full width at half-maximum of the Gaussian profile of the focused beam
and γD is a correction factor that depends on the bleach time and the geometry of the
laser beam.86 The value of γD was 1.1.

52
3.4 Results Protein Supported Lipid Membranes
In a first set of experiments, BSA was coated onto clean glass coverslips from a
Tris buffer solution at concentration of 0.1 mg/ml. After rinsing, POPC vesicles were
introduced above the protein film in Tris buffer at a concentration of 1 mg/mL. The
vesicles contained 0.1 mol% Texas Red DHPE for visualization under an
epifluorescence microscope. The inset images in Figure 3.2 show fluorescence
micrographs of this bilayer immediately after photobleaching and again 300 sec later.
The FRAP curve denotes the fluorescence intensity in the bleached spot as a function of
time. As can be seen, relatively complete recovery was observed with a diffusion
constant of 4.0 (±0.3) × 10-8 cm2/sec. Moreover, the sample recovered roughly 97% of
its initial fluorescence at t = ∞.
These experiments were repeated at a total of 7 different BSA concentrations
ranging from 0.01 to 0.5 mg/ml. The diffusion constant values for Texas Red DHPE in
the POPC membranes are plotted in Figure 3.3. As can be seen, these values remained
unchanged between 0.01 and 0.1 mg/ml BSA. Recovery was nearly complete in each
case (0.97 ± 0.01). At 0.2 mg/ml, the diffusion slowed dramatically and the mobile
fraction of Texas Red DHPE was 0.60. Long-range diffusion was completely arrested
when the BSA concentration was 0.3 mg/ml or higher.
Analogous experiments were performed with membranes containing 79.9 mol%
POPC, 20 mol% brain-PS and 0.1 mol% Texas Red DHPE. In that case, however, the
results were quite different. Indeed, no fluorescence recovery was observed for these

53
Figure 3.2 FRAP curve from a BSA supported POPC bilayer with 0.1 mol% Texas Red
DHPE. The BSA was introduced at 0.1 mg/ml. The black lines in the inset fluorescence
images are scratches that were intentionally made with pair of metal tweezers for
estimation of the background contribution to the measured fluorescence intensity. The
dashed red circles highlight the position of the beach spot. The inset images, which are
230 μm x 230 μm, were captured immediately after photobleaching and again 300 sec
later.

54
Figure 3.3 Diffusion of Texas Red-labeled lipids in POPC bilayers as a function of the
BSA incubation concentration.

55
membranes introduced above BSA films formed from 0.1 mg/mL solutions. It has been
reported in the literature that the addition of Ca2+ into the buffer can sometimes aid
bilayer formation when PS lipids are present.57 We therefore repeated these experiments
in the presence of 8 mM Ca2+ under otherwise identical conditions. Again, the Texas
Red DHPE probes were found to be completely immobile. A final control was
performed in the in the presence of PS lipids without the BSA cushion. In this case the
bilayer was mobile with D = 3.5 (± 0.1) × 10-8 cm2/s and a 0.90 mobile fraction.
Polymer Supported Lipid Membranes without BSA
Polymer supported lipid bilayers were prepared as previously reported.113 The
lipopolymer was added to POPC vesicles containing 20 mol% brain-PS and 0.1 mol%
Texas Red DHPE. PEG-PE lipids with three different molecular weights and
concentrations were employed: 7 mol% for PEG550-PE, 1.4 mol % for PEG2000-PE, and
0.5 mol % for PEG5000-PE, respectively. These particular values were chosen to
correspond to the onset of the mushroom-to-brush transition as calculated by Marsh and
coworkers.121 All experiments were performed on clean glass coverslips without the
introduction of BSA. Fluorescence imaging experiments confirmed the supported
membranes were homogeneous down to the diffraction limit. FRAP measurements were
also made and the values for the diffusion constant and mobile fraction are provided in
Table 3.1. As can been seen, these values were consistent with high quality supported
bilayers in each case. It should distinguished that the PEG moiety is not chemically
grafted to the surface and that the lipopolymer remains mobile on the surface under these

56
Table 3.1 Lateral mobility of Texas Red-labeled lipids in glass-supported lipid bilayers
containing PEG-PE.
Type of Support Diffusion Coefficient (× 10-8 cm2/s)
Mobile Fraction (%)
PEG 550
PEG 2000
PEG 5000
3.5 ± 0.1
3.6 ± 0.2
3.8 ± 0.4
95.8 ± 3.6
93.3 ± 3.4
93.5 ± 3.1

57
conditions.113 Finally, it should be pointed out that the experiments associated with
Table 3.1 were performed in the absence of Ca2+. Control experiments were done in the
presence of 8 mM CaCl2 and these gave identical results to those shown in the table
within experimental error.
Double Cushion System
Novel double cushion systems were investigated whereby PEGylated membranes
were fused to substrates coated with BSA. To construct these systems, 0.1 mg/ml BSA
was introduced above the planar glass substrates and allowed to incubate for 20 min.
This concentration was chosen because it represents the highest protein concentration at
which full mobility of the lipids was still observed in Figure 3.3. After extensively
rinsing, POPC vesicles with 20 mol% brain-PS, 0.1 mol% Texas Red DHPE, and 7
mol% PEG550-PE were fused to a protein-coated coverslip. The lateral diffusion
coefficient of Texas Red DHPE was 3.2 ± (0.3) × 10-8 cm2/sec with a mobile fraction of
94%. This result is quite significant because it indicates the presence of the PEG cushion
mitigates the interactions between the BSA and the negatively charged brain PS to a
sufficient extent to allow long range bilayer fluidity. Control experiments revealed that
the addition of 8 mM CaCl2 to the buffer had not influence on either the diffusion
constant or the mobile fraction.
These experiments were repeated with PEG2000 and PEG5000 at their respective
mushroom-to-brush concentrations and the results are provided in Table 3.2. As can be
seen, both the diffusion constant and mobile fraction remained quite high for all PEG
chain lengths employed.

58
Table 3.2 Lateral mobility of Texas Red-labeled lipids supported in the double cushion
system.
Double Cushion
System Diffusion Coefficient
(× 10-8 cm2/s) Mobile Fraction
(%) PEG 550 – BSA
PEG 2000 - BSA
PEG 5000 – BSA
3.2 ± 0.3
3.2 ± 0.4
3.0 ± 0.4
94.0 ± 4.6
95.3 ± 3.1
93.0 ± 1.7

59
Reconstitution and Lateral Diffusion of Annexin V
In a next set of experiments, the lateral diffusion of annexin V was investigated
in lipid bilayers containing 20 mol% PS, 79.9 mol% POPC, and 0.1 mol% Texas Red
DHPE on bare glass substrates. After a bilayer was formed, 0.1 mg/ml phycoerythrin-
labeled annexin V was introduced above the interface in Tris buffer with 8 mM CaCl2
and incubated for 30 minutes. Unbound protein molecules were rinsed away with EDTA
and fresh buffer was added back to the system. Finally, diffusion constant and mobile
fraction measurements of the biomacromolecules were made by FRAP (Table 3.3). As
can be seen, three quarters of the protein molecules were immobile and the diffusion
constant of the protein was significantly slower than that for Texas Red DHPE.
Identical measurements were repeated in membranes containing PEG2000
lipopolymer. The effect of polymer density on the lateral diffusion of phycoerythrin-
labeled annexin V was quantified by varying the mol% of PEG2000-PE moieties within
the membrane. The mole fractions of PEG2000-PE used in these experiments were 0.5%,
1.4%, and 5%. At low PEG density (0.5 mol % PEG2000-PE), the PEG moiety exists in a
mushroom conformation. At higher polymer density (5 mol % PEG2000-PE), the PEG
moiety should be well into the brush transition. The values for the diffusion constant and
mobile fraction of annexin V as a function of lipopolymer density are provided in Table
3.3. As can be seen, the highest diffusion constant and mobile fraction values were
found at the onset of the mushroom-to-brush transition. The decrease in mobility above
and below this value makes sense. Indeed, an isolated mushroom conformation for
PEG2000 won’t be able to prevent direct indirections between annexin V and the substrate

60
Table 3.3 Effect of PEG2000 mole density on the two-dimensional lateral mobility of
fluorescently labeled annexin V.
PEG 2000-PE
Concentration Diffusion Coefficient
(× 10-8 cm2/s) Mobile Fraction
(%) 0 mol%
0.5 mol%
1.4 mol%
5 mol%
0.3 ± 0.1
1.3 ± 0.2
2.0 ± 0.2
1.0 ± 0.3
26.3 ± 3.2
28.9 ± 4.8
35.8 ± 3.2
19.9 ± 2.9

61
at many locations on the surface. On the other hand, concentrations of PEG well into the
brush transition are known to lead to lipopolymer immobilization,113 which almost
certainly affects the mobility of the membrane protein. An intermediate lipopolymer
concentration avoids both of these problems.
To investigate the influence of the polymer chain length on the lateral diffusion
of phycoerythrin-labeled annexin V, lipopolymers were incorporated into POPC bilayers
at different molecular weights (PEG550, PEG2000, and PEG5000) at the onset of the
mushroom-to-brush transition. Increasing the length of the polymer chain increases the
membrane-substrate distance.122 This should decrease the interactions between the
inserted membrane protein and the underlying substrate. Indeed, higher diffusion
coefficients were obtained for annexin V reconstituted into membranes with longer
polymer chains (Table 3.4). Nevertheless, the majority of the protein molecules were
immobile in all cases.
Finally, the two-dimensional fluidity of annexin V was measured in double
cushioned systems. Figure 3.4 shows fluorescence micrographs and the corresponding
FRAP recovery curve for phycoerythrin-labeled annexin V reconstituted into the PEG-
PE5000/BSA system. The fluorescence recovery of the photobleached spot was
remarkably high (~ 74%) and the diffusion coefficient value of the protein, 2.9 ± (0.4) ×
10-8 cm2/sec, was nearly as high as that for the Texas Red-conjugated lipid probes. The
mobile fraction was strongly dependent on the length of the polymer chain length.
Moreover, the diffusion constant also decreased with decreasing chain length. Both the

62
Table 3.4 Effect of polymer length (PEG550, PEG2000, PEG5000) on the two-dimensional
lateral mobility of fluorescently labeled annexin V.
Type of Support Diffusion Coefficient (× 10-8 cm2/s)
Mobile Fraction (%)
Glass
7 mol% PEG 550
1.4 mol% PEG 2000
0.5 mol% PEG 5000
0.3 ± 0.1
0.4 ± 0.1
2.0 ± 0.2
3.5 ± 0.4
26.3 ± 3.2
27.7 ± 3.4
35.8 ± 3.2
24.6 ± 1.7

63
Figure 3.4 Employment of a double-cushion system for maintaining the two-
dimensional lateral mobility of annexin V. Phycoerythrin-labeled annexin V was added
to the bilayer and incubated for 30 min. Excess protein was rinsed away with EDTA
before FRAP measurement were made. The black lines in the inset images are scratches
that were intentionally made with a pair of metal tweezers for estimating the background
contribution to the measured fluorescence intensity. The dashed red circles show the
position of the bleach spot. The inset images, which are 300 μm x 300 μm, were
captured immediately after photobleaching and again 1200 sec later.

64
diffusion constant and mobile fraction values obtained for annexin V are provided in
Table 3.5.
3.5 Discussion
It has been reported that spacer length and density play an important role in the
structure and function of supported membranes.102,122,123 Wagner et al. reported the
formation of uniform and mobile bilayers on PEG coated substrates made with silane-
functionalized PEG2000 tethers,54 whereby the polymer concentration was maintained
slightly below the mushroom-to-brush transition. It was observed that a decrease in the
mobile fraction of fluorescently labeled lipids was directly related to increasing the
polymer density within the supported membrane. In 2004, Purrucker and Tanaka
reported that the spacer length could strongly influence the distribution, function and
lateral diffusion of transmembrane proteins.102 They observed a homogenous
distribution of labeled integrin αIIbβ3 when using longer polymer spacers. Such results
suggest that the membrane-substrate distance is a very significant variable for
successfully incorporating transmembrane proteins into supported bilayers. Finally,
Kunding and Stamou reported that membrane-substrate distance in the presence of a
PEG cushion could be varied by modulating the ionic strength of the solution.122
Herein, rapid diffusion of annexin V with a high protein mobile fraction was
achieved with a double cushion system. The key difference between this platform and
previous designs is the fact that a sacrificial protein layer was present between the
polymer-cushioned membrane and the underlying substrate. BSA monolayers have been

65
Table 3.5 Lateral mobility of fluorescently labeled annexin V in the double cushion
system.
Double Cushion
System Diffusion Coefficient
(× 10-8 cm2/s) Mobile Fraction
(%) PEG 550 – BSA
PEG 2000 - BSA
PEG 5000 – BSA
0.5 ± 0.1
2.0 ± 0.4
2.9 ± 0.4
33.1 ± 6.2
52.2 ± 4.7
73.5 ± 2.4

66
previously shown to resist the adsorption of additional proteins on glass substrates124 and
are almost certainly providing a passivating layer in the present system. Evidence for
this statement comes from Tables 3.4 & 3.5. Indeed, three-quarters of the annexin V
molecules were immobile in the PEG5000-PE system in the absence of the BSA
monolayer. Such a result is consistent with the notion that the transmembrane protein
molecules diffuse around on the surface until they encounter a high energy site on the
glass substrate, which leads to immobilization. Once the majority of high energy sites
have been passivated, however, the rest of the annexin V molecules remain mobile over
periods of time sufficiently long to perform fluorescence recovery experiments.
It should be noted that the presence of the BSA film alone does not appear to be
sufficient to produce a system with a high fraction of mobile protein molecules. Indeed,
reducing the thickness of the PEG layer also reduces the mobile protein fraction (Table
3.5). It is curious to note that the mobile fraction increases essentially monotonically
with increasing PEG length at the onset of the mushroom to brush transition. This is
consistent with the notion that a minimum spacer length is required in order for protein
molecules to diffuse freely.
Finally, it should be noted that the concentration of BSA incubated above the
interface was key to forming high quality supported bilayers (Figure 3.3). Previous
investigations have shown that relatively smooth BSA monolayers are formed with
extensive spreading of protein molecules under circumstances where the BSA
concentration in the bulk solution is relatively low (Figure 3.5).124 On the other hand,
high bulk protein concentrations led to more rapid BSA adsorption and higher surface

67
Figure 3.5 BSA coated glass coverslips. (Left) At low protein concentration, BSA forms
a flat protein monolayer. (Right) At high protein concentration, a higher density of
protein adsorbs more rapidly which prevents the BSA molecules from spreading.

68
densities. Consequently, there was much less protein spreading. The adsorption and
relaxation kinetics of BSA molecules at the solid-liquid interface should play an
important role in their function as cushions. It is probably the case that rougher surfaces,
created with higher BSA concentrations, are not as conducive to the fusion of
phospholipid vesicles. Indeed, previous studies have shown that vesicle fusion relies on
relatively low substrate roughness.41,72
3.6 Summary and Conclusions
In conclusion, transmembrane protein mobility was maintain within our double
cushion bilayer platform. With this novel system transmembrane protein diffusion values
similar to the diffusion of fluorescently labeled lipids were obtained. In this study
commercially available PEG-PE lipopolymers of molecular weights up to 5,000 were
used. A mobile fraction of ~ 70 % was obtained with the PEG-PE 5,000. We suspect that
increasing the PEG spacer to an even larger size would result in even higher mobile
fractions.

69
CHAPTER IV
ELECTROPHORESIS IN SUPPORTED LIPID BILAYERS: SEPARATION,
CHARACTERIZATION, AND IMAGING OF MEMBRANE BOUND SPECIES*
4.1 Synopsis
It is well-known that the purification of membrane species is a difficult process.
The processing conditions are often harsh, which can result in alteration of native
structures. We have developed a new method to rapidly separate membrane bound
species without exposing the molecules to harsh environments. In this method we
employ a solid supported bilayers made of POPC doped with cholesterol as a separation
medium to laterally separate membrane species within the membrane. Cholesterol was
used to reduce the diffusion of lipids within the bilayer and, therefore, substantially
reduce mixing of the dye-conjugated lipids to be separated. These molecules were
introduced into an SLB adjacent to the separations SLB and electrophoresis was
employed to move these species through it. The separation of two isomers of Texas Red
dye and a green dye, BODIPY, was achieved with high resolution and small band
broadening. This procedure could be extended to the purification of peripheral and
transmembrane proteins.
________________________
*Parts of this chapter are reprinted from “Separation of Membrane-Bound Compounds by Solid-Supported Bilayer Electrophoresis” by Daniel, S.; Diaz, A.J.; Martinez, K.M.; Bench, B.J.; Albertorio, F.; Cremer, P.S. 2007. Journal of the American Chemical Society, 129, 8072-8073, Copyright [2007] American Chemical Society.

70
4.2 Introduction
Separation, purification, and detection of biomembrane species such as lipids and
transmembrane proteins are difficult tasks. The processing conditions are often harsh,
which can result in alteration of native structures or complete loss of material.125,126
Furthermore, it is difficult to detect subtle post-translational changes in these molecules
that occur on the cell surface.127-129 The procedures often require one to dissolve the
membrane in detergent, sonicate, filter through chromatographic columns, and separate
into bands using gel electrophoresis. The use of detergents has negative impact on the
yields and stability of the proteins and often interferes with biophysical and
crystallographic studies. Procedures that circumvent such drawbacks would represent an
attractive alternative and could significantly impact transmembrane proteomics.
Herein, we describe a new method to rapidly separate membrane components
without exposing the molecules to harsh environments. We employ a solid-supported
lipid bilayer (SLB) made of POPC and cholesterol as the separation medium to laterally
separate membrane-bound species (Figure 4.1). This procedure is somewhat analogous
to gel electrophoresis, except that the SLB replaces the gel. It is well-documented that
membrane components can be manipulated in SLBs using electrophoresis, including
lipids,46,48,98,130 vesicles tethered to the bilayer using DNA hybridization,131,132 and GPI-
linked proteins.47 To conduct separations, however, it is necessary to tune the bilayer
chemistry to attenuate the diffusion coefficient of the lipids and, therefore, reduce the
diffusive mixing. Cholesterol significantly decreases the lipid diffusion coefficient133,134
and increases the band resolution one can obtain. As will be shown, this analytical-scale

71
Figure 4.1 Schematic diagram of a solid supported lipid bilayer before and after
applying an electric field. Before applying voltage across the supported lipid bilayer a
section of analyte membrane is spliced next to the separation bilayer.

72
separation technique is powerful enough to separate isomers of fluorescently labeled
lipids.
4.3 Experimental
Materials
The following lipids were used in these experiments: 1-palmitoyl-2-oleoyl-
snglycero- 3-phosphocholine (POPC), 1,2-dilauroyl-sn-glycero-3-phosphocholine
(DLPC), and 1,2-dioleoyl-sn-glycero-3-phosphocholine (DOPC). These were obtained
from Avanti Polar Lipids (Alabaster, AL). Fluorescently labeled lipids used in the
separation experiments were: Texas Red 1,2-dihexadecanoyl-sn-glycero-3-
phosphoethanolamine, triethylammonium salt (Texas Red DHPE) and N-(4,4-difluoro-
5,7-dimethyl-4-bora-3a,4a-diaza-s-indacene-3-propionyl)-1,2-dihexadecanoyl-sn-
glycero-3-phosphoethanolamine, triethylammonium salt (BODIPY DHPE), obtained
from Molecular Probes (Eugene, OR). Phosphate buffer saline (PBS) used in the
preparation of vesicles was made with 10 mM Na2HPO4, 5 mM NaH2PO42, and 150 mM
NaCl (pH 7.4). Sodium chloride, sodium phosphate monobasic, and sodium phosphate
dibasic were all obtained from Sigma-Aldrich (St. Louis, MO). The pH was adjusted to
7.4 using sodium hydroxide (EMD, Germany). The purified water used in the
preparation of all solutions was obtained from a NANOpure Ultra Water System
(Barnstead, Dubuque, IA) and had a minimum resistivity of 18 MΩ·cm. Polycarbonate
filters (Whatman, Fisher Scientific) with pore diameters of 100 nm and 50 nm were used
in the preparation of vesicles. Glass coverslips (VWR) were used as supports for the

73
bilayers and were boiled in 7X solution (MP Biomedicals, Aurora, OH) that was diluted
four fold by volume with purified water. Polydimethylsiloxane (PDMS; Sylgard 184)
was obtained from Dow Corning. Platinum electrodes were made from platinum wire
with a diameter of 0.25 mm from Alfa Aesar (Ward Hill, MA). Thin layer
chromatography (TLC) was carried out using glass-backed TLC plates made of silica gel
with pore sizes of 60 Å and a layer thickness of 250 μm (VWR).
Preparation of the Supported Bilayers Used in the Separation Experiments
Small unilamellar vesicles (SUV) were used to form solid-supported lipid
bilayers (SLBs) on glass substrates by vesicle fusion.26,46,113,115,116 The vesicles used to
create the separation bilayer were composed of POPC and cholesterol. Vesicles
containing the fluorescently labeled lipids were composed of POPC mixed with a
suitable mol% of Texas Red DHPE and/or BODIPY DHPE. To make the various
vesicle solutions, the appropriate components were first dissolved in chloroform and
dehydrated under vacuum for three hours. The dried mixtures were rehydrated in PBS
and subjected to ten freeze/thaw cycles by alternating between liquid nitrogen and a 30
oC water bath. The solution was then extruded several times through a polycarbonate
filter to produce vesicles of uniform size. For the first extrusion, a filter with 100 nm
diameter pores was used, followed by five passes through a filter with 50 nm diameter
pores. The resultant SUVs were sized by dynamic light scattering using a 90Plus
Particle Size Analyzer (Brookhaven Instruments Corporation) and were found to be
highly uniform at each composition and had an average diameter of 80-90 nm.

74
Glass coverslips used as supports for the bilayers were cleaned in 7X solution
following established procedures.66 They were then annealed in an oven at 550 oC for
five hours to yield flat surfaces with a typical root mean square roughness (RMS) value
of 0.13 nm over a 1 μm2 area as determined by atomic force microscopy. A drop of
vesicle solution (~200 μL) was placed on the clean hydrophilic glass coverslip. The
solution was confined to a rectangular area in the center of the glass coverslip by a thin
hydrophobic PDMS mold. The mold was made by cross-linking PDMS between two
silanized glass microscope slides separated by a thin metal spacer between 200 to 400
μm thick. After cross-linking, a rectangular hole approximately 1 cm2 was cut out of the
center of the elastomeric sheet using a razor blade. The outer edges of the mold were
trimmed to fit exactly over the glass coverslip.
The separation bilayer was prepared first. The vesicle solution containing
cholesterol was incubated on the glass slide for ten minutes and rinsed with copious
amounts of purified water to remove any excess, unfused vesicles from the surface. In
the next step, a thin strip of the supported bilayer was completely removed so that
vesicles containing the mixture of fluorophores could be fused in that region. We found
that the edge of a coverslip wrapped with several ply of Teflon tape was an effective tool
to plow out a thin line (80 μm wide) of bilayer material while not causing any damage to
the underlying substrate. Immediately following this step, ~ 100-200 μL of vesicle
solution containing the dye-labeled lipids were added to the PDMS well. After about
five minutes, the well was thoroughly rinsed with DI water. Figure 4.2 shows a
schematic representation of the procedure.

75
Figure 4.2 Procedure to form bilayer and separate a mixture of dye labeled lipids by
electrophoresis. (1) First form a the separation bilayer containing 25 mol% cholesterol
(yellow) in POPC lipids (gray) via vesicle fusion. (2) Gently press the edge of a glass
coverslip slide coated with Teflon tape into the bilayer and plow out a thin line of the
bilayer. (3) Add vesicles containing the mixture of fluorophores to be separated to the
bulk aqueous phase above the supported bilayer. These vesicles will fuse in the bare
region. (4) Apply a potential laterally across the bilayer and observe the resultant
separation of fluorescent lipids, as indicated by the colored arrows corresponding to each
kind of lipid.

76
A 100 V potential was applied laterally across the bilayer by placing a platinum
wire electrode on each side of the PDMS well using a standard regulated power supply
(Lambda Electronics Corp., Long Island, NY) while monitoring the current through the
system with a digital multimeter (Keithly). DI water was used to minimize Joule heating.
We maintained currents of only a few microamps or less during all experiments so Joule
heating was negligible. Time lapse images were taken of the slide every five minutes to
monitor the movement of the fluorescent bands and subsequent separations. A 4X
microscope objective was used to maximize the field of view in our set up. Imaging was
performed with a Nikon Eclipse TE2000-U equipped with a Sensys CCD camera
(Photomatrics, Roper Scientific) working in conjunction with MetaMorph software
(Universal Imaging). An illustration of the experimental set up is shown in Figure 4.3.
Preparation of Supported Bilayers with Various Amounts of Cholesterol
The effect of cholesterol on the fluidity of solid supported lipid bilayers was
examined using fluorescent recovery after photobleaching (FRAP).86,96 Bilayers of
POPC, DOPC, and DLPC with varying mole percentages of cholesterol and 0.1 mol%
Texas Red DHPE were studied. Briefly, the phospholipids, cholesterol, and Texas Red
DHPE (all in chloroform) were mixed in proper proportions and dried first under a
stream of nitrogen gas and then desiccated for three hours. PBS (pH 7.2) was added to
each sample for rehydration. Each was then frozen with liquid nitrogen and thawed a
total of five times with vortexing in between the freeze-thaw cycles. These vesicles
were extruded through a polycarbonate filter (50 nm pore size) a total of seven times.

77
Figure 4.3 Diagram of the experimental set up used in the separation experiments. The
bilayer was maintained in an aqueous environment at all times.

78
The effective diameters of these unilamellar vesicles were determined via light scattering
and found to be within the diameter range of 80-110 nm.
Bilayers were then formed from these vesicles by vesicle fusion on previously
cleaned and annealed glass, using a PDMS slab with a hole cut in the middle to contain
the bilayer and bulk buffer above it. Bilayers formed in this manner appeared to be
uniform down to the diffraction limit under all conditions investigated.
Diffusion Measurements
Diffusion coefficients and mobile fractions of Texas Red DHPE were measured
by fluorescence recovery after photobleaching (FRAP).86,96 The dye-labeled lipids were
bleached with the 568.2 nm line from a mixed gas Ar+/Kr+ laser beam (Stabilite 2018,
Spectra Physics). 100 mW of power was directed onto the sample for less than 1 second.
The beam, which was sent through a 10X objective, had a full-width at half-maximum of
~17 μm at the sample plane. The recovery of the photobleached spot was followed with
the same microscope system described above. The fluorescence intensity of the bleached
spot was determined after background subtraction and normalization for each image.
The diffusion coefficient of the dye-labeled lipids was determined as follows. First, the
fluorescence recovery as a function of time was fit to a single exponential equation, from
which we obtained the mobile fraction of the dye-labeled proteins and the half-time of
recovery (t1/2). The diffusion coefficient, D, was then calculated from the following
equation: γ21
2
4twD = , where w is the full width at half-maximum of the Gaussian profile

79
of the focused beam and γ is a correction factor (= 1.1) that depends on the bleach time
and geometry of the laser beam.
4.4 Results and Discussion
In a first set of experiments, we demonstrate the ability of cholesterol to decrease
band broadening during the separation process. We compared the behavior of a band of
1 mol% Texas Red DHPE lipids migrating in a plain POPC bilayer and in a POPC
bilayer with 25 mol% cholesterol. To begin an experiment, supported bilayers were
formed on a planar glass substrate by the vesicle fusion method. Next, a thin line of
bilayer (~80 μm width) was removed using a sharp piece of glass coated with Teflon
(see supplemental materials). Vesicles containing POPC and 1 mol% Texas Red DHPE
were then introduced into the aqueous phase above the surface. The vesicles fused to the
bare portion of the substrate, creating a thin bilayer strip with Texas Red DHPE in it. A
100 V potential (DC) was applied parallel to the plane of the bilayer. Because the
fluorophores were negatively charged, they migrated toward the positive electrode. We
monitored the lateral movement and band broadening of the Texas Red bands as a
function of time using an inverted epifluorescence microscope (Figure 4.4).
The bilayer without cholesterol showed substantial band broadening after 30
minutes of applied voltage (Figure 4.4, left images). By contrast, the band in the bilayer
containing 25 mol% cholesterol (Figure 4.4, right images) remained much more compact.

80
0.00.20.40.60.81.0
0 500 1000 1500 20000.00.20.40.60.81.0
0 500 1000 1500 2000
30 min
Initial Initial
30 min
1.0
0.8
0.6
0.4
0.2
0
Inte
nsity
(A.U
.) 1.0
0.8
0.6
0.4
0.2
0Inte
nsity
(A.U
.)No CholesterolInitial
30 min
25 mol% CholesterolInitial
30 min
0 500 1000 1500 2000 0 500 1000 1500 2000Position (μm) Position (μm)
Figure 4.4 Comparison of the band broadening of Texas Red-labeled lipids migrating in
either pure POPC (left) or POPC doped with 25 mol% cholesterol (right). The upper two
images are epifluorescence micrographs of the systems immediately after formation of
the Texas Red-containing strips. The lower two images show band migration after
applying 100 V across the sample for 30 minutes. The positive and negative electrodes
were located on the right and left sides of the frame, respectively. The faint line to the
left in the bottom panels represents a 2% immobile fraction of lipids. The plots below
the images show the corresponding linescans initially and after 30 minutes. The
linescans have been corrected for vignetting and normalized to the fluorescence level of
the initial image to account for photobleaching. The length of the images matches the
scale of the x-axis in the plots.

81
Moreover, this band resolved into two distinct chromatographic features with an area
ratio of ~ 70:30.
Mass spectral analysis showed that Texas Red DHPE had a molecular weight of
1381.85 Da and was relatively pure. It is well known, however, that the sample should
consist of an isomeric mixture135 (Figure 4.5, left side). Indeed,
phosphatidylethanolamine lipids can conjugate to Texas Red sulfonyl chloride at either
the ortho or para positions of the lower aromatic ring. This accounts for the presence of
two bands in Figure 4.4 and is illustrated schematically in Figure 4.5 (right side).
Two other possible origins for the band splitting need to be considered. First, a
difference in the mobilities of the lipids in the upper and lower leaflets might lead to
band separation. Also, it is conceivable that that the separated bands represent species in
different microdomains or lipid rafts.136,137 We ruled out both these possibilities by
purifying the Texas DHPE using thin layer chromatography. Several small spots of
Texas Red DHPE in chloroform were formed on a TLC plate using a glass pipette. The
spotted plate was then placed into a development jar and eluted with ethanol. Figure 4.6
shows the TLC plate after separation of the bands from six individually placed spots.
Texas Red labeled phospholipids were recovered from the TLC plate by carefully
scraping the separated bands with a razor blade and re-suspending in ethanol to extract
the lipids from the silica beads. The mixture was centrifuged at 13,500 RPM (5415,
Eppendorf) for 5 minutes and the supernatant was collected. This procedure was
repeated (typically 5 times) until no Texas Red phospholipids were detected in the pellet
by observing the color. To take away the ethanol, the samples were dried using nitrogen

82
(+)(-)
Before
After
(+)(-)
Before
After
Figure 4.5 (Left) Chemical structure of Texas Red sulfonyl chloride.88 The lower ring
contains the reactive sulfonyl chloride group (red), which can reside at either the 2 (ortho)
or 4 (para) position. (Right) Illustration of the separation of a mixture of Texas Red
DHPE lipid isomers into distinct bands in a supported bilayer

83
Figure 4.6 Image of a TLC plate after Texas Red DHPE separation. Six individual spots
of Texas Red DHPE were placed at the bottom of the plate (horizontal loading line) and
eluted with ethanol for approximately 20 minutes.

84
followed by desiccation under vacuum for 1 hour.
Each pure lipid isomer was separately mixed into POPC vesicles and fused into
supported bilayer strips adjacent to a separation matrix consisting of a bilayer made from
75 mol% POPC and 25 mol% cholesterol. As expected, 30 min. of electrophoresis gave
rise to only one band in each case (Figure 4.7). As a control, UV-Vis spectroscopy was
performed on the isolated compounds as well. These experiments confirmed that the
isomers existed in an approximately 70:30 mole ratio.
TLC purification was also carried out on BODIPY DHPE to verify that this
compound was pure. We did not detect any band splitting using this method in
agreement with the electrophoresis studies.
Matrix assisted laser desorption ionization (MALDI) mass spectroscopy was
performed on the isolated fractions of Texas Red DHPE obtained from TLC. The
spectrum for each band is shown in Figure 4.8. Comparing the spectra, both fractions
have nearly identical masses, indicating that they arise from two different isomers of the
same compound. The mass of Texas Red DHPE is 1381.85 g/mol. The compound is a
salt and consists of the negatively charged dye-conjugated lipid, 1279.65 g/mol, as well
as triethylammonium cations, 102.2 g/mol. The low mass peak in each spectrum
corresponding to m/z 1302.7 represents the negatively charged dye-conjugated lipid with
one sodium ion and one proton. The peak at m/z 1324.7 represents the dye-conjugated
lipid with two sodium ions. The peak at m/z 1340.7 corresponds to the dye-conjugated
lipid with one sodium ion and one potassium ion. The peak at m/z 1354.7 represents the

85
0.0
0.2
0.4
0.6
0.8
1.0
0 500 1000 1500 20000.0
0.2
0.4
0.6
0.8
1.0
0 500 1000 1500 2000
Initial
30 min
Initial
30 min
1.0
0.8
0.6
0.4
0.2
0
1.0
0.8
0.6
0.4
0.2
0Inte
nsity
(A.U
.)
Inte
nsity
(A.U
.)Initial30 min
Initial30 min
0 500 1000 1500 2000 0 500 1000 1500 2000Position (μm) Position (μm)
0.0
0.2
0.4
0.6
0.8
1.0
0 500 1000 1500 20000.0
0.2
0.4
0.6
0.8
1.0
0 500 1000 1500 2000
Initial
30 min
Initial
30 min
1.0
0.8
0.6
0.4
0.2
0
1.0
0.8
0.6
0.4
0.2
0Inte
nsity
(A.U
.)
Inte
nsity
(A.U
.)Initial30 min
Initial30 min
0 500 1000 1500 2000 0 500 1000 1500 2000Position (μm) Position (μm)
Figure 4.7 Images of Texas Red DHPE migrating through a 75 mol% POPC/ 25 mol%
cholesterol bilayer after TLC purification. Left: Texas Red from the large mol. fraction
isomer after TLC purification, initially (top) and after 30 min of 100 V applied potential
(middle). Right: the corresponding images for the other isomer. The plots below the
images show the associated linescans, initially and after 30 minutes, corrected for
vignetting.

86
Band 1 Band 2
Sample 1
1000 1300 1600 1900 2200 2500Mass (m/z)
0
50
100
% In
tens
ity
1324
.788
213
40.7
554
1354
.723
4
1302
.791
1
1382
.771
9
Sample 1
1000 1300 1600 1900 2200 2500Mass (m/z)
0
50
100
% In
tens
ity
1324
.788
213
40.7
554
1354
.723
4
1302
.791
1
1382
.771
9
Sample 2
1000 1300 1600 1900 2200 2500Mass (m/z)
0
50
100
% In
tens
ity
1324
.786
613
40.7
379
1302
.780
4
1354
.742
3
Sample 2
1000 1300 1600 1900 2200 2500Mass (m/z)
0
50
100
% In
tens
ity
1324
.786
613
40.7
379
1302
.780
4
1354
.742
3
Figure 4.8 Mass spectra of each fraction of the TLC purified Texas Red DHPE isomers.

87
dye conjugated lipid with two potassium ions. The peak at m/z 1382.7 is attributed to
the Texas Red salt with an additional proton.
In a final set of experiments, we demonstrated that a more complex mixture can
be separated. For this purpose, we fused POPC vesicles containing 1 mol% Texas Red
DHPE and 1 mol% BODIPY DHPE into a bilayer strip as performed above. Figure 4.9
(top) shows the three bands that were resolved after 30 min. of electrophoresis at 100 V.
As can be seen, the Texas Red lipid bands move more slowly that the single green
BODIPY band. The linescan (bottom) shows that the bands are resolved.
Finally, MALDI Mass Spectrometry (MS) Imaging138 was used to analyze the
separated species in the bilayer. Imaging MS provides native state analyte identification
(owing to the molecular mass of individual molecules) and does not require the use of a
fluorophore or a “tag” for analysis. Matrix assisted laser desorption/ionization time-of-
flight mass spectrometry (MALDI-TOF MS) is used to obtain mass spectra at discrete x-
y spatial positions. Each pixel or mass spectrum can be individually interrogated for a
specific m/z value and assembled to produce an ion image. In that, multiple MS images
can be obtained for each single experiment.
To prepare supported lipid bilayer samples for MS, the water must be removed
from the system without disrupting the lateral organization of the membrane. Figure 4.10
outlines the procedure used to prepare the lipid bilayers for MS analysis. Firstly, the bulk
water solution is removed from the PDMS well and the sample is plunge frozen in liquid
nitrogen-cooled ethane. Then, samples are dried under vacuum (millitorr) at 4ºC for
about 4 hr. Finally, the sample is adhered to a MALDI plate, and a matrix (20 mg/mL

88
0.0
0.2
0.4
0.6
0.8
1.0
0 500 1000 1500 2000
Position (um)
Intens
ity
Texas RedBODIPY
Position (μm)
1.0
0.8
0.6
0.4
0.2
00 500 1000 1500 2000
Texas Red
BODIPY
Inte
nsity
(A.U
.)
0.0
0.2
0.4
0.6
0.8
1.0
0 500 1000 1500 2000
Position (um)
Intens
ity
Texas RedBODIPY
Position (μm)
1.0
0.8
0.6
0.4
0.2
00 500 1000 1500 2000
Texas Red
BODIPY
Inte
nsity
(A.U
.)
Figure 4.9 (Top) Composite image of the separation of TR DHPE and BODIPY DHPE
in a POPC bilayer containing 25 mol% cholesterol after 35 minutes of applying a 100 V
potential. (Bottom) corresponding linescan of the image, corrected for vignetting. The
small peak at ~300 μm represents an approximately 2% immobile fraction of total dye-
labeled molecules. The areas of the large and small peaks of Texas Red are ~ 75% to
25%, which is slightly different than the areas in Figure 1 and probably represents a
small amount of batch-to-batch variability in the dye formulation of the manufacturer.

89
Figure 4.10 Schematic diagram of the sample preparation protocol used for MS analysis.

90
α-cyano 4-hydroxycinamic acid in 80 % acetone and 20% methanol) is aerosol
deposited onto the sample. After being introduced into the mass spectrometer, the
sample is interrogated in 60μm increments to produce the resulting images in Figure
4.11. In particular, the two separated TR-DHPE lipid (m/z 1324.6) bands are detected at
different locations in the ion image, agreeing well with fluorescent images. Each mass
spectrum represents the average of 500 laser shots and the laser spots size is ~ 60 μm x
60 μm. The ability to use a lipid bilayer as a separation medium followed by MS
imaging might have an impact on the analysis of cell membranes. In that, it may be
possible to monitor biological processes such as the formation and chemical composition
of lipid rafts without the need for molecular tags.
All MS experiments were performed on a 4800 TOF TOF Mass Analyzer
(Applied Biosystems, Framingham, MA) equipped with a Nd:YAG laser (355 nm).
Imaging was acquired using 4000 Imaging Series software and data was worked up
using Bio-Map (www.maldi-msi.org).

91
Figure 4.11 Mass spectrometry images of the separated species in a lipid bilayer. (Top)
Ion image of m/z 782 which corresponds to the other lipid (POPC) in the original fused
vesicles (should only move due to diffusion). (Bottom) The two TR-DHPE isomers
(both at m/z 1324.6) are separated from each other and imaged using MS. Data taken by
Ms. Stacy Sherrod in Dr. Russell Laboratory (Texas A&M University).

92
4.5 Summary and Conclusions
We have developed a simple on-chip device that can detect membrane proteins
and lipids and even subtle differences in isoform within the native environment of a lipid
bilayer. The method was powerful enough to completely resolve two isomers of Texas
Red DHPE from each other. Moreover, these isomers could be separated from a
BODIPY-conjugated lipid as well. This method could be extended to the purification
and separation of membrane proteins by incorporating an appropriate polymer cushion70
into our supported bilayer system to ensure mobility of the transmembrane species.
Protein bands could be detected by Western blotting with appropriate protein-specific
antibodies or the bilayers could be imaged via mass spectrometry for label-free
detection.139 Such an advance might even have impact in the analysis of whole cell
membranes. In fact, cell membranes could be analyzed to follow protein expression or
post-translational modifications.

93
CHAPTER V
SEPARATION OF PERIPHERAL PROTEINS BY SOLID-SUPPORTED
BILAYER ELECTROPHORESIS
5.1 Synopsis
In Chapter IV, a method was developed for the purification of membrane-bound
species within a supported lipid bilayer platform. Herein, the electric field generated by
an applied potential has been used to separate streptavidin proteins bound to a supported
phospholipid bilayer. By geometry, streptavidin proteins can bind either monovalently or
bivalently via lipid-conjugated biotin moieties present within the membrane. The
separation of doubly bound proteins from singly bound proteins was achieved with high
resolution. We showed that we can control the fraction of protein which is singly and
doubly bound by varying the concentration of ligand moieties within the supported
membrane. This study demonstrates that first, bilayer electrophoresis can be used to
separate membrane associated proteins, and second, and that the technique is sensitive to
elucidating the valency state of the ligand-receptor pair.
5.2 Introduction
Elucidating the profile of membrane proteins on live cells is vital for developing
new therapeutic agents and potential drugs candidates. Investigating these proteins has
proven to be difficult, mostly due to their hydrophobic nature and low abundance.
Conventional methods for membrane protein purification are cumbersome and time

94
consuming. Protein yields are extremely low and they can easily denature and lose their
function during the purification procedure.
We have created a method to separate membrane bound species in a solid-
supported lipid bilayer platform.140 Membrane-bound species that can potentially be
separated include conjugated lipids with various functionalities (such as fluorescent
dyes), colloidal particles, and vesicles, ligands for specific binding reactions, and
peripheral and transmembrane proteins. This technique is to some extent similar to gel
electrophoresis, except here the separation matrix is now a solid-supported bilayer.
As a first step towards purifying transmembrane proteins, we investigated the
separation of streptavidin in a supported bilayer system. We showed that we could
electrophoretically move fluorescently labeled streptavidin proteins bound to a
phospholopid bilayer via lipid-conjugated biotin moieties to form discrete bands.
Streptavidin is a 52.8 kD tetrameric protein produced by Streptomyces avidinii.141-143
There are two binding pockets on each side of a single streptavidin protein (Figure 5.1)
and, hence, it can bind either monovalently or bivalently to a supported lipid bilayer
doped with biotin-conjugated lipids.
Herein, we show separation of streptavidin proteins bound to a supported
phospholipid bilayer. The separation of doubly bound proteins from singly bound
proteins was achieved with high resolution. Also, we found that the fraction of protein
which is singly and doubly bound can be varied by adjusting the concentration of ligand
moieties in the membrane. This electrophoretic platform allows for the direct
observation of the different valency states of ligand-receptors pairs at the membrane

95
Figure 5.1 Schematic representation of streptavidin bound to a supported lipid bilayer.
Streptavidin has two binding pockets on each side of the protein. It can bind either
monovalently or bivalently to biotin-conjugated lipids within the lipid membrane.

96
interface. This technique could be extended to study other multivalent ligand-receptor
interactions, such as the interaction between the pentameric cholera toxin B subunit and
the membrane ligand, ganglioside GM1.144,145 Numerous biological processes, such as
cell signaling146 and cell-pathogen interactions147,148 are linked with multivalent
interactions. Understanding the nature of multivalency is crucial for the development of
more accurate therapeutic agents that can interfere with pathological interactions.
5.3 Experimental
Materials
1-palmitoyl-2-oleoyl-sn-glycero- 3-phosphocholine (POPC) was the major
component of all lipid bilayers. POCP was mixed with various amounts of 1,2-
dipalmitoyl-sn-glycero-3-phosphoethanolamine-N-(Cap Biotinyl) (Sodium Salt) lipids,
which served as the ligand for protein binding. All the lipids were obtained from Avanti
Polar Lipids (Alabaster, AL). Streptavidin was conjugated with Texas Red dye prepared
by and obtained from Molecular Probes (Eugene, OR). The reported degree of labeling
was 2.1 dyes/streptavidin. The molecular weight of streptavidin is 53,000 Da (Molecular
Probes, Product Information). Phosphate buffer saline (PBS) used in the preparation of
vesicles was made with 10 mM Na2HPO4, 5 mM NaH2PO42, and 150 mM NaCl (pH 7.4).
Sodium chloride, sodium phosphate monobasic, and sodium phosphate dibasic were all
obtained from Sigma-Aldrich (St. Louis, MO). The pH was adjusted to 7.4 using sodium
hydroxide (EMD, Germany). The purified water used in the preparation of all solutions
was obtained from a NANOpure Ultra Water System (Barnstead, Dubuque, IA) and had

97
a minimum resistivity of 18 MΩ·cm. Polycarbonate filters (Whatman, Fisher Scientific)
with pore diameters of 100 nm and 50 nm were used in the preparation of vesicles. Glass
coverslips (VWR) were used as supports for the bilayers and were cleaned with 7X
solution (MP Biomedicals, Aurora, OH). Polydimethylsiloxane (PDMS; Sylgard 184)
was obtained from Dow Corning.
Solid Supported Lipid Bilayer Preparation
Small unilamellar vesicles (SUVs) were used to form solid-supported lipid
bilayers on glass substrates by vesicle fusion.26,46,92,115 Vesicles were composed of POPC
with different mol% of biotinylated lipids. The appropriate composition of lipids were
dissolved and mixed in chloroform, then dehydrated under vacuum for approximately 4
hours. The dried mixture was rehydrated in PBS buffer and subjected to ten freeze/thaw
cycles by alternating between liquid nitrogen and a 30 °C water bath. The solution was
then extruded several times through a polycarbonate filter to produce vesicles of uniform
size. For the first extrusion, a filter with 100 nm diameter pores was used, followed by
five passes through a filter with 50 nm diameter pores. The resultant SUVs were sized
by dynamic light scattering using a 90Plus Particle Size Analyzer (Brookhaven
Instruments Corporation) and were found to be highly uniform at each composition and
had an average diameter of 80-90 nm.
Glass coverslips used as supports for the bilayers were cleaned in 7X solution
following established procedures.66 They were then annealed in an oven at 550 °C for
five hours to yield flat surfaces with a typical root mean square (RMS) value of 0.13 nm

98
over a 1μm2 are as determined by AFM. A 100 mL drop of vesicle solution was placed
on the clean hydrophilic glass coverslip. The solution was confined to a circular area in
the center of the glass coverslip by a thin hydrophobic PDMS mold. The mold was made
by crosslinking PDMS between two silanized glass microscope slides separated by a thin
metal spacer between 200 to 400 mm thick. After crosslinking, a circular hole
approximately 1 cm in diameter was punctured through the elastomeric sheet using a
hole punch. The outer edges of the mold were trimmed to fit exactly over the glass
coverslip.
Protein Solution Preparation
Solutions of streptavidin were prepared in PBS buffer, pH 7.4, at a concentration
of 0.5 μM. Prior to use, each solution was centrifuged at 13,500 RPM for 20 minutes
(5415D, Eppendorf) to remove any large protein aggregates from the bulk solution.
Mobility Measurements
Diffusion coefficients and mobile fractions of streptavidin were measured by
FRAP.86 The dye-labeled proteins were bleached with the 568.2 nm line form a mixed
gas Ar+/Kr= laser beam (Stabilite 2018, Spectra Physics). 100 mW of power was directed
onto the sample for approximately one second. The beam, which was sent through a 10X
objective, had a full-width at half maximum of ~ 13 μm at the sample plane. The
recovery of the photobleached spot was followed as a function of time using a time-lapse
imaging under a fluorescence microscope (Nikon Eclipse TE2000-U) equipped with a

99
Sensys CCD camera (Photomatrics, Roper Scientific) and employing MetaMorph
software (Universal Imaging). The fluorescence intensity of the bleached spot was
determined after background subtraction and normalization for each image. The
diffusion coefficient of the dye-labeled proteins was determined using standard
procedures.86 Briefly, the fluorescence recovery as a function of time was fit to a single
exponential equation, from which we obtained the mobile fraction of the dye-labeled
proteins and the half-time recovery (t1/2). The diffusion coefficient, D, was then
calculated from the following equation: D = (w2/ 4t1/2) γD, where w is the full width at
half maximum of the Gaussian profile of the focused beam and γD is a correction factor
that depends on the bleach time and geometry of the laser beam.
Bilayer Electrophoresis of Streptavidin
Figure 5.2 shows a schematic representation of the procedure. First, the
separation bilayer was prepared first. The vesicle solution containing POPC and 25
mol% cholesterol was incubated on the glass slide for ten minutes and rinsed with
copious amounts of deionized water to remove any excess, unfused vesicles from the
surface. In the next step, a thin strip of the supported bilayer was completely removed
with a coverslip wrapped with several ply of Teflon tape. A thin line (80 μm wide) of
bilayer material was removed without causing any damage to the underlying substrate.
Immediately following this step, ~ 100-200 μL of vesicle solution containing the
biotinylated lipids were added to the PDMS well. After about five minutes, the well was
thoroughly rinsed to remove unfused vesicles. Then, the bilayer was incubated with the

100
Figure 5.2 Procedure to form bilayer and separate streptavidin proteins by
electrophoresis.

101
streptavidin solution for 30 minutes, followed again by vigorous rinsing with buffer to
remove unbound protein. The sample was then assembled, under buffer, into a sandwich
with another coverslip and mounted in the electrophoresis device. The electrophoretic
device (Figure 5.3), made of Teflon, consisted of two platinum wire electrodes placed in
solution-filled wells. The coverslip sandwich (inset; Figure 5.3B) was arranged to form a
bridge between the two electrode wells. The electrical link was achieved all the way
through the solution in the coverslip sandwich.
Finally, a 250 V potential was applied laterally across the bilayer by placing a
platinum wire electrode on each side of the PDMS well using a standard regulated power
supply (Lambda Electronics Corp., Long Island, NY) while monitoring the current
through the system with a digital multimeter (Keithly). Time lapse images were taken
every five minutes to monitor the movement of the protein bands and subsequent
separations. A 4X microscope objective was used to maximize the field of view in our
set up. Imaging was performed with a Nikon Eclipse TE2000-U equipped with a Sensys
CCD camera (Photomatrics, Roper Scientific) working in conjunction with MetaMorph
software (Universal Imaging).
As the potential is applied across the membrane, the negatively charged
streptavidin proteins will move toward the cathode by electroosmosis (Figure 5.4).
Electroosmosis is the bulk motion of liquid over a stationary, charged surface in
response to an applied electric field.149 In our separation platform, the motion arises
from the flow of mobile counter ions (Na+) that are present in excess near the negatively

102
Figure 5.3 (A) Top view of the supported bilayer electrophoretic device. The body
device is made of Teflon. (B) Side view of the device showing the platinum wire
electrodes on each side. The inset depicts a cross-section of the coverslip sandwich,
illustrating the supported membrane (not drawn at scale). The water on top of the bilayer
is approximately 50 μm.

103
Figure 5.4 Schematic representation of the movement of peripheral proteins by
supported lipid bilayer electrophoresis. Negatively charge proteins, such as streptavidin,
will move toward the positive electrode after a potential is applied across the lipid
bilayer, moving in the direction of the dash arrow above them. The black solid arrows
indicate the direction of the Electro-osmotic Flow (EOF).

104
charged glass substrate. The major components of these membranes, POPC, is neutral
and thus is expected to be unaffected by the field.
5.4. Results and Discussion
Diffusion Measurements
Solid supported phospholipid bilayers containing various amount of biotinylated
lipids were formed on glass supports to characterize the effect of increasing ligand
density on two-dimensional protein diffusion. Under each set of conditions, 0.5 μM
streptavidin was added above the interface and incubated for 20 minutes before being
washed out. This concentration is sufficiently high to saturate the binding sites at this
time scale.150 Moreover, the fluorescence measurements showed no evidence for protein
desorption during the course of the FRAP measurements. This is to be expected because
of the extremely low koff rate for avidin and streptavidin for bioin ligands.150 Figure 5.5
shows a representative FRAP curve for streptavidin bound to 2 mol% biotin in the
bilayer. The data were fit to a single exponential curve, from which the half-time of
recovery (t1/2) could be determined and used to calculate the diffusion coefficients (see
Experimental). The diffusion coefficient and mobile fraction for streptavidin were (0.95
x 10-8) cm2/sec and 0.90, respectively.
Electrophoresis
As mentioned above, there are two binding pockets on each side of a single
streptavidin protein (Figure 5.1) and, hence, it can bind either monovalently or bivalently

105
Figure 5.5. Fluorescence recovery as a function of time for streptavidin in POPC
bilayers containing 2 mol % biotin. The diffusion coefficient, D, is (0.95 x 10⁻⁸) cm2/sec
with a mobile fraction of 0.90.

106
to a supported lipid bilayer doped with biotin-conjugated lipids within the membrane.
The biotin/streptavidin binding pair represents one of the strongest ligand-receptor
interactions know in biological systems (KD = 10-15 M ).150,151 In fact, the apparent KD
value at substrate surfaces is in the low picomolar range, while values in the femtomolar
range have been found in bulk solution. Moreover, Koff, for this system is far longer than
the 30 to 60 minutes timeframe over which an electrophoretic separation is typically
performed. Therefore, one should expect to find two bands when separating the bound
form of this protein from an analyte region containing both forms of the molecule into a
separation matrix (Figure 5.6A).
In the first set of experiments, supported bilayers composed of POPC and 25 mol
% cholesterol were used as a separation matrix. A thin line of bilayer was removed as
described in the experimental section. Vesicles containing POPC and 3 mol%
biotinylated lipids were then introduced and fused to the exposed section of the substrate,
creating a thin bilayer strip with biotinylated lipids in it. Then, the bilayer was incubated
with the streptavidin solution (0.25 μM) for 30 minutes. After rinsing with buffer to
remove unbound protein, a 250 V potential was applied parallel to the plane of the
bilayer. The lateral movement as a function of time was followed using an inverted
epifluorescence microscope. Figure 5.6B shows a fluorescence image of the two bands
that were resolved after 20 minutes of electrophoresis at 250 V. The linescan associated
with the fluorescence image shows that the bands are completely resolved. We
determined that the observed velocity scales linearly with the applied potential (Figure
5.7).

107
Figure 5.6 (A) Schematic representation of the separation of streptavidin singly bound
from doubly bound to POPC bilayers containing 3 mol % biotinylated conjugated lipids.
(B) (Top) Epifluorescence image of separated dye-labeled streptavidin after 20 minutes
of applied potential across the bilayer. This image was taken with a 4X air objective
using a mercury arc lamp with exposure time of 200 ms. (Bottom) A line scan across the
epifluorescence image shows that the bound protein has separated into two distinct
bands; Band 1 (doubly bound) and Band 2 (singly bound).

108
Figure 5.7 A plot of peak velocity vs. applied voltage for streptavidin bands moving
through 75 mol% POPC and 25 mol% cholesterol. The straight lines are least square fits
to the data.

109
One of the drawbacks of working at high voltage is the generation of heat. Joule
heating will increase in our system as V2/R.152 Joule heating can affect separation by
increasing thermal dispersion or possibly damage proteins that are temperature
sensitive.152 The temperature generated in our electrophoretic system (Figure 5.3) was
monitored in control experiments by utilizing poly(N-isopropylacrylamide) (PNIPAM).
PNIPAM is a thermoresponsive polymer which aggregates and falls out of solution,
making the solution cloudy, above its lower critical solution temperature (LCST).153-155
10 mg/mL PNIPAM (M.W. 1.78 x 10⁴ g/mol) solutions were prepared in 10 mM PBS
buffer in the presence of 500 mM NaCl. For this set of conditions, PNIPAM shows a
LCTS of approximately 25 °C. The PNIPAM solution was placed between two pieces
of glass and the sample was mounted in the electrophoretic device. An electric field was
applied across the samples for over than two hours at 250 V. No visible changes were
detected. The solution stays clear during this period of time. For higher voltages a
cooling system can be designed and added directly beneath the sample on which the
electrophoresis experiment takes place.
Diffusion Measurements of the Separated Species
Previous studies156,157 have shown that membrane-bound proteins, which are
attached to the bilayer only by association with the lipid head group, have diffusion
coefficients similar to a phospholipid molecule in the dilute limit. As mentioned above,
streptavidin molecules could be associated either to one or two biotin moieties within in
a supported lipid bilayer. Previous studies156,158 have shown that the diffusion constant of

110
proteins attached to two biotin moieties is reduced by a factor of two compared to an
individual lipid’s value. The factor of two reduction arises because two lipids now need
to be dragged together through the bilayer, while the viscous drag of the associated
protein in the adjacent aqueous solution is practically negligible.156 By Einstein’s
relation the diffusion coefficient of a lipid is: Dlipid ~ kT/flipid where k is the Boltzmann
constant, T is the absolute temperature and flipid is the friction coefficient of the lipid
bilayer. When to lipids are linked together, becoming a dimer, the total friction
coefficient becomes the sum of the of the friction factors of each lipid, fdimer = 2 flipid. The
diffusion coefficient of proteins linked to two lipid molecules is then given by: Ddimer ~
kT/fdimer = Dlipid/2.
FRAP experiments were performed on each one of the bands to determine the
diffusion coefficients for the two species. Figure 5.9 shows fluorescence recovery curve
for the two separated bands. As expected the diffusion coefficient of fluorescently
labeled proteins within Band 2 was roughly a factor of 2 higher than labeled proteins
present in Band 1 (Figure 5.8).
Effect of Biotin Concentration on Protein Separation
In a second set of experiments, we attempt to study the effect of decreasing the
concentration of biotinylated lipids on the electrophoresis of bound streptavidin. For
these experiments, the procedure is the same as outline above, except in this case,
vesicles containing POPC and 2.5 mol% biotinylated lipids were used. Then, the bilayer

111
Figure 5.8 Fluorescence recovery as a function of time for streptavidin singly-bound (A)
and streptavidin doubly-bound (B) in POPC bilayers containing 3 mol % biotinylated
conjugated lipids. The diffusion coefficient, D, of streptavidin singly bound to the
bilayer is 1.12 x 10⁻⁸ cm2/sec with a mobile fraction of 0.87; for streptavidin doubly
bound, D = 0.53 x 10⁻⁸ cm2/sec with a mobile fraction of 0.81.

112
was incubated with the streptavidin (0.25 μM) solution for 30 minutes. After rinsing the
sample with 5 mM PBS buffer to remove unbound protein the sample was mounted in
the electrophoretic device, as described in the experimental section. The lateral diffusion
of the proteins as a function of time was followed using an inverted epifluorescence
microscope. Figure 5.9 shows an epifluorescence image of the separated dye-labeled
streptavidin after 20 minutes of applied potential across the bilayer. As we can observe,
similar level of fluorescence intensity were obtained for both band. FRAP experiments
were performed on each one of the bands to determine the diffusion coefficients for the
two species. Once again, the diffusion coefficient of fluorescently labeled proteins
within Band 2 was a factor of 2 higher than the labeled proteins present Band 1. The
diffusion coefficient, D, of streptavidin within Band 2 is 1.17 x 10⁻⁸ cm2/sec with a
mobile fraction of 0.85; for streptavidin present in Band 1, D = 0.65 x 10⁻⁸ cm2/sec with
a mobile fraction of 0.83.
In the next experiments, the mol % of biotin within the supported membrane was
decreased to 0.5 mol %. By decreasing the mol percent of biotinylated lipids within the
supported membrane while maintaining the same concentration of streptavidin we
expected to have only the proteins attached to the membrane via one biotin moiety. We

113
Figure 5.9 Epifluorescence image of the separation of streptavidin singly bound from
doubly bound to POPC bilayers containing 2.5 mol % biotinylated conjugated lipids
after 20 minutes of applied potential. This image was taken with a 4X air objective with
exposure time of 200 ms. (Bottom) A line scan across the epifluorescence image shows
that the protein bands are separated and detectable by fluorescence.

114
Figure 5.10 (A) Schematic representation of the electrophoresis of streptavidin singly
bound to POPC bilayers containing 0.5 mol % biotinylated conjugated lipids. (B) (Top)
Epifluorescence image of dye-labeled streptavidin after 20 minutes of applied potential
across the bilayer. This image was taken with a 4X air objective using a mercury arc
lamp with exposure time of 200 ms. (Bottom) Line scan across the fluorescence
micrograph after 20 minutes of applied potential.

115
found the presence of only one band after a 250 V potential was applied parallel to the
plane of the lipid membrane for 20 minutes, as described in Figure 5.10. The linescan
associated with the fluorescence image shows that only one band is present and that its
migration distance is similar to Band 2 (Figure 5.10B). FRAP experiments shows a
diffusion coefficient for streptavidin of 1.12 x 10⁻⁸ cm2/sec with a mobile fraction of 0.84.
In the last set of experiments, the mole percent of biotinylated lipid within the
membrane was fixed 3 mol %, but the concentration of the streptavidin solution was
decreased from 0.25 μM to 0.05 μM. Under this set of conditions, we expected to have a
high population of proteins doubly bound to the membrane. We found the presence of
only one band after a 250 V potential was applied parallel to the plane of the lipid
membrane for 20 minutes, as described in Figure 5.11. The linescan associated with the
fluorescence image shows that only band is present and that its migration distance is
similar of Band 1 (Figure 5.11B). FRAP experiments shows a diffusion coefficient for
streptavidin of 0.57 x 10⁻⁸ cm2/sec with a mobile fraction of 0.82.

116
Figure 5.11 (A) Schematic representation of the electrophoresis of streptavidin doubly
bound to POPC bilayers containing 3 mol % biotinylated conjugated lipids. (B) (Top)
Epifluorescence image of dye-labeled streptavidin after 20 minutes of applied potential
across the bilayer. This image was taken with a 4X air objective using a mercury arc
lamp with exposure time of 200 ms. (Bottom) Line scan across the fluorescence
micrograph after 20 minutes of applied potential.

117
5.5 Summary and Conclusions
In this chapter, an electrophoretic platform was developed for the separation of
peripheral proteins. We showed separation of streptavidin proteins bound to a supported
phospholipid bilayer. The separation of doubly bound proteins from singly bound
proteins was achieved with high resolution. As clearly illustrated, the fraction of protein
which is singly and doubly bound can be controlled by adjusting the percent of ligand
moieties in the membrane. This bilayer electrophoresis platform offers several
advantages; it can be used to separate membrane associated proteins and is sensitive
enough to get a better understanding of the valency state of the ligand-receptor pair.
Furthermore, this novel electrophoresis technique can be used to study the 2D
crystallization of proteins and it can be coupled to non-label techniques, such as Mass
Spectrometry, for proteomics applications.

118
CHAPTER VI
BIOPRESERVATION OF SUPPORTED PHOSPHOLIPID BILAYERS
6.1 Synopsis
The work presented in this chapter focuses on the study of supported lipid bilayer
stability during exposure to air. The two-dimensional fluidity allows for individual
components to rearrange as they would in real cell membranes and is key for mimicking
biochemical reactions that occur on the cell surface, such as protein-protein interactions
and pathogen attack. One drawback of this biological platforms its inability to remain
stable upon exposure to air and withstand the harsh mechanical and chemical stress
associated with real-world sensor applications. Recently, our group found that the
addition of trehalose to planar supported membranes, preserve bilayer integrity and
functionality upon exposure to dry conditions.159 Herein, we demonstrate the practical
application of such technology towards the development of robust sensor platforms.
Supported lipid bilayer (SLB) samples dried in the presence of trehalose were packed
and shipped to two different destinations in order to determine how the SLB system will
react to conditions outside of the laboratory. FRAP measurements showed that the lipid
bilayers were still mobile with high mobile fraction. This methodology demonstrates the
above mentioned application and moreover can be coupled to the electrophoresis
technique. Species of interest can be separated in the membrane and then dried in the
presence of trehalose for further analytical studies.

119
6.2 Introduction
Supported phospholipid bilayers have proven to be useful mimics of the cell
membrane. They preserve the lateral fluidity of the lipid molecules which is a
fundamental property of native membranes. Lateral fluidity makes these platforms ideal
for creating biosensors because they can readily mimic the same two-dimensional
rearrangements that take place on cell surfaces during ligand-receptor recognition events.
The forces that hold the bilayer at the solid/aqueous interface of a glass substrate involve
electrostatic, van der Waals, hydrophobic, and steric interactions. A major problem is
that the lipid bilayer is not stable in dry conditions. The thin layer delaminates from the
interface if the film is exposed to the air/water interface.41,56,113,160-162
Efforts to preserve the stability of supported bilayers upon exposure to air
include but are not limited to the use of closed-packed protein layer linked to the lipid
bilayer,161 the incorporation of lipopolymers within the supported lipid membrane,113
and the addition of Trehalose.159 Recently, Albertorio and coworkers compared the
efficacy of six disaccharide and glucose molecules for the preservation of supported
lipid bilayer upon exposure to air.159 The results showed that α,α-trehalose was the most
effective in preserving the integrity of SLBs upon exposure to air (Figure 6.1).
Herein, we tested if samples treated with α,α-trehalose are able to survive
traveling conditions. Samples were prepared in the Department of Chemistry-Texas
A&M University and then shipped to Washington, DC and the Unites Kingdom. FRAP

120
Figure 6.1 A) Chemical structure of α,α-trehalose. B) Dehydration of supported
phospholipid bilayers in the presence (right) and in the absence (left) of α,α-trehalose.

121
measurements show identical diffusion constants and mobile fractions of dye-conjugated
lipid as before drying and shipping.
6.3 Experimental
Materials
1-Palmitoyl-2-Oleoyl-sn-Glycero-3-Phosphocholine (POPC) was purchased from
Avanti Polar Lipids (Alabaster, AL). N-(Texas Red sulfonyl)-1,2-dihexadecanoyl-sn-
glycero-3- phosphoethanolamine (Texas Red DHPE) were obtained from Molecular
Probes (Eugene, OR). α,α-Trehalose (99.5% was purchased from Fluka BioChemika
(Buchs, CH). Purified water acquired from a NANOpure Ultrapure Water System
(Barnstead, Dubuque, IA), had a minimum resistivity of 18.2 MΩ·cm, and was used in
the preparation of all buffer solutions. Phosphate buffer saline (PBS) was prepared using
10.0 mM sodium phosphate with the addition of 150 mM NaCl (Sigma-Aldrich).The pH
was adjusted to 7.4 by the addition of NaOH (EM Science). Solutions of α,α-Trehalose
were prepared in deionized water at 20% w/w. Poly(dimethylsiloxane) (PDMS) was
used to fabricate PDMS wells devices.66 The polymer and crosslinker were purchased
from Dow Corning (Sylgard Silicone Elastomer-184, Krayden Inc.). Glass microscope
(VWR International) were cleaned and annealed according to established procedures.66
Preparation of Small Unilamellar Vesicles and Bilayer Formation
Small unilamellar vesicles (SUVs)163 were prepared with POPC and 0.1 mol %
Texas Red DHPE as a fluorescent probe. Solutions with proper amount of each lipid

122
constituent were mixed in chloroform. A stream of dry nitrogen was used to evaporate
the chloroform and the dried lipids were desiccated under vacuum for at least 4 hours.
After evaporation of the solvent, the lipids were reconstituted in PBS buffer to a final
concentration of 2.5 mg/ml and subjected to 10 freeze-thaw cycles. The solution was
then extruded five times through a polycarbonate filter (VWR International) with a pore
size of 50 nm to produce vesicles of uniform size. Small unilamellar vesicles prepared
by this method were approximately 90 nm in diameter as determined by dynamic light
scattering using a 90Plus Particle Size Analyzer from Brookhaven Instrument Corp.
Fluorescence Recovery after Photobleaching (FRAP)
FRAP86 measurements were performed using 2.5 W mixed gas argon/krypton ion
laser (Stabilite 2018, Spectra Physics). Samples were irradiated at 568.2 nm for periods
of ~1 second at 100 mW.A 13 μm full width at half-maximum bleach spot was made by
focusing the light laser onto the bilayer through the 10x objective. The fluorescence
recovery was measured using MetaMorph Software (Universal Imaging). The
fluorescence intensity of a bleached spot was determined as a function of time after
background subtraction and intensity normalization. The data was fit to single
exponential equation. From these curves, mobile fraction of the dye-label lipids and the
half-time of recovery, t1/2, were determined according to established procedures.86 The
diffusion constant, D, could be acquired by employing the following equation:
D = (w2/ 4t1/2) γD

123
where w is the full width at half-maximum of the Gaussian profile of the focused beam
and γD is a correction factor that depends on the bleach time and the geometry of the
laser beam.86 The value of γD was 1.1.
Dehydration and Rehydration of Supported Phospholipid Bilayers
Freshly formed bilayers were initially examined by fluorescence microscopy and
analyzed by FRAP before the introduction of the sugar. After, FRAP measurements
were made, the buffer solution above the bilayer was exchanged for the sugar solution
and allowed to incubated for 1 hour. Trehalose solution was prepared in PBS buffer
where the amount of sugar in solution is given as a weight percent (w/w %). FRAP
measurements were performed again to check the quality of the phospholipid bilayer in
the presence of the sugar solution. To dehydrate the bilayer, the bulk solution was
removed from the PDMS well with a pipette and the platform was placed on top of the
oven for approximately 30 minutes. The dried bilayer was again observed under a
fluorescence microscope to inspect for any damage or delamination. Samples were then
shipped to Washington, D.C. and the United Kingdom. After the samples were back in
Texas theses were rehydrate with deionized water and analyzed by FRAP.
Sample Shipment
Samples treated with α,α-trehalose were labeled and packed inside small plastic
boxes. The samples were shipped to Washington D.C. and to the United Kingdom. The
idea is that during shipment, the supported membranes will be exposed to the non-sterile

124
conditions outside the laboratory setting and prove the applicability of the
aforementioned technology.
6.4 Results and Discussion
In an initial set of experiments, supported phospholipid bilayers in PBS
containing 99.9 mol % POPC and 0.1 mol % Texas Red DHPE were formed by vesicle
fusion. FRAP experiments showed that the bilayers were 2D-dimensional fluid with
diffusion constants of 4.6 ± (0.3) × 10-8 cm2/sec. The sample recovered approximately
97% of its initial fluorescence at t = ∞. Then the aqueous solution was exchanged for
the trehalose solution (20 w/w %) and incubated for 1 hour. It should be noted that a 20
w/w % solution of trehalose corresponds to a concentration of 0.6 M. FRAP
experiments were repeated after the introduction of 20 w/w % trehalose and similar
results were obtained. Then the samples were dried and analyzed by fluorescence
microscopy. Figure 6.2 shows fluorescence micrographs of the supported bilayer before
and after drying from 20 w/w% trehalose solution. The sample showed uniform
fluorescence and no evidence for delamination. To test sample stability, the samples
were properly labeled, packed, and shipped to Washington, D.C. using standard post
office services. Samples shipped to Washington D.C. returned 20 days later. The
samples were rehydrated and tested again to check if the bilayers were still functional.
FRAP measurements demonstrated that the bilayer were still highly mobile. The inset
image in Figure 6.3 shows a fluorescence micrograph of the bilayer right after
photobleaching and again 300 sec later. The FRAP curve (Figure 6.3) refers to the

125
Figure 6.2 Images of supported POPC lipid membranes doped with 1 mol% Texas Red
DHPE before drying (A), after drying (B) from 20 w/w % solutions of trehalose, after
drying (C) in the absence of trehalose.

126
Figure 6.3 Fluorescence recovery after photobleaching curve for a supported bilayer
shipped to Washington, D.C. and analyzed 20 days later. Insets: fluorescence
micrographs of the bilayer showing the laser bleach spot both before and after recovery
(red circles).

127
fluorescence intensity in the bleached spot as a function of time. As can be seen,
relatively complete recovery was observed with a diffusion constant of 4.5 ± (0.3) × 10-8
cm2/sec. Moreover, the sample recovered over 90% of its initial fluorescence.
A second group of samples were prepared following the procedure explained
above. These groups of samples were also prepared using vesicles composed of 99.9
mol % POPC and 0.1 mol % Texas Red DHPE. After drying the samples in the
presence of 20 w/w% α,α-trehalose, the samples were properly labeled, packed, and
shipped over sea to the United Kingdom. Figure 6.4 shows fluorescence micrographs of
the supported bilayer before (A) and after drying (B) from 20 w/w% trehalose solution.
These images were taken before shipping the samples to the United Kingdom. Figure 6.4
also shows the fluorescence micrographs of the supported bilayer right after arrived (C)
from the United Kingdom and after rinsed and rehydrated (D) with deonized water.
Samples shipped to the United Kingdom returned 15 days later and there were tested in
our laboratory. All the samples tested shows similar behaviors. The inset image in
Figure 6.4 shows a fluorescence micrograph of the bilayer right after photobleaching and
again 300 sec later. The FRAP curve (Figure 6.5) shows relatively complete recovery of
the fluorescence with a diffusion constant of 4.5 ± (0.5) × 10-8 cm2/sec. Moreover, the
sample recovered approximately 92% of its initial fluorescence.

128
Figure 6.4 Images of supported POPC lipid membranes before drying (A), after drying
(B) from 20 w/w % solutions of trehalose, after returned (C) from the United Kingdom,
and after rehydrated (D) with deionized water.

129
Figure 6.5 Fluorescence recovery after photobleaching curve for a supported bilayer
shipped to the United Kingdom and analyzed 15 days later. Insets: fluorescence
micrographs of the bilayer showing the laser bleach spot both before and after recovery
(red circles).

130
6.5 Summary and Conclusions
In this study we showed that supported bilayers dried in the presence of α,α-
trehalose are able to survive robust conditions. Samples dried in the presence of
trehalose were packed and shipped to two different destinations, Washington, D.C. and
the United Kingdom. After several days of transport and exposure to non-sterile
environment and stress that occur during shipment, FRAP measurements showed that
the lipid bilayers were still mobile with high mobile fraction. This open the doors
towards creating working biosensors that could be dried in the presence of saccharides,
shipped, and then later rehydrated in order to return to their original state. Also, the
addition of the sugar does not alter the bilayer structure. This drying procedure could be
coupled to the electrophoresis technique. Species of interest can be separated in the
membrane and then dried in the presence of trehalose for further analytical studies. This
could open the area for studying protein crystal structure and sequence analysis of
candidate proteins via mass spectrometry where samples need to exist under dry
conditions.

131
CHAPTER VII
CONCLUSIONS
The main goal of the research presented in this dissertation was to develop a new
biological platform for use in making biophysical studies of membrane proteins and
protein chromatography. As clearly stated in the introduction section, membrane
proteins play a crucial role in many cellular processes by providing vital communication
between the cell and its surroundings. The normal functions of this class of protein are
fundamental to our health, and many damaged proteins have been associated to serious
human diseases. Today membrane proteins are targets for the majority of drugs currently
developed by the pharmaceutical industry. Thus, developing new tools for obtaining
structural information could greatly improve the efficiency of drug discovery.
The first goal of this project was to develop a solid supported lipid bilayer (SLB)
that mimics the cell membrane/cytoskeletal network, in which biophysical studies of
integral transmembrane protein can be done. SLB have been extensively used as model
systems to study numerous cell membrane processes, but one well-know drawback of
the system has been the successful incorporation of an integral transmembrane protein.
Transmembrane protein mobility has been hindered by denaturation of these species on
the underlying inorganic support. The thin layer of water that separates the bilayer from
the substrate (~ 1 nm) does not offer an adequate space between the membrane and the
substrate. To solve this problem, I designed a “double cushion” bilayer system. This
new platform, as discussed in Chapter III, consisted of a first cushion layer formed by

132
uniformly adsorbing BSA onto a planar glass supports and a second layer formed when
lipid vesicles containing polymer-conjugated lipids are fused on top of this first layer. In
this double cushion system, the distance between the BSA layer and the lower leaflet of
the bilayer can be manipulated by varying the density and size of the lipopolymer
incorporated into the lipid bilayer. Diffusion constants in the order 10-8 cm2/sec with
mobile fractions up to 75 % were obtained for a model transmembrane protein. This
represents a significant improvement over other platforms fabricated directly on glass or
using single cushion strategies.
The second goal of this dissertation project was to develop a new biological
platform for the purification of membrane associated species, such as lipids conjugated
with fluorescent markers and peripheral proteins, in their native environment. As
discussed in Chapter IV and V, this method consisted of a solid supported bilayer
platform doped with cholesterol. Cholesterol was used to control the physical properties
of the bilayer. In Chapter IV, we achieved with high resolution and small band
broadening, the separation of two isomers of Texas Red dye and a green dye, BODIPY.
Our technique was sensitive enough to resolve into two distinct bands isomers of Texas
Red-DHPE. The separation of isomers is not simple since the difference between the two
compounds in only structural. Isomers of the same compound have the same charge and
molecular weight. In our supported platform, the separation of isomers was possible
because they presumably interact differently with the lipid bilayer due to their structures.
This difference in interaction most likely lead to different migration speeds. In Chapter
IV, this electrophoretic platform was modified to be able to move and separated

133
peripheral proteins. We showed that we could electrophoretically move fluorescently
labeled streptavidin proteins bound to a bilayer via a biotinylated lipids present within
the supported membrane. The separation of doubly bound proteins from singly bound
proteins was achieved with high resolution. For the first time, this platform allows for
the direct observation of the different valency states of ligand-receptors pairs.
The next goal is to extend this electrophoretic technique for the separation of
transmembrane proteins. Prior to achieving this objective, it is important to modify the
composition of the bilayer to accommodate transmembrane species. I have already
accomplished this goal (Chapter III) and shown that the proper bilayer composition can
maintain transmembrane fluidity. Combining the double cushion bilayer platform with
the electrophoretic technique outlined in Chapter IV, we should be able to extend this
method to separate transmembrane proteins within their native environment as shown in
Figure 7.1.
7.1 Electrophoretic Separation in Microfluidic Devices
One of the advantages of our electrophoretic platform is the possibility of
combining this technique with microfluidics for the separation and analysis of membrane
species on a single chip. Initial experiments in this area were performed using a simple
microfludic device. Figure 7.2 illustrates a schematic diagram of the microfluidic device.
The device consists of two channels; channel A (200 μm) and channel B (100 μm). To
apply a voltage across channel B two platinum electrodes were placed into holes in the
PDMS of the microfluidic device.

134
Figure 7.1 Strategy to separate transmembrane proteins using double cushion to prevent
immobilization.

135
Figure 7.2 Schematic representation of a T-form microfluidic device used for the
electrophoresis experiment. The device consists of two channels connected together in
T-form.

136
In a first set of experiments, we demonstrated the ability to electrophoretically
move Texas Red labeled lipids inside the microfluidic device. First, the two channels
were filled with DI water. Then a vesicle solution containing POPC and of 1 mol %
Texas Red DHPE was flowed across Channel A. The vesicles fused to this area, creating
a supported bilayer with Texas Red DHPE in it. After rinsing to remove unfused vesicles,
the separation bilayer was formed in Channel B by flowing vesicles composed of 100
mol % POPC across Channel B. Figure 7.3A shows a cartoon representation and
epifluorescence micrograph of the system. A 100 V potential (DC) was applied parallel
to the plane of the membrane formed inside Channel B (Figure 7.3 B). Because Texas
Red DHPE lipids are negatively charged, they will migrate toward the positive electrode.
We monitored the lateral movement of the Texas Red lipids as a function of time using
an inverted microscope. Figure 7.3B shows an epifluorescence micrograph of the system
after applying a 100 V across the channel for 30 minutes. As shown, we were able to
move, by electrophoresis, Texas Red DHPE lipids inside a microfluidic channel.
One of our Laboratory future goals is to design a microfluidic platform whereby
we separate and analyze multiple proteins at the same time using a single microfluidic
device. This high trough-put platform can be easily coupled to other techniques such as
mass spectrometry for proteomics applications. A design of a possible device is
illustrated in Figure 7.4. Figure 7.5 shows a 3D-cartoon of the separation experiment.
The experiment consists of four steps. First, vesicles containing the analyte are
introduced through the left side channel. Then vesicles containing the desired
composition to form the separation bilayer are introduced into the rest of the device.

137
Figure 7.3 Texas Red- DHPE labeled lipids migrating in pure POPC bilayer. A) Cartoon
representation and epifluorescence micrograph of the system before applying a potential
across the bilayer. B) Cartoon representation and epifluorescence micrograph of the
system after applying 100 V across the bilayer for approximately 30 minutes.

138
Figure 7.4 Schematic diagram of a microfluidic device for proteomic applications.

139
Figure 7.5 Schematic illustration of an electrophoresis experiment inside a microfluidic
device. (1-2) Species are separated in the x-direction first. (3-4) Then the voltage is
changed to the y-direction to collect the samples.

140
A voltage can be applied across the bilayer to separate the species in the x-direction.
Then, the direction of the voltage can be changed to collect the species into spots as
shown in Figure 7.5.
7.2 Catalysis on a Chip-Biosensor Device
Another exciting application is the possibility of using our electrophoretic
platform as a medical diagnostic device for the early detection of human disease.
Certain enzymatic reactions can lead to the formation of ‘biomarkers’ which can indicate
the onset of a particular disease. For example, the increased hydrolysis of a particular
ganglioside is to related to Alzheimer.164 Thus an interesting system that we could study
is the hydrolysis of gangliosides, such as GM1, by the enzyme β-galactosidase. β-
galactosidase is a hydrolase enzyme that is responsible for the hydrolysis of β-
galactosides into monosaccharides.165 Some of the substrates for this enzyme include but
are not limited to ganglioside GM1, lactosylceramides, and some glycoproteins. GM1 are
membrane lipids in which the polar head group is a complex oligosaccharide containing
a sialic acid and other monosaccharide residues (Figure 7.6).
Figure 7.7 shows a schematic representation of the proposed experiment. We
have previously showed that we can prepare solid supported lipid bilayers by the fusion
of POPC vesicles containing GM1.145 GM1 bears a net charge of negative 1.166 Under an
electric field we expect GM1 to migrate toward the positive electrode (Figure 7.7A). The
GM1 lipid exhibits a specific mobility which can be calculated from the velocity profile,

141
Figure 7.6 Chemical structure of ganglioside GM1.167

142
Figure 7.7 Catalysis on a chip. (A) Before adding the enzyme, the species of interest
travel a distance equal to x. (B) After the reaction of the enzyme with the species of
interest (e.g. hydrolysis) the species travel a distance y different from distance x.

143
which depends on the applied potential. Addition of β-galactosidase causes the
hydrolysis of GM1, releasing a D-galactose moiety. After applying a potential across the
supported membrane we expect the ganglioside to exhibit a different electrophoretic
mobility (Figure 7.7B). By measuring the change in the electrophoretic mobility, one
can determine important parameters, such as the stoichiometry of the reaction and the
enzyme efficiency.
In conclusion, this dissertation project further supports the importance of solid
supported phospholipid bilayers as cell biomembrane mimics. This biological platform
can be coupled within microfluidics devices and with numerous analytical techniques,
such as fluorescence microscopy, mass spectrometry, and atomic force microscopy. This
opens the door to the development of novel proteomics methodologies that will elucidate
a variety of biological processes.
The double cushion system developed here mimics the cell
membrane/cytoskeletal network. This new system presents a new biological platform in
where biophysical study of transmembrane proteins, such as ion transport, protein-
protein interactions, and binding, can be studied. Furthermore, this novel biological
platform can be coupled to our electrophoresis technique for the purification and study
of transmembrane species. The separated species can be characterized with non-label
techniques, such as mass spectrometry, for proteomics applications. Finally, a biosensor
device can be designed for the early detection of human diseases.

144
REFERENCES
(1) Fischer, F.; Wolters, D.; Rogner, M.; Poetsch, A. Molecular & Cellular Proteomics 2006, 5, 444-453.
(2) Kyogoku, Y.; Fujiyoshi, Y.; Shimada, I.; Nakamura, H.; Tsukihara, T.; Akutsu, H.; Odahara, T.; Okada, T.; Nomura, N. Acc. Chem. Res. 2003, 36, 199-206.
(3) Drews, J. Science 2000, 287, 1960-1964.
(4) Stoeckenius, W.; Engelman, D. M. J. Cell Biol. 1969, 42, 613-646.
(5) Voet, D.; Voet, J. G. Biochemistry, 2nd ed.; John Wiley & Sons: New York, 1995.
(6) Singer, S. J.; Nicolson, G. L. Science 1972, 175, 720-731.
(7) Geigel, G., 2008, http://sun.menloschool.org/~cweaver/cells/c/cell_membrane/.
(8) Boesze-Battaglia, K.; Schimmel, R. J. J. Exp. Biol. 1997, 200, 2927–2936.
(9) Wallin, E.; von Heijne, G. Protein Sci. 1998, 7, 1029-1038.
(10) Nelson, D. L.; Cox, M. M. Principles of Biochemistry; 4th ed.; W.H. Freeman and Company: New York, 2005.
(11) Alberts, B. B.; D. Lewis, J.; Raff, M.; Roberts, K.; Watson, J. pp. 446-506, In Molecular Biology of the Cell,. Garland Publishing, New York, 1994.
(12) Branton, D. Proc. Natl. Acad. Sci. 1966, 55, 1048-1056.
(13) Palczewski, K. Annu. Rev. Biochem. 2006, 75, 743-767.

145
(14) Palczewski, K.; Kumasaka, T.; Hori, T.; Behnke, C.; Motoshima, H.; Fox, B.; Trong, I.; Teller, D.; Okada, T.; Stenkamp, R.; Yamamoto, M.; Miyano, M. Science 2000, 289, 739-745.
(15) Filipek S; Teller DC; Palczewski K; R., S. Annu. Rev. Biophys. Biomol. Struct. 2003, 32, 375–397.
(16) Filmore, D. Mod. Drug Discovery 2004, 7, 24-28.
(17) Teller, D.; Okada, T.; Behnke, C.; Palczewski, K.; Stenkamp, R. Biochemistry 2001, 40, 7761-7772.
(18) Lundstrom, K.; Wagner, R.; Reinhart, C.; Desmyter, A.; Cherouati, N.; Magnin, T.; Zeder-Lutz, G.; Courtot, M.; Prual, C.; Andre, N.; Hassaine, G.; Michel, H.; Cambillau, C.; Pattus, F. J. Struct. Funct. Genomics 2006, 7, 77-91.
(19) Hubner, C. A.; Jentsch, T. J. Human Molecular Genetics 2002, 11, 2435-2445.
(20) Doyle, D. A.; Cabral, J. M.; Pfuetzner, R. A.; Kuo, A. L.; Gulbis, J. M.; Cohen, S. L.; Chait, B. T.; MacKinnon, R. Science 1998, 280, 69-77.
(21) Agre, P.; Sasaki, S.; Chrispeels, M. J. Am. J. Physiol. 1993, 265, F461.
(22) Agre, P.; Kozono, D. FEBS Lett. 2003, 555, 72-78.
(23) Singh, S.; Malik, B. K.; Sharma, D. K. Bioinformation 2006, 1, 314-320.
(24) Lundstrom, K. Mol. Biotech. 2006, 34, 205-212.
(25) Görg, A.; Weiss, W.; Dunn, M. Proteomics 2004, 4, 3665–3685.
(26) Brian, A. A.; McConnell, H. M. Proc. Natl. Acad. Sci. U.S.A. 1984, 81, 6159-6163.

146
(27) Tamm, L. K.; Mcconnell, H. M. Biophys. J. 1985, 47, 105-113.
(28) McConnell, H. M.; Watts, T. H.; Weis, R. M.; Brian, A. A. Biochim. Biophys. Acta 1986, 864, 95-106.
(29) Kalb, E.; Frey, S.; Tamm, L. K. Biochim. Biophys. Acta 1992, 1103, 307-316.
(30) Hubbard, J. B.; Silin, V.; Plant, A. L. Biophys. Chem. 1998, 75, 163-176.
(31) Tamm, L. K.; Shao, Z. pp.169-185 In Biomembrane Structure; IOS Press: Amsterdam, 1998.
(32) Koenig, B. W.; Gawrisch, K.; Krueger, S.; Orts, W.; Majkrzak, C. F.; Berk, N.; Silverton, J. V. Biophys. J. 1996, 70, 229.
(33) Thompson, N. L.; Pearce, K. H.; Hsieh, H. V. Eur. Biophys. J. Biophy. 1993, 22, 367-378.
(34) Yang, T.; Baryshnikova, O. K.; Mao, H. B.; Holden, M. A.; Cremer, P. S. J. Am. Chem. Soc. 2003, 125, 4779-4784.
(35) Thompson, N. L.; Drake, A. W.; Chen, L. X.; VandenBroek, W. Photochem. Photobiol. 1997, 65, 39-46.
(36) Stelzle, M.; Weissmuller, G.; Sackmann, E. J. Phys. Chem. 1993, 97, 2974-2981.
(37) Cornell, B. A.; BraachMaksvytis, V. L. B.; King, L. G.; Osman, P. D. J.; Raguse, B.; Wieczorek, L.; Pace, R. J. Nature 1997, 387, 580-583.
(38) van Oudenaarden, A.; Boxer, S. G. Science 1999, 285, 1046-1048.
(39) Johnson, J. M.; Ha, T.; Chu, S.; Boxer, S. G. Biophys. J. 2002, 83, 3371-3379.
(40) Kim, J.; Kim, G.; Cremer, P. S. Langmuir 2001, 17, 7255-7260.

147
(41) Cremer, P. S.; Boxer, S. G. J. Phys. Chem. B 1999, 103, 2554-2559.
(42) Bayerl, T. M.; Bloom, M. Biophys. J. 1990, 58, 357-362.
(43) Johnson, S. J.; Bayerl, T. M.; Mcdermott, D. C.; Adam, G. W.; Rennie, A. R.; Thomas, R. K.; Sackmann, E. Biophys. J. 1991, 59, 289-294.
(44) Williams, L. M.; Evans, S. D.; Flynn, T. M.; Marsh, A.; Knowles, P. F.; Bushby, R. J.; Boden, N. Langmuir 1997, 13, 751-757.
(45) Koenig, B. W.; Kruger, S.; Orts, W. J.; Majkrzak, C. F.; Berk, N. F.; Silverton, J. V.; Gawrisch, K. Langmuir 1996, 12, 1343-1350.
(46) Cremer, P. S.; Groves, J. T.; Kung, L. A.; Boxer, S. G. Langmuir 1999, 15, 3893-3896.
(47) Groves, J. T.; Wulfing, C.; Boxer, S. G. Biophys. J. 1996, 71, 2716-2723.
(48) Groves, J. T.; Boxer, S. G. Biophys. J. 1995, 69, 1972-1975.
(49) Cremer, P. S.; Groves, J. T.; Ulman, N.; Boxer, S. G. Biophys. J. 1998, 74, A311-A311.
(50) Graneli, A.; Rydstrom, J.; Kasemo, B.; Hook, F. Langmuir 2003, 19, 842-850.
(51) Groves, J. T.; Ulman, N.; Boxer, S. G. Science 1997, 272, 651-653.
(52) Kam, L.; Boxer, S. G. J. Am. Chem. Soc. 2000, 122, 12901-12902.
(53) Plant, A. L. Langmuir 1999, 15, 5128-5135.
(54) Wagner, M. L.; Tamm, L. K. Biophys. J. 2000, 79, 1400-1414.
(55) Sackmann, E.; Tanaka, M. Trends Biotechnol. 2000, 18, 58-64.

148
(56) Conboy, J. C.; Liu, S.; O'Brien, D. F.; Saavedra, S. S. Biomacromolecules 2003, 4, 841-849.
(57) Rossetti, F. F.; Textor, M.; Reviakine, I. Langmuir 2006, 22, 3467-3473.
(58) Zasadzinski, J. A.; Helm, C. A.; Longo, M. L.; Weisenhorn, A. L.; Gould, S. A. C.; Hansma, P. K. Biophys. J. 1991, 59, 755-760.
(59) Egawa, H.; Furusawa, K. Langmuir 1999, 15, 1660–1666.
(60) Spinke, J.; Yang, J.; Wolf, H.; Liley, M.; Ringsdorf, H.; Knoll, W. Biophys. J. 1992, 63, 1667-1671.
(61) Fang, Y.; Cheley, S.; Bayley, H.; Yang, J. Biochemistry 1997, 36, 9518-9522.
(62) Merino, S.; Domenech, O.; Vinas, M.; Montero, M. T.; Hernandez-Borrell, J. Langmuir 2005, 21, 4642-4647.
(63) Schonherr, H.; Johnson, J. M.; Lenz, P.; Frank, C. W.; Boxer, S. G. Langmuir 2004, 20, 11600-11606.
(64) Merino, S.; Domenech, O.; Montero, M. T.; Hernandez-Borrell, J. Biosens. Bioelectron. 2005, 20, 1843-1846.
(65) Yuan, C. B.; Johnston, L. J. Biophys. J. 2001, 81, 1059-1069.
(66) Yang, T. L.; Jung, S. Y.; Mao, H. B.; Cremer, P. S. Anal. Chem. 2001, 73, 165-169.
(67) Shaw, J. E.; Slade, A.; Yip, C. M. J. Am. Chem. Soc. 2003, 125, 11838-11839.
(68) Kuziemko, G. M.; Stroh, M.; Stevens, R. C. Biochemistry 1996, 35, 6375-6384.
(69) Terrettaz, S.; Stora, T.; Duschl, C.; Vogel, H. Langmuir 1993, 9, 1361-1369.

149
(70) Tanaka, M.; Sackmann, E. Nature 2005, 437, 656-663.
(71) Sackmann, E. Science 1996, 271, 43-48.
(72) Castellana, E. T.; Cremer, P. S. Surface Science Reports 2006, 61, 429-444.
(73) Zhang, L. Q.; Longo, M. L.; Stroeve, P. Langmuir 2000, 16, 5093-5099.
(74) Majewski, J.; Wong, J. Y.; Park, C. K.; Seitz, M.; Israelachvili, J. N.; Smith, G. S. Biophys. J. 1998, 75, 2363-2367.
(75) Ma, C.; Srinivasan, M. P.; Waring, A. J.; Lehrer, R. I.; Longo, M. L.; Stroeve, P. Colloids. Surf. B 2003, 28, 319-329.
(76) Kugler, R.; Knoll, W. Bioelectrochemistry 2002, 56, 175-178.
(77) Hillebrandt, H.; Wiegand, G.; Tanaka, M.; Sackmann, E. Langmuir 1999, 15, 8451-8459.
(78) Elender, G.; Kuhner, E.; Sackmann, E. Biosens. Bioelectron. 1996, 11, 565-577
(79) Shen, W. W.; Boxer, S. G.; Knoll, W.; Frank, C. W.; Biomacromolecules 2001, 2, 70-79.
(80) Beyer, D.; Elender, G.; Knoll, W.; Kuhner, M.; Maus, S.; Ringsdorf, H.; Sackmann, E. Angew. Chem.Int. Edn 1996, 35, 1682-1685.
(81) Hausch, M.; Zentel, R.; Knoll, W. Macromol. Chem. Phys. 1999, 200, 174-179.
(82) Seitz, M.; Ter-Ovanesyan, E.; Hausch, M.; Park, C. K.; Zasadzinski, J. A.; Zentel, R.; Israelachvili, J. N. Langmuir 2000, 16, 6067-6070.

150
(83) Seitz, M.; Wong, J. Y.; Park, C. K.; Alcantar, N. A.; Israelachvili, J.; Films, T. S. Thin Solid Films 1998, 329, 767-771.
(84) Weng, K. C.; Stalgren, J. J. R.; Duval, D. J.; Risbud, S. H.; Frank, C. W. Langmuir 2004, 20, 7232-7239.
(85) Davis, R. W.; Flores, A.; Barrick, T. A.; Cox, J. M.; Brozik, S. M.; Lopez, G. P.; Brozik, J. A. Langmuir 2007, 23, 3864 -3872.
(86) Axelrod, D.; Koppel, D. E.; Schlessinger, J.; Elson, E.; Webb, W. W. Biophys. J. 1976, 16, 1055-1069.
(87) Daniel, S.; Diaz, A. J.; Martinez, K. M.; Bench, B. J.; Albertorio, F.; Cremer, P. S. J. Am. Chem. Soc. 2007, 129, 8072-8073.
(88) Haugland, R. P., p.70, In The Handbook; 10th ed.; Invitrogen Corp., California, 2005.
(89) Mammen, M.; Choi, S.-K.; Whitesides, G. M. Angew. Chem. Int. Ed. 1998, 37, 2754-2794.
(90) Bowden, N.; Brittain, S.; Evans, A. G.; Hutchinson, J. W.; Whitesides, G. M. Nature 1998, 146-149.
(91) Xia, Y.; Whitesides, G. M. Annu. Rev. Mater. Sci. 1998, 28, 153-184.
(92) Mao, H. B.; Holden, M. A.; You, M.; Cremer, P. S. Anal. Chem. 2002, 74, 5071-5075.
(93) Holden, M. A.; Kumar, S.; Castellana, E. T.; Beskok, A.; Cremer, P. S. Sens. Actuators, B 2003, 199-207.
(94) Holden, M. A.; Kumar, S.; Beskok, A.; Cremer, P. S. J. Micromech. Microeng. 2003, 13, 412-418.

151
(95) Holden, M. A., Studies in biological surface science: microfluidics, photopatterning and artificial bilayers, Ph.D. Dissertation, Texas A&M University, 2004.
(96) Jacobson, K.; Derzko, Z.; Wu, E. S.; Hou, Y.; Poste, G. J. Supramol. Str. 1976, 5, 565-576.
(97) Lopez, A.; Dupou, L.; Altibelli, A.; Trotard, J.; Tocanne, J. F. Biophys. J. 1999, 53, 963-970.
(98) van Oudenaarden, A.; Boxer, S. G. Science 1999, 285, 1046-1048.
(99) Goennenwein, S.; Tanaka, M.; Hu, B.; Moroder, L.; Sackmann, E. Biophys. J. 2003, 85, 646-655.
(100) Baumgart, T.; Offenhausser, A. Langmuir 2003, 19, 1730-1737.
(101) Lang, H.; Duschl, C.; Vogel, H. Langmuir 1994, 10, 197-210.
(102) Purrucker, O.; Fortig, A.; Jordan, R.; Tanaka, M. Chem. Phys. Chem. 2004, 5, 327-335.
(103) Naumann, C. A.; Frank, C. W.; Prucker, O.; Lehmann, T.; Ruehe, J.; Knoll, W.; J., B. Biophys. J. 2000, 78, 273a-273a.
(104) Tanaka, M. Mrs Bull. 2006, 31, 513-520.
(105) Wiegand, G.; Jaworek, T.; Wegner, G.; Sackmann, E. J. Colloid Interface Sci. 1997, 196, 299-312.
(106) Wagner, M. L.; Tamm, L. K. Biophys. J. 2001, 81, 266-275.
(107) Smith, E. A.; Coym, J. W.; Cowell, S. M.; Tokimoto, T.; Hruby, V. J.; Yamamura, H. I.; Wirth, M. J. Langmuir 2005, 21, 9644-9650.

152
(108) Berendes, R.; Voges, D.; Demange, P.; Huber, R.; Burger, A. Science 1993, 262, 427-430.
(109) Seaton, B. A. pp. 15-29, In Annexins: Molecular Structure to Cellular Function; Landes Co., Austin, TX, 1996.
(110) Isas, J. M.; Cartailler, J. P.; Sokolov, Y.; Patel, D. R.; Langen, R.; Luecke, H.; Hall, J. E.; Haigler, H. T. Biochemistry 2000, 39, 3015-3022.
(111) Langen, R.; Isas, J. M.; Hubbell, W. L.; Haigler, H. T. Proc. Natl. Acad. Sci. U.S.A. 1998, 95, 14060-14065.
(112) Binder, H.; Kohler, G.; Arnold, K.; Zschornig, O. Chem. Phys. Chem. 2000, 2, 4615-4623.
(113) Albertorio, F.; Diaz, A. J.; Yang, T. L.; Chapa, V. A.; Kataoka, S.; Castellana, E. T.; Cremer, P. S. Langmuir 2005, 21, 7476-7482.
(114) Nollert, P.; Kiefer, H.; Jahnig, F. Biophys. J. 1995, 69, 1447-1455.
(115) Groves, J. T.; Ulman, N.; Cremer, P. S.; Boxer, S. G. Langmuir 1998, 14, 3347-3350.
(116) Mao, H. B.; Yang, T. L.; Cremer, P. S. Anal. Chem. 2002, 74, 379-385.
(117) Albertorio, F.; Daniel, S.; Cremer, P. S. J. Am. Chem. Soc. 2006, 128, 7168-7169.
(118) Cezanne, L.; Lopez, A.; Loste, F.; Parnaud, G.; Saurel, O.; Demange, P.; Tocanne, J. F. Biochemistry 1999, 38, 2779-2786.
(119) Saurel, O.; Cezanne, L.; Milon, A.; Tocanne, J. F.; Demange, P. Biochemistry 1998, 37, 1403-1410.
(120) Richter, R. P.; Him, J. L. K.; Tessier, B.; Tessier, C.; Brisson, A. R. Biophys. J. 2005, 89, 3372-3385.

153
(121) Marsh, D.; Bartucci, R.; Sportelli, L. BBA-Biomembranes 2003, 1615, 33-59.
(122) Kunding, A.; Stamou, D. J. Am. Chem. Soc. 2006, 128, 11328-11329.
(123) Munro, J. C.; Frank, C. W. Langmuir 2004, 20, 3339-3349.
(124) Sweryda-Krawiec, B.; Devaraj, H.; Jacob, G.; Hickman, J. J. Langmuir 2004, 20, 2054-2056.
(125) Zheng, H.; Zhao, J.; Sheng, W.; Xie, X.-Q. Biopolymers 2006, 83, 46-61.
(126) Lundstrom, K. Cell. Mol. Life Sci. 2006, 63, 2597-2607.
(127) Zhu, H.; Bilgin, M.; Bangham, R.; Hall, D.; Casamayor, A.; Bertone, P.; Lan, N.; Jansen, R.; Bidlingmaier, S.; Houfek, T.; Mitchell, T.; Miller, P.; Dean, R. A.; Gerstein, M.; Snyder, M. Science 2001, 293, 2101-2105.
(128) Cristea, I. M.; Gaskell, S. J.; Whetton, A. D. Blood 2004, 103, 3624-3634.
(129) Phizicky, E.; Bastiaens, P. I. H.; Zhu, H.; Snyder, M.; Fields, S. Nature 2003, 422, 208-215.
(130) Groves, J. T.; Boxer, S. G.; McConnel, H. M. Proc. Natl. Acad. Sci. 1997, 94, 13390-13395.
(131) Yoshina-Ishii, C.; Boxer, S. G. J. Am. Chem. Soc. 2003, 125, 3696-3697.
(132) Yoshina-Ishii, C.; Boxer, S. G. Langmuir 2006, 22, 2384-2391.
(133) Filippov, A.; Oradd, G.; Lindblom, G. Biophys. J. 2003, 84, 3079-3086.
(134) Filippov, A.; Oradd, G.; Lindblom, G. Langmuir 2003, 19, 6397-6400.

154
(135) Titus, J. A.; Haugland, R.; Sharrow, S. O.; Segal, D. M. J. Immunol. Methods 1982, 50, 193-204.
(136) Dietrich, C.; Bagatolli, L. A.; Volovyk, Z. N.; Thompson, N. L.; Levi, M.; Jacobson, K.; Gratton, E. Biophys. J. 2001, 80, 1417-1428.
(137) Simons, K.; Vaz, W. L. C. Annu. Rev. Biophys. Biomol. Struct. 2004, 33, 269-295.
(138) Caprioli, R. M.; Farmer, T. B.; Gile, J. Anal. Chem. 1997, 69, 4751–4760
(139) Kraft, M. L.; Weber, P. K.; Longo, M. L.; Hutcheon, I. D.; Boxer, S. G. Science 2006, 313, 1948-1951.
(140) Daniel, S.; Diaz, A. J.; Martinez, K. M.; Bench, B. J.; Albertorio, F.; Cremer, P. J. Am. Chem. Soc. 2007, 129, 8072-8073.
(141) Sano, T.; Vajda, S.; Cantor, C. R. J. Chromatogr. B 1998, 715, 85-91.
(142) Chaiet, L.; Miller, T. W.; Tausing, F.; Wolf, F. J. Antimicrob. Agents Chemother. 1963, 3, 28-32.
(143) Chaiet, L.; Wolf, F. J. Arch. Biochem. Biophys. 1964, 106, 1-5.
(144) Keizer, J. Acc. Chem. Res. 1985, 18, 235-241.
(145) Shi, J. J.; Yang, T. L.; Kataoka, S.; Zhang, Y. J.; Diaz, A. J.; Cremer, P. S. J. Am. Chem. Soc. 2007, 129, 5954-5961.
(146) Heldin, C. H. Cell 1995, 80, 213-223.
(147) Kiessling, L. L.; Pohl, N. L. Chem. Biol. 1996, 3, 71-77.

155
(148) Mammen, M.; Choi, S. K.; Whitesides, G. M. Angew. Chem. Int. Ed. 1998, 37, 2755-2794.
(149) Hunter, R. J. Zeta Potential in Colloid Science; Academic Press: London, 1981.
(150) Chilkoti, A.; Stayton, P. S. J. Am. Chem. Soc. 1995, 117, 10622-10628.
(151) Green, N. M. Biochem. J. 1963, 89, 585-&.
(152) Jost, W. Diffusion in Solids, Liquids, Gases; Academic Press, Inc., Publishers: New York, 1952.
(153) Zhang, Y. J.; Furyk, S.; Bergbreiter, D. E.; Cremer, P. S. J. Am. Chem. Soc. 2005, 127, 14505-14510.
(154) Zhang, Y.; Furyk, S.; Sagle, L. B.; Cho, Y.; Bergbreiter, D. E.; Cremer, P. S. J. Phys. Chem. C 2007, 111, 8916-8924.
(155) Furyk, S.; Zhang, Y. J.; Ortiz-Acosta, D.; Cremer, P. S.; Bergbreiter, D. E. J. Polymer Sci. Polymer Chem. 2006, 44, 1492-1501.
(156) Tamm, L. Biochemistry 1998, 27, 1450-1457.
(157) Smith, L. M.; Parce, J. W.; Smith, B. A.; Mcconnell, H. M. Proc. Natl. Acad. Sci. 1979, 76, 4177-4179.
(158) Subramaniam, S.; Seul, M.; Mcconnell, H. M. Proc. Natl. Acad. Sci. 1986, 83, 1169-1173.
(159) Albertorio, F.; Chapa, V. A.; Chen, X.; Diaz, A. J.; Cremer, P. S. J. Am. Chem. Soc. 2007, 129, 10567-10574.
(160) Morigaki, K.; Kiyosue, K.; Taguchi, T. Langmuir 2004, 20, 7729-7735.

156
(161) Holden, M. A.; Jung, S. Y.; Yang, T. L.; Castellana, E. T.; Cremer, P. S. J. Am. Chem. Soc. 2004, 126, 6512-6513.
(162) Morigaki, K.; Schonherr, H.; Frank, C. W.; Knoll, W. Langmuir 2003, 19, 6994-7002.
(163) Barenholz, Y.; Gibbes, D.; Litman, B. J.; Goll, J.; Thompson, T. E.; Carlson, F. D. Biochemistry 1977, 16, 2806-2810.
(164) Pitto, M.; Raimondo, F.; Zoia, C.; Brighina, L.; Ferrarese, C.; Masserini, M. Neurobiol. Aging 2005, 26, 833-838.
(165) Matthews, B. W. C R Biol. 2005, 328, 549-556.
(166) Mcdaniel, R. V.; Mclaughlin, A.; Winiski, A. P.; Eisenberg, M.; Mclaughlin, S. Biochemistry 1984, 23, 4618-4624.
(167) Avanti Polar Lipids, 2008, www.avantilipids.com.

157
VITA
Name: Arnaldo Joel Diaz Vazquez
Address: Department of Chemistry, 3255 TAMU, College Station, TX 77843
E-mail: [email protected]
Education: B.S., Chemistry, University of Puerto Rico - Rio Piedras, Puerto Rico,
2002