A Demographic and Economic Analysis Of the City of … Demographic and Economic Analysis Of the City...
136
A Demographic and Economic Analysis Of the City of Springfield September 2006 Prepared by: Paul N. Foster Stefanie M. Santaniello Justine Calcina Delania Barbee Kinshasa Fowlkes Regional Information Center Pioneer Valley Planning Commission 26 Central Street West Springfield, MA 01089
Transcript of A Demographic and Economic Analysis Of the City of … Demographic and Economic Analysis Of the City...

A Demographic and Economic Analysis Of the City of Springfield
September 2006
Prepared by:
Paul N. Foster Stefanie M. Santaniello
Justine Calcina Delania Barbee
Kinshasa Fowlkes
Regional Information Center Pioneer Valley Planning Commission
26 Central Street West Springfield, MA 01089
A Demographic and Economic Analysis of the City of Springfield
Pioneer Valley Planning Commission Regional Information Center 2
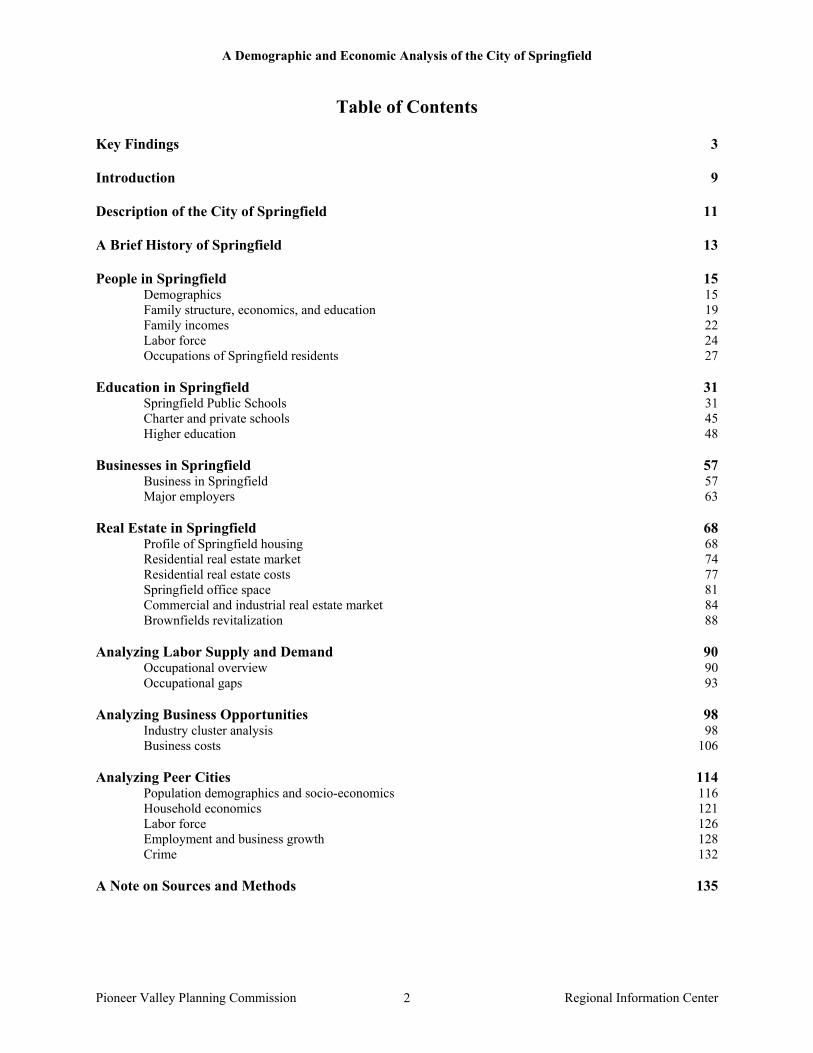
Table of Contents Key Findings
3
Introduction
9
Description of the City of Springfield
11
A Brief History of Springfield
13
People in Springfield 15Demographics 15 Family structure, economics, and education 19 Family incomes 22 Labor force 24 Occupations of Springfield residents
27
Education in Springfield 31Springfield Public Schools 31 Charter and private schools 45 Higher education
48
Businesses in Springfield 57Business in Springfield 57 Major employers
63
Real Estate in Springfield 68Profile of Springfield housing 68 Residential real estate market 74 Residential real estate costs 77 Springfield office space 81 Commercial and industrial real estate market 84 Brownfields revitalization
88
Analyzing Labor Supply and Demand 90Occupational overview 90 Occupational gaps
93
Analyzing Business Opportunities 98Industry cluster analysis 98 Business costs
106
Analyzing Peer Cities 114Population demographics and socio-economics 116 Household economics 121 Labor force 126 Employment and business growth 128 Crime
132
A Note on Sources and Methods 135

A Demographic and Economic Analysis of the City of Springfield
Pioneer Valley Planning Commission Regional Information Center 3
Key Findings The purpose of this report is to provide a detailed picture of the current demographic, social, and economic condition of the City of Springfield. It is, in essence, a baseline data report from which plans can be made and goals set. For example, we report here the trend of declining family incomes in Springfield, which then establishes a baseline from which goals for increased family income might be set. While the report’s primary purpose is to give “just the facts,” we felt the report would be incomplete without our analysis of the key findings or trends that emerge from the data. We have spent nearly two months assembling, analyzing, reviewing, and writing about the data in this report; therefore, we have a unique perspective on the important ideas the data suggests. While the following list of key findings is not exhaustive, it would be possible to write a “finding” about every chart or table in the report, these findings represent our assessment of the most important facts and trends as they relate to the future of Springfield. Furthermore, these key findings focus on an economic development perspective as that was the genesis and purpose of this report. Demographics The size of Springfield’s population has changed little since 1990, always hovering around
150,000 people, but the composition of that population is continually changing. More than a quarter of Springfield’s population is under the age of 18, making the city much younger than Massachusetts as a whole. This youthful age distribution in part reflects the shift between 1990 and 2000 to a population base that is a majority persons of color, and the Hispanic and African American populations of Springfield have very young age distributions (nearly 40 percent of the city’s Hispanic population is under 18). Compared to eight similarly sized cities, Springfield has the highest percentage of the population that is Hispanic and the highest percentage that is under 18.
Demographic transitions in the city have led to similar transitions in the schools as the
Springfield Public Schools went from 37.6 percent Hispanic in the 1994-1995 school year to 50.8 percent Hispanic in 2005-2006. By comparison, only 12.9 percent of public school students across Massachusetts are Hispanic.
With increasing racial diversity comes increasing linguistic diversity and as of 2004 less than
70 percent of people in Springfield speak English as their primary language at home, with 23.9 percent of the population speaking Spanish at home. In any given school year the percentage of Springfield’s school students who are considered limited English proficient is about double that of Massachusetts.
During 2004 and 2005, the city of Springfield had a violent crime rate nearly double that of
all eight comparison cities. While the murder rate, which is a subset of the violent crime rate, was not as out of proportion, Springfield has a significant public safety problem that is particularly severe in the area of violent crime. Furthermore, Springfield has the highest rate of motor vehicle theft among peer cities, which has consequences for the cost-of-living in the city as auto insurance rates are triple those of neighboring communities. Springfield
A Demographic and Economic Analysis of the City of Springfield
Pioneer Valley Planning Commission Regional Information Center 4
certainly has high rates of poverty and relatively high rates of unemployment, but these are generally comparable to peer cities, where as the crime rates are an order of magnitude larger than the peer cities. This suggests Springfield has a public safety problem that is out of scale with or not explained by the degree of socio-economic distress in the community.
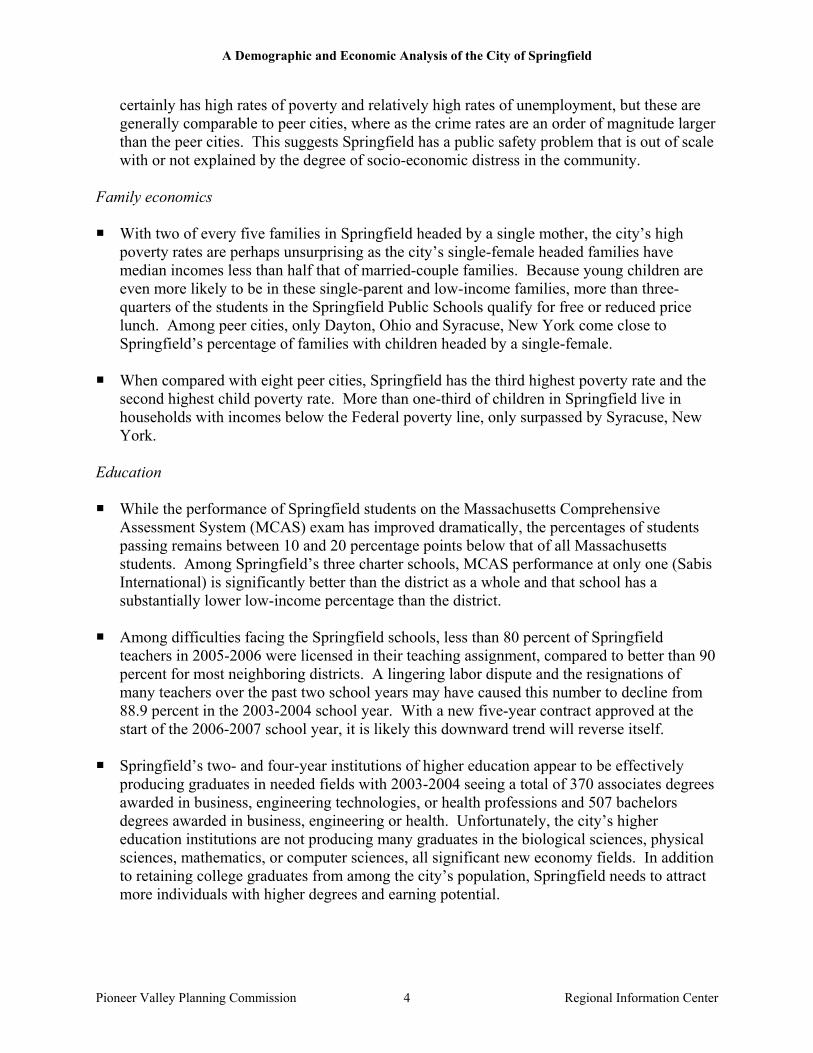
Family economics With two of every five families in Springfield headed by a single mother, the city’s high
poverty rates are perhaps unsurprising as the city’s single-female headed families have median incomes less than half that of married-couple families. Because young children are even more likely to be in these single-parent and low-income families, more than three-quarters of the students in the Springfield Public Schools qualify for free or reduced price lunch. Among peer cities, only Dayton, Ohio and Syracuse, New York come close to Springfield’s percentage of families with children headed by a single-female.
When compared with eight peer cities, Springfield has the third highest poverty rate and the
second highest child poverty rate. More than one-third of children in Springfield live in households with incomes below the Federal poverty line, only surpassed by Syracuse, New York.
Education While the performance of Springfield students on the Massachusetts Comprehensive
Assessment System (MCAS) exam has improved dramatically, the percentages of students passing remains between 10 and 20 percentage points below that of all Massachusetts students. Among Springfield’s three charter schools, MCAS performance at only one (Sabis International) is significantly better than the district as a whole and that school has a substantially lower low-income percentage than the district.
Among difficulties facing the Springfield schools, less than 80 percent of Springfield
teachers in 2005-2006 were licensed in their teaching assignment, compared to better than 90 percent for most neighboring districts. A lingering labor dispute and the resignations of many teachers over the past two school years may have caused this number to decline from 88.9 percent in the 2003-2004 school year. With a new five-year contract approved at the start of the 2006-2007 school year, it is likely this downward trend will reverse itself.
Springfield’s two- and four-year institutions of higher education appear to be effectively
producing graduates in needed fields with 2003-2004 seeing a total of 370 associates degrees awarded in business, engineering technologies, or health professions and 507 bachelors degrees awarded in business, engineering or health. Unfortunately, the city’s higher education institutions are not producing many graduates in the biological sciences, physical sciences, mathematics, or computer sciences, all significant new economy fields. In addition to retaining college graduates from among the city’s population, Springfield needs to attract more individuals with higher degrees and earning potential.

A Demographic and Economic Analysis of the City of Springfield
Pioneer Valley Planning Commission Regional Information Center 5
Workforce Springfield residents’ need for higher wage jobs that do not require a college degree is
evident in that only 17.5 percent of Springfield adults have at least a four-year college degree (compared to more than a third of Massachusetts adults). This percentage is lower than that of all peer cities except Dayton, Ohio. The diminishing number of jobs that do not require a college degree is evident in Springfield’s unemployment rate which follows the trend of Massachusetts but is consistently about two percentage points higher.
Springfield’s resident workforce is employed in comparable industries to the workforce
throughout Hampden County, but it is Springfield’s resident who are employed in the lower-wage occupations within those industries. For example, in the health care industry, residents of Springfield tend to be employed in service occupations while residents of the rest of the county tend to be employed in management or professional occupations.
Residents of Springfield are heavily concentrated in service and sales or office occupations.
Based on an assessment of national occupational projections, it would appear that Springfield residents need to develop the skills and acquire the education necessary to move into management, professional, and financial occupations in order to be well prepared for the future economy. In particular, if Springfield residents are going to benefit from the rapidly growing health care sector in the region it will be necessary for residents to be trained as health practitioners such as nurses or doctors and not simply as medical assistants or other service occupations. Office and administrative occupations are also growth areas and Springfield’s population should be prepared for these fields as well.
Over time Springfield has progressively lost higher-wage earning residents. This is
evidenced by the 3.6 percent drop, between 1990 and 2000, in the average wage and salary income of Springfield households, from $43,507 in 1990 to $41,954 in 2000 after adjusting for inflation. Between 2001 and 2005, the U.S. Census Bureau estimates a loss of more than 250 people earning more than $100,000 per year.
Business and industry As the largest and “capital” city of the Pioneer Valley region, Springfield’s importance is
indisputable as the home to more than one-quarter of the region’s jobs and more than one-fifth of the region’s industrial land.
Based on recent employment changes, the city’s growth industries appear to be health care;
educational services; arts, entertainment, and recreation; and, other services. Financial services and metal manufacturing remain substantial industries in the city and should also be supported to grow. Among the city’s 10 largest employers there are three hospitals, two colleges, one financial services firm, and two manufacturers.
Five of eight peer cities have higher average annual wages than Springfield, suggesting
another selling point for the city. Despite being located in New England with the stereotype of high business costs, Springfield represents a lower-wage location within New England,

A Demographic and Economic Analysis of the City of Springfield
Pioneer Valley Planning Commission Regional Information Center 6
with lower average annual private sector wages than cities in Alabama, Florida, New York, and Ohio.
While private sector employment in Springfield grew by only 0.4 percent between 2003 and
2004, the total number of private sector establishments grew by 5.4 percent. This establishment growth outpaced all eight cities against which Springfield was compared. Slow employment growth coupled with rapid establishment growth suggests that Springfield’s economy is continuing its shift to a small and very-small business orientation. Furthermore, the 5.4 percent increase in the number of establishments suggests vibrant entrepreneurship in the city and supporting and cultivating emerging businesses may be a source of significant employment growth in the future.
Not only are the educational services and health care industries growing in Springfield, but
they, along with the financial services industry, are major industry clusters and export industries for the city. While this does not mean goods are exported, it means that people from beyond Springfield pay for educational, health, or financial services provided in the city.
Interestingly, data on the retail trade industry in Springfield suggests that residents of
Springfield or those working in Springfield do their shopping outside the city. This may indicate that there is unmet demand for retail services within Springfield city limits.
While manufacturing as a whole does not appear to be an industry cluster in Springfield,
there is a very vibrant metal-working cluster in Springfield. The fabricated metal product manufacturing; coating, engraving, and heat-treating metal; metal-working machinery manufacturing; and, industrial machinery manufacturing industries all have significant location quotients in Springfield indicating their prominence as an export industry.
Business costs are significantly lower in Springfield than in other parts of Massachusetts with
rates for both water and electricity significantly lower than in Boston. Furthermore, the lower cost of housing in the city should be attractive to employers in other parts of New England who risk losing valuable employees as a result of high housing costs.
Residential real estate Springfield, known as the “City of Homes” for its Victorian mansions and history of small
homes for factory workers, had nearly 6,000 vacant housing units in 2004, of which more than 2,000 were vacant for unknown reasons (e.g. not for sale or rent and not for seasonal use). Affecting the marketability of Springfield housing, in an era when the dominant market model is ownership of new single-family homes, less than half the housing units in Springfield are single-family dwellings and nearly half of all housing units were built before 1939.
Positively, the cost of housing in Springfield is very low compared both to peer cities
nationally and to the generally high cost in New England. Four of the peer cities Springfield was compared to have higher percentages of renters who pay more than 30 percent of their
A Demographic and Economic Analysis of the City of Springfield
Pioneer Valley Planning Commission Regional Information Center 7
income in rent. With respect to the cost of purchasing a home, two peer metropolitan areas are more expensive than Springfield, one of them being nearby Worcester, and the price of housing within Springfield city limits is even lower than in the metropolitan area as a whole. The cost of real estate in general and housing in particular is one of Springfield’s most important assets and should be a major selling point for potential residents and businesses. Rising prices between 2003 and 2005 suggest that the low prices in Springfield are already being discovered.
The Springfield residential real estate market hit bottom in the middle 1990s with median
single-family prices at sale (in 2005 dollars) below $80,000. However, housing market pressures from eastern Massachusetts and from rapidly rising prices in neighboring communities have driven prices up since 1997, such that the median price of a single-family home in 2005 was nearly $140,000.
Commercial and industrial real estate Springfield Class A and C office space have lower vacancy rates than surrounding
communities, suggesting Springfield office space, at least in these class categories, is in higher demand, but with more than 470,000 square feet of vacant office space there is substantial space for new businesses or expansions. Furthermore, lease rates for Class C office space tend to be lower than in surrounding communities suggesting Springfield should use this lower cost to market the city to entrepreneurs interested in low-cost space for new enterprises.
The market for commercial and industrial real estate has been slow in the last year with
primarily smaller properties moving (18 properties sold in the last year with a total of 190,000 built square feet). The average size of commercial buildings that sold in the last year was only 6,500 square feet compared to an average size of 93,329 square feet for commercial buildings on the market. Despite a significant amount of property available, the city issued 107 permits in 2005 for new commercial and industrial construction suggesting healthy demand.
The city is effectively prioritizing brownfields assessment and remediation activities by
focusing on the largest parcels and those most likely to be redeveloped. While only six of the city’s 53 commercial and industrial brownfields sites have undergone any assessment or remediation activities, they account for 55 percent of all brownfields land area.
In summary, Springfield has tremendous assets in its increasingly diverse population; the low cost of real estate; local institutions of higher education; low costs for businesses (especially wages); the extensive growth in number of businesses (primarily small); and the existence and growth of industry clusters that are key to the new economy (health care, education, financial services, and precision metal-working). However, there are also obvious threats that could derail Springfield’s attempts to flourish, such as disproportionately high crime rates; low rates of educational attainment; concentration of residents in low-wage, low-skill occupations; overall low incomes and high poverty rates; numerous children growing up in low-income, single-parent

A Demographic and Economic Analysis of the City of Springfield
Pioneer Valley Planning Commission Regional Information Center 8
households; limited English proficiency; inability to retain college graduates in the city; poor educational performance; and, little population growth. Springfield’s assets, in its institutions, employers, and low costs, are assets for the entire Pioneer Valley, but the threats facing Springfield are generally confronted by the city and its residents alone. Furthermore, the region has played its part in allowing particular threats to emerge and remain unchecked in Springfield. Numerous communities throughout the Pioneer Valley benefit tremendously from their proximity to the employment centers and infrastructure based in Springfield. Property values and property tax revenues soar in suburban and rural communities as they become home to the high-wage, professional workforce that arrives in Springfield each morning and leaves each evening. Retail and service establishments spring up in previously rural communities to serve the needs of this commuting workforce, causing similar establishments in Springfield to close. In Springfield a population is left that is a majority people who serve in the region’s lowest-skill jobs, receiving low wages and left without the means of affording either the housing or transportation necessary to live elsewhere. Without doubt the challenges identified in this report have numerous and complex causes, but they are as much regional as local and if the region will continue to benefit from Springfield’s assets, the region will have to participate in addressing Springfield’s struggles.
A Demographic and Economic Analysis of the City of Springfield
Pioneer Valley Planning Commission Regional Information Center 9
Introduction When in June of 2006 we were commissioned by the City of Springfield’s Planning and Economic Development Department to craft a detailed market study of the city, the composition or breadth of the report’s audience was unclear. However, in conversations with city officials as well as representatives of MassDevelopment, who are working closely with the city, it became evident that this was not to be a market study only, in the traditional sense of examining the city’s real estate or other markets. Instead, the purpose of this report was to provide a detailed analysis of Springfield’s current state of affairs and the trends that have led to this point. This study examines what the existing secondary data says about Springfield’s condition and trajectory. The report is one input, along with others such as the Urban Land Institute review, in the ongoing process of designing strategies for Springfield’s revival. We began this project with three major components of the report in mind. First, we would provide a detailed overview of the demographic, social, and economic features of the city. Second, we would analyze labor supply and demand in the city, looking for mismatches and opportunities. Finally, we would compare Springfield to comparable cities to identify particular strengths or weaknesses. All three of these components have made their way into this final report. One challenge in writing such a report is one of scale. While Springfield is the central city of the Pioneer Valley region, it is a part of a larger region and, particularly with respect to economic development, is not an island. In identifying peer cities we were challenges by whether we were looking for similarly sized regions or simple similarly sized cities. From an economic development perspective, Springfield’s competitive strengths and weaknesses are largely shared with the region and therefore a regional view is crucial. On the other hand, Springfield is facing a particularly unique and isolating struggle at the present moment in its history and we fully understand the importance of narrowly understanding what is happening within Springfield’s city limits. Therefore, knowing the importance of regionalism to economic development, we deliberately focused this report on identifying the baseline condition of the city of Springfield as defined by the municipal boundaries. In some cases the realities of the data required us to analyze the region rather than the city, but whenever possible the data presented in this report reflects the city of Springfield alone. A note on the format and layout of this report will speed your reading. As a baseline data report, there are more than 100 graphs and tables; nevertheless, the narrative is equally crucial because it has been written carefully to summarize and analyze what is represented in graphs and tables. To make reading of the narrative easier, in each section of the report, the narrative analysis appears first and is followed by all graphs and tables relevant to that text. We have left references to particular graphs and tables out of the narrative as it is often challenging to keep turning pages from text to graph. It is our hope that the text is sufficient to be understood without repeated reference to the graphs and tables, then the visuals can be absorbed separately or examined for further details. The first half of this report presents an overview of data in a variety of areas such as demographics or businesses, while the second half of the report is meant to be more analytic. In some cases the same data is used in both parts of the report, but in different ways. The occupations of Springfield residents are reported as part of the demographics of Springfield’s population, but the occupational data is also used in the analysis of labor supply and demand.
A Demographic and Economic Analysis of the City of Springfield
Pioneer Valley Planning Commission Regional Information Center 10
Finally, the key findings section of the report preceded this introduction because we view it in some respects as a separate document. The baseline data report on the city of Springfield begins with this introduction and we have attempted to discuss the data in neutral terms, simply presenting the facts as they are suggested by the data. We have not avoided interpreting the data in terms of identifying causal relationships or trends, but throughout the bulk of this document we have avoided drawing large-scale conclusions about Springfield’s condition or direction in favor of simply reporting the reality. However, the key findings section is our attempt, having assembled this volume of data, to distill the facts and trends that we believe tell the most important and timely aspects of Springfield’s present story. Obviously the reason for having a baseline data report is for readers to draw their on conclusions; therefore, our assessment of key findings should not be thought of as definitive. It is our hope and intention that the data and analysis contained in this report will spur further analysis and, more importantly, action that improves the quality of life for all of Springfield’s residents.
A Demographic and Economic Analysis of the City of Springfield
Pioneer Valley Planning Commission Regional Information Center 11
Description of the City of Springfield
The City of Springfield sits on the banks of the Connecticut River only a few miles north of the Massachusetts and Connecticut border. The City is approximately 33.2 square miles and sits on the east-bank of the River. With about 150,000 people, Springfield’s population density is approximately 7 people per acre. Springfield’s downtown and North and South End neighborhoods sit low and flat along the banks of the River. Moving East from the River the ground rises to hills in the Liberty Heights neighborhood to the North, the Mason Square neighborhoods through the middle of the City, and the Forest Park neighborhood to the South.
Typically Springfield is divided into seventeen distinct neighborhoods. They are, as defined by the city Election Commission: Bay, Boston Road, Brightwood, East Forest Park, East Springfield, Forest Park, Indian Orchard, Liberty Heights, McKnight, Memorial Square, Metro Center, Old Hill, Pine Point, Six Corners, Sixteen Acres, South End, and Upper Hill. While the exact boundaries are disputed depending on the source considered, most residents of Springfield have a sense of the neighborhood in which they reside and the Election Commission names are commonly used throughout the city. Some neighborhoods are divided again or aggregated together based on landmarks or meaningful geography. For example, the Hollywood section of the South End is actually a housing complex and Mason Square is a central intersection where the Bay, McKnight, Old Hill, and Upper Hill neighborhoods converge.
Among significant geographical features of the city, Forest Park lies in the southwestern corner of the city, along the border with Longmeadow, and is one of the largest municipal parks in the United States. Other large municipal parks in Springfield include Blunt Park at the corner of Roosevelt and Bay streets and Five Mile Pond in the Boston Road neighborhood. Lake Massassoit sits between the Upper Hill and Sixteen Acres neighborhoods and is formed by a dammed stream that once powered the Springfield Armory’s “watershops.” In addition to these features, there are a number of smaller ponds in Springfield some of which are used for fishing or swimming. Springfield also owns the Cobble Mountain Reservoir, the city’s water supply, that is located in Blandford, Granville, and Russell.
Springfield shares borders with Longmeadow and East Longmeadow to the South, Wilbraham to the East, and Ludlow and Chicopee to the North. Agawam and West Springfield sit to the West across the river.
As of 1999, about 74.4 percent of Springfield’s total area (including water) was developed. Of the remaining undeveloped land, about 76.0 percent was forest. As with most cities, Springfield’s primary form of land use is residential, with 47.1 percent of Springfield’s area devoted to residential uses, and 31.9 percent particularly used for high density residential properties. Commercial and industrial uses occupy 16.7 percent of Springfield’s area. Urban open space and institutional land, including Springfield’s four colleges, cover about 10.8 percent of Springfield’s land.
Examining change between 1971 and 1999, there was an increase of 14.7 percent in the number of acres devoted to industrial uses. Also growing substantially were commercial uses, a 10.2 percent increase in acres between 1971 and 1999. High density and low or medium density residential use also increased by about 6 percent. Between 1971 and 1999, agricultural land in Springfield was the primary loser, with acreage devoted to agriculture declining by 23.8 percent. Natural land and undeveloped open land also lost acres, dropping by 17.8 and 15.7 percent respectively.

A Demographic and Economic Analysis of the City of Springfield
Pioneer Valley Planning Commission Regional Information Center 12
Figure 1
Land Use by Type in Springfield, 1999
Commercial6.0%
Industrial, transportation, and mining10.7%
High density residential31.9%
Low and medium density residential
15.2%
Urban open, institutional, and recreation
10.8%
Natural20.0%
Water3.6%
Agriculture0.5%
Open undeveloped land1.3%
Source: Massachusetts Geographic Information Systems. Figure 2
Change in Acreage by Land Use Type in Springfield, 1971-1999
-23.8%
-15.7%
10.2%
14.7%
6.5% 6.0%
0.2%
-17.8%
-30.0%
-25.0%
-20.0%
-15.0%
-10.0%
-5.0%
0.0%
5.0%
10.0%
15.0%
20.0%
Agriculture Openundeveloped land
Commercial Industrial,transportation,
and mining
High densityresidential
Low and mediumdensity residential
Urban open,institutional, and
recreation
Natural
Perc
ent C
hang
e in
Acr
es
Source: Massachusetts Geographic Information Systems.

A Demographic and Economic Analysis of the City of Springfield
Pioneer Valley Planning Commission Regional Information Center 13
A Brief History of Springfield Springfield was the first town west of Boston, Cambridge, and Watertown to be settled in Massachusetts. The city was established in 1636 at the juncture of the Agawam and Connecticut Rivers by English colonist William Pynchon, who at the time was the assistant treasurer of the Massachusetts Bay Colony. Land was purchased from Native Americans for the establishment of a trading post and the town was incorporated in 1641, taking the name from Pynchon’s birthplace in England. The land purchased by Pynchon covers what are now the communities of Agawam, Longmeadow, Springfield, and West Springfield. Pynchon was most notable for establishing a trading post just below the Enfield rapids in Connecticut, called Warehouse Point, where cargo was unloaded and portaged either by land or river to the north. Springfield soon became the primary distribution point for agricultural goods, furs, and meat products moving in and out of the Valley. Trade flourished, particularly with Hartford, enabling Springfield to become the commercial and political center of the lower Connecticut Valley region. In 1723, the first courthouse in Hampden County was built in Springfield, enhancing its political importance. Early industrialization in the area began in the form of small mills run by water power. Following the collapse of the fur trade, agricultural produce and livestock began to be transported to Springfield in return for manufactured and processed goods. By 1775, Springfield established a paper mill, pottery manufactory, and rum distillery. In 1750, the nation’s first canal was built in Holyoke to circumvent the falls there. Canal and water power would be just one integral key in the success of manufacturing throughout the region. In the 1770s, George Washington selected Springfield as the site for the United States Armory; its location was far from the coast and enemy ships, and provided access to major east-west roads. The Armory produced weapons for the Armed Forces throughout its history. In 1787 poor farmers attempted to seize the Armory and its weapons in order to prevent the Commonwealth of Massachusetts from seizing their lands in what became known as Shays’ Rebellion. During the Civil War, the loss of Harper’s Ferry to Confederate forces resulted in Springfield serving as the main arms supplier for the Union Army which primarily used the “Springfield Rifle.” The establishment of the national arsenal as a major depot for weapons and ammunition began Springfield’s history as a center of metal manufacturing. Innovative weapons manufacturing and technological advances such as the invention of the gun lathe led to other types of metal manufacturing in the city, among these the bicycle, motorcycle, and for a time the automobile. The first ever gasoline powered car, the Duryea Motor Wagon, was produced in Springfield and appeared on the streets of Springfield in 1893. In 1852 the handgun maker Smith and Wesson was founded in Springfield and remains headquartered there. In 1901, the Indian Manufacturing Company produced America’s first brand of motorcycles in Springfield. The new companies, many of them started by former Armory workers, attracted skilled workers to the city. Workers came to Springfield from the surrounding rural communities and from oversees. The first wave of Irish immigrants came in 1839, followed by the French Canadians who were attracted to work in textile mills. During the heights of the industrial period, Springfield’s population swelled from 15,200 persons in 1870 to 73,484 persons in 1905. Manufacturing in Springfield and the surrounding region was further strengthened by the arrival of the railroad. The railroad in Springfield began as part of the line between Boston and Albany, opening for business between Worcester and Springfield in 1839. Prior to the coming of
A Demographic and Economic Analysis of the City of Springfield
Pioneer Valley Planning Commission Regional Information Center 14
the railroad, freight was moved up and down the Connecticut River on barges navigating from Old Saybrook, Connecticut to as far north as Wells River, Vermont. By 1845 railroads from Springfield expanded to the north, south, and west. With the arrival of the steamship, competition for passengers and freight increased significantly between Springfield and Hartford. Springfield’s role as the commercial center of manufacturing in the Connecticut River Valley enabled the city to develop strong financial institutions, for which the city is still known. According to some, it was the strength of the city’s financial institutions that enabled the growth of Springfield’s industry and prosperity. In 1849 the Springfield Fire and Marine Insurance Company was founded, and in 1851 the Massachusetts Mutual Life Insurance Company was founded, both organized by citizens of Springfield. The city was also unique in the early establishment of a Board of Trade. By 1905, the city was home to eight national banks, two trust companies, and three savings banks. To this day the Massachusetts Mutual Life Insurance Company employs nearly 4,000 people at its Springfield headquarters and is a Fortune 100 company with more than 13 million clients and $395 billion in assets under management. Unlike other cities where workers were housed in cramped, tenement style houses, most workers in Springfield lived in single-family homes. By the 1870’s the streetcar was established in Springfield and the sixty-eight miles of line enabled the development of Springfield’s neighborhoods and outer suburbs, and the city had one of the highest rates of home ownership in the nation. Springfield was given the nickname the City of Homes in the late 19th Century as a result of the construction of numerous Victorian mansions as well as the multitude of single-family homes for manufacturing workers. During the Depression and World War II, little construction took place and marked the beginning of a period of decline. Manufacturing began to shift elsewhere; factories closed, and workers were laid-off. The closure of the Armory in 1968 was a blow to the city’s economic and manufacturing base. Many of these workers retired to more rural areas, and the abundant housing became a destination for poor African American migrants from the South. Eventually, some of the old neighborhoods began to become blighted. Like many other cities at the time, Springfield embarked on a period of Urban Renewal, financed greatly by the federal government. By the end of the 1960’s the Springfield Redevelopment Authority tore down 2,100 housing units, closed 355 businesses and relocated another 500 businesses, to the dismay of many city residents. The new development that emerged in place of the old immigrant neighborhoods was large in scale, facilitated by an increased dependence on the automobile. At the same time Interstate Highways 91 and 291 were finished in 1970, adding to the large-scale changes taking place. Today, Springfield is still challenged by manufacturing’s gradual decline in the City. Nevertheless, its fundamental assets remain; among others, its strategic location in the Knowledge Corridor of what is now known as the Pioneer Valley. In addition, the Springfield Quadrangle is a visual and decorative arts showpiece of New England. One of Springfield’s most notable assets is that it was the birthplace of basketball. In 1891 James Naismith invented the sport at the Springfield YMCA in Mason Square as an indoor sport for the winter months. In 1968 the city became home to the Basketball Hall of Fame, with a brand-new Basketball Hall of Fame opened in 2002. In 2006 the state legislature and Governor made basketball the official state support in honor of its invention in Springfield.1
1 Sources: www.cityofspringfieldmass.com, www.wikipedia.com, www.massmutual.com, all downloaded 8/7/2006; Springfield- Massachusetts Pioneer Valley New England. Massachusetts Department of Commerce and Development. Springfield Central, publishers 1985; O’Connell, James C. Inside Guide to Springfield and the Pioneer Valley. Western Mass Publishers. Springfield, MA, 1986; Gardner, Eugene C. et al. Springfield Present and Prospective. Pond & Campbell Publishers. Springfield, MA. 1905; and, Historic and Archaeological Resources of the Pioneer Valley. Massachusetts Historical Commission, Office of the Massachusetts Secretary of State. 1984.

A Demographic and Economic Analysis of the City of Springfield
Pioneer Valley Planning Commission Regional Information Center 15
People in Springfield Demographics
Between 2000 and 2004 Springfield’s pattern of little population change, evident in the 1990s, continued. Not only is the size of Springfield’s population relatively stable, Springfield’s residents are also relatively intransient. In all five years from 2000 to 2004, the percentage of Springfield’s population residing in the same as during the current year as in the prior year never fell below 80 percent. Furthermore, in 2004 96 of every 100 Springfield residents were living in Massachusetts in 2003.
Over one-fourth of Springfield’s population is under the age of 18, reflecting the reality that the city has a much younger age distribution than Massachusetts as a whole. For example, nearly nine percent of Springfield’s population in 2004 were between the age of 10 and 14, compared to less than seven percent of Massachusetts’ population.
In 2004, Springfield’s population was slightly less than 45 percent white, with a bit more than 20 percent of residents identifying as African American and a little more than 30 percent identifying as Hispanic or Latino. While the Asian population of Springfield is small in percentage terms, generally between two and three percent, the Vietnamese community in Springfield is well-established in several neighborhoods.
Hispanics and blacks have a significantly higher percentage of population under 18 years of age compared to whites. In addition, the percentage of whites aged 65 years and older is over two times that of blacks and almost four times when compared to Hispanics. The aging of Springfield’s white population and the large number of black and Hispanic young people in the city suggest that black and Hispanic young people of Springfield will be the future adult residents and leaders of the city.
While about two-thirds of Springfield’s population primarily speaks English at home, it is an important reality that 23.9 percent of Springfield’s population speaks Spanish at home and another 7.5 percent speak another language at home.

A Demographic and Economic Analysis of the City of Springfield
Pioneer Valley Planning Commission Regional Information Center 16
Figure 3
Springfield's Total Population
0
20,000
40,000
60,000
80,000
100,000
120,000
140,000
160,000
2000 2001 2002 2003 2004
Year
Popu
latio
n N
umbe
r
Source: U.S. Census Bureau, American Community Survey.
Figure 4
Percent of Population by Five-Year Age Groups, 2004
0% 1% 2% 3% 4% 5% 6% 7% 8% 9% 10%
Under 5
5 to 9
10 to 14
15 to 19
20 to 24
25 to 29
30 to 34
35 to 39
40 to 44
45 to 49
50 to 54
55 to 59
60 to 64
65 to 69
70 to 74
75 to 79
80 to 84
85 and over
Percent of Population
SpringfieldMassachusetts
Source: U.S. Census Bureau, American Community Survey.

A Demographic and Economic Analysis of the City of Springfield
Pioneer Valley Planning Commission Regional Information Center 17
Figure 5
Racial Composition of the City of Springfield
0%
5%
10%
15%
20%
25%
30%
35%
40%
45%
50%
2000 2001 2002 2003 2004
Source: U.S. Census Bureau, American Community Survey.
WhiteBlackHispanic or LatinoAsianOther
Figure 6
Age Distributions of the Springfield Population by Race, 2004
13.8%
25.9%29.6%3.3%
5.9%
8.1%
8.3%
11.2%
11.1%29.3%
27.9%
30.0%
27.7%
20.5%
17.0%17.6%
8.7%4.2%
0%
10%
20%
30%
40%
50%
60%
70%
80%
90%
100%
White Black Hispanic
65 years and older
45 to 64 years
25 to 44 years
18 to 24 years
15 to 17 years
14 years and younger
Source: U.S. Census Bureau, American Community Survey.

A Demographic and Economic Analysis of the City of Springfield
Pioneer Valley Planning Commission Regional Information Center 18
Figure 7
Primary Languages Spoken in the Home in Springfield, 2004
English68.6%
Spanish or Spanish Creole23.9%
French (Patois, Cajun, or Creole)1.8%
Vietnamese1.9%
Other (less than 1 percent)3.8%
Source: U.S. Census Bureau, American Community Survey.
A Demographic and Economic Analysis of the City of Springfield
Pioneer Valley Planning Commission Regional Information Center 19
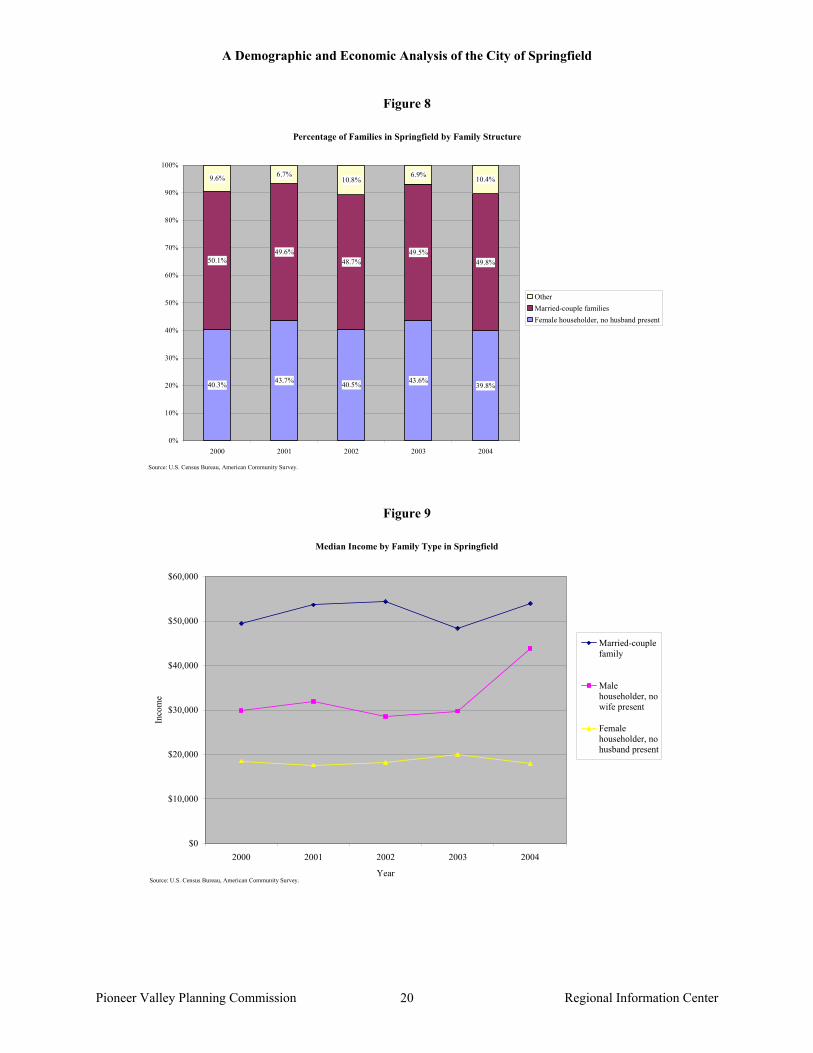
Family Structure, Economics, and Education Married couple-families and households headed by single-females are the most common
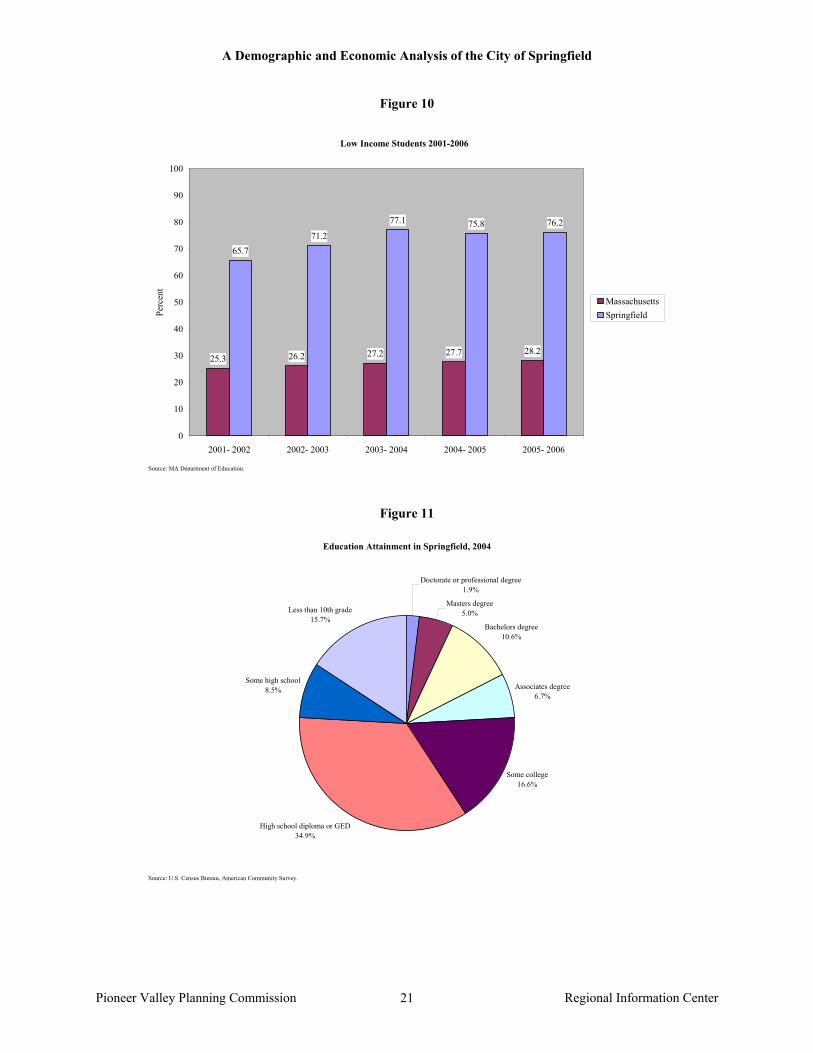
family structures in Springfield, with about 49.8 percent of families being married couples and 39.8 percent of families headed by a single female. That two of every five families in Springfield are headed by a single female is troubling in light of the evidence that children in that circumstance often face additional challenges. This point is amplified by the reality that the median family income of families headed by a single female remained below $20,000 for every year from 2000 to 2004. In contrast, the median family income of married couple families is generally just below or above $50,000 per year. Statistics of Springfield’s school children further amplify the difficult economic conditions facing Springfield families. While across the state the average percentage of public school students considered low-income has hovered around one quarter, more than three-quarters of Springfield students are considered low-income.
The majority of individuals in Springfield over the age of 25 only have a high school education. Perhaps most troubling, nearly one-quarter of Springfield’s adult population in 2004 had not completed high school. Furthermore, 15.7 percent of Springfield’s adult population has a less than 10th grade education. Of the more than a third of the city’s adult population that have participated in any higher education, less than half have a bachelors degree. In Springfield, in 2004, only 17.5 percent of adults had completed a bachelors degree, compared to more than a third of adults across Massachusetts.
White males and females seem stable in there education patterns. They have one of the largest populations with bachelors and higher degrees. White males in particular have the largest population with such degrees. Black males and females in Springfield, although their education pattern is more variable, also have a significant percentage of their population with bachelor’s degrees or higher. Black males and females are comparable to white females in their obtainment of these degrees.
It is the Hispanic population, however, that is behind the white and black population in higher education. While bachelor’s degrees have been increasing among Hispanic males, so has the number of Hispanic males without a high school diploma, which sharply increased by 11.9 percent from 2003 to 2004. There has not been much change in the percentage of Hispanics, male and female, who receive graduate degrees. On average, 1.5 percent of Hispanic males and 1.9 percent of Hispanic females obtain graduate degrees. This is much less than whites and blacks. Because Springfield’s Hispanic population is the second largest and fastest growing population, it is imperative that the city improve educational opportunities and outcomes for Hispanic young people. Without such an effort the percentage of Springfield’s total population with college degrees will fall as the demographics of the population change.
A Demographic and Economic Analysis of the City of Springfield
Pioneer Valley Planning Commission Regional Information Center 20
Figure 8
Percentage of Families in Springfield by Family Structure
40.3% 43.7% 40.5% 43.6%39.8%
50.1%49.6%
48.7%49.5%
49.8%
9.6% 6.7%10.8%
6.9% 10.4%
0%
10%
20%
30%
40%
50%
60%
70%
80%
90%
100%
2000 2001 2002 2003 2004
OtherMarried-couple familiesFemale householder, no husband present
Source: U.S. Census Bureau, American Community Survey.
Figure 9
Median Income by Family Type in Springfield
$0
$10,000
$20,000
$30,000
$40,000
$50,000
$60,000
2000 2001 2002 2003 2004
Year
Inco
me
Married-couplefamily
Malehouseholder, nowife present
Femalehouseholder, nohusband present
Source: U.S. Census Bureau, American Community Survey.
A Demographic and Economic Analysis of the City of Springfield
Pioneer Valley Planning Commission Regional Information Center 21
Figure 10
Low Income Students 2001-2006
25.3 26.2 27.2 27.7 28.2
65.771.2
77.1 75.8 76.2
0
10
20
30
40
50
60
70
80
90
100
2001- 2002 2002- 2003 2003- 2004 2004- 2005 2005- 2006
Perc
ent
MassachusettsSpringfield
Source: MA Department of Education.
Figure 11
Education Attainment in Springfield, 2004
Doctorate or professional degree1.9%
Masters degree5.0%
Bachelors degree10.6%
Associates degree6.7%
Some college16.6%
High school diploma or GED34.9%
Some high school8.5%
Less than 10th grade15.7%
Source: U.S. Census Bureau, American Community Survey.
A Demographic and Economic Analysis of the City of Springfield
Pioneer Valley Planning Commission Regional Information Center 22
Family Incomes To understand Springfield’s recent history, and the extent of poverty, it is necessary to examine the longer-term trend with respect to family income. Two socio-historical events appear to have conspired to lower the income of Springfield’s population. First, when the Springfield Armory closed in the 1960s, it left a significant employment vacuum in the city and heralded the beginning of a decline in the number of manufacturing jobs in the city and region (at least manufacturing jobs with large-scale employers). This change was significant because manufacturing had been one of the key employment opportunities that enabled people to reach the middle class even with a limited educational background. Second, with an increasing pace of housing development in suburban and previously rural communities outside Springfield, many of Springfield’s most financially secure families moved out of the city for new houses, more land, newer infrastructure, or any of a number of other reasons. This out-migration from Springfield left the city occupied by those most negatively impacted by the departure of manufacturing jobs. Furthermore, Springfield, like Holyoke to the North, continued to draw new immigrants with low incomes and limited skills. While such immigrants to the city previously found manufacturing jobs, such positions were in shorter supply. The impact of the Armory’s closure, the slow reduction in the number of manufacturing jobs, and the out-migration of the city’s wealthiest families is evident in an analysis of Springfield’s median family income between 1969 and 1999. After adjusting all dollar figures for inflation (into 1999 dollars), we find that Springfield’s median family income fell from $44,472 in 1969 to $36,285 in 1999 (a decline of 18.4 percent). This trend of declining real family incomes would not be nearly as problematic if that was the case everywhere; however, both the state of Massachusetts and the Springfield metropolitan area experienced increases in median family income during this period. For example, the median family income in Massachusetts increased by 23.0 percent during this time. While the Springfield metropolitan area’s median family income increased by only 6.5 percent during this period, the increase for the communities around Springfield would be much higher because the metropolitan area number is brought lower by Springfield which accounts for a quarter of the area’s population. Even before 1969, as a working class city dominated by manufacturing, Springfield’s family incomes were lower than those in Massachusetts as a whole, but the gap was not nearly so wide. In 1969, the median family income in Springfield was 88.7 percent of the median family income in Massachusetts. By 1999, the median family in Springfield had an income that was only 58.8 percent of that of the median family in Massachusetts. To understand the financial challenges facing Springfield’s families, and by extension the city as a whole, imagine a typical family purchasing necessary goods and services with an annual income of $36,285 compared to neighbors in nearby communities having more than $50,000 at their disposal for the same necessities.

A Demographic and Economic Analysis of the City of Springfield
Pioneer Valley Planning Commission Regional Information Center 23
Figure 12
Median Family Income in Constant 1999 Dollars, 1969-1999
$0
$10,000
$20,000
$30,000
$40,000
$50,000
$60,000
$70,000
1969 1979 1989 1999
Med
ian
Fam
ily In
com
e (1
999
$)
Massachusetts Springfield Metropolitan Area City of Springfield
Source: U.S. Census Bureau, 2000, 1990, 1980, and 1970 Census.
Figure 13
Springfield Median Family Income as a Percentage of Massachusetts Median Family Income, 1969-1999
0%
10%
20%
30%
40%
50%
60%
70%
80%
90%
100%
1969 1979 1989 1999
Source: U.S. Census Bureau, 2000, 1990, 1980, and 1970 Census.
A Demographic and Economic Analysis of the City of Springfield
Pioneer Valley Planning Commission Regional Information Center 24
Labor Force
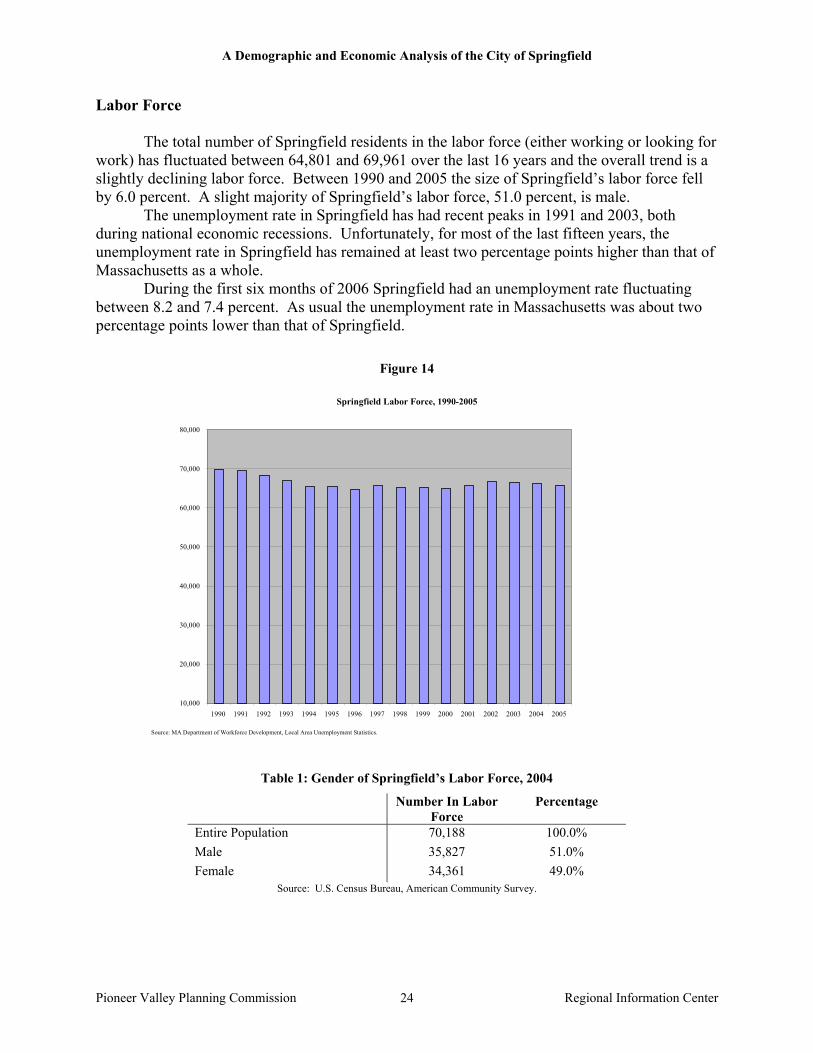
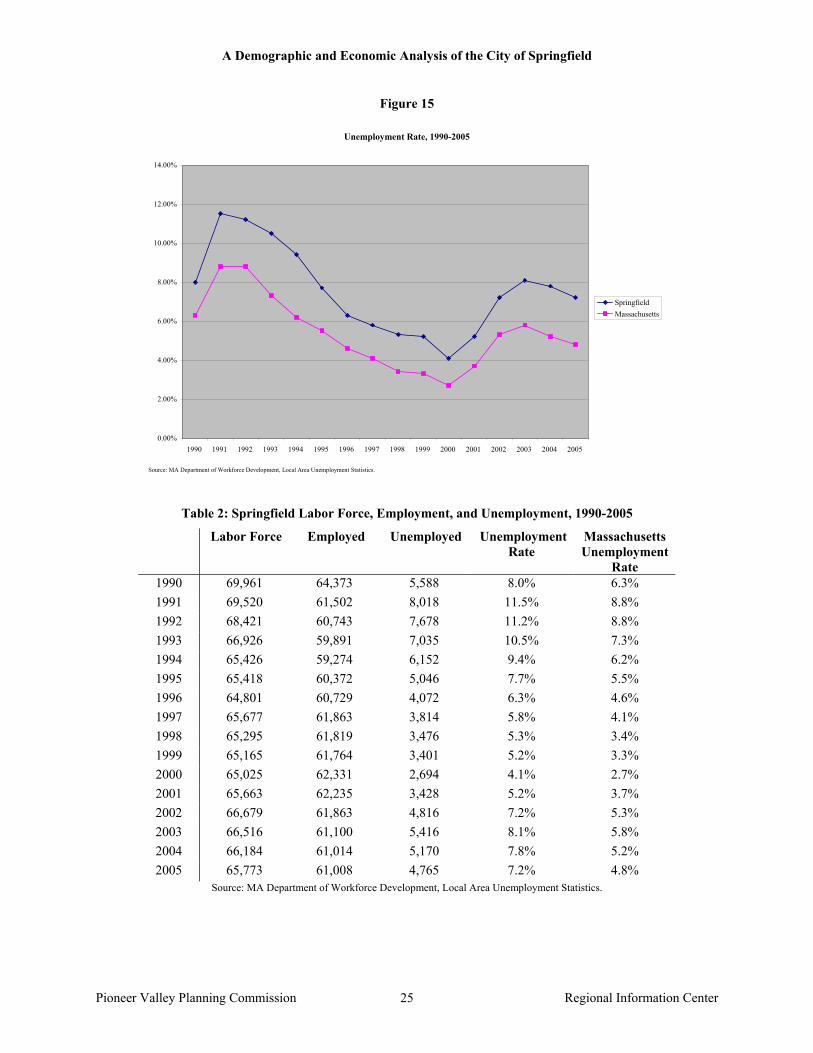
The total number of Springfield residents in the labor force (either working or looking for work) has fluctuated between 64,801 and 69,961 over the last 16 years and the overall trend is a slightly declining labor force. Between 1990 and 2005 the size of Springfield’s labor force fell by 6.0 percent. A slight majority of Springfield’s labor force, 51.0 percent, is male. The unemployment rate in Springfield has had recent peaks in 1991 and 2003, both during national economic recessions. Unfortunately, for most of the last fifteen years, the unemployment rate in Springfield has remained at least two percentage points higher than that of Massachusetts as a whole. During the first six months of 2006 Springfield had an unemployment rate fluctuating between 8.2 and 7.4 percent. As usual the unemployment rate in Massachusetts was about two percentage points lower than that of Springfield.
Figure 14
Springfield Labor Force, 1990-2005
10,000
20,000
30,000
40,000
50,000
60,000
70,000
80,000
1990 1991 1992 1993 1994 1995 1996 1997 1998 1999 2000 2001 2002 2003 2004 2005
Source: MA Department of Workforce Development, Local Area Unemployment Statistics.
Table 1: Gender of Springfield’s Labor Force, 2004
Number In Labor Force
Percentage
Entire Population 70,188 100.0% Male 35,827 51.0% Female 34,361 49.0%
Source: U.S. Census Bureau, American Community Survey.
A Demographic and Economic Analysis of the City of Springfield
Pioneer Valley Planning Commission Regional Information Center 25
Figure 15
Unemployment Rate, 1990-2005
0.00%
2.00%
4.00%
6.00%
8.00%
10.00%
12.00%
14.00%
1990 1991 1992 1993 1994 1995 1996 1997 1998 1999 2000 2001 2002 2003 2004 2005
SpringfieldMassachusetts
Source: MA Department of Workforce Development, Local Area Unemployment Statistics.
Table 2: Springfield Labor Force, Employment, and Unemployment, 1990-2005
Labor Force Employed Unemployed Unemployment Rate
Massachusetts Unemployment
Rate 1990 69,961 64,373 5,588 8.0% 6.3% 1991 69,520 61,502 8,018 11.5% 8.8% 1992 68,421 60,743 7,678 11.2% 8.8% 1993 66,926 59,891 7,035 10.5% 7.3% 1994 65,426 59,274 6,152 9.4% 6.2% 1995 65,418 60,372 5,046 7.7% 5.5% 1996 64,801 60,729 4,072 6.3% 4.6% 1997 65,677 61,863 3,814 5.8% 4.1% 1998 65,295 61,819 3,476 5.3% 3.4% 1999 65,165 61,764 3,401 5.2% 3.3% 2000 65,025 62,331 2,694 4.1% 2.7% 2001 65,663 62,235 3,428 5.2% 3.7% 2002 66,679 61,863 4,816 7.2% 5.3% 2003 66,516 61,100 5,416 8.1% 5.8% 2004 66,184 61,014 5,170 7.8% 5.2% 2005 65,773 61,008 4,765 7.2% 4.8%
Source: MA Department of Workforce Development, Local Area Unemployment Statistics.

A Demographic and Economic Analysis of the City of Springfield
Pioneer Valley Planning Commission Regional Information Center 26
Table 3: Springfield Monthly Unemployment Rates, 2006
Month Labor Force Employed Unemployed Unemployment
Rate
Massachusetts Unemployment
Rate
Jan 06 65,504 60,172 5,332 8.1% 5.3% Feb 06 65,695 60,351 5,344 8.1% 5.5% Mar 06 65,765 60,389 5,376 8.2% 5.4% Apr 06 65,071 60,283 4,788 7.4% 4.7% May 06 65,598 60,710 4,888 7.5% 4.7% Jun 06 66,750 61,601 5,149 7.7% 5.1%
Average 65,730 60,584 5,146 7.8% 5.1% Source: MA Department of Workforce Development, Local Area Unemployment Statistics.
A Demographic and Economic Analysis of the City of Springfield
Pioneer Valley Planning Commission Regional Information Center 27
Occupations of Springfield Residents
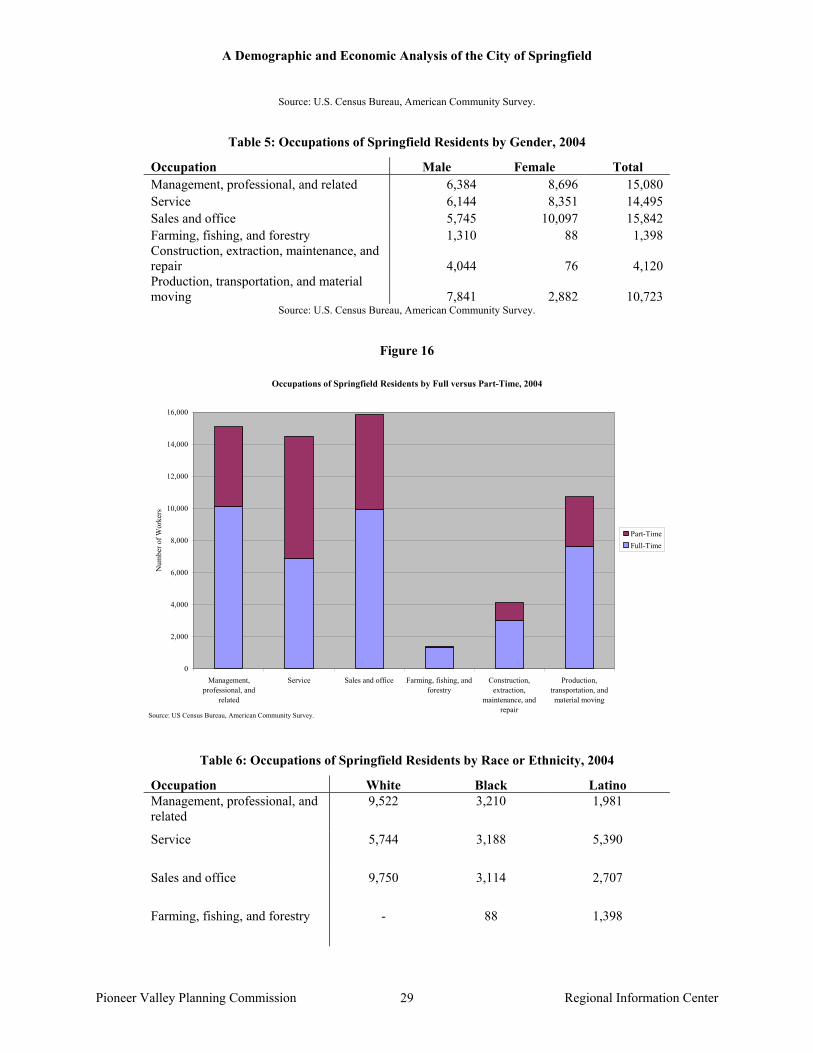
Over a quarter of the Springfield’s working population are employed in sales and office related occupations. The majority of these deal with office and administrative support. The next largest category, which makes up nearly another quarter of total workers from Springfield, are management, professional, and other related fields. Under this field, most deal with professional and related occupations, such as computers and mathematics, architecture and engineering, community and social services, law, and life, physical, and social sciences. The third largest occupational area for Springfield residents is service. Most service workers deal with healthcare support as home health aides or nurses. The three largest occupational fields of Springfield residents are also the three largest fields for all residents of Hampden County. However, 31.2 percent of Hampden County workers are in management, professional, and related fields, compared to only 24.5 percent of Springfield workers. The percentage of those in the sales and office field in Hampden County is nearly equal to that in Springfield. Among Hampden County workers employed in service occupations, the dominant occupation is food preparation and serving, unlike Springfield where the dominant service occupations are in health care. Among Springfield workers, females dominate the three largest occupational areas already discussed while men are predominant in production, transportation, & material moving and construction, extraction, & maintenance occupations. More of Springfield’s women workers are employed in sales and office occupations than any other category, while more men are employed in production, transportation, and material moving occupations than other fields. Approximately, 57.6 percent of those who work in service occupations work part-time. This is the only occupational group where those working part-time exceed those working full-time. Springfield residents work full-time at about 63.0 percent of jobs. Jobs that tend to require more experience or training are most likely to be full-time. For example, 89.1 percent of legal occupations and 77.3 percent of management occupations are full-time.
Occupations for which a majority of Springfield workers are male tend to have more full-time than part-time employment. Consequently, male workers from Springfield account for 57.9 percent of Springfield residents employed full-time. While females are a majority of those working in management, professional, and related fields, male workers are more than half the full-time workers in the occupation.
Whites dominate the labor force, especially in sales and office and management, professional, and related occupations. A plurality of Springfield’s Hispanic workers work in a service occupation. Many black workers are in management, professional and related industry occupations; however, an almost equal number of black workers are found in service occupations.
In Springfield, as is also true in Hampden County as a whole, most residents employed in a management, professional, or related occupation or in a service occupation are working for employers in the educational services or health care and social assistance industries. Residents in sales and office occupations are most heavily employed by the retail trade industry, unlike Hampden County where many workers are employed in the wholesale trade industry. Workers in construction, extraction, maintenance and repair occupations are overwhelming, and unsurprisingly, employed by the construction industry, while those workers in production, transportation, and material moving occupations are employed in manufacturing.

A Demographic and Economic Analysis of the City of Springfield
Pioneer Valley Planning Commission Regional Information Center 28
While Hampden County and Springfield have similar distributions of workers employed using particular occupations in particular industries, Springfield tends to have more workers serving in lower-wage occupations than is true for Hampden County as a whole. For example, while both areas have a substantial number of residents employed in the educational services and health care and social assistance industries, Hampden County has a larger share of workers in these industries who are in management, professional, and related occupations, while Springfield’s workers in these industries tend to be more heavily concentrated in service occupations. This suggests, consistent with lower levels of overall educational attainment, that Springfield’s residents are serving in the lower-level occupational positions in the education and health care industries that are key to the regional economy.
Table 4: Occupations of Springfield Residents Relative to Hampden County Residents, 2004 An index greater than 1.0 indicates that an occupation is more prevalent among Springfield residents than among Hampden County residents overall; an index below 1.0 indicates an occupation is less prevalent among Springfield residents than among residents of Hampden County overall.
Hampden
County Springfield Concentration Index
Management, professional, and related 31.22% 24.46% 0.783 Management, business, and financial 10.68% 6.75% 0.632
Management 7.00% 4.32% 0.618 Business and financial operations 3.68% 2.43% 0.659
Professional and related 20.54% 17.71% 0.862 Computer and mathematical 1.41% 1.54% 1.095 Architecture and engineering 1.77% 1.55% 0.875 Life, physical, and social science 0.86% 0.84% 0.986 Community and social services 1.86% 2.26% 1.211 Legal 1.09% 1.01% 0.929 Education, training, and library 6.74% 5.55% 0.823 Arts, design, entertainment, sports,
and media 1.66% 1.39% 0.833 Healthcare practitioner and technical 5.15% 3.57% 0.693
Service 18.70% 23.51% 1.257 Healthcare support 3.50% 6.11% 1.745 Protective service 2.58% 2.85% 1.108 Food preparation and serving related 5.66% 5.50% 0.973 Building and grounds cleaning and
maintenance 3.54% 3.45% 0.976 Personal care and service 3.43% 5.59% 1.629
Sales and office 25.60% 25.69% 1.004 Sales and related 11.26% 11.04% 0.981 Office and administrative support 14.34% 14.65% 1.022
Farming, fishing, and forestry 0.82% 2.27% 2.755 Agricultural workers including
supervisors 0.82% 2.27% 2.755 Construction, extraction, maintenance, and repair 8.02% 6.68% 0.833
Construction and extraction 4.08% 3.52% 0.862 Installation, maintenance, and repair 3.94% 3.16% 0.803
Production, transportation, and material moving 15.63% 17.39% 1.113
Production 9.80% 11.97% 1.221 Transportation and material moving 5.83% 5.42% 0.931
A Demographic and Economic Analysis of the City of Springfield
Pioneer Valley Planning Commission Regional Information Center 29
Source: U.S. Census Bureau, American Community Survey.
Table 5: Occupations of Springfield Residents by Gender, 2004
Occupation Male Female Total Management, professional, and related 6,384 8,696 15,080 Service 6,144 8,351 14,495 Sales and office 5,745 10,097 15,842 Farming, fishing, and forestry 1,310 88 1,398 Construction, extraction, maintenance, and repair 4,044 76 4,120 Production, transportation, and material moving 7,841 2,882 10,723
Source: U.S. Census Bureau, American Community Survey.
Figure 16
Occupations of Springfield Residents by Full versus Part-Time, 2004
0
2,000
4,000
6,000
8,000
10,000
12,000
14,000
16,000
Management,professional, and
related
Service Sales and office Farming, fishing, andforestry
Construction,extraction,
maintenance, andrepair
Production,transportation, andmaterial moving
Num
ber o
f Wor
kers
Part-TimeFull-Time
Source: US Census Bureau, American Community Survey.
Table 6: Occupations of Springfield Residents by Race or Ethnicity, 2004
Occupation White Black Latino Management, professional, and related
9,522 3,210 1,981
Service 5,744 3,188 5,390
Sales and office 9,750 3,114 2,707
Farming, fishing, and forestry - 88 1,398

A Demographic and Economic Analysis of the City of Springfield
Pioneer Valley Planning Commission Regional Information Center 30
Occupation White Black Latino Construction, extraction, maintenance, and repair
2,899 869 294
Production, transportation, and material moving
4,839 2,104 2,477
Total 32,754 12,573 14,247
Source: U.S. Census Bureau, American Community Survey.
Table 7: Occupations of Employed Springfield Residents by Industry, 2004
Industry Total
Manage., Profess.,
and Related
Service Sales and Office
Fishing, Farming,
and Forestry
Const., Extract., Maintain.
and Repair
Prod., Trans.,
and Material Moving
Agriculture, forestry, fishing and hunting, and mining 1,454 56 0 0 1,398 0 0 Construction 2,531 93 139 57 0 2,242 0 Manufacturing 8,355 1,040 142 696 0 159 6,318 Wholesale trade 2,254 229 0 1,288 0 296 441 Retail trade 6,179 408 329 4,680 0 248 514 Transportation and warehousing, and utilities 3,747 792 56 1,000 0 318 1,581 Information 1,209 335 0 423 0 451 0 Finance and insurance, and real estate and rental and leasing 3,960 1,580 61 2,106 0 0 213 Professional, scientific, and management, and administrative and waste management services 4,284 1,624 901 1,110 0 0 649 Educational services, and health care and social assistance 15,725 6,763 6,444 2,006 0 0 512 Arts, entertainment, and recreation, and accommodation and food services 5,415 570 3,417 1,296 0 0 132 Other services, except public administration 3,366 428 1,553 915 0 284 186 Public administration 3,179 1,162 1,453 265 0 122 177 Total 61,658 15,080 14,495 15,842 1,398 4,120 10,723
Source: U.S. Census Bureau, American Community Survey.

A Demographic and Economic Analysis of the City of Springfield
Pioneer Valley Planning Commission Regional Information Center 31
Education in Springfield Springfield Public Schools Enrollment
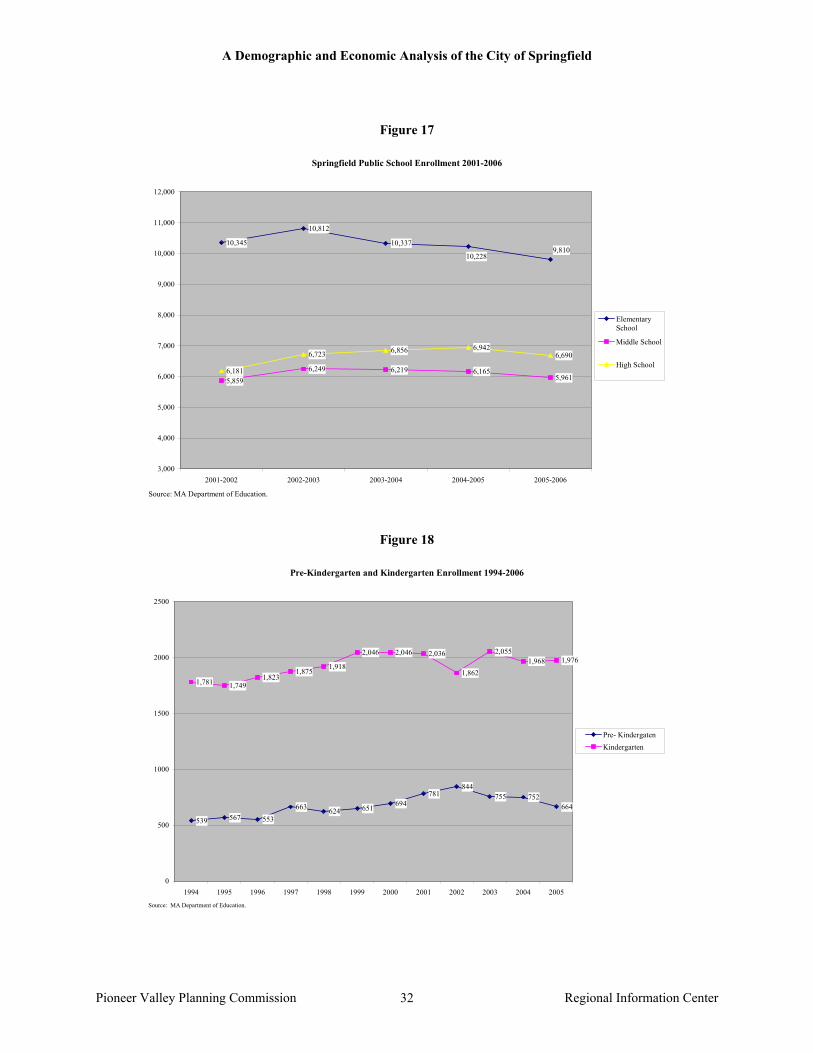
According to the Massachusetts Department of Education, 25,311 students were enrolled in the Springfield Public Schools during the 2005-2006 academic year. The 43 Springfield public schools operated by the district include 32 elementary schools, six middle schools, four secondary schools, and one school that spans both middle school and high school grades. In addition, the district operates four alternative schools and an adult general equivalency degree program, and provides funds and transportation to three charter schools operated independently.
The enrollment of Springfield Public Schools has remained relatively steady over the past 12 years. Elementary school enrollment has fluctuated slightly but has generally hovered around 10,199. Middle and high school enrollments have also remained steady, generally staying close to 5,600 and 6,300 respectively. The lack of enrollment growth can be seen as a reflection of Springfield’s stagnant population growth rate over the same period of time.
In the area of kindergarten and pre-kindergarten education, the number of children enrolled in kindergarten was at 1,976 in 2005, reflecting an eight percent increase in five years time. Although the overall enrollment in pre-kindergarten programs has risen since 1994, a 23 percent decline in enrollment can be seen from 2001 to 2005, despite the increased demand for accessible pre-kindergarten programs. This suggests either a decrease in the number of program slots available for children or an overall decrease in the number of pre-kindergarten-age children in the city and it is likely the former.
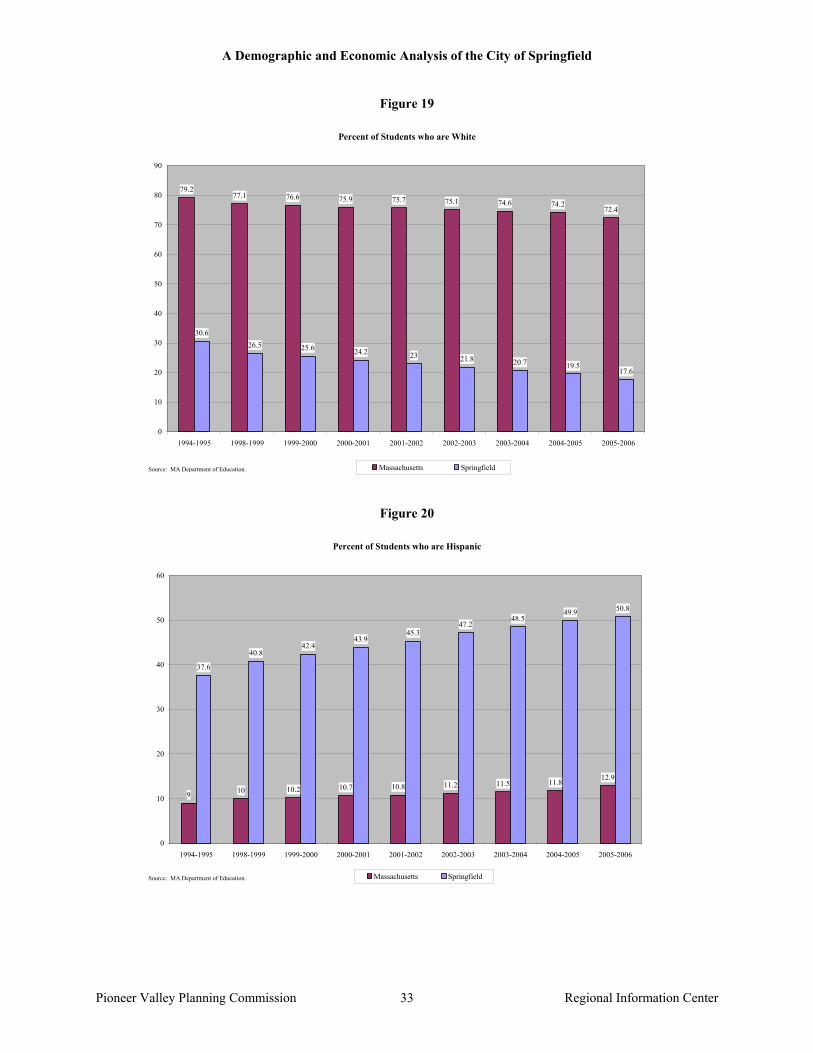
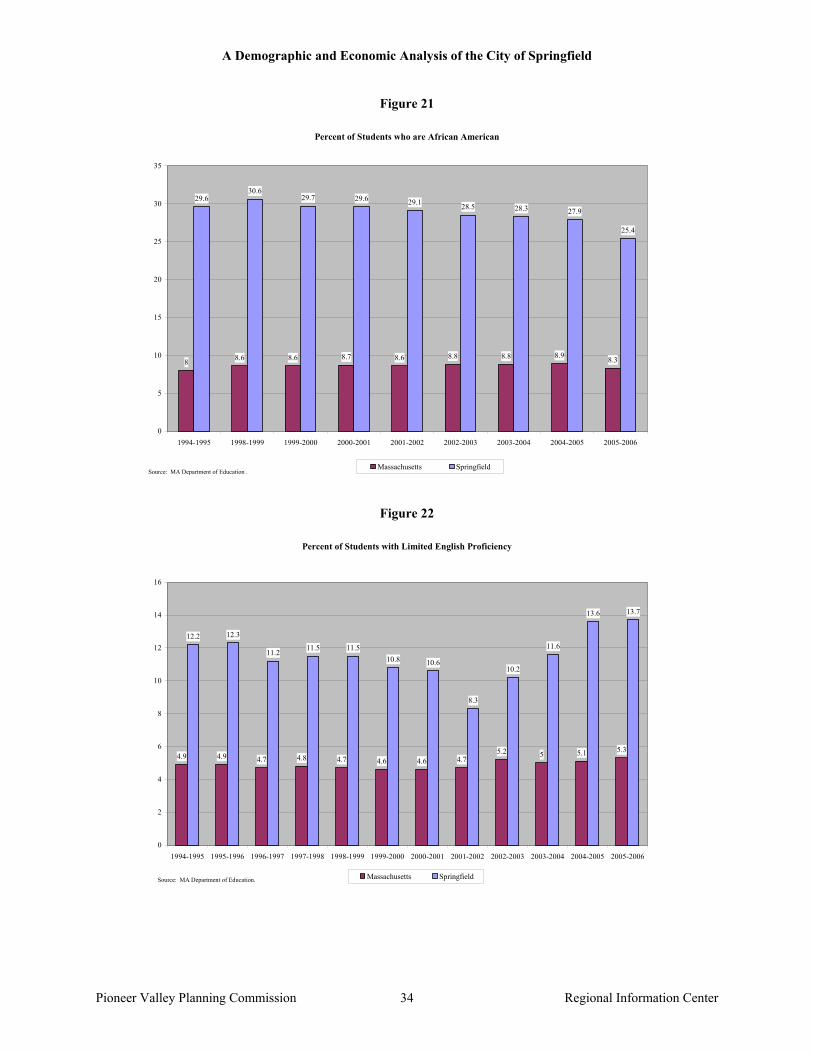
Demographically, Springfield schools have seen a 13 percent decrease in the enrollment of white students over the past 12 years. At the same time the Hispanic student population has increased by 13.2 percent, while the African American student population declined by 4.2 percent. In 2005, overall, the share of Springfield’s enrollment consisting of students of color was about three times that of the state of Massachusetts.
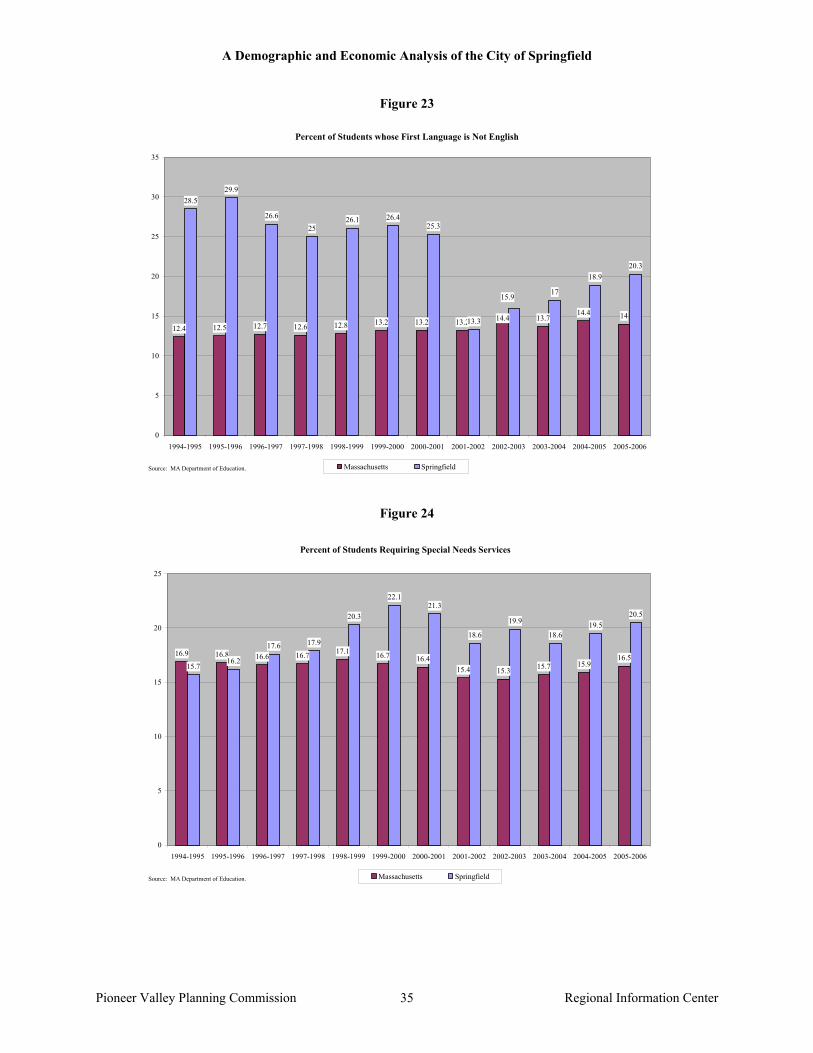
The percentage of students who are limited English proficient in the Springfield Public Schools has varied over the past decade, but generally the rate has been at least double that of Massachusetts, with 13.7 percent of students meeting such a classification in 2005. A similar varied but recently growing trend can be seen in the population of students whose first language is not English. Although the overall percentage of students in this category showed a decline from 1994 to 2002, the numbers are again on the rise in correspondence with a statewide rise in students fitting this description. During the 2005-2006 school year 20.3percent percent of Springfield’s student population reported their first language as one other than English.
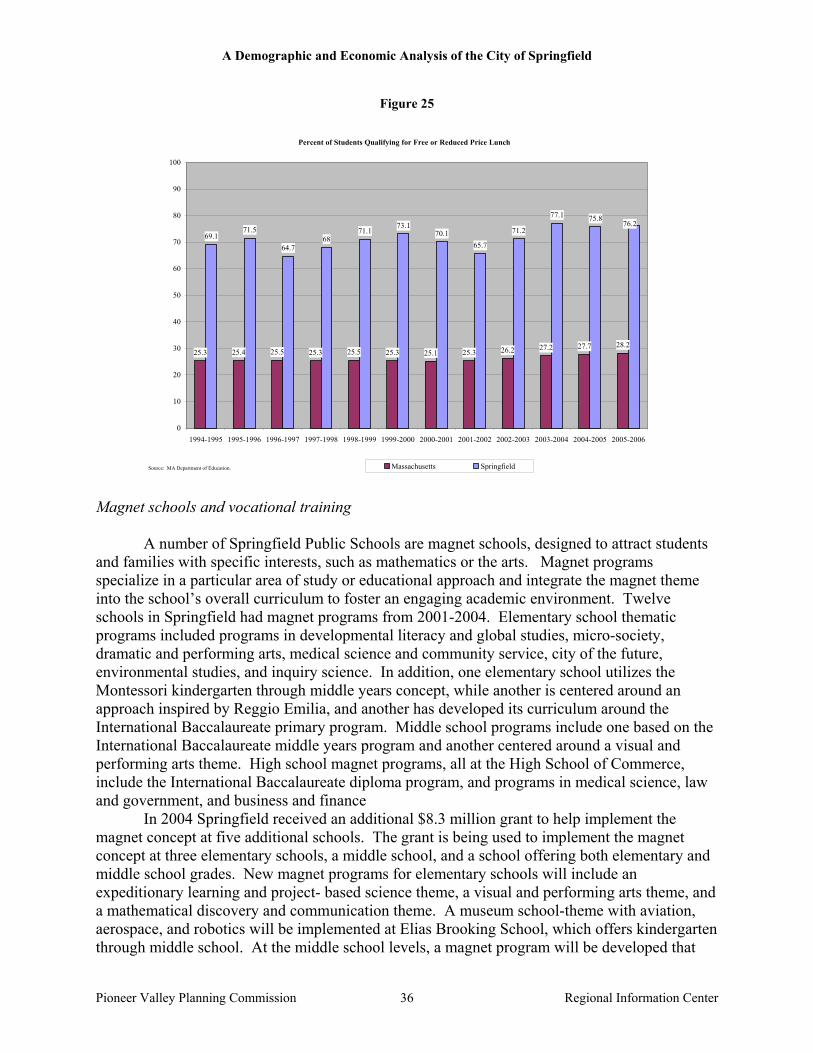
Springfield has also seen an increase in the number of special needs students it services. AS of 2005, 20.5 percent of Springfield’s student population requires some sort of special needs service, which reflects a 4.5 percentage point increase from 1994. During that time period the state average for percent of students requiring special needs services fell by 0.4 percentage points. Given the relatively low income population of Springfield, the percentage of students qualifying for free or reduced price lunch has historically been higher than that of the state. Over the past 12 years the percentage Springfield’s students qualifying for free or reduced price lunch has often been nearly triple the state rate.
A Demographic and Economic Analysis of the City of Springfield
Pioneer Valley Planning Commission Regional Information Center 32
Figure 17
Springfield Public School Enrollment 2001-2006
10,345
10,812
10,337
5,8596,249 6,219 6,165
5,9616,181
6,723 6,856 6,9426,690
9,81010,228
3,000
4,000
5,000
6,000
7,000
8,000
9,000
10,000
11,000
12,000
2001-2002 2002-2003 2003-2004 2004-2005 2005-2006
ElementarySchool
Middle School
High School
Source: MA Department of Education.
Figure 18
Pre-Kindergarten and Kindergarten Enrollment 1994-2006
539 567 553
663 624 651 694781
844755 752
664
1,781 1,7491,823
1,875 1,918
2,046 2,046 2,036
1,862
2,0551,968 1,976
0
500
1000
1500
2000
2500
1994 1995 1996 1997 1998 1999 2000 2001 2002 2003 2004 2005
Pre- KindergatenKindergarten
Source: MA Department of Education.
A Demographic and Economic Analysis of the City of Springfield
Pioneer Valley Planning Commission Regional Information Center 33
Figure 19
Percent of Students who are White
79.277.1 76.6 75.9 75.7 75.1 74.6 74.2
72.4
30.626.5 25.6 24.2 23 21.8 20.7 19.5
17.6
0
10
20
30
40
50
60
70
80
90
1994-1995 1998-1999 1999-2000 2000-2001 2001-2002 2002-2003 2003-2004 2004-2005 2005-2006
Massachusetts SpringfieldSource: MA Department of Education.
Figure 20
Percent of Students who are Hispanic
9 10 10.2 10.7 10.8 11.2 11.5 11.8 12.9
37.6
40.842.4
43.945.3
47.248.5
49.9 50.8
0
10
20
30
40
50
60
1994-1995 1998-1999 1999-2000 2000-2001 2001-2002 2002-2003 2003-2004 2004-2005 2005-2006
Massachusetts SpringfieldSource: MA Department of Education.
A Demographic and Economic Analysis of the City of Springfield
Pioneer Valley Planning Commission Regional Information Center 34
Figure 21
Percent of Students who are African American
8 8.6 8.6 8.7 8.6 8.8 8.8 8.9 8.3
29.630.6
29.7 29.6 29.1 28.5 28.3 27.9
25.4
0
5
10
15
20
25
30
35
1994-1995 1998-1999 1999-2000 2000-2001 2001-2002 2002-2003 2003-2004 2004-2005 2005-2006
Massachusetts SpringfieldSource: MA Department of Education .
Figure 22
Percent of Students with Limited English Proficiency
4.9 4.9 4.7 4.8 4.7 4.6 4.6 4.75.2 5 5.1 5.3
12.2 12.3
11.2 11.5 11.510.8 10.6
8.3
10.2
11.6
13.6 13.7
0
2
4
6
8
10
12
14
16
1994-1995 1995-1996 1996-1997 1997-1998 1998-1999 1999-2000 2000-2001 2001-2002 2002-2003 2003-2004 2004-2005 2005-2006
Massachusetts SpringfieldSource: MA Department of Education.
A Demographic and Economic Analysis of the City of Springfield
Pioneer Valley Planning Commission Regional Information Center 35
Figure 23
Percent of Students whose First Language is Not English
12.4 12.5 12.7 12.6 12.8 13.2 13.2 13.2 13.714.4 14
28.529.9
26.6
2526.1 26.4
25.3
13.3
17
18.920.3
14.4
15.9
0
5
10
15
20
25
30
35
1994-1995 1995-1996 1996-1997 1997-1998 1998-1999 1999-2000 2000-2001 2001-2002 2002-2003 2003-2004 2004-2005 2005-2006
Massachusetts SpringfieldSource: MA Department of Education.
Figure 24
Percent of Students Requiring Special Needs Services
16.9 16.8 16.6 16.7 17.1 16.7 16.415.4 15.3 15.7 15.9
16.515.7
16.2
17.6 17.9
20.3
22.121.3
18.6
19.9
18.619.5
20.5
0
5
10
15
20
25
1994-1995 1995-1996 1996-1997 1997-1998 1998-1999 1999-2000 2000-2001 2001-2002 2002-2003 2003-2004 2004-2005 2005-2006
Massachusetts SpringfieldSource: MA Department of Education.
A Demographic and Economic Analysis of the City of Springfield
Pioneer Valley Planning Commission Regional Information Center 36
Figure 25
Percent of Students Qualifying for Free or Reduced Price Lunch
25.3 25.4 25.5 25.3 25.5 25.3 25.1 25.3 26.2 27.2 27.7 28.2
69.171.5
64.768
71.173.1
70.165.7
71.2
77.1 75.876.2
0
10
20
30
40
50
60
70
80
90
100
1994-1995 1995-1996 1996-1997 1997-1998 1998-1999 1999-2000 2000-2001 2001-2002 2002-2003 2003-2004 2004-2005 2005-2006
Massachusetts SpringfieldSource: MA Department of Education. Magnet schools and vocational training
A number of Springfield Public Schools are magnet schools, designed to attract students
and families with specific interests, such as mathematics or the arts. Magnet programs specialize in a particular area of study or educational approach and integrate the magnet theme into the school’s overall curriculum to foster an engaging academic environment. Twelve schools in Springfield had magnet programs from 2001-2004. Elementary school thematic programs included programs in developmental literacy and global studies, micro-society, dramatic and performing arts, medical science and community service, city of the future, environmental studies, and inquiry science. In addition, one elementary school utilizes the Montessori kindergarten through middle years concept, while another is centered around an approach inspired by Reggio Emilia, and another has developed its curriculum around the International Baccalaureate primary program. Middle school programs include one based on the International Baccalaureate middle years program and another centered around a visual and performing arts theme. High school magnet programs, all at the High School of Commerce, include the International Baccalaureate diploma program, and programs in medical science, law and government, and business and finance
In 2004 Springfield received an additional $8.3 million grant to help implement the magnet concept at five additional schools. The grant is being used to implement the magnet concept at three elementary schools, a middle school, and a school offering both elementary and middle school grades. New magnet programs for elementary schools will include an expeditionary learning and project- based science theme, a visual and performing arts theme, and a mathematical discovery and communication theme. A museum school-theme with aviation, aerospace, and robotics will be implemented at Elias Brooking School, which offers kindergarten through middle school. At the middle school levels, a magnet program will be developed that

A Demographic and Economic Analysis of the City of Springfield
Pioneer Valley Planning Commission Regional Information Center 37
focuses on expeditionary learning with “exploratory zones” in law, justice and forensics, broadcast journalism and communication arts, and design engineering and technology
The most well-known magnet program in the district is the International Baccalaureate (IB) diploma program. Since July 2000, Springfield’s High School of Commerce has been one of only 800 schools world-wide to participate in the full diploma program, which is designed to foster academic excellence and international awareness. Upon the completion of their IB course work and tests, students are eligible to receive college credit from institutions that recognize the programs rigorous academic curriculum.
To receive an IB diploma, students must complete three modules identified as the core of the program, including a “Theory of Knowledge” course, an extended essay, and 150 hours of community service, as well as complete advanced coursework in six areas of study – language arts, foreign language studies, individuals and societies, experimental sciences, mathematics and computer sciences, and the arts. Students are assessed not only by their teachers but also by external IB evaluators, who score multiple choice tests and essays administered by the program. IB courses are open to all students with the recommendation of a teacher, regardless of whether they are pursuing an IB diploma or not. Non-diploma students receive IB certificates upon completion of an individual course. During the last examination session, thirty-four student completed IB exams.
Springfield Public Schools also operates a vocational program at Putnam Vocational-Technical High School. Putnam offers programs in carpentry and cabinet-making, electrical construction, metal fabrication, sign construction, design, cosmetology, culinary arts, nursing, auto body, auto mechanics, commercial art, computer repair, and graphic arts. In addition to occupational training, students also complete academic coursework required for a Massachusetts high school diploma. Workplace-related problem-solving and skills building are also built into a number of courses, including those in mathematics and science, through the “tech prep” curriculum. These courses integrate material from vocational studies into traditional academic courses and involve hands on projects and interactive teachings approaches, These techniques serve to both motivate students’ interest in the academic matter by connecting it to their chosen program interest and to provide students with practical training.
MCAS performance
The academic performance of Springfield students is measured by the Massachusetts
Comprehensive Assessment System (MCAS) examinations. Under MCAS, students begin to take statewide assessment tests in grade three, and are tested annually through eighth grade, and then again in tenth grade. The MCAS system provides an assessment of student performance, and students are classified at one of four performance levels, advanced, proficient, needs improvement, or warning/failure, based on their results (except the grade three test for which there is no “advanced” level). The third grade test is a reading skills test, an indicator of whether students have acquired the skills necessary for academic success in later grade levels. The test is “high stakes” for students at the tenth grade level, as students are required to pass the tenth grade MCAS test prior to graduation.
On the MCAS test, Springfield students typically perform below the state-wide average. Consistent with the state-wide trend, Springfield students’ performance on the test has improved over the past five years as numerous efforts have been implemented to improve student achievement and test performance. Springfield’s improvement over this period have helped to

A Demographic and Economic Analysis of the City of Springfield
Pioneer Valley Planning Commission Regional Information Center 38
narrow the gap between the performance of students in Springfield and those elsewhere in the state. Springfield students’ poor performance on the 10th grade math MCAS is particularly troubling, given that in a 2003 focus group of Springfield area manufacturers, manufacturing employers expressed that basic mathematics skills are becoming an increasingly important workforce skill in the new manufacturing environment.
However, the Springfield Public Schools face a number of unique challenges. As stated previously a much larger percentage of students in Springfield Public Schools are classified as limited English proficient, low income or special needs by the Department of Education. Research indicates that students from these groups, on average, face more barriers to academic success than students without these attributes. This suggests that as a district, the Springfield Public Schools serve a more difficult-to-educate student population than other Massachusetts cities and towns. Furthermore, if the test performance of Springfield students with special needs or low-income backgrounds is compared with that of similar students statewide, the gap between Springfield passing rates and those of the state narrows considerably.
Despite some improvement in overall passing rates, nearly three of every five third graders in Springfield are not getting a proficient score on the MCAS reading exam, suggesting they will struggle in higher grades to learn because of difficulty reading. Likewise, while overall passing rates on the MCAS 10th grade math exam have increased, only one in five Springfield 10th grader gets a proficient or advanced score on the exam. The 10th grade English exam reveals similar results, an overall increase in passing rates but a very limited number of students scoring as proficient or advanced (a needs improvement score counts as passing).
Figure 26
Grade 3 MCAS Results: Percentage of Students at Each Performance Level, 2001-2005
Proficient
Needs Improvement
Warning/Failure
0%
10%
20%
30%
40%
50%
60%
70%
80%
90%
100%
2001 2002 2003 2004 2005Source: MA Department of Educztion
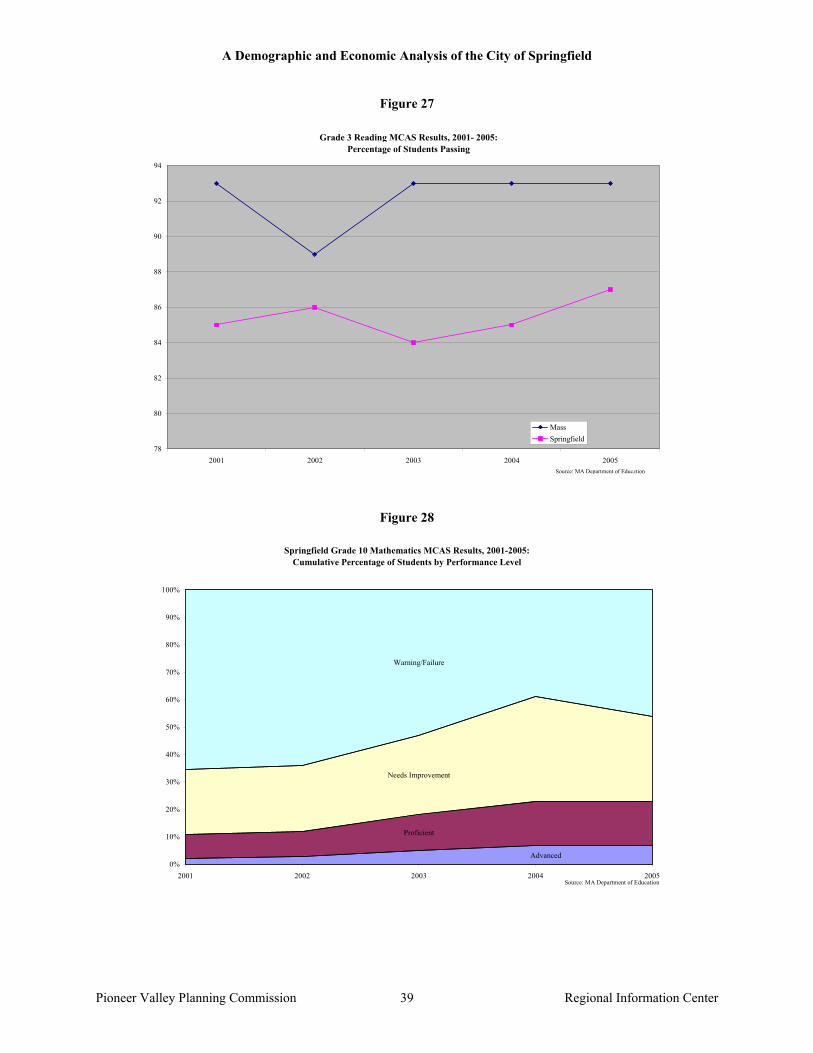
A Demographic and Economic Analysis of the City of Springfield
Pioneer Valley Planning Commission Regional Information Center 39
Figure 27
Grade 3 Reading MCAS Results, 2001- 2005: Percentage of Students Passing
78
80
82
84
86
88
90
92
94
2001 2002 2003 2004 2005
MassSpringfield
Source: MA Department of Educztion
Figure 28
Springfield Grade 10 Mathematics MCAS Results, 2001-2005: Cumulative Percentage of Students by Performance Level
Advanced
Proficient
Needs Improvement
Warning/Failure
0%
10%
20%
30%
40%
50%
60%
70%
80%
90%
100%
2001 2002 2003 2004 2005Source: MA Department of Education
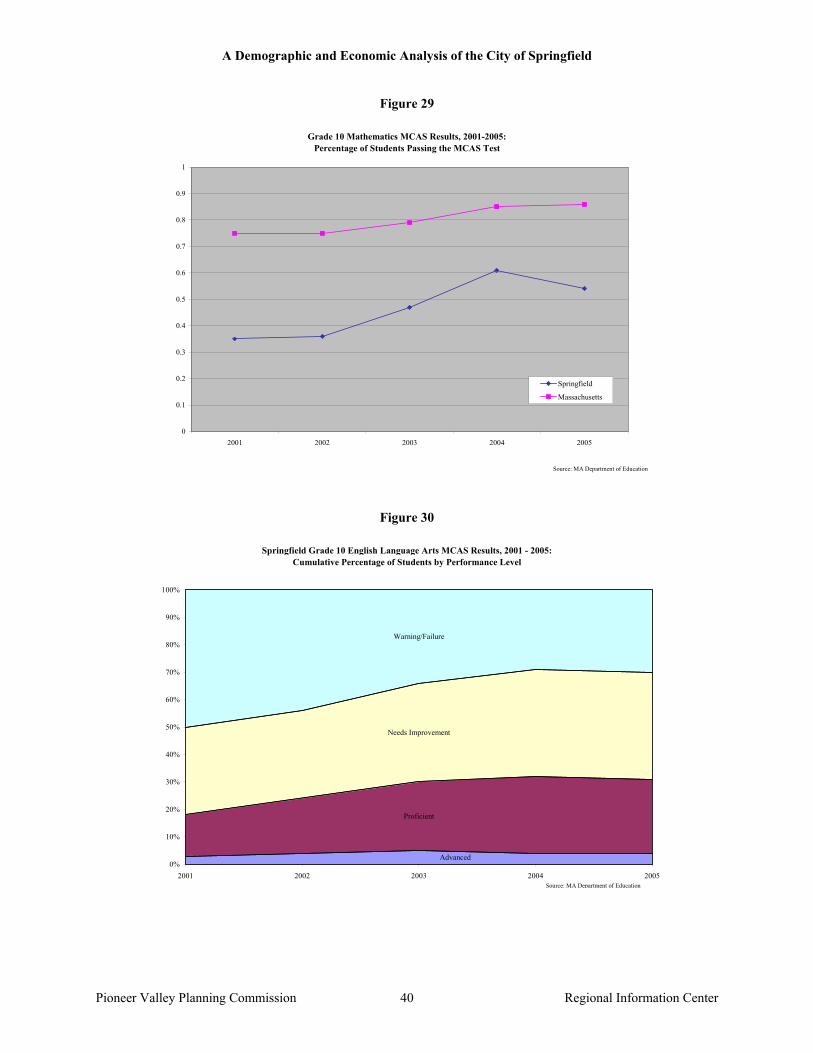
A Demographic and Economic Analysis of the City of Springfield
Pioneer Valley Planning Commission Regional Information Center 40
Figure 29
Grade 10 Mathematics MCAS Results, 2001-2005: Percentage of Students Passing the MCAS Test
0
0.1
0.2
0.3
0.4
0.5
0.6
0.7
0.8
0.9
1
2001 2002 2003 2004 2005
Springfield
Massachusetts
Source: MA Department of Education
Figure 30
Springfield Grade 10 English Language Arts MCAS Results, 2001 - 2005: Cumulative Percentage of Students by Performance Level
Advanced
Proficient
Needs Improvement
Warning/Failure
0%
10%
20%
30%
40%
50%
60%
70%
80%
90%
100%
2001 2002 2003 2004 2005Source: MA Department of Education

A Demographic and Economic Analysis of the City of Springfield
Pioneer Valley Planning Commission Regional Information Center 41
Figure 31
Grade 10 English Language Arts MCAS Results, 2001-2005: Percentage of Students Passing the MCAS Test
0%
10%
20%
30%
40%
50%
60%
70%
80%
90%
100%
2001 2002 2003 2004 2005
Springfield
Massachusetts
Source: MA Department of Education
Table 8: Grade 10 MCAS Results for Selected Student Populations, 2005
English Language Arts Needs Advanced Proficient
Improvement Warning/
Failing
Spfld Mass Spfld Mass Spfld Mass Spfld MassLimited English Proficiency
0% 1% 2% 9% 35% 34% 62% 55%
Low Income 2% 7% 22% 30% 42% 39% 34% 24% Special Education 0% 3% 7% 24% 29% 42% 64% 31%
Mathematics Needs Advanced Proficient
Improvement Warning/
Failing
Spfld Mass Spfld Mass Spfld Mass Spfld MassLimited English Proficiency
3% 11% 4% 14% 22% 30% 71% 45%
Low Income 4% 14% 13% 21% 30% 33% 53% 31% Special Education 1% 8% 4% 20% 13% 34% 81% 38%
Source: Massachusetts Department of Education.
Plans of graduates The future plans of Springfield’s high school graduates have remained relatively stable over the past 11 years. High school graduates in Springfield generally show more interest in two-year institutions as opposed to other post-graduation options. Despite overall stability, the

A Demographic and Economic Analysis of the City of Springfield
Pioneer Valley Planning Commission Regional Information Center 42
number of students planning to enter the workforce immediately after graduation has fluctuated. From 1995 to 2005, the percentage of students entering the workforce straight out of high school dropped 8.7 percent. This trend is particularly noticeable when examining the graduation plans of Roger L. Putnam High School graduates. In 1995, 42.0 percent of Putnam’s graduating class reported that they would enter the workforce upon graduation, while 27.4 percent reported that they would continue their education at a two-year institution. In 2005 only 7.2 percent of Putnam graduates planned to enter the workforce while 73.0 percent intended to pursue a two- or four-year degree. This information becomes especially important when analyzing Springfield’s trained and qualified workforce. Springfield’s graduates are becoming increasingly interested in furthering their education by attaining college degrees and advanced technical training. Unfortunately, data on graduates’ intentions does not shed light on their actual actions following graduation. Anecdotally, the low rate of college degree attainment among Springfield’s population suggests that not as many Springfield graduates are able to complete the education they intend to pursue when they finish high school.
Figure 32
Plans For Springfield Public School Graduates 1995-2005
294401
500
346
506417371341373
233160
138
133
168
130
168
134206158137
135
133
12
10
13
9
13
915
721
9125
128
156
152
144
152
182116
127114
143118
7
15
14
3
14
1731
913
392118
41
43
16
43
4239
4535
425473
119
145
86
145
181128
112183
121150 8
20
34
3
3429
59
10816
7
67 197
234
99
209
98
2341
1148
76
19
0
200
400
600
800
1000
1200
1400
20052004200320022001200019991998199719961995
No InfoOther PlansWorkMilitaryOther Post Second.4 Year Private College2 Year Private College4 Year Public College2 Year Public College
Source: MA Department of Education.
Teachers The Springfield school district currently employs approximately 2,300 teachers, 1,889 of
which, or 82 percent, teach in core academic subject areas. This current staffing level translates to a district-wide student-teacher ratio of approximately 10.9 to one, slightly lower than the statewide average of 13.2 to one. Just below 80 percent of teachers in Springfield are licensed to teach in the field of their teaching assignment, far lower than the statewide average of 94.4 percent. Among teachers in core academic subject areas, only 78 percent Springfield teachers
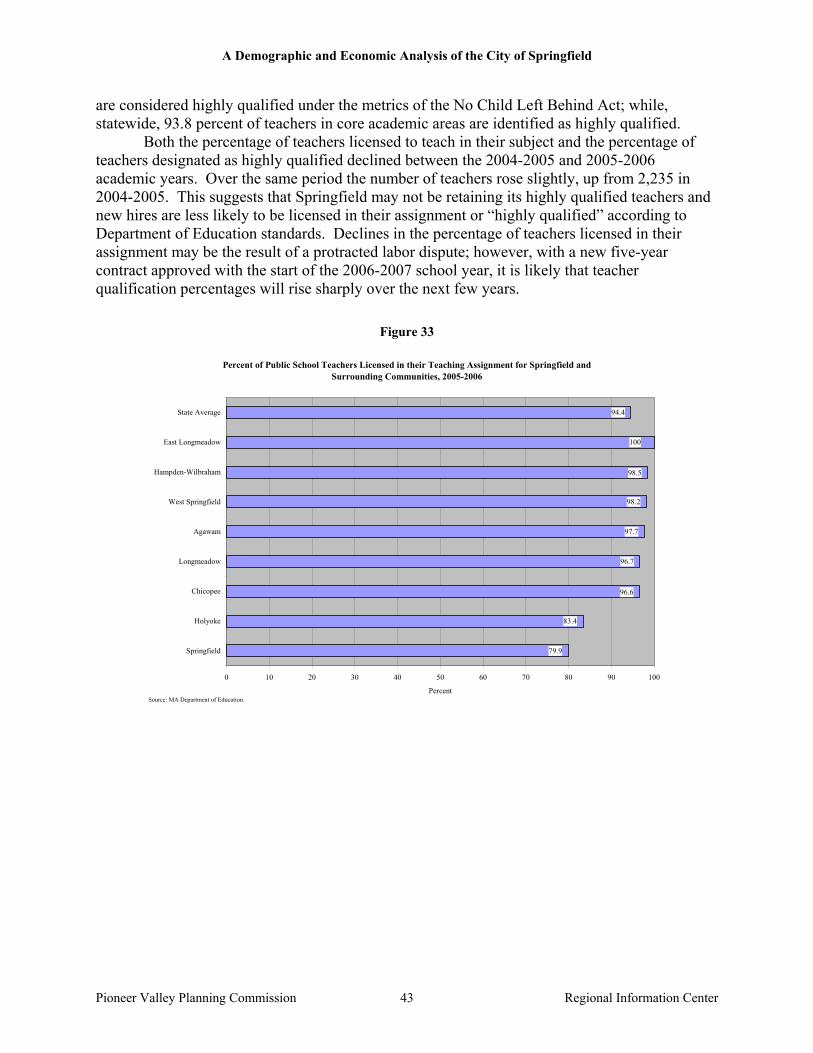
A Demographic and Economic Analysis of the City of Springfield
Pioneer Valley Planning Commission Regional Information Center 43
are considered highly qualified under the metrics of the No Child Left Behind Act; while, statewide, 93.8 percent of teachers in core academic areas are identified as highly qualified.
Both the percentage of teachers licensed to teach in their subject and the percentage of teachers designated as highly qualified declined between the 2004-2005 and 2005-2006 academic years. Over the same period the number of teachers rose slightly, up from 2,235 in 2004-2005. This suggests that Springfield may not be retaining its highly qualified teachers and new hires are less likely to be licensed in their assignment or “highly qualified” according to Department of Education standards. Declines in the percentage of teachers licensed in their assignment may be the result of a protracted labor dispute; however, with a new five-year contract approved with the start of the 2006-2007 school year, it is likely that teacher qualification percentages will rise sharply over the next few years.
Figure 33
Percent of Public School Teachers Licensed in their Teaching Assignment for Springfield and Surrounding Communities, 2005-2006
79.9
83.4
96.6
96.7
97.7
98.2
98.5
100
94.4
0 10 20 30 40 50 60 70 80 90 100
Springfield
Holyoke
Chicopee
Longmeadow
Agawam
West Springfield
Hampden-Wilbraham
East Longmeadow
State Average
PercentSource: MA Department of Education.
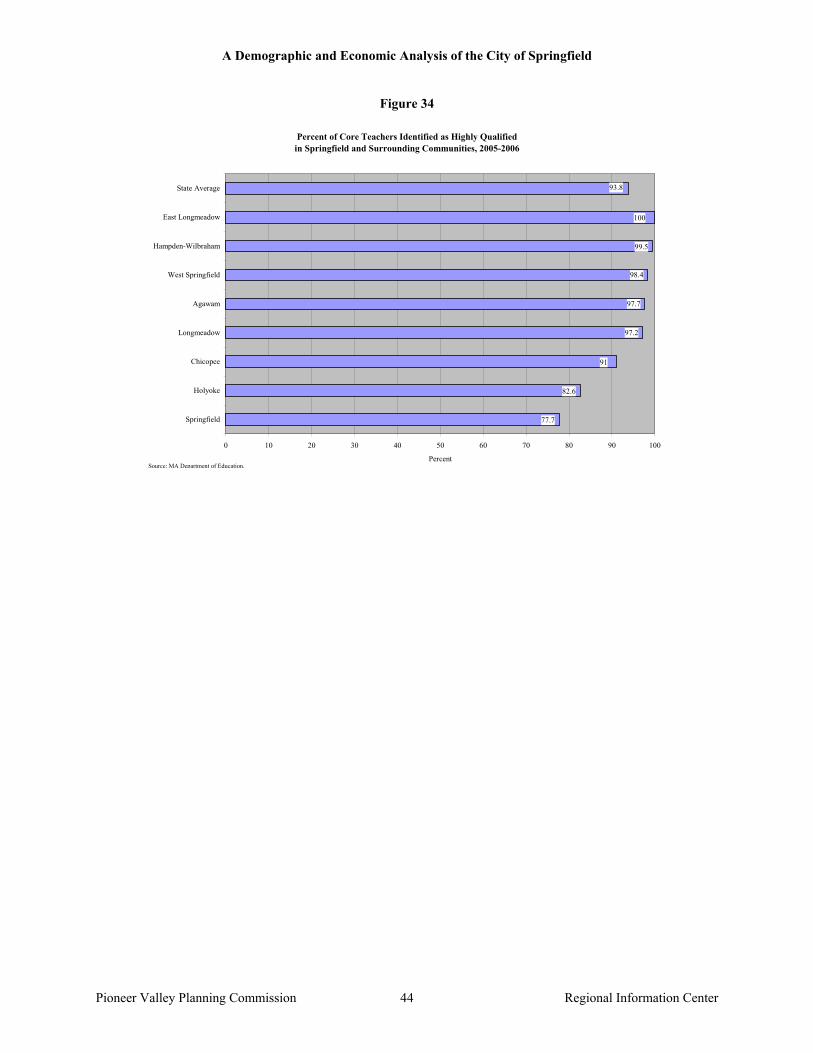
A Demographic and Economic Analysis of the City of Springfield
Pioneer Valley Planning Commission Regional Information Center 44
Figure 34
Percent of Core Teachers Identified as Highly Qualified in Springfield and Surrounding Communities, 2005-2006
77.7
82.6
91
97.2
97.7
98.4
99.5
100
93.8
0 10 20 30 40 50 60 70 80 90 100
Springfield
Holyoke
Chicopee
Longmeadow
Agawam
West Springfield
Hampden-Wilbraham
East Longmeadow
State Average
PercentSource: MA Department of Education.
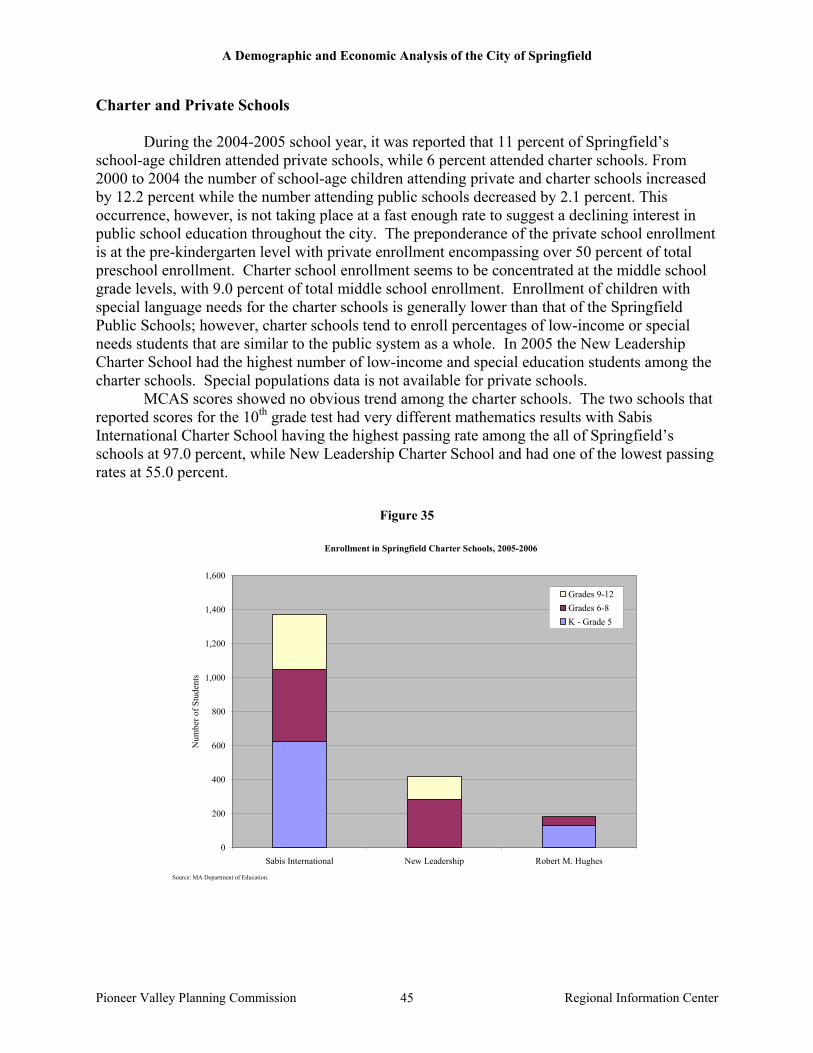
A Demographic and Economic Analysis of the City of Springfield
Pioneer Valley Planning Commission Regional Information Center 45
Charter and Private Schools During the 2004-2005 school year, it was reported that 11 percent of Springfield’s
school-age children attended private schools, while 6 percent attended charter schools. From 2000 to 2004 the number of school-age children attending private and charter schools increased by 12.2 percent while the number attending public schools decreased by 2.1 percent. This occurrence, however, is not taking place at a fast enough rate to suggest a declining interest in public school education throughout the city. The preponderance of the private school enrollment is at the pre-kindergarten level with private enrollment encompassing over 50 percent of total preschool enrollment. Charter school enrollment seems to be concentrated at the middle school grade levels, with 9.0 percent of total middle school enrollment. Enrollment of children with special language needs for the charter schools is generally lower than that of the Springfield Public Schools; however, charter schools tend to enroll percentages of low-income or special needs students that are similar to the public system as a whole. In 2005 the New Leadership Charter School had the highest number of low-income and special education students among the charter schools. Special populations data is not available for private schools.
MCAS scores showed no obvious trend among the charter schools. The two schools that reported scores for the 10th grade test had very different mathematics results with Sabis International Charter School having the highest passing rate among the all of Springfield’s schools at 97.0 percent, while New Leadership Charter School and had one of the lowest passing rates at 55.0 percent.
Figure 35
Enrollment in Springfield Charter Schools, 2005-2006
0
200
400
600
800
1,000
1,200
1,400
1,600
Sabis International New Leadership Robert M. Hughes
Num
ber o
f Stu
dent
s
Grades 9-12Grades 6-8K - Grade 5
Source: MA Department of Education.

A Demographic and Economic Analysis of the City of Springfield
Pioneer Valley Planning Commission Regional Information Center 46
Figure 36
Enrollment at Springfield Private Schools by Grade, 2005-2006
- 100 200 300 400 500 600 700 800
Holy Cross
Holy Name
Our Lady of Mount Carmel
Our Lady of Sacred Heart
Our Lady of Hope
Pioneer Valley Christian
Orchard Children's Corner
Pioneer Valley Montessori
Cathedral High School
The Macduffie School
Pre-K and K
Grades 1-5
Grades 6-8
Grades 9-10
S
Source: The MacDuffie School; Orchards Childrens Corner; Pioneer Valley Christian School; Pioneer Valley Montessori School; and, Springfield Diocese of the Catholic Church.
Figure 37
Enrollment of Selected Student Populations at Springfield Charter Schools, 2005-2006
2.6%0.3%
42.4%
7.7%
0.5% 0.0%
75.2%
12.4%
3.3%0.5%
7.1%
20.3%
13.7%
20.5%
65.9%
76.2%
0.0%
10.0%
20.0%
30.0%
40.0%
50.0%
60.0%
70.0%
80.0%
90.0%
First Language not English Limited English Proficient Low-income Special Education
Perc
ent o
f Stu
dent
s
Sabis InternationalNew LeadershipRobert M. HughesSpringfield District
Source: MA Department of Education.

A Demographic and Economic Analysis of the City of Springfield
Pioneer Valley Planning Commission Regional Information Center 47
Figure 38
10th Grade MCAS Mathematics Performance by School, 2005
0% 10% 20% 30% 40% 50% 60% 70% 80% 90% 100%
Sabis International
New Leadership HMCS
Springfield H S
Springfield Academy
S.A.G.E.
Bridge Academy
Putnam Voc Tech
Springfield Central High
High School/Science-Tech
High School Of Commerce
District Overall
Advanced Proficient Needs Imp Warning/FailureSource: MA Department of Education.
Figure 39
10th Grade MCAS English Language Arts Performance by School, 2005
0% 10% 20% 30% 40% 50% 60% 70% 80% 90% 100%
Sabis International
New Leadership HMCS
Springfield H S
Springfield Academy
S.A.G.E.
Bridge Academy
Putnam Voc Tech
Springfield Central High
High School/Science-Tech
High School Of Commerce
District Overall
Advanced Proficient Needs Imp. Warning/FailureSource: MA Department of Education.
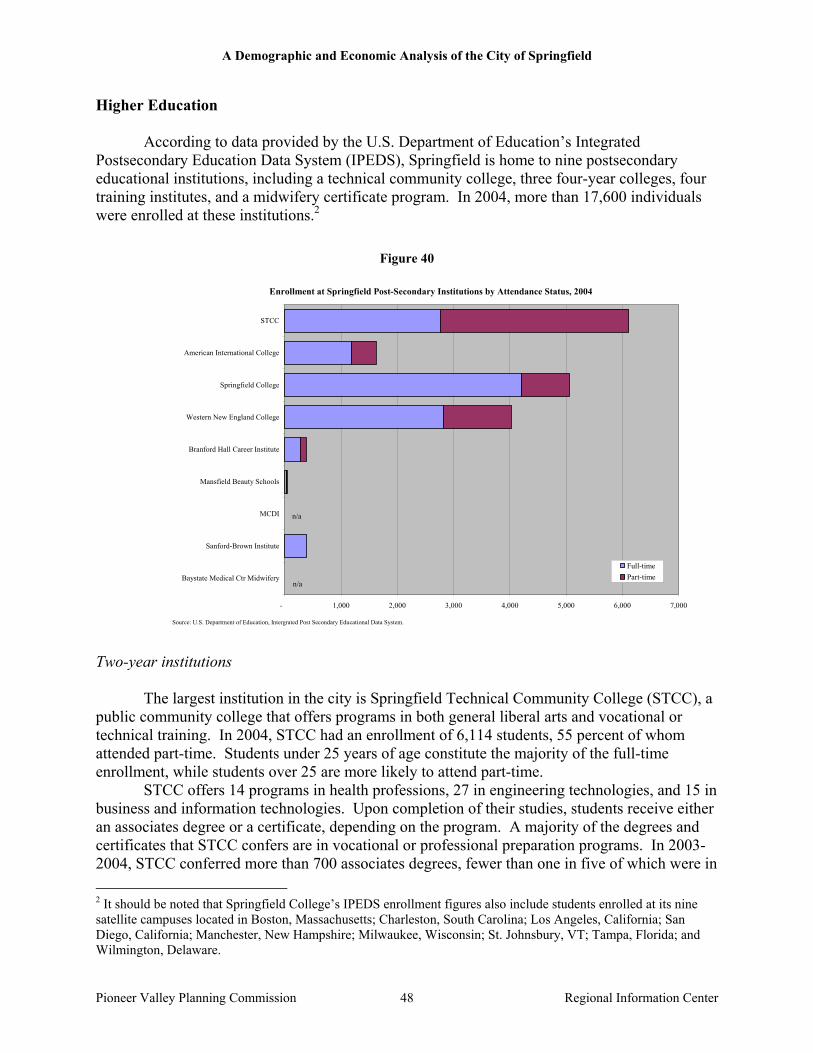
A Demographic and Economic Analysis of the City of Springfield
Pioneer Valley Planning Commission Regional Information Center 48
Higher Education
According to data provided by the U.S. Department of Education’s Integrated Postsecondary Education Data System (IPEDS), Springfield is home to nine postsecondary educational institutions, including a technical community college, three four-year colleges, four training institutes, and a midwifery certificate program. In 2004, more than 17,600 individuals were enrolled at these institutions.2
Figure 40
Enrollment at Springfield Post-Secondary Institutions by Attendance Status, 2004
- 1,000 2,000 3,000 4,000 5,000 6,000 7,000
Baystate Medical Ctr Midwifery
Sanford-Brown Institute
MCDI
Mansfield Beauty Schools
Branford Hall Career Institute
Western New England College
Springfield College
American International College
STCC
Full-timePart-time
n/a
n/a
Source: U.S. Department of Education, Intergrated Post Secondary Educational Data System. Two-year institutions
The largest institution in the city is Springfield Technical Community College (STCC), a public community college that offers programs in both general liberal arts and vocational or technical training. In 2004, STCC had an enrollment of 6,114 students, 55 percent of whom attended part-time. Students under 25 years of age constitute the majority of the full-time enrollment, while students over 25 are more likely to attend part-time.
STCC offers 14 programs in health professions, 27 in engineering technologies, and 15 in business and information technologies. Upon completion of their studies, students receive either an associates degree or a certificate, depending on the program. A majority of the degrees and certificates that STCC confers are in vocational or professional preparation programs. In 2003-2004, STCC conferred more than 700 associates degrees, fewer than one in five of which were in 2 It should be noted that Springfield College’s IPEDS enrollment figures also include students enrolled at its nine satellite campuses located in Boston, Massachusetts; Charleston, South Carolina; Los Angeles, California; San Diego, California; Manchester, New Hampshire; Milwaukee, Wisconsin; St. Johnsbury, VT; Tampa, Florida; and Wilmington, Delaware.

A Demographic and Economic Analysis of the City of Springfield
Pioneer Valley Planning Commission Regional Information Center 49
general or liberal arts programs. During this same period, STCC awarded 155 certificates below the baccalaureate level. Specializations in the health field account for the largest percentage of degrees and certificates granted at STCC. Approximately 21 percent of all associates degrees awarded at STCC in 2003-2004 were in subjects related to the health profession; 30 percent of all certificates granted during the same period were in the health field.
Table 9: Associates Degrees Awarded by STCC by Primary Major, 2003-2004
Agriculture, agriculture operations, and related sciences 7 Landscaping and Grounds keeping 7 Biological and biomedical sciences 4 Biology/Biological Sciences, General 2 Biotechnology 2 Business fields 122 Accounting 14 Business Administration, Management and Operations 22 Business Administration and Management, General 20 Logistics and Materials Management 2 Business/Commerce, General 64 Executive Assistant/Executive Secretary 8 Finance and Financial Management Services 5 Marketing 4 Small Business Administration/Management 5 Communications technologies/technicians and support services 19 Radio and Television Broadcasting Technology/Technician 11 Graphic Communications 8 Computer and information sciences and support services 64 Computer Programming 21 Computer Science 8 Web Page, Digital/Multimedia and Information Resources Design 9 Computer/Information Technology Administration and Management 26 Education 32 Early Childhood Education and Teaching 14 Elementary Education and Teaching 18 Engineering 20 Engineering, General 20 Engineering technologies/technicians 103
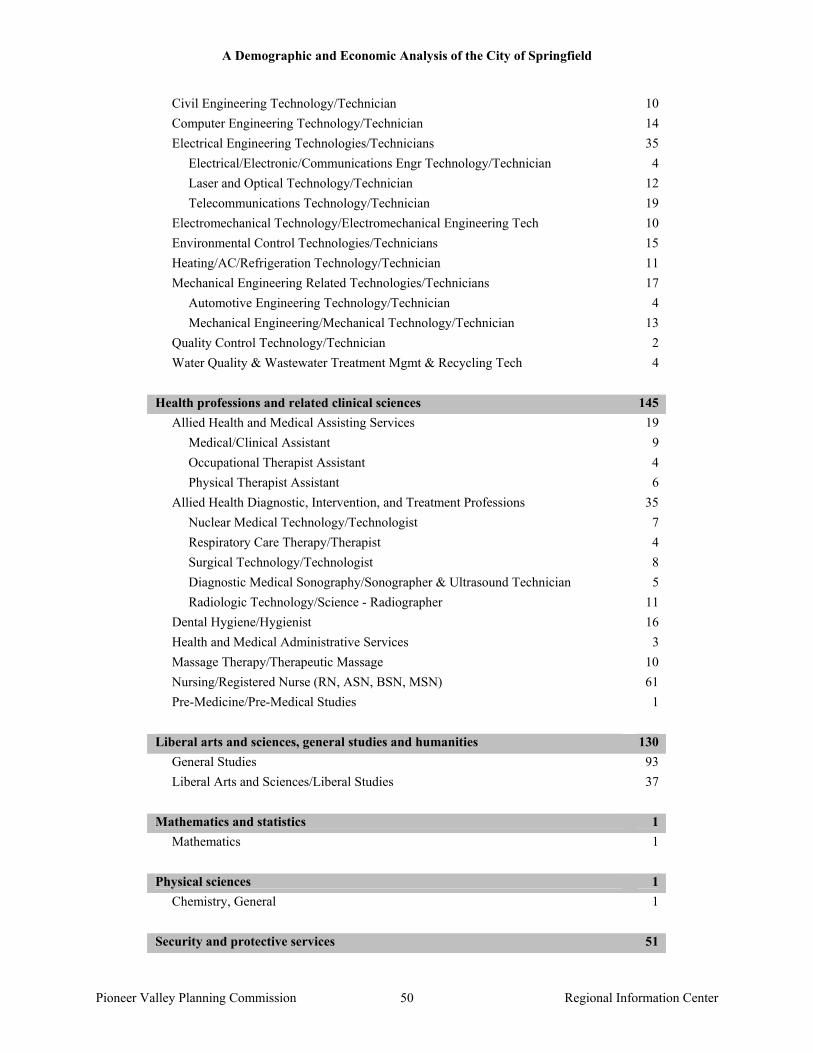
A Demographic and Economic Analysis of the City of Springfield
Pioneer Valley Planning Commission Regional Information Center 50
Civil Engineering Technology/Technician 10 Computer Engineering Technology/Technician 14 Electrical Engineering Technologies/Technicians 35 Electrical/Electronic/Communications Engr Technology/Technician 4 Laser and Optical Technology/Technician 12 Telecommunications Technology/Technician 19 Electromechanical Technology/Electromechanical Engineering Tech 10 Environmental Control Technologies/Technicians 15 Heating/AC/Refrigeration Technology/Technician 11 Mechanical Engineering Related Technologies/Technicians 17 Automotive Engineering Technology/Technician 4 Mechanical Engineering/Mechanical Technology/Technician 13 Quality Control Technology/Technician 2 Water Quality & Wastewater Treatment Mgmt & Recycling Tech 4 Health professions and related clinical sciences 145 Allied Health and Medical Assisting Services 19 Medical/Clinical Assistant 9 Occupational Therapist Assistant 4 Physical Therapist Assistant 6 Allied Health Diagnostic, Intervention, and Treatment Professions 35 Nuclear Medical Technology/Technologist 7 Respiratory Care Therapy/Therapist 4 Surgical Technology/Technologist 8 Diagnostic Medical Sonography/Sonographer & Ultrasound Technician 5 Radiologic Technology/Science - Radiographer 11 Dental Hygiene/Hygienist 16 Health and Medical Administrative Services 3 Massage Therapy/Therapeutic Massage 10 Nursing/Registered Nurse (RN, ASN, BSN, MSN) 61 Pre-Medicine/Pre-Medical Studies 1 Liberal arts and sciences, general studies and humanities 130 General Studies 93 Liberal Arts and Sciences/Liberal Studies 37 Mathematics and statistics 1 Mathematics 1 Physical sciences 1 Chemistry, General 1 Security and protective services 51
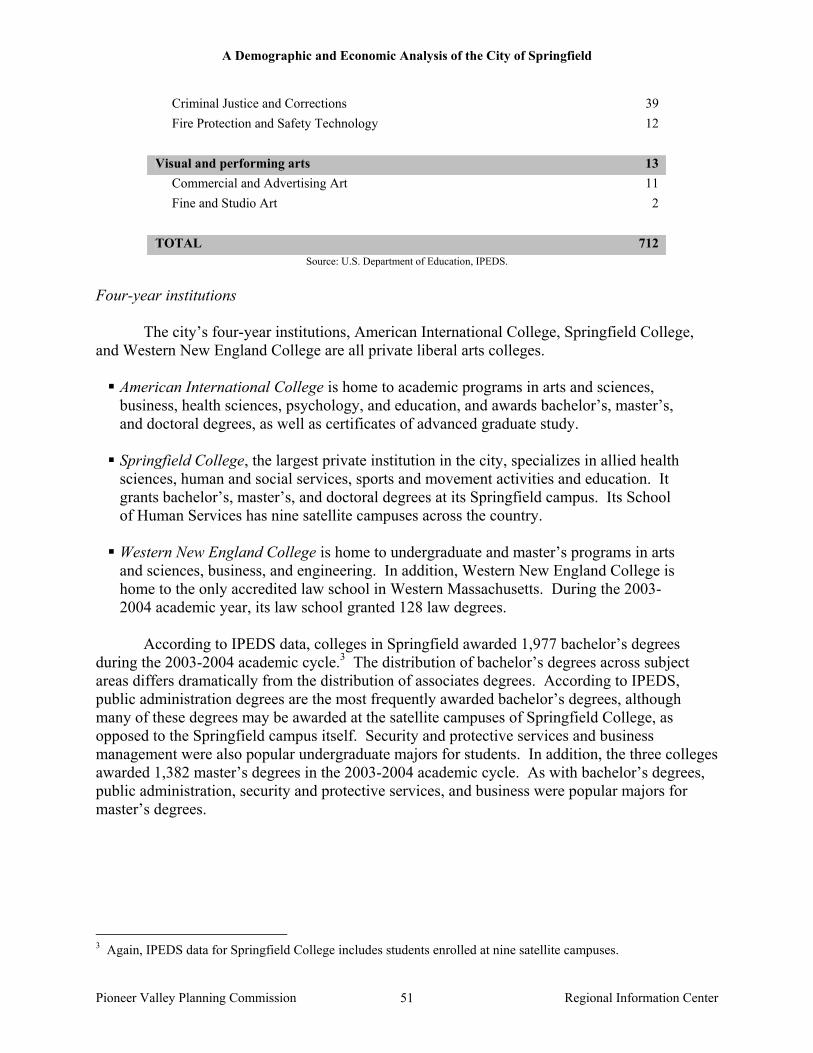
A Demographic and Economic Analysis of the City of Springfield
Pioneer Valley Planning Commission Regional Information Center 51
Criminal Justice and Corrections 39 Fire Protection and Safety Technology 12 Visual and performing arts 13 Commercial and Advertising Art 11 Fine and Studio Art 2 TOTAL 712
Source: U.S. Department of Education, IPEDS. Four-year institutions The city’s four-year institutions, American International College, Springfield College, and Western New England College are all private liberal arts colleges.
American International College is home to academic programs in arts and sciences, business, health sciences, psychology, and education, and awards bachelor’s, master’s, and doctoral degrees, as well as certificates of advanced graduate study.
Springfield College, the largest private institution in the city, specializes in allied health sciences, human and social services, sports and movement activities and education. It grants bachelor’s, master’s, and doctoral degrees at its Springfield campus. Its School of Human Services has nine satellite campuses across the country.
Western New England College is home to undergraduate and master’s programs in arts and sciences, business, and engineering. In addition, Western New England College is home to the only accredited law school in Western Massachusetts. During the 2003-2004 academic year, its law school granted 128 law degrees.
According to IPEDS data, colleges in Springfield awarded 1,977 bachelor’s degrees during the 2003-2004 academic cycle.3 The distribution of bachelor’s degrees across subject areas differs dramatically from the distribution of associates degrees. According to IPEDS, public administration degrees are the most frequently awarded bachelor’s degrees, although many of these degrees may be awarded at the satellite campuses of Springfield College, as opposed to the Springfield campus itself. Security and protective services and business management were also popular undergraduate majors for students. In addition, the three colleges awarded 1,382 master’s degrees in the 2003-2004 academic cycle. As with bachelor’s degrees, public administration, security and protective services, and business were popular majors for master’s degrees.
3 Again, IPEDS data for Springfield College includes students enrolled at nine satellite campuses.

A Demographic and Economic Analysis of the City of Springfield
Pioneer Valley Planning Commission Regional Information Center 52
Table 10: Number of Bachelors Degrees Awarded at Springfield's Four-Year Colleges by Institution and Major, 2003-2004
Western New England College
American International
College
Springfield College
Total
Area, ethnic, cultural, and gender studies
4 5 9
Area Studies, Other 4 - - 4 American/United States Studies/Civilization
0 - 5 5
Biological and biomedical sciences 9 12 16 37 Biology/Biological Sciences, General 9 8 4 21 Biochemistry - 4 - 4 Biological and Biomedical Sciences, Other
- - 12 12
Business, management, marketing, and related support services
198 69 42 309
Accounting 28 6 - 34 Business Administration and Management, General
60 42 102
Business Administration, Management and Operations
2 23 - 25
Business/Commerce, General 33 - - 33 International Business 3 6 - 9 Management Information Systems and Services
27 4 - 31
Management Sciences and Quantitative Methods
- 13 - 13
Marketing 30 11 - 41 Communication, journalism, and related programs
16 15 19 50
Computer and information sciences and support services
14 3 17
Education 8 82 90 Elementary Education and Teaching - 7 8 15 Kindergarten/Preschool Education and Teaching
- - 3 3
Teacher Education/Profess Development, Levels & Methods, Other
- - 1 1
Special Education and Teaching - 1 - 1 Art Teacher Education - - 2 2 Physical Education Teaching and Coaching
- - 58 58
Mathematics Teacher Education - - 0 0 History Teacher Education - - 1 1 Health Teacher Education - - 5 5
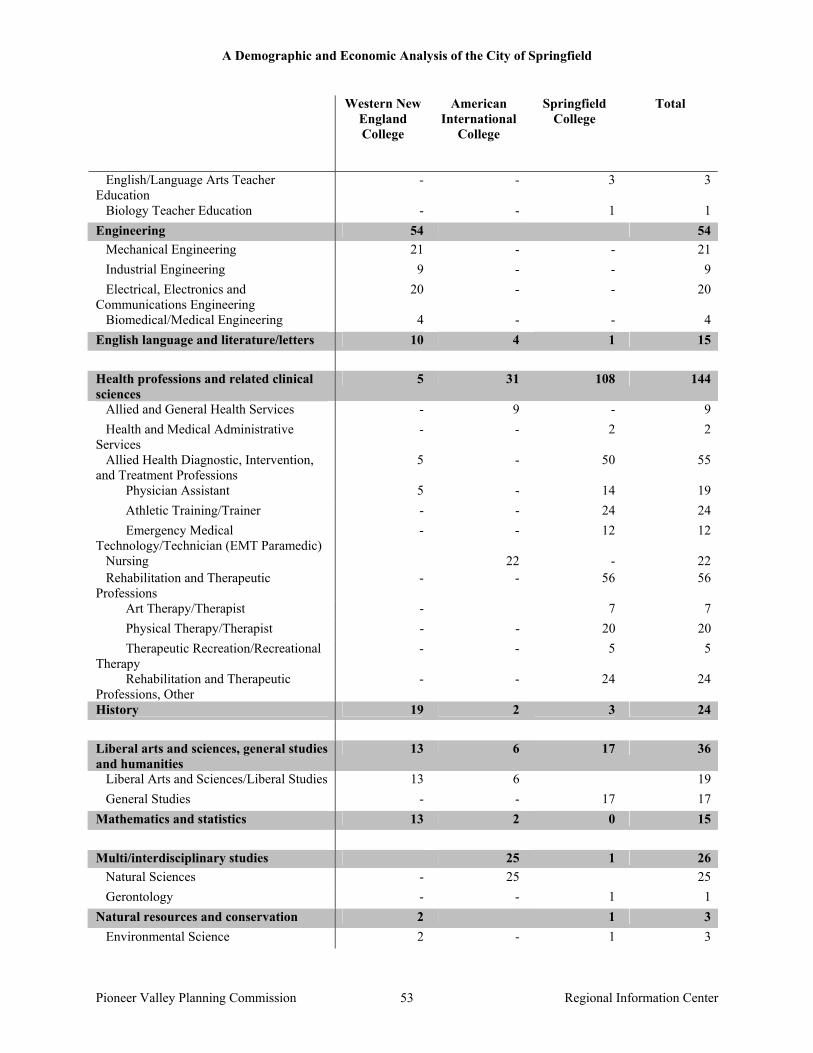
A Demographic and Economic Analysis of the City of Springfield
Pioneer Valley Planning Commission Regional Information Center 53
Western New England College
American International
College
Springfield College
Total
English/Language Arts Teacher Education
- - 3 3
Biology Teacher Education - - 1 1 Engineering 54 54 Mechanical Engineering 21 - - 21 Industrial Engineering 9 - - 9 Electrical, Electronics and Communications Engineering
20 - - 20
Biomedical/Medical Engineering 4 - - 4 English language and literature/letters 10 4 1 15 Health professions and related clinical sciences
5 31 108 144
Allied and General Health Services - 9 - 9 Health and Medical Administrative Services
- - 2 2
Allied Health Diagnostic, Intervention, and Treatment Professions
5 - 50 55
Physician Assistant 5 - 14 19 Athletic Training/Trainer - - 24 24 Emergency Medical Technology/Technician (EMT Paramedic)
- - 12 12
Nursing 22 - 22 Rehabilitation and Therapeutic Professions
- - 56 56
Art Therapy/Therapist - 7 7 Physical Therapy/Therapist - - 20 20 Therapeutic Recreation/Recreational Therapy
- - 5 5
Rehabilitation and Therapeutic Professions, Other
- - 24 24
History 19 2 3 24 Liberal arts and sciences, general studies and humanities
13 6 17 36
Liberal Arts and Sciences/Liberal Studies 13 6 19 General Studies - - 17 17 Mathematics and statistics 13 2 0 15 Multi/interdisciplinary studies 25 1 26 Natural Sciences - 25 25 Gerontology - - 1 1 Natural resources and conservation 2 1 3 Environmental Science 2 - 1 3

A Demographic and Economic Analysis of the City of Springfield
Pioneer Valley Planning Commission Regional Information Center 54
Western New England College
American International
College
Springfield College
Total
Parks, recreation, leisure, and fitness studies
86 86
Parks, Recreation and Leisure Studies - - 10 10 Parks, Recreation, Leisure and Fitness Studies, Other
- - 4 4
Health and Physical Education/Fitness - - 72 72 Sport and Fitness Administration/Management
- - 30 30
Kinesiology and Exercise Science - - 42 42 Physical sciences 5 1 6 Chemistry 5 - 1 6 Psychology 43 16 38 97 Public administration and social service professions
11 1 545 557
Social Work 11 - 11 Community Organization and Advocacy - - 545 545 Human Services, General - 1 - 1 Security and protective services 315 23 2 340 Criminal Justice/Police Science 266 - 266 Criminal Justice/Safety Studies 49 23 2 74 Social sciences 19 16 7 42 Economics 1 1 2 Political Science and Government 13 4 1 18 Social Sciences, General - 4 4 5 7 6 18 Visual and performing arts 20 20 Fine and Studio Art - 1 1 Commercial and Advertising Art - - 18 18 TOTAL BACHELOR'S DEGREES 750 230 997 1977
Source: U.S. Department of Education, IPEDS. Training institutes Springfield is also home to four training institutes. Three of the training institutes, Branford Hall Career Institute, Sanford-Brown Institute and Mansfield Beauty Schools, are campuses within larger for-profit educational systems. The Massachusetts Career Development Institute (MCDI) is a non-profit operated with city funds.
Branford Hall Career Institute in Springfield is one of six Branford Hall campuses in the northeast. The schools are owned by Premier Education Group, headquartered in East Haven, Connecticut, which also has a regional office in the city. The Springfield campus offers programs in culinary arts, heating, ventilation and air conditioning, massage therapy, medical

A Demographic and Economic Analysis of the City of Springfield
Pioneer Valley Planning Commission Regional Information Center 55
assisting, and health claims. The campus expanded in 2005, adding a second location in the city to house its culinary arts and heating, ventilation and air conditioning programs. In 2004, 381 students were enrolled at Branford Hall Career Institute’s Springfield campus.
Sanford-Brown Institute’s Springfield campus is a subsidiary of the Illinois-based Career Education Corporation and is one of 15 Sanford-Brown Institutes operated nationally. Sanford-Brown Institute offers programs in medical billing and coding, medical assisting, criminal justice, and massage therapy in Springfield. According to IPEDS data, 391 students were enrolled in Sanford-Brown programs in 2004.
Mansfield Beauty School in Springfield is one of two Mansfield schools based in Quincy, Massachusetts. Mansfield Beauty School offers cosmetology and manicure programs. Mansfield Beauty School is the smallest of the training institutes, with enrollment in 2004 of 39 students.
The Massachusetts Career Development Institute (MCDI) offers educational and vocational skills training to at-risk populations in the city, including the unemployed, underemployed, and homeless. Educational programs include basic adult education, literacy, English language proficiency, and graduate equivalency degree training. Vocational programs include office skills, medical secretary, certified nurse aid, environmental technology, culinary arts, electronic technology, metal fabrication, and building maintenance. According to MCDI’s 2006 budget proposal, 576 individuals were enrolled in vocational programs in fiscal year 2004, which ran from July 2003 to June 2004; 228 individuals were enrolled in education training programs during that same period.
IPEDS data for degree completions indicate that the three for-profit training institutes in Springfield awarded 452 certificates during the 2003-2004 academic cycle. A majority of these certificates were in fields related to the health professions. While IPEDS data for program completions at MCDI were not available, City of Springfield budget documents indicate that during the 2004 fiscal year, 295 individuals completed vocational programs at MCDI.
Table 11: Number of Certificates Awarded at Training Institutes by Institute and Subject, 2003-2004
Branford Hall Career
Institute
Sanford-Brown
Institute
Mansfield Beauty Schools
Total
Computer and information sciences and support services
23 - - 23
Cosmetology and Related Personal Grooming Services
- - 21 21
Cosmetology 16 Other Related Personal Grooming Arts 5 Health professions and related clinical sciences
224 184 - 408
Medical Records Technology 67 47 114 Medical/Clinical Assistant 157 137 294

A Demographic and Economic Analysis of the City of Springfield
Pioneer Valley Planning Commission Regional Information Center 56
Branford Hall Career
Institute
Sanford-Brown
Institute
Mansfield Beauty Schools
Total
TOTAL CERTIFICATES FROM TRAINING INSTITUTES
471 368 42 860
Source: U.S. Department of Education, IPEDS. Other post-secondary options
The city is also home to a post baccalaureate certificate program at Baystate Medical Center. The Baystate Medical Center Midwifery Education Program offers its certificate in midwifery for individuals with nursing degrees, and according to IPEDS data, three such certificates were awarded from 2003-2004.
In addition to the various educational options available to the city’s residents, Springfield
is also home to one of the Hampden County Regional Employment Board’s career centers. Futureworks Career Center serves the community by aiding in the search for employment and providing career training information, and support services. Most of the services offered are provided free of charge, however computer workshops and job training seminars usually require a small fee. In addition to servicing the adults in the community, Futureworks works in conjunction with the Hampden County Regional Employment Board and the Holyoke based Career Center, Careerpoint, to help qualified youth ages 14-21 find employment in private area businesses.

A Demographic and Economic Analysis of the City of Springfield
Pioneer Valley Planning Commission Regional Information Center 57
Businesses in Springfield Business in Springfield Establishments Springfield’s business community has a long history in manufacturing with a particular specialty in fabricated metal products manufacturing, emanating from the long history of the Springfield Armory. While manufacturing remains a strong presence in the Springfield business community, other prominent sectors have emerged as well. In particular, health and educational services industries have become major employers in Springfield. As of 2004, there were slightly more than 5,500 private employers located in Springfield. The largest share of these employers were the 486 employers in the retail trade sector. That retail trade represents the largest number of employers is unsurprising since most retail establishments are small (the average retail establishment has 14.1 employees). Health care and professional services represented the next two largest sectors with respect to number of establishments with 417 and 379 employers respectively. Despite the much discussed decline of manufacturing in the Northeast, Springfield has 144 manufacturing employers with an average employment of 36 per establishment. In some respects the decline in manufacturing is actually a shift in the nature of manufacturing. The number of large manufacturing employers in Springfield has and continues to decline; however, the manufacturing sector remains vibrant in the form of a larger number of small manufacturing operations that are producing high value added products on a contract-basis. Along with the sectors already discussed, construction, wholesale trade, finance and insurance, real estate, administration, and accommodation and food services industries each have more than 100 employers in Springfield. While Springfield has never been a major location for corporate headquarters’, the presence of the home offices for the city’s home grown companies such as Smith and Wesson or Big Y Supermarkets translates into 22 employers in the management of companies and enterprises sector with an average of 63 employees for each of these 22 establishments. Because of changes in how industry-level data is collected and reported between 2000 and 2001, it is difficult to compare current establishment and employment data by industry to data from before 2001. However, there are already substantial changes that have taken place in numbers of employers since 2001. Unfortunately, between 2001 and 2004, the number of manufacturing employers declined by more than 10 percent. This decline was exceeded by three other sectors that also had drops in number of employers larger than 10 percent: management of companies, administrative services, and arts, entertainment, and recreation. The construction, real estate, and educational services sectors experienced the opposite trend with greater than 10 percent increases in number of employers over the four-year period. In particular, educational services saw an increase in number of businesses that neared 30 percent. While declines in the number of manufacturing businesses in the city are worrisome, the growth of the region’s emerging education, health care, and transportation sectors is good news.

A Demographic and Economic Analysis of the City of Springfield
Pioneer Valley Planning Commission Regional Information Center 58
Figure 41
Number of Business Establishments by Industry in Springfield, 2004
0 100 200 300 400 500 600
Construction
Manufacturing
Utilities
Wholesale Trade
Retail Trade
Transportation and Warehousing
Information
Finance and Insurance
Real Estate and Rental and Leasing
Professional and Technical Services
Management of Companies and Enterprises
Administrative and Waste Services
Educational Services
Health Care and Social Assistance
Arts, Entertainment, and Recreation
Accommodation and Food Services
Number of Establishments
Source: MA Department of Workforce Development, Quarterly Census of Employment and Wages.
Figure 42
Percent Change in the Number of Establishments by Industry, 2001-2004
-20% -10% 0% 10% 20% 30% 40%
Construction
Manufacturing
Utilities
Wholesale Trade
Retail Trade
Transportation and Warehousing
Information
Finance and Insurance
Real Estate and Rental and Leasing
Professional and Technical Services
Management of Companies
Administrative and Waste Services
Educational Services
Health Care and Social Assistance
Arts, Entertainment, and Recreation
Accommodation and Food Services
Source: MA Department of Workforce Development, Quarterly Census of Employment and Wages.

A Demographic and Economic Analysis of the City of Springfield
Pioneer Valley Planning Commission Regional Information Center 59
Employment Examining private sector employment in Springfield, the vital importance of the health care sector to the city becomes even more obvious. Nearly 18,000 people work in Springfield in the health care and social assistance sector (about 24 percent of the city’s working population of more than 77,000). This includes employees at the city’s two major hospitals, affiliated medical practices and labs, and the numerous employees of the city’s many social and community service organizations. A number of these organizations serve a wider area than just Springfield but their primary offices are located in Springfield because it is the region’s principal city. The presence of MassMutual is felt in that the finance and insurance sector employs more than 6,000 people in Springfield. Retail trade is the only other sector to top 6,000 in employment in Springfield. Manufacturing though smaller than twenty years ago, still employs more than 5,000 people in Springfield. Accommodation and food services and other services are the only other two sectors employing more than 4,000 people. Because we are analyzing private sector employment, one of the city’s four colleges (STCC) and the public school system are not reflected in the educational services sector employment numbers which is why the sector shows only slightly more than 2,000 employees. As with change in the number of employers between 2001 and 2004, the manufacturing, administrative services, and management of companies sectors experienced significant losses in employment. In particular, employment in management of companies fell by more than 30 percent between 2001 and 2004. Interestingly, construction employment dropped by nearly 20 percent between 2001 and 2004, while the number of construction employers increased by more than 10 percent. This suggests that the construction sector is shifting to smaller-sized businesses. The industry sectors showing the largest employment gains between 2001 and 2004 were educational services (up nearly 50 percent), arts, entertainment, and recreation (up more than 25 percent), and other services (increasing by more than 25 percent). As the transportation and warehousing and real estate sectors experienced gains in the number of employers, they also say slight increases in total employment. That a number of sectors had increases in employment that were much smaller, on a percentage basis, than their increases in number of employers provides evidence that the city’s business community is becoming increasingly oriented around small employers.
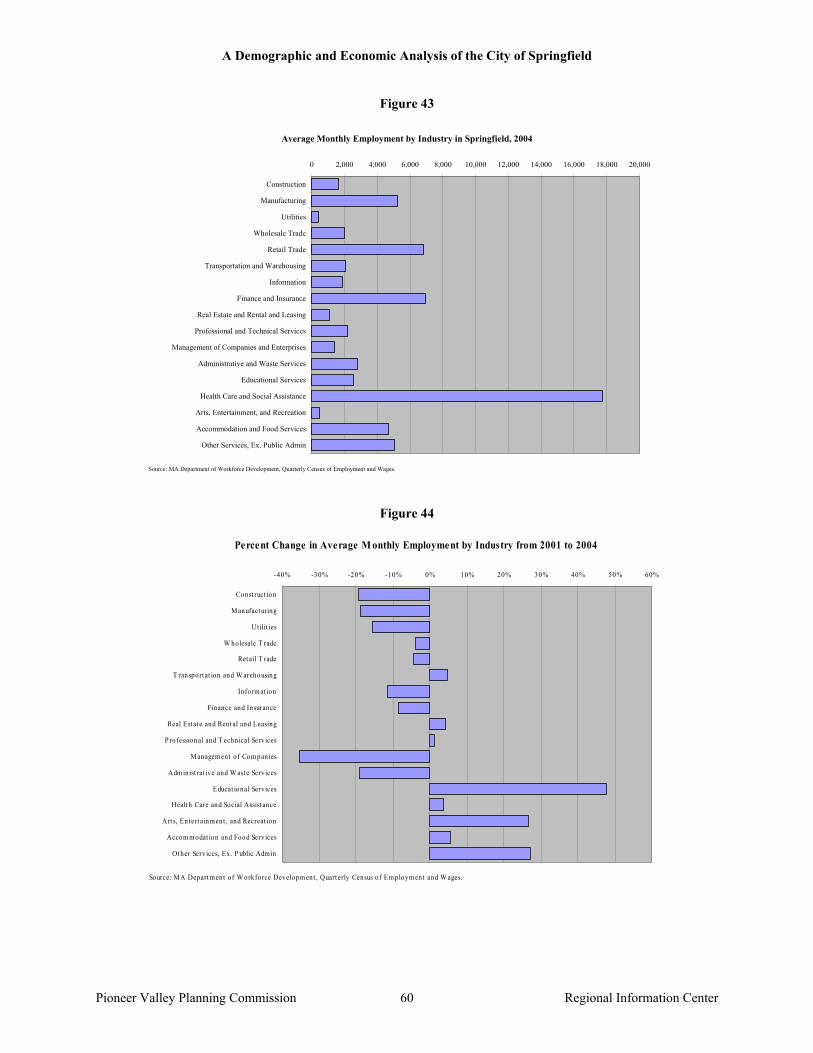
A Demographic and Economic Analysis of the City of Springfield
Pioneer Valley Planning Commission Regional Information Center 60
Figure 43
Average Monthly Employment by Industry in Springfield, 2004
0 2,000 4,000 6,000 8,000 10,000 12,000 14,000 16,000 18,000 20,000
Construction
Manufacturing
Utilities
Wholesale Trade
Retail Trade
Transportation and Warehousing
Information
Finance and Insurance
Real Estate and Rental and Leasing
Professional and Technical Services
Management of Companies and Enterprises
Administrative and Waste Services
Educational Services
Health Care and Social Assistance
Arts, Entertainment, and Recreation
Accommodation and Food Services
Other Services, Ex. Public Admin
Source: MA Department of Workforce Development, Quarterly Census of Employment and Wages.
Figure 44
Percent Change in Average M onthly Employment by Industry from 2001 to 2004
-40% -30% -20% -10% 0% 10% 20% 30% 40% 50% 60%
Const ruct ion
Manufacturing
Ut ilit ies
W holesale T rade
Retail T rade
T ransport at ion and W arehousing
Informat ion
Finance and Insurance
Real Est at e and Rental and Leasing
P rofessional and T echnical Services
Management of Companies
Administ rat ive and W aste Services
Educat ional Services
Health Care and Social Assist ance
Art s, Entert ainment , and Recreat ion
Accommodat ion and Food Services
Other Services, Ex. P ublic Admin
Source: MA Department of W orkforce Development , Quart erly Census of Employment and W ages.
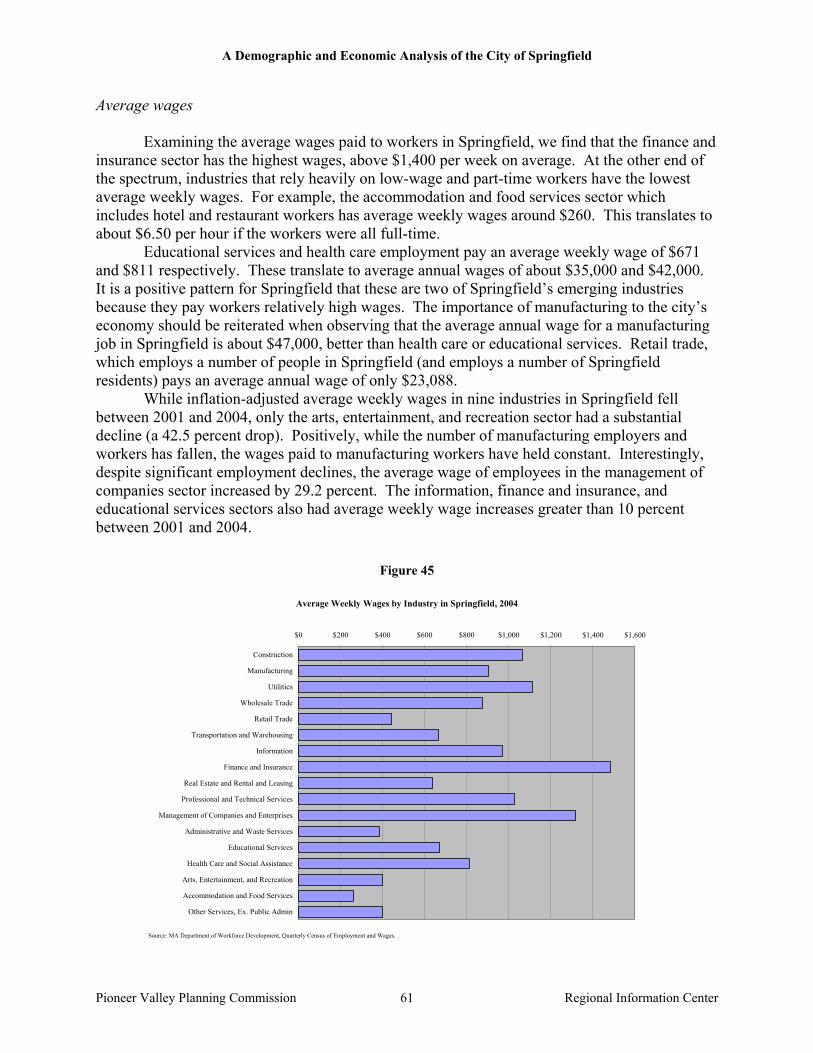
A Demographic and Economic Analysis of the City of Springfield
Pioneer Valley Planning Commission Regional Information Center 61
Average wages Examining the average wages paid to workers in Springfield, we find that the finance and insurance sector has the highest wages, above $1,400 per week on average. At the other end of the spectrum, industries that rely heavily on low-wage and part-time workers have the lowest average weekly wages. For example, the accommodation and food services sector which includes hotel and restaurant workers has average weekly wages around $260. This translates to about $6.50 per hour if the workers were all full-time. Educational services and health care employment pay an average weekly wage of $671 and $811 respectively. These translate to average annual wages of about $35,000 and $42,000. It is a positive pattern for Springfield that these are two of Springfield’s emerging industries because they pay workers relatively high wages. The importance of manufacturing to the city’s economy should be reiterated when observing that the average annual wage for a manufacturing job in Springfield is about $47,000, better than health care or educational services. Retail trade, which employs a number of people in Springfield (and employs a number of Springfield residents) pays an average annual wage of only $23,088. While inflation-adjusted average weekly wages in nine industries in Springfield fell between 2001 and 2004, only the arts, entertainment, and recreation sector had a substantial decline (a 42.5 percent drop). Positively, while the number of manufacturing employers and workers has fallen, the wages paid to manufacturing workers have held constant. Interestingly, despite significant employment declines, the average wage of employees in the management of companies sector increased by 29.2 percent. The information, finance and insurance, and educational services sectors also had average weekly wage increases greater than 10 percent between 2001 and 2004.
Figure 45
Average Weekly Wages by Industry in Springfield, 2004
$0 $200 $400 $600 $800 $1,000 $1,200 $1,400 $1,600
Construction
Manufacturing
Utilities
Wholesale Trade
Retail Trade
Transportation and Warehousing
Information
Finance and Insurance
Real Estate and Rental and Leasing
Professional and Technical Services
Management of Companies and Enterprises
Administrative and Waste Services
Educational Services
Health Care and Social Assistance
Arts, Entertainment, and Recreation
Accommodation and Food Services
Other Services, Ex. Public Admin
Source: MA Department of Workforce Development, Quarterly Census of Employment and Wages.

A Demographic and Economic Analysis of the City of Springfield
Pioneer Valley Planning Commission Regional Information Center 62
Figure 46
Change in Average Weekly Wages, by Industry from 2001-2004 (after inflation adjustment)
-50% -40% -30% -20% -10% 0% 10% 20% 30% 40%
Construction
Manufacturing
Utilities
W holesale Trade
Retail Trade
Transportation and W arehous ing
Information
Finance and Insurance
Real Es tate and Rental and Leas ing
Profess ional and Technical Services
M anagement of Companies and Enterprises
Adminis trative and W aste Services
Educational Services
Health Care and Social Ass is tance
Arts , Entertainment, and Recreation
Accommodation and Food Services
Other Services , Ex. Public Admin
Source: MA Department of W orkforce Development , Quarterly Census of Employment and W ages.
Table 12: Average Weekly Wages by Industry, 2004 (in 2004 $)
2001 2002 2003 2004 Construction $1,112 $1,130 $1,077 $1,066 Manufacturing $903 $896 $901 $904 Utilities $1,122 $1,158 $1,117 $1,112 Wholesale Trade $882 $858 $887 $875 Retail Trade $444 $461 $460 $444 Transportation and Warehousing $701 $690 $680 $667 Information $860 $886 $950 $969 Finance and Insurance $1,301 $1,350 $1,393 $1,485 Real Estate and Rental and Leasing $573 $640 $647 $639 Professional and Technical Services $1,013 $994 $1,025 $1,028 Management of Companies and Enterprises $1,021 $1,140 $1,327 $1,319 Administrative and Waste Services $400 $396 $437 $384 Educational Services $557 $583 $686 $671 Health Care and Social Assistance $773 $784 $800 $811 Arts, Entertainment, and Recreation $693 $691 $529 $398 Accommodation and Food Services $278 $278 $275 $264 Other Services, Ex. Public Admin $425 $407 $392 $397 Total, All Industries--All Ownership $775 $783 $788 $795 Total, All Industries--Private Ownership $761 $769 $776 $779
Source: MA Department of Workforce Development, Quarterly Census of Employment and Wages.

A Demographic and Economic Analysis of the City of Springfield
Pioneer Valley Planning Commission Regional Information Center 63
Major Employers
Springfield’s major employers in 2006 are in the health care and social assistance, educational, and retail industry sector. Of the 573 employers in Springfield with 20 or more employees, 19.2 percent were in the health care and social assistance sector; 11.9 percent were in the educational services sector; and 10.3 percent were in the retail trade sector. A slightly smaller share of Springfield’s employers, 9.8 percent, are in the accommodations and food service sector. The manufacturing sector represents 9.2 percent of Springfield’s major employers. Among the sectors in Springfield with the fewest major employers are real estate, 1.4 percent of major employers, and arts, entertainment, and recreation, 1.0 percent. This is perhaps unsurprising since real estate and art or recreation businesses tend to be small.
Springfield’s largest employers – Bay State Health System, Mercy Hospital, and the Mass Mutual Financial Group – each employ over 4,000 people in Springfield. Combined these three institutions account for nearly one in five jobs in Springfield. Two private colleges are also included in the city’s ten largest employers: Springfield College employing 740 people, and Western New England College employing over 650 people. Among the city’s 15 largest employers are two manufacturing companies: Solutia Incorporated, a chemical manufacturing company employing 675 persons, and the Titeflex Corporation, a plastics and rubber manufacturing company employing 430 persons. Other large employers in Springfield include Peter Pan Bus Lines, the regional transit and ground-transportation company employing 850 people, and the regional newspaper publishing company employing 800 people.
In terms of size, the majority (56.1 percent) of Springfield’s major employers employ between 20 and 49 employees. Establishments with 50 to 99 employees comprise another 24.9 percent of major employers and establishments with 100 to 249 employees are 13.1 percent of major employers. That said, just over five percent of Springfield’s major employers have more than 249 employees.
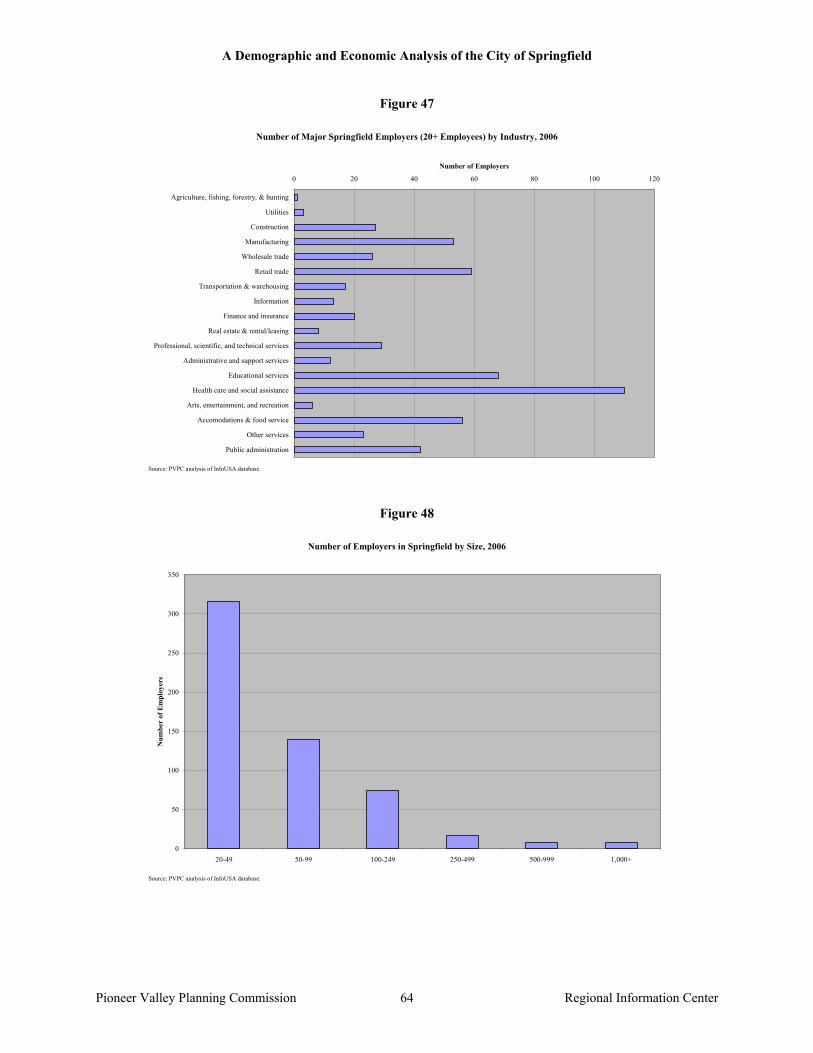
A Demographic and Economic Analysis of the City of Springfield
Pioneer Valley Planning Commission Regional Information Center 64
Figure 47
Number of Major Springfield Employers (20+ Employees) by Industry, 2006
0 20 40 60 80 100 120
Agriculture, fishing, forestry, & hunting
Utilities
Construction
Manufacturing
Wholesale trade
Retail trade
Transportation & warehousing
Information
Finance and insurance
Real estate & rental/leasing
Professional, scientific, and technical services
Administrative and support services
Educational services
Health care and social assistance
Arts, entertainment, and recreation
Accomodations & food service
Other services
Public administration
Number of Employers
Source: PVPC analysis of InfoUSA database.
Figure 48
Number of Employers in Springfield by Size, 2006
0
50
100
150
200
250
300
350
20-49 50-99 100-249 250-499 500-999 1,000+
Num
ber
of E
mpl
oyer
s
Source: PVPC analysis of InfoUSA database.
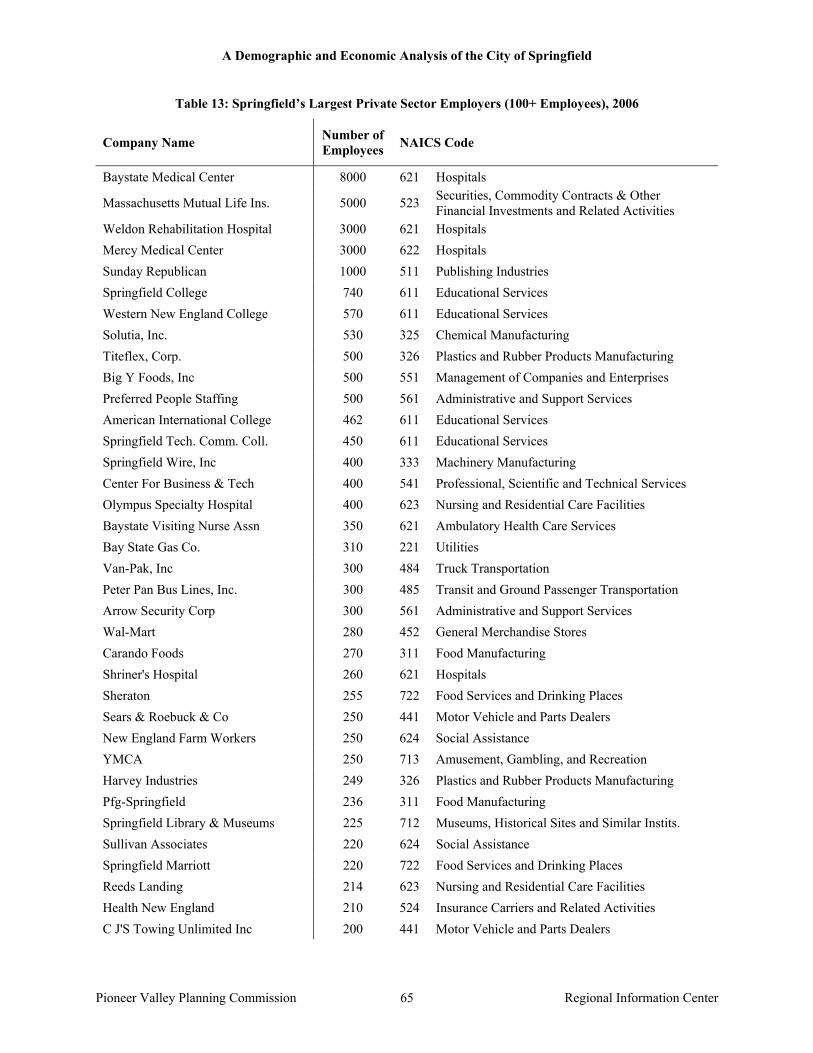
A Demographic and Economic Analysis of the City of Springfield
Pioneer Valley Planning Commission Regional Information Center 65
Table 13: Springfield’s Largest Private Sector Employers (100+ Employees), 2006
Company Name Number of Employees NAICS Code
Baystate Medical Center 8000 621 Hospitals
Massachusetts Mutual Life Ins. 5000 523 Securities, Commodity Contracts & Other Financial Investments and Related Activities
Weldon Rehabilitation Hospital 3000 621 Hospitals Mercy Medical Center 3000 622 Hospitals Sunday Republican 1000 511 Publishing Industries Springfield College 740 611 Educational Services Western New England College 570 611 Educational Services Solutia, Inc. 530 325 Chemical Manufacturing Titeflex, Corp. 500 326 Plastics and Rubber Products Manufacturing Big Y Foods, Inc 500 551 Management of Companies and Enterprises Preferred People Staffing 500 561 Administrative and Support Services American International College 462 611 Educational Services Springfield Tech. Comm. Coll. 450 611 Educational Services Springfield Wire, Inc 400 333 Machinery Manufacturing Center For Business & Tech 400 541 Professional, Scientific and Technical Services Olympus Specialty Hospital 400 623 Nursing and Residential Care Facilities Baystate Visiting Nurse Assn 350 621 Ambulatory Health Care Services Bay State Gas Co. 310 221 Utilities Van-Pak, Inc 300 484 Truck Transportation Peter Pan Bus Lines, Inc. 300 485 Transit and Ground Passenger Transportation Arrow Security Corp 300 561 Administrative and Support Services Wal-Mart 280 452 General Merchandise Stores Carando Foods 270 311 Food Manufacturing Shriner's Hospital 260 621 Hospitals Sheraton 255 722 Food Services and Drinking Places Sears & Roebuck & Co 250 441 Motor Vehicle and Parts Dealers New England Farm Workers 250 624 Social Assistance YMCA 250 713 Amusement, Gambling, and Recreation Harvey Industries 249 326 Plastics and Rubber Products Manufacturing Pfg-Springfield 236 311 Food Manufacturing Springfield Library & Museums 225 712 Museums, Historical Sites and Similar Instits. Sullivan Associates 220 624 Social Assistance Springfield Marriott 220 722 Food Services and Drinking Places Reeds Landing 214 623 Nursing and Residential Care Facilities Health New England 210 524 Insurance Carriers and Related Activities C J'S Towing Unlimited Inc 200 441 Motor Vehicle and Parts Dealers
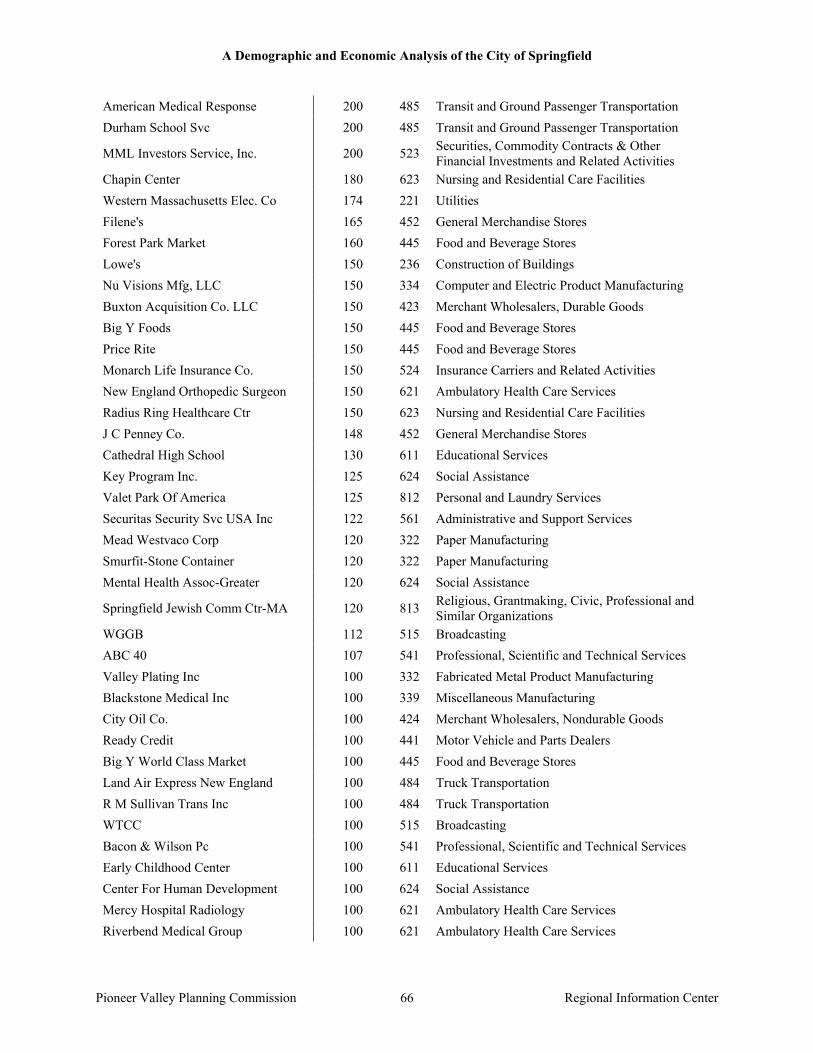
A Demographic and Economic Analysis of the City of Springfield
Pioneer Valley Planning Commission Regional Information Center 66
American Medical Response 200 485 Transit and Ground Passenger Transportation Durham School Svc 200 485 Transit and Ground Passenger Transportation
MML Investors Service, Inc. 200 523 Securities, Commodity Contracts & Other Financial Investments and Related Activities
Chapin Center 180 623 Nursing and Residential Care Facilities Western Massachusetts Elec. Co 174 221 Utilities Filene's 165 452 General Merchandise Stores Forest Park Market 160 445 Food and Beverage Stores Lowe's 150 236 Construction of Buildings Nu Visions Mfg, LLC 150 334 Computer and Electric Product Manufacturing Buxton Acquisition Co. LLC 150 423 Merchant Wholesalers, Durable Goods Big Y Foods 150 445 Food and Beverage Stores Price Rite 150 445 Food and Beverage Stores Monarch Life Insurance Co. 150 524 Insurance Carriers and Related Activities New England Orthopedic Surgeon 150 621 Ambulatory Health Care Services Radius Ring Healthcare Ctr 150 623 Nursing and Residential Care Facilities J C Penney Co. 148 452 General Merchandise Stores Cathedral High School 130 611 Educational Services Key Program Inc. 125 624 Social Assistance Valet Park Of America 125 812 Personal and Laundry Services Securitas Security Svc USA Inc 122 561 Administrative and Support Services Mead Westvaco Corp 120 322 Paper Manufacturing Smurfit-Stone Container 120 322 Paper Manufacturing Mental Health Assoc-Greater 120 624 Social Assistance
Springfield Jewish Comm Ctr-MA 120 813 Religious, Grantmaking, Civic, Professional and Similar Organizations
WGGB 112 515 Broadcasting ABC 40 107 541 Professional, Scientific and Technical Services Valley Plating Inc 100 332 Fabricated Metal Product Manufacturing Blackstone Medical Inc 100 339 Miscellaneous Manufacturing City Oil Co. 100 424 Merchant Wholesalers, Nondurable Goods Ready Credit 100 441 Motor Vehicle and Parts Dealers Big Y World Class Market 100 445 Food and Beverage Stores Land Air Express New England 100 484 Truck Transportation R M Sullivan Trans Inc 100 484 Truck Transportation WTCC 100 515 Broadcasting Bacon & Wilson Pc 100 541 Professional, Scientific and Technical Services Early Childhood Center 100 611 Educational Services Center For Human Development 100 624 Social Assistance Mercy Hospital Radiology 100 621 Ambulatory Health Care Services Riverbend Medical Group 100 621 Ambulatory Health Care Services

A Demographic and Economic Analysis of the City of Springfield
Pioneer Valley Planning Commission Regional Information Center 67
Child Guidance Clinic 100 622 Hospitals Greater Springfield Senior Svc 100 624 Social Assistance UNO Chicago Grill 100 722 Food Services and Drinking Places UNI First Corp 100 812 Personal and Laundry Services
Area Agency On Aging 100 813 Religious, Grantmaking, Civic, Professional and Similar Organizations
Source: PVPC analysis of InfoUSA database.

A Demographic and Economic Analysis of the City of Springfield
Pioneer Valley Planning Commission Regional Information Center 68
Real Estate in Springfield Profile of Springfield Housing In 2004, there were an estimated 63,441 housing units in the City of Springfield, approximately one of every four units in the wider metropolitan area. The total number of housing units has not changed significantly for some time. Between 2001 and 2004 the total number of housing units is estimated to have increased from 62,547 to 63,441, only a 1.4 percent increase.
Of the city’s housing units, nearly one in ten (9.3 percent) were vacant in 2004. While many of these units were vacant because they were for sale or rent, 34.1 percent were long-term vacant. That 38.6 percent of vacant units were vacant because of availability for rent may suggest that rental properties in Springfield turnaround slowly. Unfortunately, the number of housing units that are vacant for reasons other than rental, sale, or seasonality is steadily increasing. The number of housing units that are vacant for reasons other than rental, sale, or seasonality increased from just above 1,000 in 2001 to above 2,000 by 2004. While the data does not allow us to definitively determine a cause for this increase, it likely reflects an increase in the number of abandoned residential properties in the city.
Springfield has a diverse mix of housing with both numerous single and multi-family residential structures. Nearly 30,000 housing units, 45.6 percent of the total, are in single-family buildings. Almost a third of housing units are in small multi-family buildings with between two and four units, while one in five housing units in Springfield are in buildings with five or more units.
Notably, Springfield’s housing stock, like that of many older industrial cities in New England, is old. More than half of the city’s housing stock was built before 1950 and 45.5 percent was built prior to 1940. Less than a quarter of the city’s housing stock was built in the last 35 years. This creates significant maintenance and upkeep challenges for the city’s homeowners and landlords, but it also reflects the presence of numerous historic homes across the city and is a source of the city’s moniker the “City of Homes.” Examining the relationship between the city’s housing stock and its residents, several things are immediately evident. First, the city’s white, non-Hispanic residents are much more likely to be homeowners than either Black or Hispanic residents. Nearly 20,000 of the city’s owner-occupied housing units are occupied by white, non-Hispanic households, more than double the number of the city’s other racial groups combined. In contrast, the Black and Hispanic populations of the city are renters of nearly twice as many properties as the white, non-Hispanic population. Furthermore, the white, non-Hispanic residents of the city are much more likely to live in single-family detached homes than nearly any other racial group. More than 60 percent of white, non-Hispanic households live in single-family homes, compared to less than 35 percent of Black households and less than 20 percent of Hispanic households. Nearly 20 percent of the city’s Hispanic households live in housing units in 3 and 4 unit structures, a higher percentage than for any other group. Relating housing and households to transportation, nearly 31 percent of Hispanic households do not have a vehicle available to them, compared to 24.5 percent of Black households and only 11.4 percent of white, non-Hispanic households.
Unsurprisingly, the rental population of the city is much younger than the owner population. Among households headed by individuals 25 to 34 years of age, nearly twice as
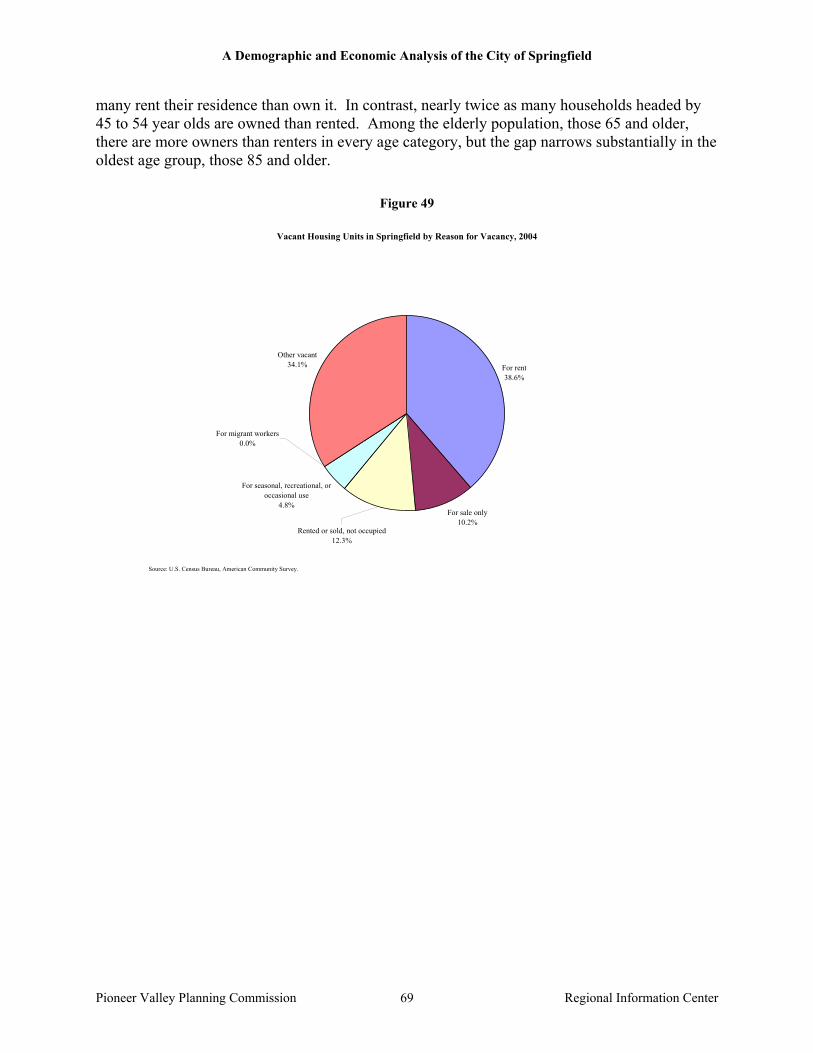
A Demographic and Economic Analysis of the City of Springfield
Pioneer Valley Planning Commission Regional Information Center 69
many rent their residence than own it. In contrast, nearly twice as many households headed by 45 to 54 year olds are owned than rented. Among the elderly population, those 65 and older, there are more owners than renters in every age category, but the gap narrows substantially in the oldest age group, those 85 and older.
Figure 49
Vacant Housing Units in Springfield by Reason for Vacancy, 2004
For rent38.6%
For sale only10.2%
For seasonal, recreational, or occasional use
4.8%
Other vacant34.1%
Rented or sold, not occupied12.3%
For migrant workers0.0%
Source: U.S. Census Bureau, American Community Survey.

A Demographic and Economic Analysis of the City of Springfield
Pioneer Valley Planning Commission Regional Information Center 70
Figure 50
Springfield Housing Units that are Vacant and not Seasonal, for Rent, or for Sale, 2001-2004
0
500
1,000
1,500
2,000
2,500
2001 2002 2003 2004
Hou
sing
Uni
ts
Source: U.S. Census Bureau, American Community Survey.
Figure 51
Springfield's Housing Units by Building Size, 2004
1, detached42.3%
1, attached3.3%
220.6%
3 or 411.0%
5 to 98.8%
10 to 192.1%
20 to 494.4%
50 or more6.2%
Mobile home1.1%
Boat, RV, van, etc.0.0%
Source: U.S. Census Bureau, American Community Survey.

A Demographic and Economic Analysis of the City of Springfield
Pioneer Valley Planning Commission Regional Information Center 71
Figure 52
Springfield Housing Units by Year Built, 2004
1995 to 19990.8%
1990 to 19941.8%
1980 to 19896.9%
1970 to 197911.4%
1960 to 19698.3%
1950 to 195916.8%
1940 to 19497.8%
1939 or earlier45.5%
2000 or later0.7%
Source: U.S. Census Bureau, American Community Survey.
Figure 53
Occupied Housing Units in Springfield by Race and Tenure Status, 2004
0
5,000
10,000
15,000
20,000
25,000
30,000
35,000
White, non-Hispanic Black Asian Hispanic
Hou
sing
Uni
ts
Renter-OccupiedOwner-Occupied
Source: U.S. Census Bureau, American Community Survey.
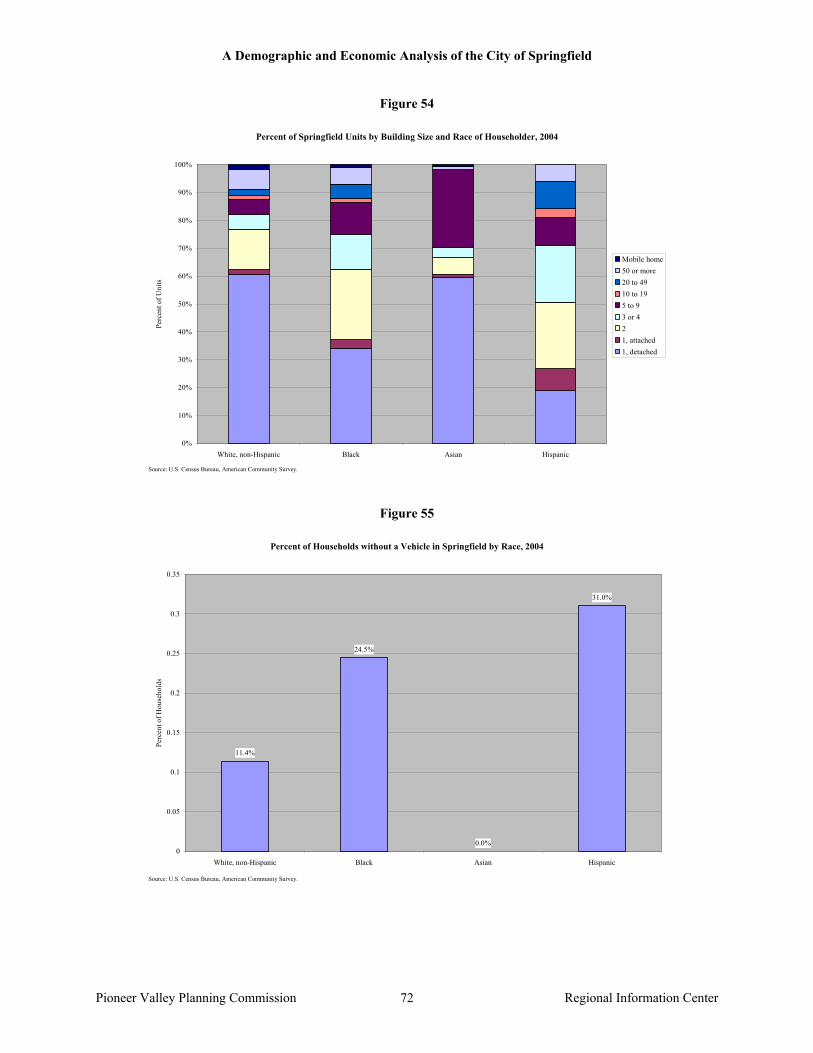
A Demographic and Economic Analysis of the City of Springfield
Pioneer Valley Planning Commission Regional Information Center 72
Figure 54
Percent of Springfield Units by Building Size and Race of Householder, 2004
0%
10%
20%
30%
40%
50%
60%
70%
80%
90%
100%
White, non-Hispanic Black Asian Hispanic
Perc
ent o
f Uni
ts
Mobile home50 or more20 to 4910 to 195 to 93 or 421, attached1, detached
Source: U.S. Census Bureau, American Community Survey.
Figure 55
Percent of Households without a Vehicle in Springfield by Race, 2004
11.4%
24.5%
0.0%
31.0%
0
0.05
0.1
0.15
0.2
0.25
0.3
0.35
White, non-Hispanic Black Asian Hispanic
Perc
ent o
f Hou
seho
lds
Source: U.S. Census Bureau, American Community Survey.

A Demographic and Economic Analysis of the City of Springfield
Pioneer Valley Planning Commission Regional Information Center 73
Figure 56
Springfield's Occupied Housing Units by Householder Age and Tenure Status, 2004
0
1,000
2,000
3,000
4,000
5,000
6,000
7,000
8,000
9,000
15 to 24 years 25 to 34 years 35 to 44 years 45 to 54 years 55 to 59 years 60 to 64 years 65 to 74 years 75 to 84 years 85 years andover
Hou
sing
Uni
ts
Owner-OccupiedRenter-Occupied
Source: U.S. Census Bureau, American Community Survey.

A Demographic and Economic Analysis of the City of Springfield
Pioneer Valley Planning Commission Regional Information Center 74
Residential Real Estate Market The market for single family homes in Springfield was devastated in the late 1980s and early 1990s as the number of sales of single family homes fell from about 1,200 in 1988 to under 800 by 1991 (overall a drop of 45.8 percent in number of sales over a four-year period). However, since 1991 the single family housing market in Springfield has improved considerably. Despite a brief decline in annual sales between 2000 and 2002, likely the result of the national economic recession, the city has seen steadily increasing sales from 1991 through 2005. An increase in number of sales is not always positive. If the number of sales is increasing because the community is becoming more transitional it could be detrimental to community cohesion. Data on the median sale price of single family homes suggests this may have occurred in Springfield through the 1990s. While the number of sales increased steadily from 1991 through 2000, the median sale price of a single family home (in inflation-adjusted 2005 dollars) fell from $123,771 in 1991 to $76,100 by 1996. In a span of five years, the median single family home in Springfield lost 38.5 percent of its market value. This may indicate that the increase in sales during the early 1990s was a result of houses turning over quickly without values increasing. Positively, since 1996 the median price of single family homes in Springfield has increased steadily, reaching $135,000 by 2005, making up the losses since 1991. If median single family prices continue to rise as they have since 1996, the median price of a single family home in Springfield will reach nearly $160,000 by 2010. With the precipitous drop in the number of single-family homes sold per year, and a simultaneous drop in prices, during the late 1980s and early 1990s, the pace of housing construction slackened. In 1987, 317 permits were pulled for the construction of single-family homes in Springfield, but by 1996 the number of permits pulled for the year was only 31 (a drop of 90.2 percent). Since 1996, there has been a resurgence in the construction of single-family housing units, but annual numbers of permits have not nearly reached their 1987 peak. In 2004, 163 permits were pulled for the construction of new single-family housing units and this dropped slightly to 126 permits in 2005. It is unsurprising that the pace of new single-family construction began to increase at the same time, in 1996, that the median price of single-family homes began climbing. Unlike single-family new construction, the construction of new multi-family residential units has not recovered nearly as well from the late 1980s plunge. Multi-family unit construction peaked in 1987 with permits pulled for 588 units. By 1991 this number had fallen by 88.8 percent to only 66 units permitted. The number of multi-family units permitted remained low and continued fluctuating until it hit bottom with only four units permitted in the year 2000. Since 2000 there has been some recovery in the number of multi-family units permitted as the number increased to 86 units by 2005, though this remains 85.4 percent below the peak in 1987.

A Demographic and Economic Analysis of the City of Springfield
Pioneer Valley Planning Commission Regional Information Center 75
Figure 57
Number of Single-Family Home Sales in Springfield, 1988-2005
0
200
400
600
800
1,000
1,200
1,400
1,600
1,800
2,000
1988 1989 1990 1991 1992 1993 1994 1995 1996 1997 1998 1999 2000 2001 2002 2003 2004 2005
Sale
s
Source: The Warren Group
Figure 58
Median Sale Price of Single-Family Homes in Springfield, 1988-2005
$0
$20,000
$40,000
$60,000
$80,000
$100,000
$120,000
$140,000
$160,000
$180,000
1988 1989 1990 1991 1992 1993 1994 1995 1996 1997 1998 1999 2000 2001 2002 2003 2004 2005
Med
ian
Pric
e (2
005
$)
Source: The Warren Group

A Demographic and Economic Analysis of the City of Springfield
Pioneer Valley Planning Commission Regional Information Center 76
Figure 59
Building Permits Issued for Housing Units in Springfield, 1985-2005
0
100
200
300
400
500
600
700
1985 1987 1989 1991 1993 1995 1997 1999 2001 2003 2005
Num
ber o
f Uni
ts
Units in Single-Family StructuresUnits in All Multi-Family Structures
Source: U.S. Department of Housing and Urban Development, State of the Cities Data System.
A Demographic and Economic Analysis of the City of Springfield
Pioneer Valley Planning Commission Regional Information Center 77
Residential Real Estate Costs While housing costs facing renters in Springfield have not increased as much as has been the case across Massachusetts, the median gross rent for Springfield renters, after adjusting for inflation, rose by 8.8 percent between 2000 and 2004. This increase means renting at the median price in Springfield increased by $52 per month or $624 per year. While this may not seem substantial, it is reflected in the percentage of Springfield renters whose housing is considered unaffordable. Housing analysts generally consider housing to be affordable if it costs less than 30 percent of their gross income. As of 2004, more than half (54.7 percent) of Springfield’s households that rented their home were spending more than 30 percent of their income on housing, up from 46.3 percent in 2001. Perhaps even more troubling, 29.4 percent of Springfield’s renting households paid more than 50 percent of their income in rent, up from 24.4 percent in 2001. Comparing owners and renters in Springfield, it becomes immediately obvious that owning a home in Springfield is relatively affordable and renting is less affordable. For example, while 53.1 percent of renters pay 30 percent or more of their income in housing costs, only 34.0 percent of home owners pay such a large percentage of their income for housing. For obvious reasons, owners without mortgages pay the least for housing and only 16.1 percent of this group pay more than 30 percent of their income in housing costs. The evident unaffordability of renting in Springfield is likely a result of the low incomes of those households renting their homes. Housing prices are low enough that those who can assemble the necessary capital are generally able to purchase a home and not face exorbitant monthly costs relative to their income. On the other hand, rent is high enough that those with low incomes and an inability to purchase a home are likely to pay a large portion of their income for housing. Despite rising housing costs and the generally lower incomes of Springfield residents, there does not appear to have been an increase in mortgage foreclosures in Springfield in the recent past. Between 1997 and 2005 the overall number of foreclosures in Springfield fluctuated between 620 in 1997 and 407 in 2003. Since the low point in 2003 the annual number of foreclosures in Springfield has increased slowly, to 467 in 2004 and 560 in 2005. It is possible that this recent increase reflects a trend that may continue as housing prices and the activities of predatory lenders grow. Analyzing the number of foreclosures per 1,000 residents of Springfield further suggests that the 2003 to 2005 increase in foreclosures is a real phenomena that is different than the otherwise steady rate of foreclosures between 1993 and 2003. Furthermore, the number of tax liens levied against properties in Springfield, per 1,000 residents has increased dramatically from 2.25 tax liens per 1,000 residents in 2002 to 4.64 in 2005 (an increase of 106.2 percent). The increase in tax liens reflects more aggressive activity on the part of the City. Perhaps more troubling is the increase in the number of bankruptcies filed per person in Springfield. The rate rose from 0.67 in 2001 to 7.81 in 2005. It is possible that the dramatic increase from 2004 to 2005 was a result of the Federal changes in bankruptcy laws that prompted many people to file before the new law came into effect. Nevertheless, there is some reason to believe that Springfield residents are facing increasingly challenge financial situations.
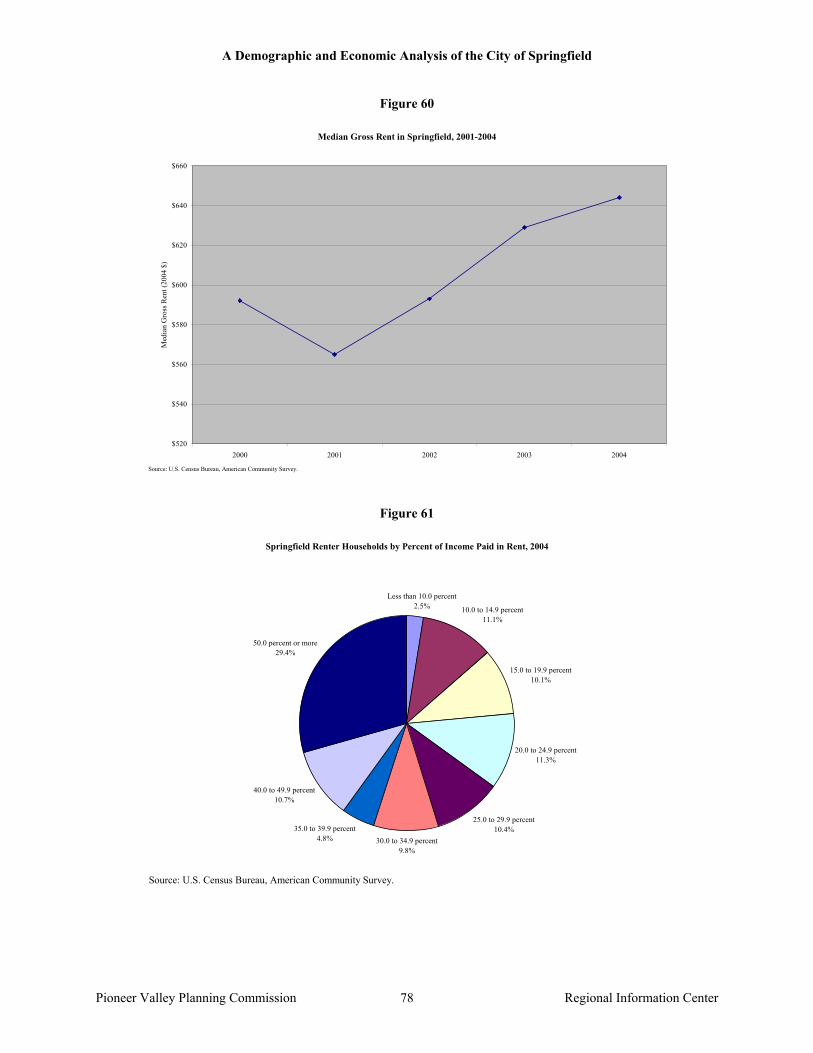
A Demographic and Economic Analysis of the City of Springfield
Pioneer Valley Planning Commission Regional Information Center 78
Figure 60
Median Gross Rent in Springfield, 2001-2004
$520
$540
$560
$580
$600
$620
$640
$660
2000 2001 2002 2003 2004
Med
ian
Gro
ss R
ent (
2004
$)
Source: U.S. Census Bureau, American Community Survey.
Figure 61
Springfield Renter Households by Percent of Income Paid in Rent, 2004
Less than 10.0 percent2.5% 10.0 to 14.9 percent
11.1%
15.0 to 19.9 percent10.1%
20.0 to 24.9 percent11.3%
25.0 to 29.9 percent10.4%
30.0 to 34.9 percent9.8%
35.0 to 39.9 percent4.8%
40.0 to 49.9 percent10.7%
50.0 percent or more29.4%
Source: U.S. Census Bureau, American Community Survey.
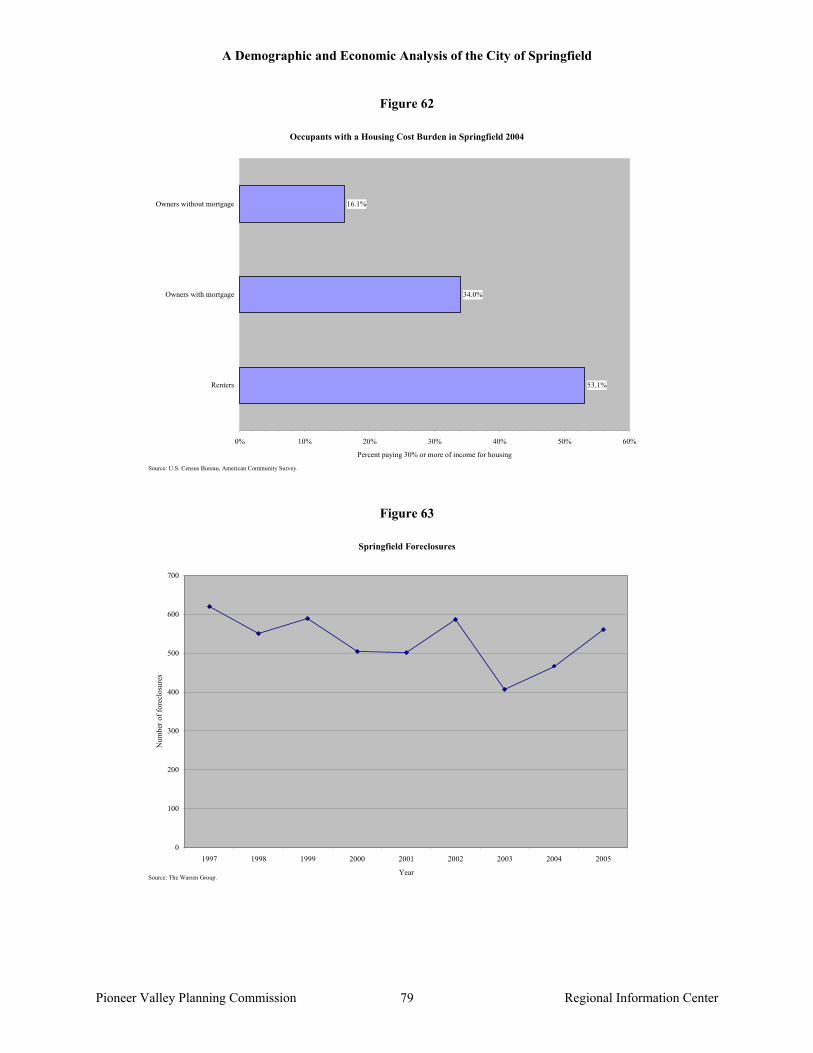
A Demographic and Economic Analysis of the City of Springfield
Pioneer Valley Planning Commission Regional Information Center 79
Figure 62
Occupants with a Housing Cost Burden in Springfield 2004
53.1%
34.0%
16.1%
0% 10% 20% 30% 40% 50% 60%
Renters
Owners with mortgage
Owners without mortgage
Percent paying 30% or more of income for housing
Source: U.S. Census Bureau, American Community Survey.
Figure 63
Springfield Foreclosures
0
100
200
300
400
500
600
700
1997 1998 1999 2000 2001 2002 2003 2004 2005
Year
Num
ber o
f for
eclo
sure
s
Source: The Warren Group.
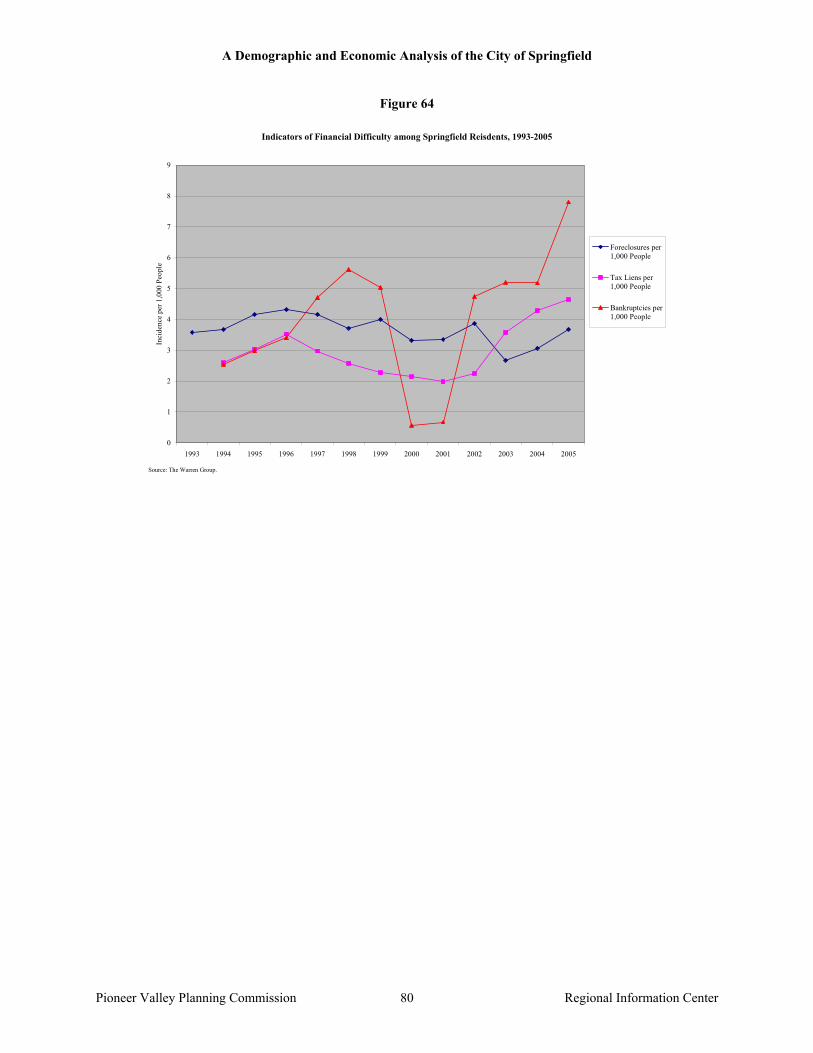
A Demographic and Economic Analysis of the City of Springfield
Pioneer Valley Planning Commission Regional Information Center 80
Figure 64
Indicators of Financial Difficulty among Springfield Reisdents, 1993-2005
0
1
2
3
4
5
6
7
8
9
1993 1994 1995 1996 1997 1998 1999 2000 2001 2002 2003 2004 2005
Inci
denc
e pe
r 1,0
00 P
eopl
e
Foreclosures per1,000 People
Tax Liens per1,000 People
Bankruptcies per1,000 People
Source: The Warren Group.

A Demographic and Economic Analysis of the City of Springfield
Pioneer Valley Planning Commission Regional Information Center 81
Springfield Office Space Springfield has substantial office space capacity in Classes A, B, and C. Class A office space was constructed after 1965 and is maintained by professional management; Class B office space was either built before 1965, rehabbed, and maintained by professional management, or was built after 1965 and is maintained by moderate quality management; and, Class C office space was built before 1965 and is maintained by moderate quality management. Since 1994, the office space market in Springfield has generally tightened with falling vacancy rates. For example, between 1994 and 2003, the vacancy rate for Class C office space in Springfield fell from 44.3 percent to 28.4 percent. Class A office space is in particularly short supply with vacancy rates remaining below seven percent between 1998 and 2003. Nevertheless, the fact that nearly one-third of Class C office space and 16.0 percent of Class B office space was vacant in 2003 indicates that there is sufficient capacity to accommodate growth, particularly that of small businesses that are not likely in the market for Class A space.
Positively, when comparing Springfield office vacancy rates with that of Greater Springfield, the rates for both Class A and Class C are lower in Springfield than in the region as a whole. This suggests that office space of these two classes is easier to lease in Springfield than in the remainder of the region. The vacancy rates for Class B office space are similar with the region having a somewhat lower rate. In total, there was 471,280 square feet of vacant office space in Springfield in 2003.
Class A office space in Springfield leases for between $16 and $18.50 per square foot, somewhat higher than the $12 to $21 per square foot rates in the region as a whole. Class B office space in Springfield leases for about the same amount as Class B space across the region, between $8 and $13 per square foot. It is Class C office space that is a bargain in Springfield with lease rates ranging from $6 to $8 compared to regional rates from $6 to $14. New business development and entrepreneurship should be encouraged in an environment in which businesses can find, for example, 2,500 square feet of professionally managed (Class B) office space for $20,000 per year.

A Demographic and Economic Analysis of the City of Springfield
Pioneer Valley Planning Commission Regional Information Center 82
Figure 65
Springfield Office Space Vacancy Rates by Class
0%
10%
20%
30%
40%
50%
60%
1994 1995 1996 1997 1998 1999 2000 2001 2002 2003
Vac
ancy
Rat
e
Class AClass BClass C
Source: Colebrook Realty Group.
Figure 66
Comparing Springfield Office Space Vacancy Rates with Greater Springfield, 2003
0%
5%
10%
15%
20%
25%
30%
35%
Class A Class B Class C
Vac
ancy
Rat
e
SpringfieldGreater Springfield Area
Source: Colebrook Realty Group.
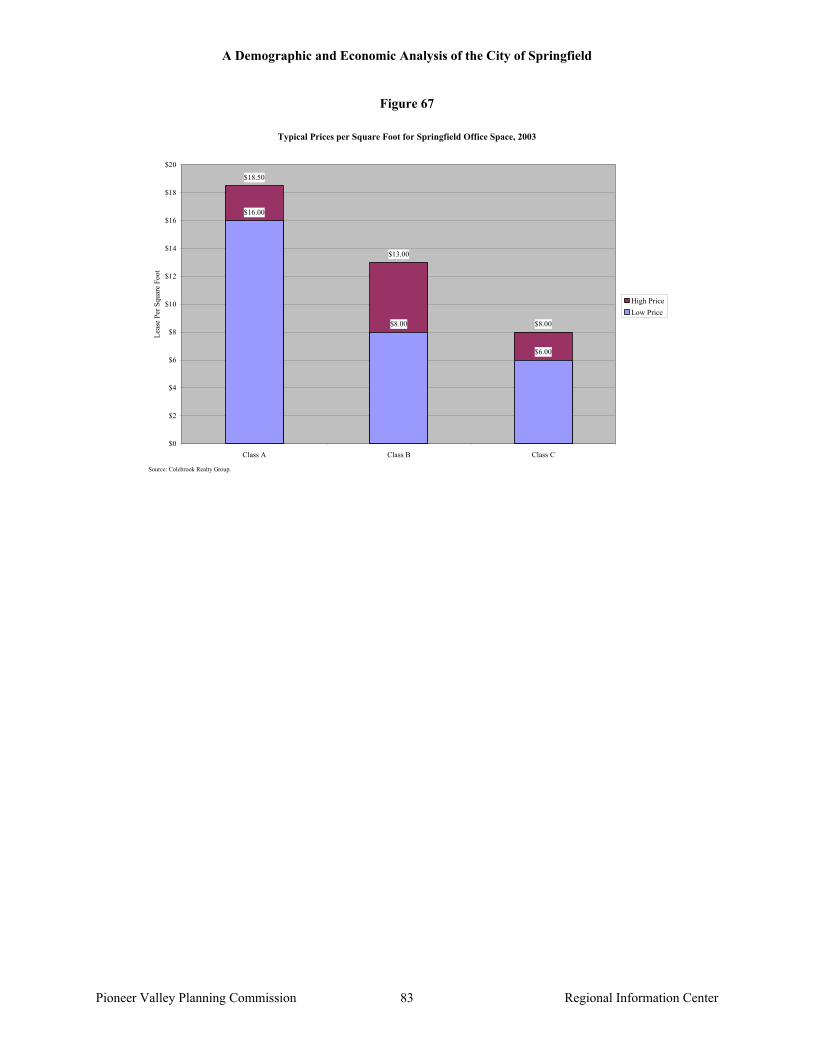
A Demographic and Economic Analysis of the City of Springfield
Pioneer Valley Planning Commission Regional Information Center 83
Figure 67
Typical Prices per Square Foot for Springfield Office Space, 2003
$18.50
$13.00
$8.00
$16.00
$8.00
$6.00
$0
$2
$4
$6
$8
$10
$12
$14
$16
$18
$20
Class A Class B Class C
Leas
e Pe
r Squ
are
Foot
High PriceLow Price
Source: Colebrook Realty Group.
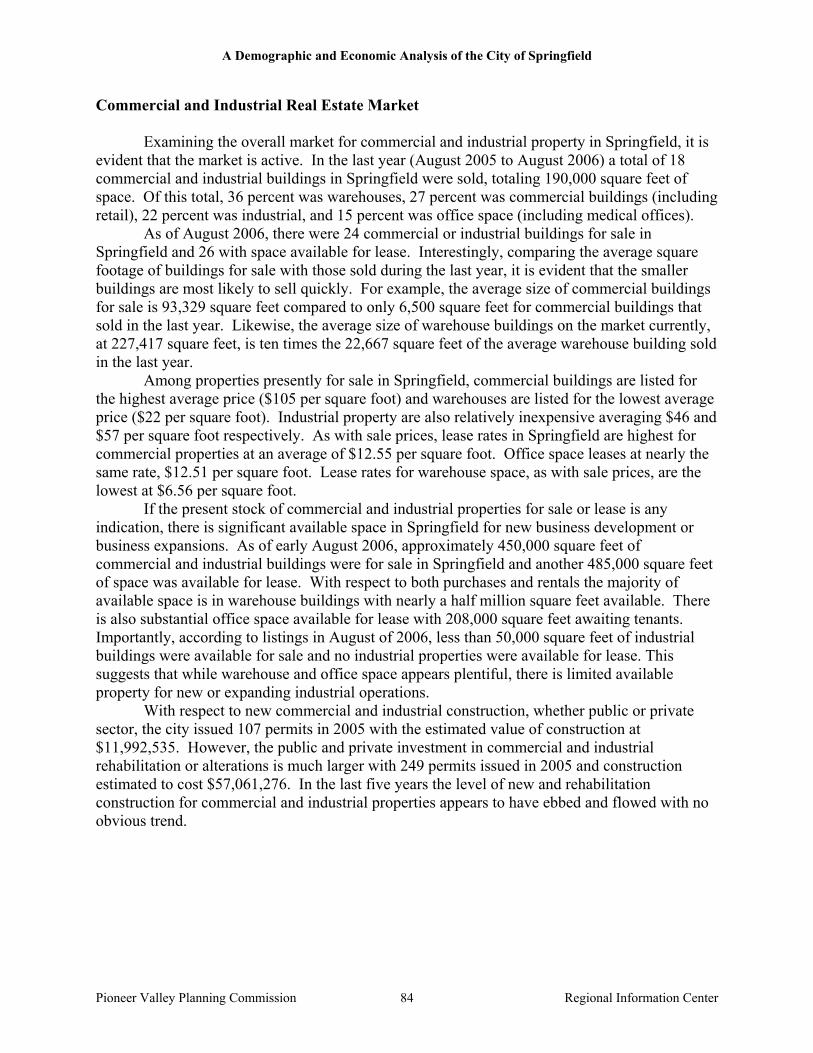
A Demographic and Economic Analysis of the City of Springfield
Pioneer Valley Planning Commission Regional Information Center 84
Commercial and Industrial Real Estate Market Examining the overall market for commercial and industrial property in Springfield, it is evident that the market is active. In the last year (August 2005 to August 2006) a total of 18 commercial and industrial buildings in Springfield were sold, totaling 190,000 square feet of space. Of this total, 36 percent was warehouses, 27 percent was commercial buildings (including retail), 22 percent was industrial, and 15 percent was office space (including medical offices). As of August 2006, there were 24 commercial or industrial buildings for sale in Springfield and 26 with space available for lease. Interestingly, comparing the average square footage of buildings for sale with those sold during the last year, it is evident that the smaller buildings are most likely to sell quickly. For example, the average size of commercial buildings for sale is 93,329 square feet compared to only 6,500 square feet for commercial buildings that sold in the last year. Likewise, the average size of warehouse buildings on the market currently, at 227,417 square feet, is ten times the 22,667 square feet of the average warehouse building sold in the last year. Among properties presently for sale in Springfield, commercial buildings are listed for the highest average price ($105 per square foot) and warehouses are listed for the lowest average price ($22 per square foot). Industrial property are also relatively inexpensive averaging $46 and $57 per square foot respectively. As with sale prices, lease rates in Springfield are highest for commercial properties at an average of $12.55 per square foot. Office space leases at nearly the same rate, $12.51 per square foot. Lease rates for warehouse space, as with sale prices, are the lowest at $6.56 per square foot. If the present stock of commercial and industrial properties for sale or lease is any indication, there is significant available space in Springfield for new business development or business expansions. As of early August 2006, approximately 450,000 square feet of commercial and industrial buildings were for sale in Springfield and another 485,000 square feet of space was available for lease. With respect to both purchases and rentals the majority of available space is in warehouse buildings with nearly a half million square feet available. There is also substantial office space available for lease with 208,000 square feet awaiting tenants. Importantly, according to listings in August of 2006, less than 50,000 square feet of industrial buildings were available for sale and no industrial properties were available for lease. This suggests that while warehouse and office space appears plentiful, there is limited available property for new or expanding industrial operations. With respect to new commercial and industrial construction, whether public or private sector, the city issued 107 permits in 2005 with the estimated value of construction at $11,992,535. However, the public and private investment in commercial and industrial rehabilitation or alterations is much larger with 249 permits issued in 2005 and construction estimated to cost $57,061,276. In the last five years the level of new and rehabilitation construction for commercial and industrial properties appears to have ebbed and flowed with no obvious trend.

A Demographic and Economic Analysis of the City of Springfield
Pioneer Valley Planning Commission Regional Information Center 85
Figure 68
Total Square Footage of Buildings Sold in Springfield in the last Year by Type, 2006
Commercial5200027%
Industrial4100022%Office
2900015%
Warehouse6800036%
Source: PVPC analysis of data from www.loopnet.com.
Figure 69
Average Square Footage of Buildings in Springfield Sold and Listed for Sale, 2006
0
50,000
100,000
150,000
200,000
250,000
Commercial Industrial Office Warehouse
Ave
rage
Squ
are
Feet
Properties Sold in the Last YearProperties Currently Listed
Source: PVPC analysis of data from www.loopnet.com.

A Demographic and Economic Analysis of the City of Springfield
Pioneer Valley Planning Commission Regional Information Center 86
Figure 70
Average Price per Square Foot for Buildings for Sale in Springfield by Type, 2006
$0
$20
$40
$60
$80
$100
$120
Commercial Industrial Office Warehouse
Pric
e pe
r Squ
are
Foot
Source: PVPC analysis of data from www.loopnet.com.
Figure 71
Average Prices per Square Foot for Buildings available for Lease in Springfield by Type, 2006
$0
$2
$4
$6
$8
$10
$12
$14
Commercial Office Warehouse
Lea
se p
er S
quar
e Fo
ot
Source: PVPC analysis of data from www.loopnet.com.

A Demographic and Economic Analysis of the City of Springfield
Pioneer Valley Planning Commission Regional Information Center 87
Figure 72
Square Footage of Buildings Available for Sale or Lease in Springfield by Type, 2006
99,329
18,372
49,279
78,074
208,431
227,417258,700
0
100,000
200,000
300,000
400,000
500,000
600,000
For Sale For Lease
Squa
re F
eet
WarehouseOfficeIndustrialCommercial
Source: PVPC analysis of data from www.loopnet.com.

A Demographic and Economic Analysis of the City of Springfield
Pioneer Valley Planning Commission Regional Information Center 88
Brownfields Revitalization One opportunity for future commercial and industrial development in Springfield could be realized in the clean-up and return to productive use of the city’s environmentally contaminated brownfields. Excluding residential properties with environmental contamination and commercial and industrial properties that are not in any way tax delinquent, there are an estimated 53 brownfields in Springfield. Of these, 15 have been confirmed to be brownfields by the Massachusetts Department of Environmental Protection, while 38 are suspected sites. Positively, the 15 confirmed sites represent 74 percent of the suspected commercial and industrial brownfield land, meaning the largest sites have been confirmed. For the purposes of redevelopment, 80 percent of all brownfields land area is already municipally-owned having gone through the tax title and foreclosure process. Of the remaining 24 properties and 20 percent of land area, the city has taken 14 of the properties into Land Court for purposes of eventual foreclosure. While only six of the 53 brownfields have even had a site assessment and only four have begun any clean-up or remediation process, these six properties alone represent 55 percent of the city’s commercial and industrial brownfields land area. This suggests that the City is effectively prioritizing those brownfields with the greatest potential for redevelopment.
Table 14: Analysis of Springfield’s Commercial and Industrial Brownfields
Summary of Springfield Brownfields Number of Sites Percent
Percent of Land
Area Suspect Brownfields 38 72% 26%
DEP21E Brownfields 15 28% 74%
Total Number of Brownfields 53 100% 100%
Distribution of Brownfields by Occupancy, Tax Status and Clean-Up Status
Distribution of Brownfields Number of Sites Percent
Percent of Land
Area Occupancy Occupied Brownfield Sites 4 8% 5% Vacant Brownfield Sites 49 92% 95% Tax Status Municipally Owned (foreclosed) 29 55% 80% Land Court 14 26% 6% Tax Lien 10 19% 14% Clean-Up Status No Clean Up or Assessment So Far 9 17% 20% Comprehensive Site Assessment 2 4% 5% Implementation of Clean-Up 2 4% 31% Continuous Maintenance and/or Monitoring 0 0% 0% Activity and Use Limitation (AUL) 2 4% 19% Undocumented 38 72% 26%
Source: PVPC analysis of Springfield brownfield’s inventory.

A Demographic and Economic Analysis of the City of Springfield
Pioneer Valley Planning Commission Regional Information Center 89
Figure 73
Tax Status of Springfield Brownfields, 2006
Municipally Owned (foreclosed)29
55%
Land Court14
26%
Tax Lien10
19%
Source: PVPC Brownfields Inventory

A Demographic and Economic Analysis of the City of Springfield
Pioneer Valley Planning Commission Regional Information Center 90
Analyzing Labor Supply and Demand Occupational Overview
The predominant industry sector in which Springfield residents work is health care and social assistance, an industry that employs 16.8 percent of the city’s working population. Manufacturing is the second largest employer of Springfield residents (13.6 percent), followed by retail trade (10.0 percent), and educational services (8.7 percent).
Data from the 2000 Census Transportation Planning Package indicates that most of Springfield’s workers are employed within Hampden County, suggesting that the jobs available in the county provide a good benchmark to evaluate the present employment dynamics of Springfield residents. Overall, using the best estimate from the American Community Survey, the percentage of Springfield residents employed in most industry sectors is fairly consistent with the distribution of available jobs. Springfield residents differ substantially from the distribution of jobs only in two of the smallest sectors – the utilities sector and the arts, entertainment, and recreation sector. Springfield residents were more likely to be employed in utilities, which represents 0.8 percent of the jobs in the county, but employs 1.6 percent of Springfield residents, and less likely to be employed in arts, entertainment and recreation, which employs 1.9 percent of county residents, but only 0.8 percent of the Springfield labor force. Springfield residents were also slightly more likely to be employed in the professional, scientific, and technical sector, as well as within public administration.
While the industries in which Springfield residents work tend to be relatively consistent with the distribution of jobs in Hampden County, the primary occupations of Springfield residents differ from those of county residents overall. More Springfield workers are employed in sales and office occupations (25.7 percent) than any other category followed by management, professional and related (24.5 percent), and service (23.5 percent). For county residents, however, management, professional and related occupations are the most common, employing 31.4 percent of the population. Instead of being employed in management and professional positions, Springfield residents are more likely to be employed in service occupations. The percentage of Springfield residents engaged in sales and office occupations is consistent with county averages.
This trend is particularly evident in the health and social assistance sector, a critical employer in the region with regard to size and growth potential. Only 29.0 percent of Springfield residents who work in the sector hold management and professional positions, while 53.1 percent work in service occupations. For Hampden County residents overall, the distribution is 45.3 percent in management and professional occupations and 36.7 percent in service occupations.
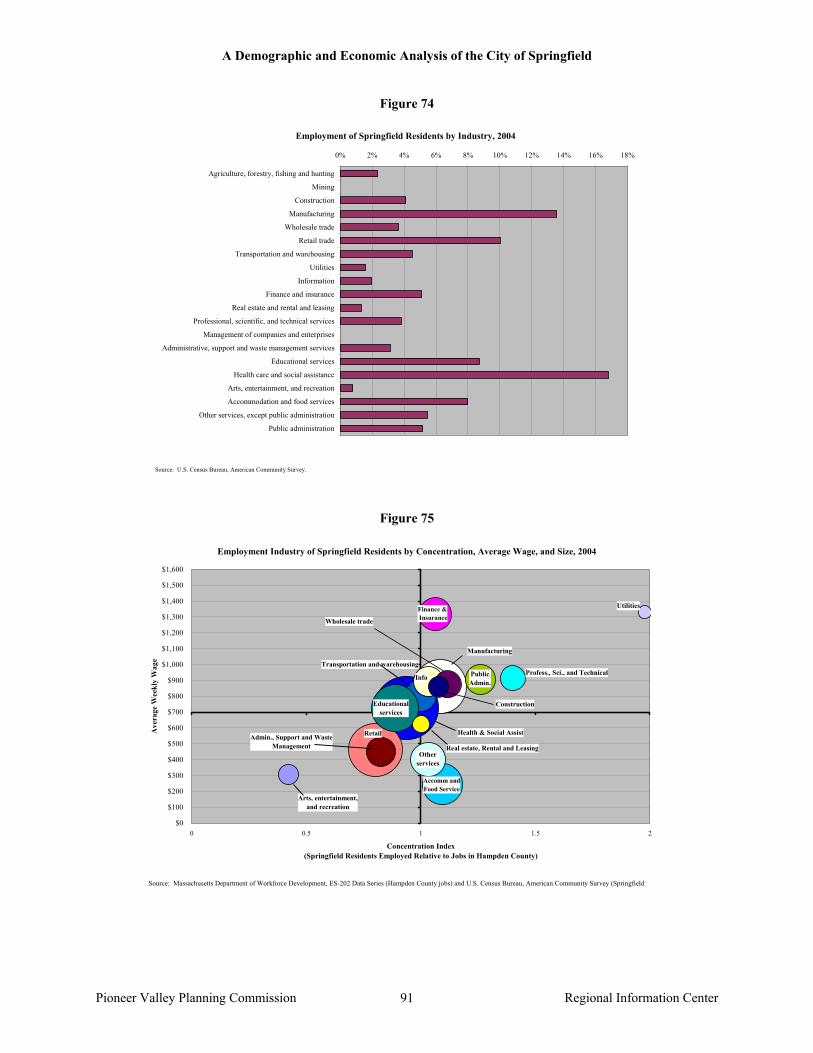
A Demographic and Economic Analysis of the City of Springfield
Pioneer Valley Planning Commission Regional Information Center 91
Figure 74
Employment of Springfield Residents by Industry, 2004
0% 2% 4% 6% 8% 10% 12% 14% 16% 18%
Agriculture, forestry, fishing and hunting
Mining
Construction
Manufacturing
Wholesale trade
Retail trade
Transportation and warehousing
Utilities
Information
Finance and insurance
Real estate and rental and leasing
Professional, scientific, and technical services
Management of companies and enterprises
Administrative, support and waste management services
Educational services
Health care and social assistance
Arts, entertainment, and recreation
Accommodation and food services
Other services, except public administration
Public administration
Source: U.S. Census Bureau, American Community Survey.
Figure 75
Employment Industry of Springfield Residents by Concentration, Average Wage, and Size, 2004
Manufacturing
Health & Social Assist
Transportation and warehousing
UtilitiesFinance & Insurance
Retail
Construction
Profess., Sci., and TechnicalPublic Admin.
Wholesale trade
Admin., Support and Waste Management
Educational services
Arts, entertainment, and recreation
Accomm and Food Service
Other services
Real estate, Rental and Leasing
Info
$0
$100
$200
$300
$400
$500
$600
$700
$800
$900
$1,000
$1,100
$1,200
$1,300
$1,400
$1,500
$1,600
0 0.5 1 1.5 2
Concentration Index (Springfield Residents Employed Relative to Jobs in Hampden County)
Ave
rage
Wee
kly
Wag
e
Source: Massachusetts Department of Workforce Development, ES-202 Data Series (Hampden County jobs) and U.S. Census Bureau, American Community Survey (Springfield

A Demographic and Economic Analysis of the City of Springfield
Pioneer Valley Planning Commission Regional Information Center 92
Figure 76
Occupations of Springfield Residents Relative to Hampden County Overall, 2004
0%
5%
10%
15%
20%
25%
30%
35%
Management,Professional, and
Related
Service Occupations Sales and Office Fishing, Farming, andForestry
Construction,extraction,
maintenance and repair
Production,transportation, andmaterial moving
Perc
ent o
f Wor
kfor
ce E
nage
d in
Occ
upat
ion
SpringfieldHampden County
Source: U.S. Census Bureau, American Community Survey.
Figure 77
Occupations of Health Care Workers by Residence
0.0
5.0
10.0
15.0
20.0
25.0
30.0
35.0
Physicians andsurgeons
Registered nurses Therapists Other healthdiagnosing and
treatingpractitioners and
technicaloccupations
Healthtechnologists and
technicians
Nursing,psychiatric, and
home health aides
Occupational andphysical therapist
assistants andaides
Other healthcaresupport
occupations
Empl
oym
ent p
er 1
00 H
ealth
and
Soc
ial A
ssis
tanc
e W
orke
rs
Springfield ResidentsHampden County Overall
Source: U.S. Census Bureau, 2004 American Communities Survey

A Demographic and Economic Analysis of the City of Springfield
Pioneer Valley Planning Commission Regional Information Center 93
Occupational Gaps In order to help communities maintain workforce competitiveness, the U.S. Bureau of Labor Statistics produces projections of occupational employment levels through 2014. It should be noted that these figures represent national averages, as opposed to a projection for a specific community, and as a result, Springfield’s future occupational needs may differ somewhat. However, such projections do provide a good benchmark from which to address likely gaps in occupational qualification and the professional development that will be necessary to accommodate changes in the economy over time.
Based on this data, it appears that in order for the Springfield labor market to meet the demands of future employers, residents will need to develop skills in a number of growing and emerging career fields. In particular, management, financial, and professional fields requiring bachelor’s and professional degrees will grow in importance over time. As a result, the city will need to increase the percentage of its labor force with a bachelors degree over the next decade to be competitive in this projected labor market. Possible strategies include initiatives aimed at retaining a larger percentage of new graduates from its educational institutions and increasing the percentage of current residents that have access to a four-year degree. In order to meet these challenges public schools will need to improve both student performance on the MCAS test and the percentage of students engaged in college preparatory programs. Efforts to increase the affordability of four-year college attendance for city residents interested in studying finance, management, and nursing in the form of city-wide public and private scholarship initiatives targeted toward Springfield residents intending to enter these fields could be an effective strategy.
Projected employment for registered nurses and healthcare practitioners exceeds the current percent of the Springfield labor force educated for and participating in these careers. On the other hand, projected employment for healthcare support careers in 2014 is lower than the current percentage of Springfield workers engaged in the field. This suggests that professional development within the health care field, helping those already engaged in or training for nursing assistance careers become certified as nurses by obtaining a bachelors or an associates degree in the field, might be necessary to help meet the needs of the future..
Another important finding is that the Bureau of Labor Statistics projects continued declines in manufacturing employment. Because a large percentage of Springfield residents participate in production-related occupations and other related employment in the industry, helping displaced manufacturing workers transition into other types of employment will be a continuing challenge for city officials. Growing fields with predicted labor gaps, such as transportation, construction, and installation, maintenance and repair may serve as potential fields for retraining.
It should be noted, however, that Springfield does appear to have a concentration of employment in metal-working and products manufacturing that may not disappear as the national projections suggest. Consequently, the city may continue to have higher employment in this occupation than the national average, and apprenticeships and vocational programs that help residents prepare for metal-machining jobs should not be discontinued based on these projections.
Finally, office and administrative support occupations will remain large job categories in the future, with roughly the same percentage of employment as is currently observed among
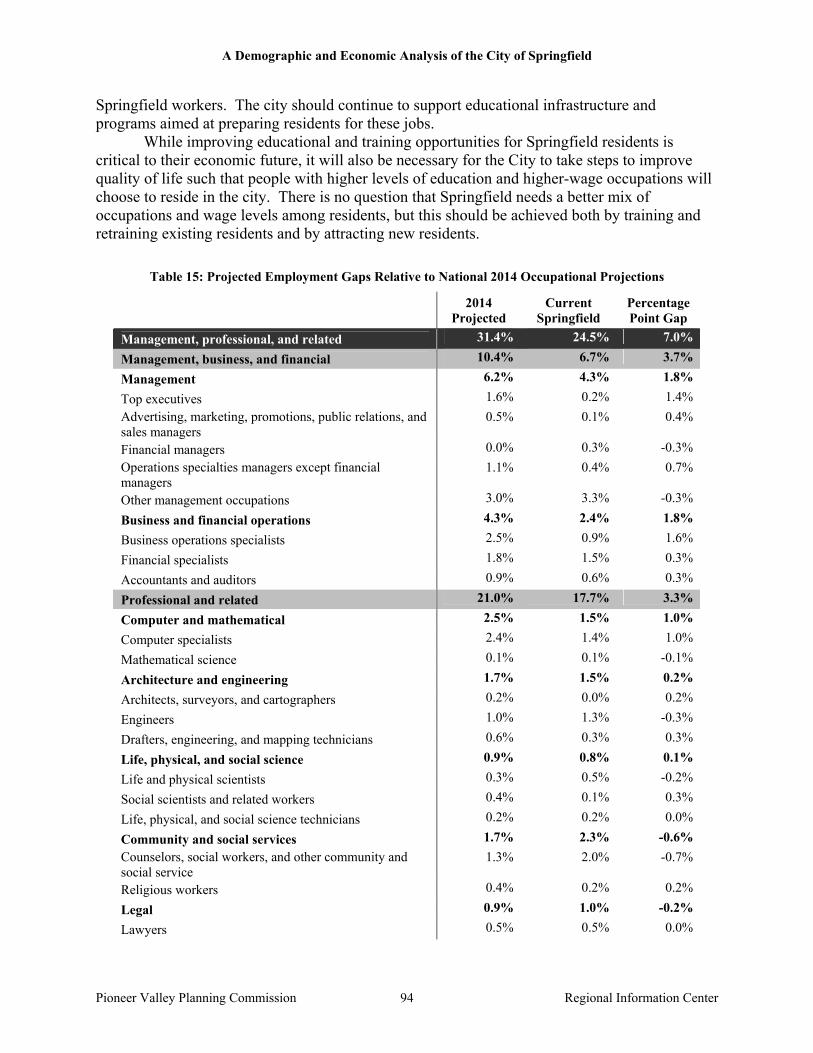
A Demographic and Economic Analysis of the City of Springfield
Pioneer Valley Planning Commission Regional Information Center 94
Springfield workers. The city should continue to support educational infrastructure and programs aimed at preparing residents for these jobs.
While improving educational and training opportunities for Springfield residents is critical to their economic future, it will also be necessary for the City to take steps to improve quality of life such that people with higher levels of education and higher-wage occupations will choose to reside in the city. There is no question that Springfield needs a better mix of occupations and wage levels among residents, but this should be achieved both by training and retraining existing residents and by attracting new residents.
Table 15: Projected Employment Gaps Relative to National 2014 Occupational Projections
2014 Projected
Current Springfield
Percentage Point Gap
Management, professional, and related 31.4% 24.5% 7.0%
Management, business, and financial 10.4% 6.7% 3.7%
Management 6.2% 4.3% 1.8%
Top executives 1.6% 0.2% 1.4% Advertising, marketing, promotions, public relations, and sales managers
0.5% 0.1% 0.4%
Financial managers 0.0% 0.3% -0.3% Operations specialties managers except financial managers
1.1% 0.4% 0.7%
Other management occupations 3.0% 3.3% -0.3%
Business and financial operations 4.3% 2.4% 1.8%
Business operations specialists 2.5% 0.9% 1.6%
Financial specialists 1.8% 1.5% 0.3%
Accountants and auditors 0.9% 0.6% 0.3%
Professional and related 21.0% 17.7% 3.3%
Computer and mathematical 2.5% 1.5% 1.0%
Computer specialists 2.4% 1.4% 1.0%
Mathematical science 0.1% 0.1% -0.1%
Architecture and engineering 1.7% 1.5% 0.2%
Architects, surveyors, and cartographers 0.2% 0.0% 0.2%
Engineers 1.0% 1.3% -0.3%
Drafters, engineering, and mapping technicians 0.6% 0.3% 0.3%
Life, physical, and social science 0.9% 0.8% 0.1%
Life and physical scientists 0.3% 0.5% -0.2%
Social scientists and related workers 0.4% 0.1% 0.3%
Life, physical, and social science technicians 0.2% 0.2% 0.0%
Community and social services 1.7% 2.3% -0.6% Counselors, social workers, and other community and social service
1.3% 2.0% -0.7%
Religious workers 0.4% 0.2% 0.2%
Legal 0.9% 1.0% -0.2%
Lawyers 0.5% 0.5% 0.0%
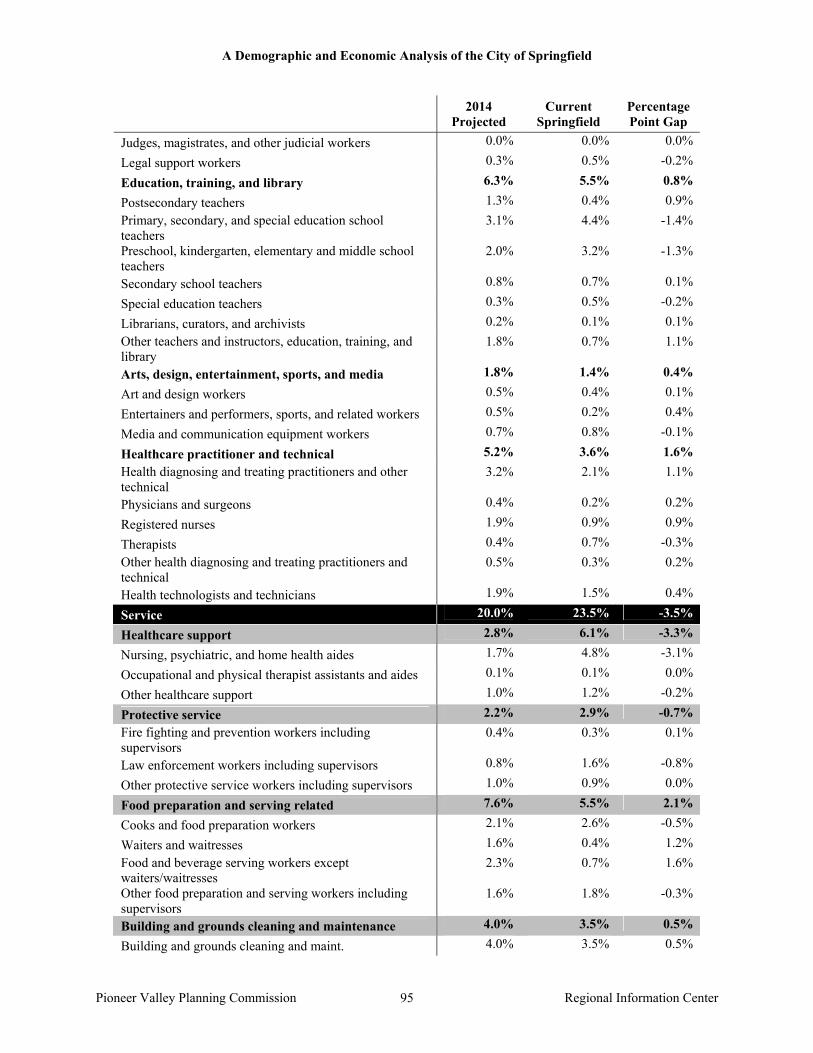
A Demographic and Economic Analysis of the City of Springfield
Pioneer Valley Planning Commission Regional Information Center 95
2014 Projected
Current Springfield
Percentage Point Gap
Judges, magistrates, and other judicial workers 0.0% 0.0% 0.0%
Legal support workers 0.3% 0.5% -0.2%
Education, training, and library 6.3% 5.5% 0.8%
Postsecondary teachers 1.3% 0.4% 0.9% Primary, secondary, and special education school teachers
3.1% 4.4% -1.4%
Preschool, kindergarten, elementary and middle school teachers
2.0% 3.2% -1.3%
Secondary school teachers 0.8% 0.7% 0.1%
Special education teachers 0.3% 0.5% -0.2%
Librarians, curators, and archivists 0.2% 0.1% 0.1% Other teachers and instructors, education, training, and library
1.8% 0.7% 1.1%
Arts, design, entertainment, sports, and media 1.8% 1.4% 0.4%
Art and design workers 0.5% 0.4% 0.1%
Entertainers and performers, sports, and related workers 0.5% 0.2% 0.4%
Media and communication equipment workers 0.7% 0.8% -0.1%
Healthcare practitioner and technical 5.2% 3.6% 1.6% Health diagnosing and treating practitioners and other technical
3.2% 2.1% 1.1%
Physicians and surgeons 0.4% 0.2% 0.2%
Registered nurses 1.9% 0.9% 0.9%
Therapists 0.4% 0.7% -0.3% Other health diagnosing and treating practitioners and technical
0.5% 0.3% 0.2%
Health technologists and technicians 1.9% 1.5% 0.4%
Service 20.0% 23.5% -3.5%
Healthcare support 2.8% 6.1% -3.3%
Nursing, psychiatric, and home health aides 1.7% 4.8% -3.1%
Occupational and physical therapist assistants and aides 0.1% 0.1% 0.0%
Other healthcare support 1.0% 1.2% -0.2%
Protective service 2.2% 2.9% -0.7% Fire fighting and prevention workers including supervisors
0.4% 0.3% 0.1%
Law enforcement workers including supervisors 0.8% 1.6% -0.8%
Other protective service workers including supervisors 1.0% 0.9% 0.0%
Food preparation and serving related 7.6% 5.5% 2.1%
Cooks and food preparation workers 2.1% 2.6% -0.5%
Waiters and waitresses 1.6% 0.4% 1.2% Food and beverage serving workers except waiters/waitresses
2.3% 0.7% 1.6%
Other food preparation and serving workers including supervisors
1.6% 1.8% -0.3%
Building and grounds cleaning and maintenance 4.0% 3.5% 0.5%
Building and grounds cleaning and maint. 4.0% 3.5% 0.5%
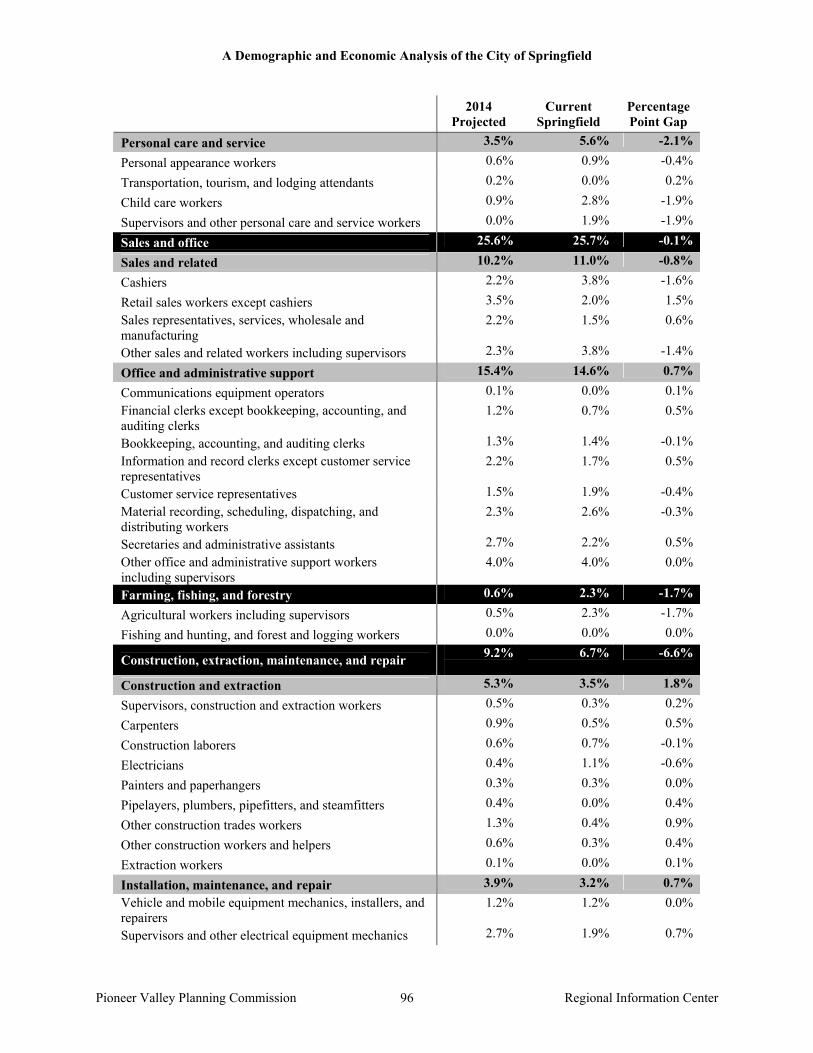
A Demographic and Economic Analysis of the City of Springfield
Pioneer Valley Planning Commission Regional Information Center 96
2014 Projected
Current Springfield
Percentage Point Gap
Personal care and service 3.5% 5.6% -2.1%
Personal appearance workers 0.6% 0.9% -0.4%
Transportation, tourism, and lodging attendants 0.2% 0.0% 0.2%
Child care workers 0.9% 2.8% -1.9%
Supervisors and other personal care and service workers 0.0% 1.9% -1.9%
Sales and office 25.6% 25.7% -0.1%
Sales and related 10.2% 11.0% -0.8%
Cashiers 2.2% 3.8% -1.6%
Retail sales workers except cashiers 3.5% 2.0% 1.5% Sales representatives, services, wholesale and manufacturing
2.2% 1.5% 0.6%
Other sales and related workers including supervisors 2.3% 3.8% -1.4%
Office and administrative support 15.4% 14.6% 0.7%
Communications equipment operators 0.1% 0.0% 0.1% Financial clerks except bookkeeping, accounting, and auditing clerks
1.2% 0.7% 0.5%
Bookkeeping, accounting, and auditing clerks 1.3% 1.4% -0.1% Information and record clerks except customer service representatives
2.2% 1.7% 0.5%
Customer service representatives 1.5% 1.9% -0.4% Material recording, scheduling, dispatching, and distributing workers
2.3% 2.6% -0.3%
Secretaries and administrative assistants 2.7% 2.2% 0.5% Other office and administrative support workers including supervisors
4.0% 4.0% 0.0%
Farming, fishing, and forestry 0.6% 2.3% -1.7%
Agricultural workers including supervisors 0.5% 2.3% -1.7%
Fishing and hunting, and forest and logging workers 0.0% 0.0% 0.0%
Construction, extraction, maintenance, and repair 9.2%
6.7% -6.6%
Construction and extraction 5.3% 3.5% 1.8%
Supervisors, construction and extraction workers 0.5% 0.3% 0.2%
Carpenters 0.9% 0.5% 0.5%
Construction laborers 0.6% 0.7% -0.1%
Electricians 0.4% 1.1% -0.6%
Painters and paperhangers 0.3% 0.3% 0.0%
Pipelayers, plumbers, pipefitters, and steamfitters 0.4% 0.0% 0.4%
Other construction trades workers 1.3% 0.4% 0.9%
Other construction workers and helpers 0.6% 0.3% 0.4%
Extraction workers 0.1% 0.0% 0.1%
Installation, maintenance, and repair 3.9% 3.2% 0.7% Vehicle and mobile equipment mechanics, installers, and repairers
1.2% 1.2% 0.0%
Supervisors and other electrical equipment mechanics 2.7% 1.9% 0.7%
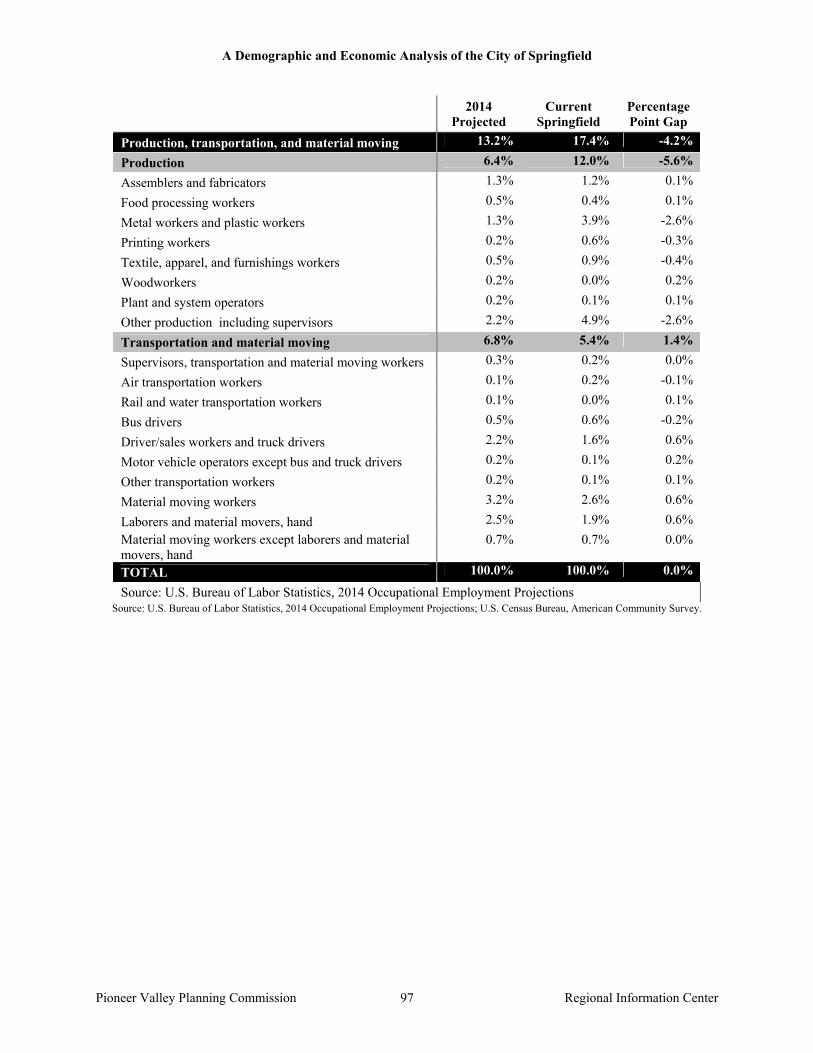
A Demographic and Economic Analysis of the City of Springfield
Pioneer Valley Planning Commission Regional Information Center 97
2014 Projected
Current Springfield
Percentage Point Gap
Production, transportation, and material moving 13.2% 17.4% -4.2%
Production 6.4% 12.0% -5.6%
Assemblers and fabricators 1.3% 1.2% 0.1%
Food processing workers 0.5% 0.4% 0.1%
Metal workers and plastic workers 1.3% 3.9% -2.6%
Printing workers 0.2% 0.6% -0.3%
Textile, apparel, and furnishings workers 0.5% 0.9% -0.4%
Woodworkers 0.2% 0.0% 0.2%
Plant and system operators 0.2% 0.1% 0.1%
Other production including supervisors 2.2% 4.9% -2.6%
Transportation and material moving 6.8% 5.4% 1.4%
Supervisors, transportation and material moving workers 0.3% 0.2% 0.0%
Air transportation workers 0.1% 0.2% -0.1%
Rail and water transportation workers 0.1% 0.0% 0.1%
Bus drivers 0.5% 0.6% -0.2%
Driver/sales workers and truck drivers 2.2% 1.6% 0.6%
Motor vehicle operators except bus and truck drivers 0.2% 0.1% 0.2%
Other transportation workers 0.2% 0.1% 0.1%
Material moving workers 3.2% 2.6% 0.6%
Laborers and material movers, hand 2.5% 1.9% 0.6% Material moving workers except laborers and material movers, hand
0.7% 0.7% 0.0%
TOTAL 100.0% 100.0% 0.0%
Source: U.S. Bureau of Labor Statistics, 2014 Occupational Employment Projections Source: U.S. Bureau of Labor Statistics, 2014 Occupational Employment Projections; U.S. Census Bureau, American Community Survey.

A Demographic and Economic Analysis of the City of Springfield
Pioneer Valley Planning Commission Regional Information Center 98
Analyzing Business Opportunities Industry Cluster Analysis Concentrations
Goods and services produced in any community can be for one of two purposes: local consumption or export for external consumption. Such exportation can occur in the traditional sense, through the transportation of physical goods or expertise to other locales or it can occur when residents of other communities travel into a locale to consume services on premises, as is the case with tourism, entertainment, and services in which the purchaser needs to be physically present in order to consume the service. One way to assess whether local production is in support of local consumption or is a primary export is by evaluating employment in the area relative to a base area using location quotients, a measure of concentration of industries in a geographic area. Location quotients greater than one suggest that the industry is a net exporter, producing goods and services in excess of what is necessary for purely local consumption, and bringing money into the community. Location quotients lower than one suggest the converse, that the industry is a net import, in which residents obtain goods and services from other communities. Quotients at or around one indicate that the industry is neither an export nor import industry, but rather serves local need, as is often the case with grocery and convenience stores. Just as Springfield is a major employer for the Pioneer Valley region, it is also a major urban center, providing goods and services for residents of other communities, both on its borders and elsewhere throughout the nation and the world. Based on their location quotients, the industries that appear to be “export industries” in Springfield tend to be in the service sector, particularly healthcare and social assistance, educational services, finance and insurance, management of companies and enterprises, and other services. Interestingly, the two largest sectors, health care and social assistance and educational services, are traditionally services that require a physical presence at the time of service delivery, although new medical technology and the increasing use of distance learning have changed this somewhat in recent years. Despite the recent changes, many of the activities that bring money into the city are those that require residents of surrounding communities to actually enter the city. As a result, safety, positive public perceptions, and aesthetics are important to their continued growth. The city has low concentrations of employment in construction, arts, entertainment and recreation, professional and technical services, administrative and waste services, wholesale trade, and manufacturing.
While high location quotients in some categories necessitates lower location quotients in others, industry sectors in which the city has dramatically lower percentages of employment relative to the county overall could suggest growth opportunities. Retail trade, manufacturing, and arts, entertainment, and recreation are three sectors in which Hampden County has slight concentrations of employment, yet Springfield employment levels are quite low.
Springfield’s employment in retail trade is 0.76, suggesting that those who live and work in the city do not tend to shop there. While stores that sell staple goods, such as grocery and health and personal care stores, have employment in proportion with overall employment levels, more specialized categories of retail have disproportionately low levels of employment. Direct selling establishments, or non-store retailers, such as newspaper delivery, heating oil delivery,
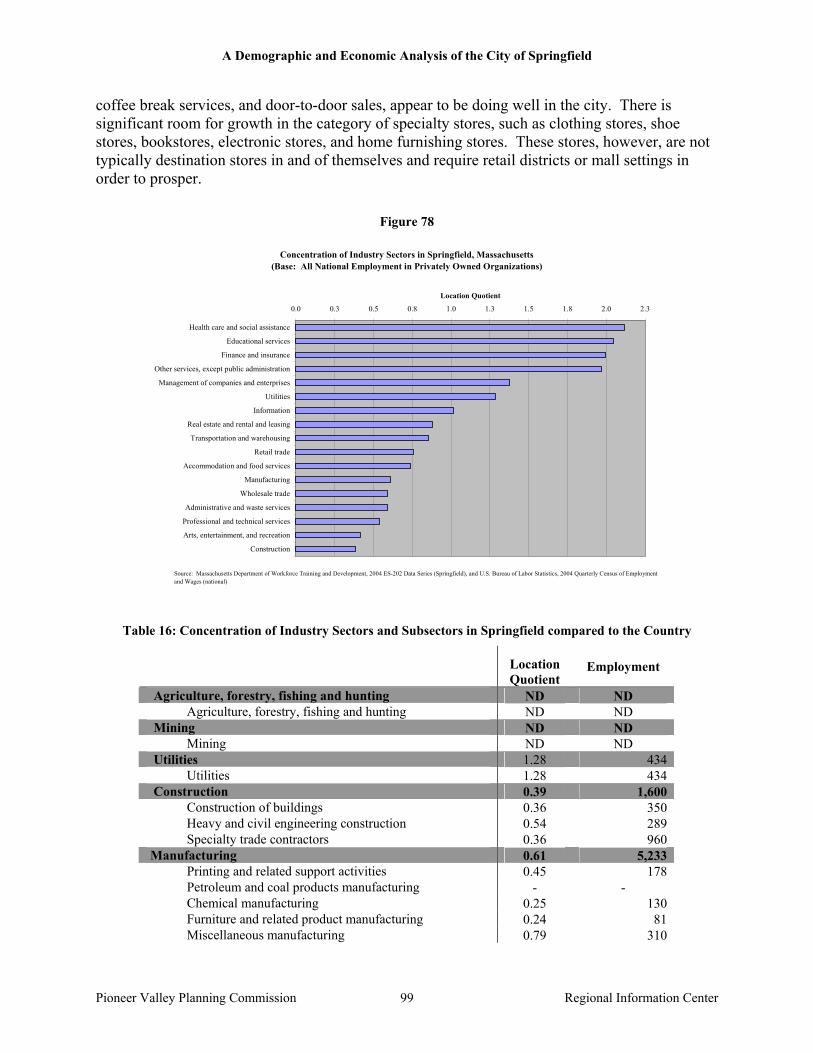
A Demographic and Economic Analysis of the City of Springfield
Pioneer Valley Planning Commission Regional Information Center 99
coffee break services, and door-to-door sales, appear to be doing well in the city. There is significant room for growth in the category of specialty stores, such as clothing stores, shoe stores, bookstores, electronic stores, and home furnishing stores. These stores, however, are not typically destination stores in and of themselves and require retail districts or mall settings in order to prosper.
Figure 78
Concentration of Industry Sectors in Springfield, Massachusetts(Base: All National Employment in Privately Owned Organizations)
0.0 0.3 0.5 0.8 1.0 1.3 1.5 1.8 2.0 2.3
Health care and social assistance
Educational services
Finance and insurance
Other services, except public administration
Management of companies and enterprises
Utilities
Information
Real estate and rental and leasing
Transportation and warehousing
Retail trade
Accommodation and food services
Manufacturing
Wholesale trade
Administrative and waste services
Professional and technical services
Arts, entertainment, and recreation
Construction
Location Quotient
Source: Massachusetts Department of Workforce Training and Development, 2004 ES-202 Data Series (Springfield), and U.S. Bureau of Labor Statistics, 2004 Quarterly Census of Employment and Wages (national)
Table 16: Concentration of Industry Sectors and Subsectors in Springfield compared to the Country
Location Quotient
Employment
Agriculture, forestry, fishing and hunting ND ND Agriculture, forestry, fishing and hunting ND ND Mining ND ND Mining ND ND Utilities 1.28 434 Utilities 1.28 434 Construction 0.39 1,600 Construction of buildings 0.36 350 Heavy and civil engineering construction 0.54 289 Specialty trade contractors 0.36 960 Manufacturing 0.61 5,233 Printing and related support activities 0.45 178 Petroleum and coal products manufacturing - - Chemical manufacturing 0.25 130 Furniture and related product manufacturing 0.24 81 Miscellaneous manufacturing 0.79 310

A Demographic and Economic Analysis of the City of Springfield
Pioneer Valley Planning Commission Regional Information Center 100
Location Quotient
Employment
Wholesale trade 0.59 2,005 Merchant wholesalers, durable goods 0.43 767 Merchant wholesalers, nondurable goods 0.88 1,052 Electronic markets and agents and brokers 0.44 186 Retail trade 0.76 6,849 Motor vehicle and parts dealers 0.57 648 Furniture and home furnishings stores 0.61 205 Electronics and appliance stores 0.62 195 Building material and garden supply stores 0.87 647 Food and beverage stores 1.01 1,710 Health and personal care stores 1.04 584 Gasoline stations 0.73 384 Clothing and clothing accessories stores 0.73 600 Sporting goods, hobby, book and music 0.68 264 General merchandise stores 0.64 1,101 Miscellaneous store retailers 0.67 369 Nonstore retailers 0.56 143 Transportation and warehousing 0.86 2,058 Air transportation - - Truck transportation 0.97 782 Transit and ground passenger transportation 4.50 1,021 Support activities for transportation 0.32 103 Couriers and messengers 0.15 51 Warehousing and storage 0.00 Information 1.02 1,892 Publishing industries, except Internet - - Motion picture and sound recording 0.41 93 Broadcasting, except Internet 1.19 231 Telecommunications 1.13 695 Finance and insurance 2.00 6,959 Credit intermediation and related activities 0.58 971 Securities, commodity contracts, investments 1.69 776 Insurance carriers and related activities 4.08 5,200 Funds, trusts, and other financial vehicles 0.23 12 Real estate and rental and leasing 0.88 1,094 Real estate 0.80 674 Rental and leasing services 1.09 420 Professional and technical services 0.54 2,184 Professional and technical services 0.54 2,184 Management of companies and enterprises 1.38 1,402 Management of companies and enterprises 1.38 1,402 Administrative and waste services 0.59 2,768 Administrative and support services 0.60 2,681 Waste management and remediation 0.45 87 Educational services 2.05 2,553 Educational services 2.05 2,553 Health care and social assistance 2.12 17,761 Ambulatory health care services 1.87 5,549 Hospitals 3.08 7,840 Nursing and residential care facilities 1.30 2,184 Social assistance 1.81 2,188
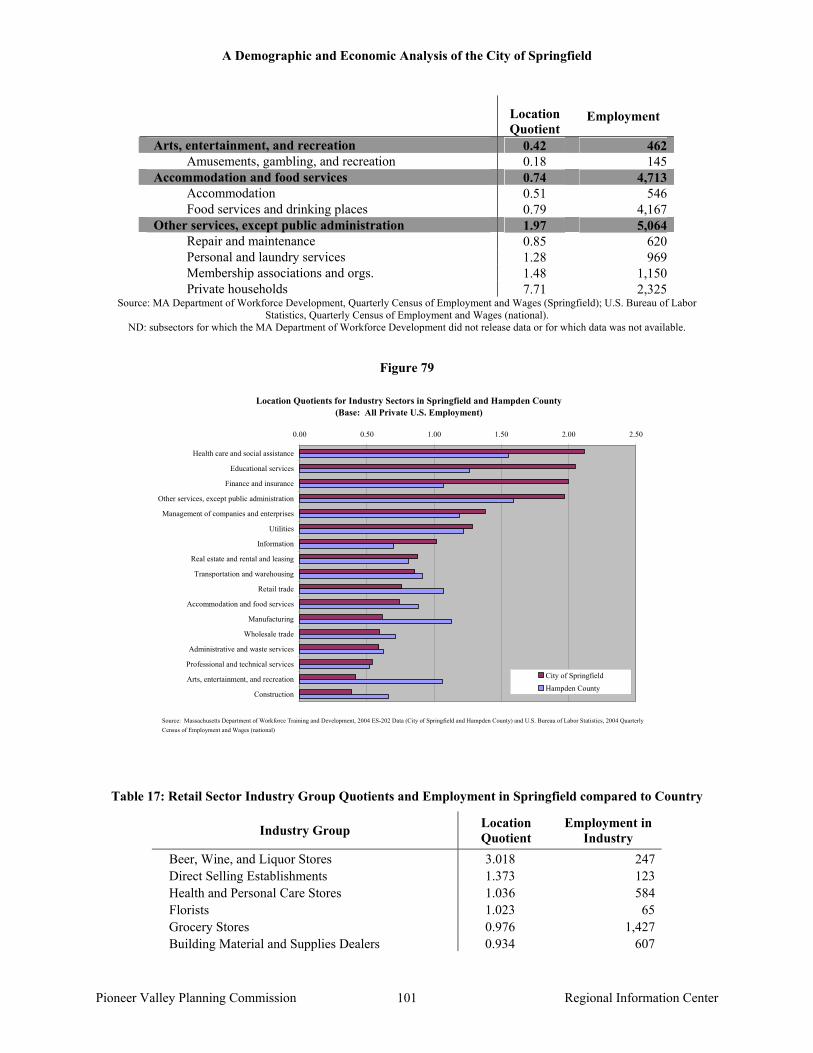
A Demographic and Economic Analysis of the City of Springfield
Pioneer Valley Planning Commission Regional Information Center 101
Location Quotient
Employment
Arts, entertainment, and recreation 0.42 462 Amusements, gambling, and recreation 0.18 145 Accommodation and food services 0.74 4,713 Accommodation 0.51 546 Food services and drinking places 0.79 4,167 Other services, except public administration 1.97 5,064 Repair and maintenance 0.85 620 Personal and laundry services 1.28 969 Membership associations and orgs. 1.48 1,150 Private households 7.71 2,325
Source: MA Department of Workforce Development, Quarterly Census of Employment and Wages (Springfield); U.S. Bureau of Labor Statistics, Quarterly Census of Employment and Wages (national).
ND: subsectors for which the MA Department of Workforce Development did not release data or for which data was not available.
Figure 79
Location Quotients for Industry Sectors in Springfield and Hampden County(Base: All Private U.S. Employment)
0.00 0.50 1.00 1.50 2.00 2.50
Health care and social assistance
Educational services
Finance and insurance
Other services, except public administration
Management of companies and enterprises
Utilities
Information
Real estate and rental and leasing
Transportation and warehousing
Retail trade
Accommodation and food services
Manufacturing
Wholesale trade
Administrative and waste services
Professional and technical services
Arts, entertainment, and recreation
Construction
City of Springfield
Hampden County
Source: Massachusetts Department of Workforce Training and Development, 2004 ES-202 Data (City of Springfield and Hampden County) and U.S. Bureau of Labor Statistics, 2004 Quarterly Census of Employment and Wages (national)
Table 17: Retail Sector Industry Group Quotients and Employment in Springfield compared to Country
Industry Group Location Quotient
Employment in Industry
Beer, Wine, and Liquor Stores 3.018 247 Direct Selling Establishments 1.373 123 Health and Personal Care Stores 1.036 584 Florists 1.023 65 Grocery Stores 0.976 1,427 Building Material and Supplies Dealers 0.934 607
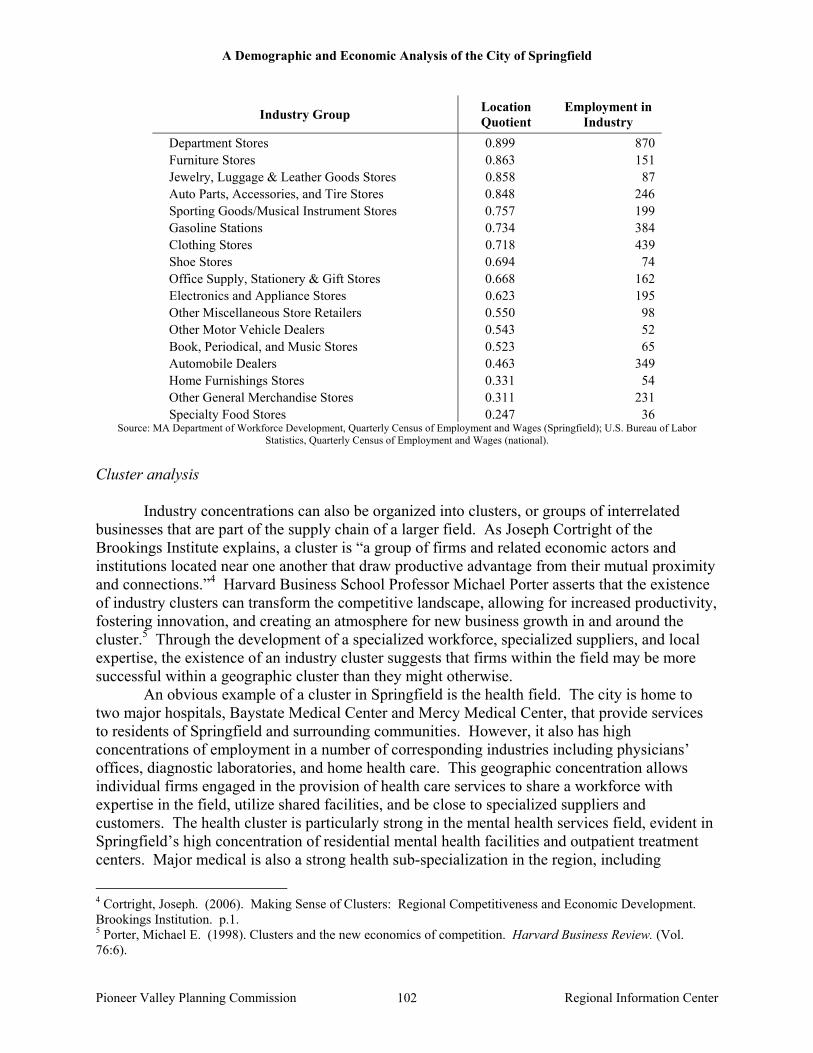
A Demographic and Economic Analysis of the City of Springfield
Pioneer Valley Planning Commission Regional Information Center 102
Industry Group Location Quotient
Employment in Industry
Department Stores 0.899 870 Furniture Stores 0.863 151 Jewelry, Luggage & Leather Goods Stores 0.858 87 Auto Parts, Accessories, and Tire Stores 0.848 246 Sporting Goods/Musical Instrument Stores 0.757 199 Gasoline Stations 0.734 384 Clothing Stores 0.718 439 Shoe Stores 0.694 74 Office Supply, Stationery & Gift Stores 0.668 162 Electronics and Appliance Stores 0.623 195 Other Miscellaneous Store Retailers 0.550 98 Other Motor Vehicle Dealers 0.543 52 Book, Periodical, and Music Stores 0.523 65 Automobile Dealers 0.463 349 Home Furnishings Stores 0.331 54 Other General Merchandise Stores 0.311 231 Specialty Food Stores 0.247 36
Source: MA Department of Workforce Development, Quarterly Census of Employment and Wages (Springfield); U.S. Bureau of Labor Statistics, Quarterly Census of Employment and Wages (national).
Cluster analysis
Industry concentrations can also be organized into clusters, or groups of interrelated businesses that are part of the supply chain of a larger field. As Joseph Cortright of the Brookings Institute explains, a cluster is “a group of firms and related economic actors and institutions located near one another that draw productive advantage from their mutual proximity and connections.”4 Harvard Business School Professor Michael Porter asserts that the existence of industry clusters can transform the competitive landscape, allowing for increased productivity, fostering innovation, and creating an atmosphere for new business growth in and around the cluster.5 Through the development of a specialized workforce, specialized suppliers, and local expertise, the existence of an industry cluster suggests that firms within the field may be more successful within a geographic cluster than they might otherwise.
An obvious example of a cluster in Springfield is the health field. The city is home to two major hospitals, Baystate Medical Center and Mercy Medical Center, that provide services to residents of Springfield and surrounding communities. However, it also has high concentrations of employment in a number of corresponding industries including physicians’ offices, diagnostic laboratories, and home health care. This geographic concentration allows individual firms engaged in the provision of health care services to share a workforce with expertise in the field, utilize shared facilities, and be close to specialized suppliers and customers. The health cluster is particularly strong in the mental health services field, evident in Springfield’s high concentration of residential mental health facilities and outpatient treatment centers. Major medical is also a strong health sub-specialization in the region, including
4 Cortright, Joseph. (2006). Making Sense of Clusters: Regional Competitiveness and Economic Development. Brookings Institution. p.1. 5 Porter, Michael E. (1998). Clusters and the new economics of competition. Harvard Business Review. (Vol. 76:6).

A Demographic and Economic Analysis of the City of Springfield
Pioneer Valley Planning Commission Regional Information Center 103
outpatient care (which includes family planning services, freestanding surgical centers, mental health services and dialysis clinics); emergency services, and diagnostics.
Another existing cluster in Springfield appears to be in the field of metal-working. While the city has a low concentration of general manufacturing relative to the total U.S. economy, it does have a disproportionately high number of workers engaged in and related to the production of metal products. The fabricated metal product manufacturing sub-sector has a location quotient of 2.1, one of the top ten sub-sectors in the city. Similarly, the coating, engraving and heat-treating metal industry has a quotient of 2.7, and the metal-working machinery manufacturing and the industrial machinery manufacturing industries have location quotients of 3.1 and 1.9, respectively. While employment in each individual industry may appear low, between 138 and 373 employees, the total number of individuals that may be employed by this larger cluster of industries is nearly 750.
An additional cluster is found within the educational services sector, particularly colleges and universities. The prevalence of the educational services sector in Springfield appears to be driven primarily by the city’s four institutions of higher learning, Springfield Technical Community College, Springfield College, American International College, and Western New England College, which account for 84 percent of non-municipal employment in the sector. In part, this cluster is likely a structural component of other high-concentration clusters in healthcare and finance; university programs in these fields support the development of the workforce necessary to sustain the clusters. For example, Springfield Technical Community College awards a large percentage of its degrees and certificates in health fields, and recently responded to an emerging need for nurses by developing a nursing program. Springfield College also supports the health cluster, through its program in physical therapy and related health professions. Similarly, business and graduate continuing education programs at American International College and Western New England College help to support the cluster activity in finance, insurance, and securities.
Table 18: Health Care Field Location Quotients and Employment in Springfield compared to Country
Location Quotient
Employment in Industry
SECTOR-LEVEL: Health care and social assistance 2.1155 17,761 SUBSECTOR-LEVEL: Ambulatory health care services 1.8748 5,549 Hospitals 3.0798 7,840 Nursing and residential care facilities 1.2965 2,184 INDUSTRY GROUP LEVEL: Outpatient Care Centers 4.292 1,144 Emergency and Other Relief Services 3.945 305 Residential Mental Health Facilities 3.683 1,081 Medical and Diagnostic Laboratories 3.098 350 General Medical and Surgical Hospitals 2.989 7,178 Other Residential Care Facilities 2.715 268 Home Health Care Services 2.033 939 Offices of Other Health Practitioners 1.829 575
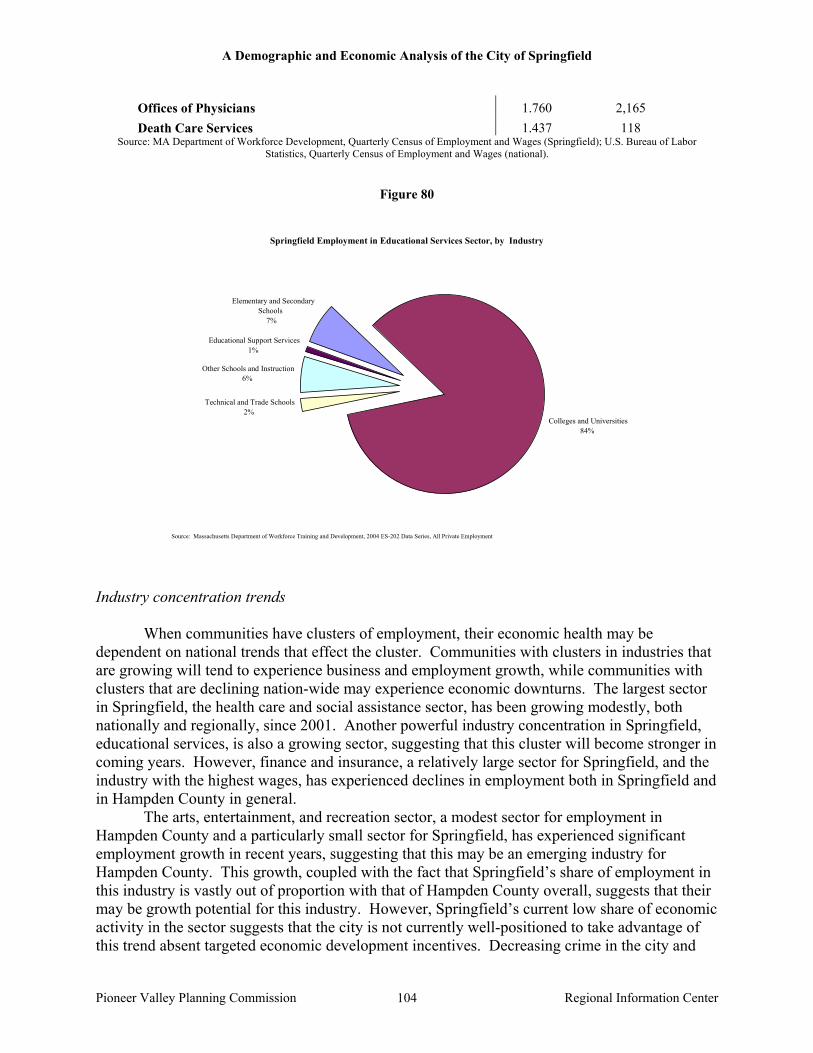
A Demographic and Economic Analysis of the City of Springfield
Pioneer Valley Planning Commission Regional Information Center 104
Offices of Physicians 1.760 2,165 Death Care Services 1.437 118
Source: MA Department of Workforce Development, Quarterly Census of Employment and Wages (Springfield); U.S. Bureau of Labor Statistics, Quarterly Census of Employment and Wages (national).
Figure 80
Springfield Employment in Educational Services Sector, by Industry
Elementary and Secondary Schools
7%
Colleges and Universities 84%
Technical and Trade Schools 2%
Other Schools and Instruction 6%
Educational Support Services 1%
Source: Massachusetts Department of Workforce Training and Development, 2004 ES-202 Data Series, All Private Employment
Industry concentration trends When communities have clusters of employment, their economic health may be dependent on national trends that effect the cluster. Communities with clusters in industries that are growing will tend to experience business and employment growth, while communities with clusters that are declining nation-wide may experience economic downturns. The largest sector in Springfield, the health care and social assistance sector, has been growing modestly, both nationally and regionally, since 2001. Another powerful industry concentration in Springfield, educational services, is also a growing sector, suggesting that this cluster will become stronger in coming years. However, finance and insurance, a relatively large sector for Springfield, and the industry with the highest wages, has experienced declines in employment both in Springfield and in Hampden County in general.
The arts, entertainment, and recreation sector, a modest sector for employment in Hampden County and a particularly small sector for Springfield, has experienced significant employment growth in recent years, suggesting that this may be an emerging industry for Hampden County. This growth, coupled with the fact that Springfield’s share of employment in this industry is vastly out of proportion with that of Hampden County overall, suggests that their may be growth potential for this industry. However, Springfield’s current low share of economic activity in the sector suggests that the city is not currently well-positioned to take advantage of this trend absent targeted economic development incentives. Decreasing crime in the city and
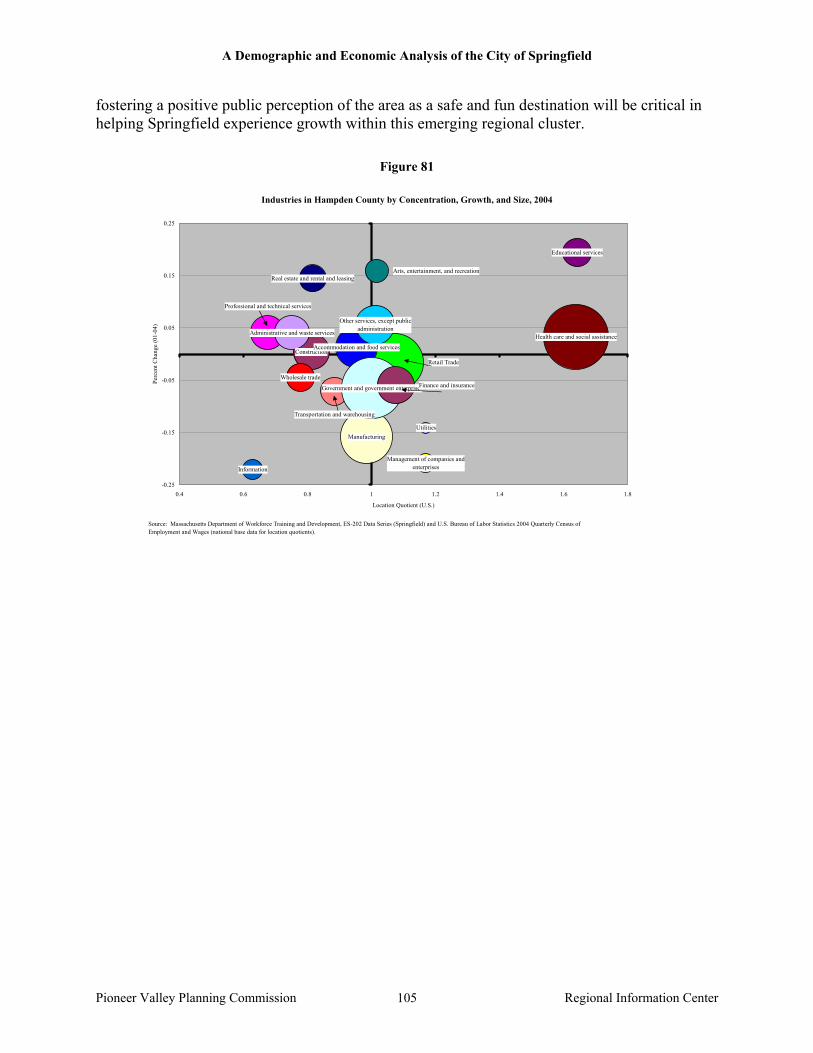
A Demographic and Economic Analysis of the City of Springfield
Pioneer Valley Planning Commission Regional Information Center 105
fostering a positive public perception of the area as a safe and fun destination will be critical in helping Springfield experience growth within this emerging regional cluster.
Figure 81
Industries in Hampden County by Concentration, Growth, and Size, 2004
Utilities
Construction
Manufacturing
Wholesale trade
Transportation and warehousing
Information
Real estate and rental and leasing
Professional and technical services
Management of companies and enterprises
Educational services
Health care and social assistance
Arts, entertainment, and recreation
Accommodation and food services
Other services, except public administration
Government and government enterprisesFinance and insurance
Retail Trade
Administrative and waste services
-0.25
-0.15
-0.05
0.05
0.15
0.25
0.4 0.6 0.8 1 1.2 1.4 1.6 1.8
Location Quotient (U.S.)
Perc
ent C
hang
e (0
1-04
)
Source: Massachusetts Department of Workforce Training and Development, ES-202 Data Series (Springfield) and U.S. Bureau of Labor Statistics 2004 Quarterly Census of Employment and Wages (national base data for location quotients).
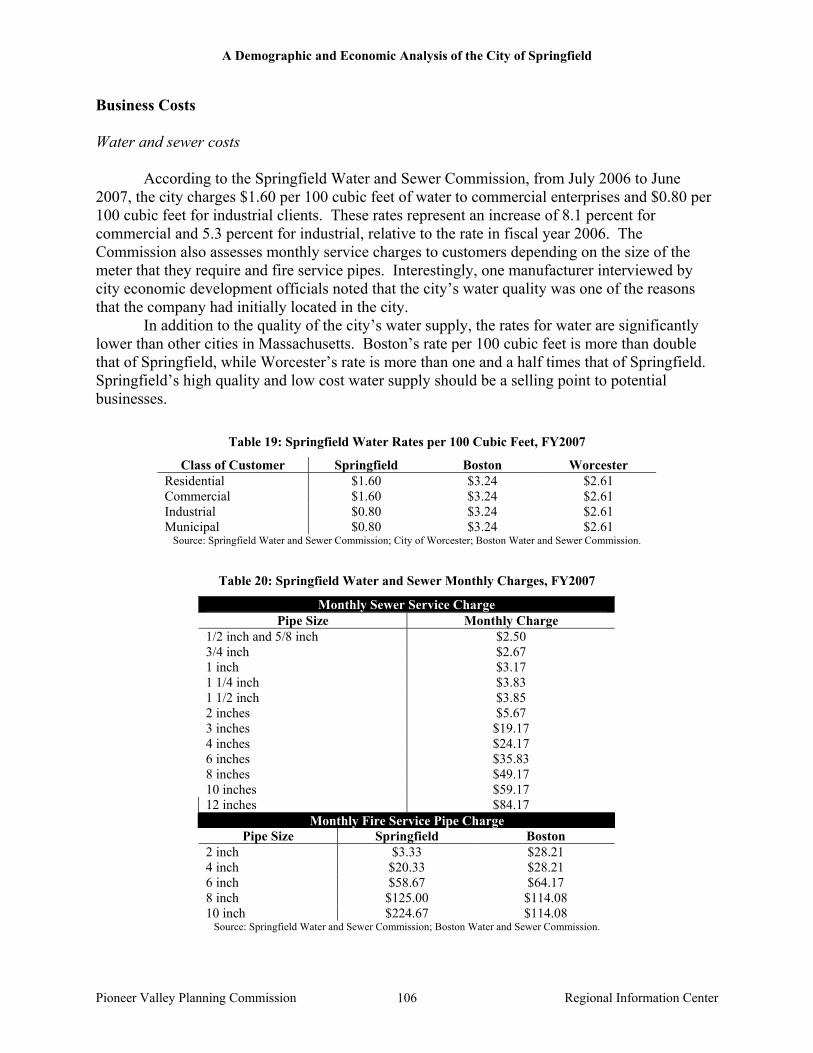
A Demographic and Economic Analysis of the City of Springfield
Pioneer Valley Planning Commission Regional Information Center 106
Business Costs Water and sewer costs According to the Springfield Water and Sewer Commission, from July 2006 to June 2007, the city charges $1.60 per 100 cubic feet of water to commercial enterprises and $0.80 per 100 cubic feet for industrial clients. These rates represent an increase of 8.1 percent for commercial and 5.3 percent for industrial, relative to the rate in fiscal year 2006. The Commission also assesses monthly service charges to customers depending on the size of the meter that they require and fire service pipes. Interestingly, one manufacturer interviewed by city economic development officials noted that the city’s water quality was one of the reasons that the company had initially located in the city. In addition to the quality of the city’s water supply, the rates for water are significantly lower than other cities in Massachusetts. Boston’s rate per 100 cubic feet is more than double that of Springfield, while Worcester’s rate is more than one and a half times that of Springfield. Springfield’s high quality and low cost water supply should be a selling point to potential businesses.
Table 19: Springfield Water Rates per 100 Cubic Feet, FY2007
Class of Customer Springfield Boston Worcester Residential $1.60 $3.24 $2.61 Commercial $1.60 $3.24 $2.61 Industrial $0.80 $3.24 $2.61 Municipal $0.80 $3.24 $2.61
Source: Springfield Water and Sewer Commission; City of Worcester; Boston Water and Sewer Commission.
Table 20: Springfield Water and Sewer Monthly Charges, FY2007
Monthly Sewer Service Charge Pipe Size Monthly Charge
1/2 inch and 5/8 inch $2.50 3/4 inch $2.67 1 inch $3.17 1 1/4 inch $3.83 1 1/2 inch $3.85 2 inches $5.67 3 inches $19.17 4 inches $24.17 6 inches $35.83 8 inches $49.17 10 inches $59.17 12 inches $84.17
Monthly Fire Service Pipe Charge Pipe Size Springfield Boston
2 inch $3.33 $28.21 4 inch $20.33 $28.21 6 inch $58.67 $64.17 8 inch $125.00 $114.08 10 inch $224.67 $114.08
Source: Springfield Water and Sewer Commission; Boston Water and Sewer Commission.
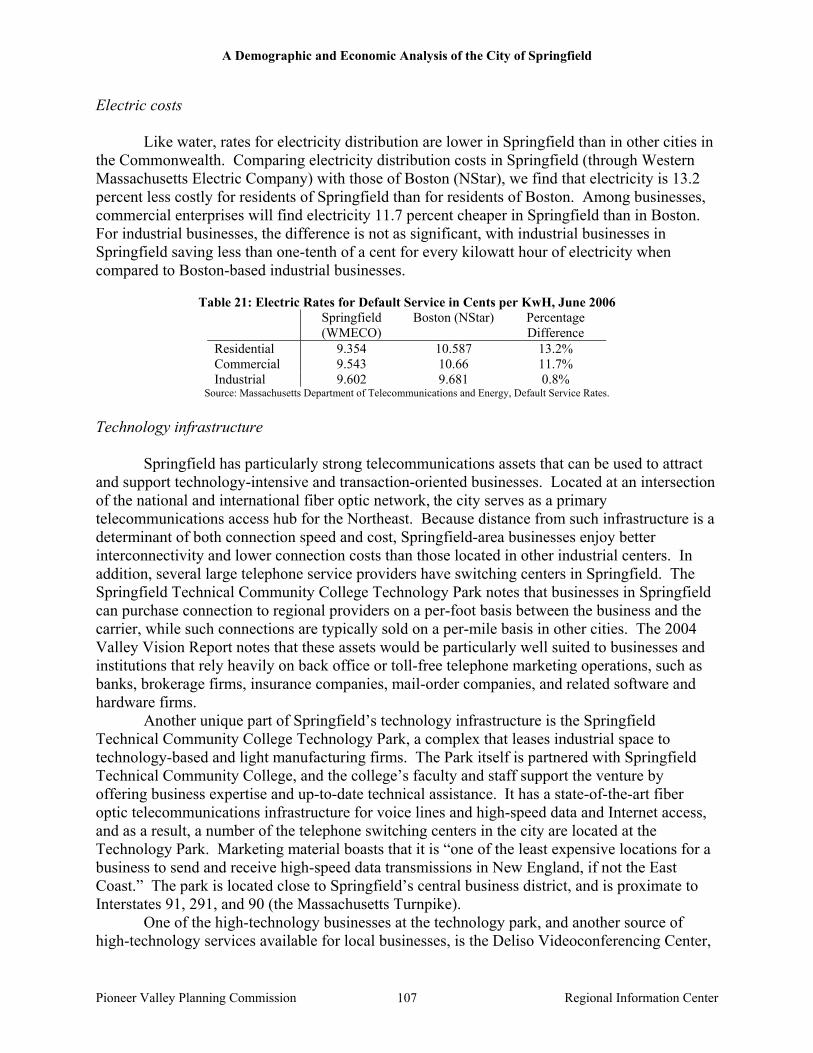
A Demographic and Economic Analysis of the City of Springfield
Pioneer Valley Planning Commission Regional Information Center 107
Electric costs Like water, rates for electricity distribution are lower in Springfield than in other cities in the Commonwealth. Comparing electricity distribution costs in Springfield (through Western Massachusetts Electric Company) with those of Boston (NStar), we find that electricity is 13.2 percent less costly for residents of Springfield than for residents of Boston. Among businesses, commercial enterprises will find electricity 11.7 percent cheaper in Springfield than in Boston. For industrial businesses, the difference is not as significant, with industrial businesses in Springfield saving less than one-tenth of a cent for every kilowatt hour of electricity when compared to Boston-based industrial businesses.
Table 21: Electric Rates for Default Service in Cents per KwH, June 2006 Springfield
(WMECO) Boston (NStar) Percentage
Difference Residential 9.354 10.587 13.2% Commercial 9.543 10.66 11.7% Industrial 9.602 9.681 0.8%
Source: Massachusetts Department of Telecommunications and Energy, Default Service Rates. Technology infrastructure
Springfield has particularly strong telecommunications assets that can be used to attract
and support technology-intensive and transaction-oriented businesses. Located at an intersection of the national and international fiber optic network, the city serves as a primary telecommunications access hub for the Northeast. Because distance from such infrastructure is a determinant of both connection speed and cost, Springfield-area businesses enjoy better interconnectivity and lower connection costs than those located in other industrial centers. In addition, several large telephone service providers have switching centers in Springfield. The Springfield Technical Community College Technology Park notes that businesses in Springfield can purchase connection to regional providers on a per-foot basis between the business and the carrier, while such connections are typically sold on a per-mile basis in other cities. The 2004 Valley Vision Report notes that these assets would be particularly well suited to businesses and institutions that rely heavily on back office or toll-free telephone marketing operations, such as banks, brokerage firms, insurance companies, mail-order companies, and related software and hardware firms.
Another unique part of Springfield’s technology infrastructure is the Springfield Technical Community College Technology Park, a complex that leases industrial space to technology-based and light manufacturing firms. The Park itself is partnered with Springfield Technical Community College, and the college’s faculty and staff support the venture by offering business expertise and up-to-date technical assistance. It has a state-of-the-art fiber optic telecommunications infrastructure for voice lines and high-speed data and Internet access, and as a result, a number of the telephone switching centers in the city are located at the Technology Park. Marketing material boasts that it is “one of the least expensive locations for a business to send and receive high-speed data transmissions in New England, if not the East Coast.” The park is located close to Springfield’s central business district, and is proximate to Interstates 91, 291, and 90 (the Massachusetts Turnpike).
One of the high-technology businesses at the technology park, and another source of high-technology services available for local businesses, is the Deliso Videoconferencing Center,
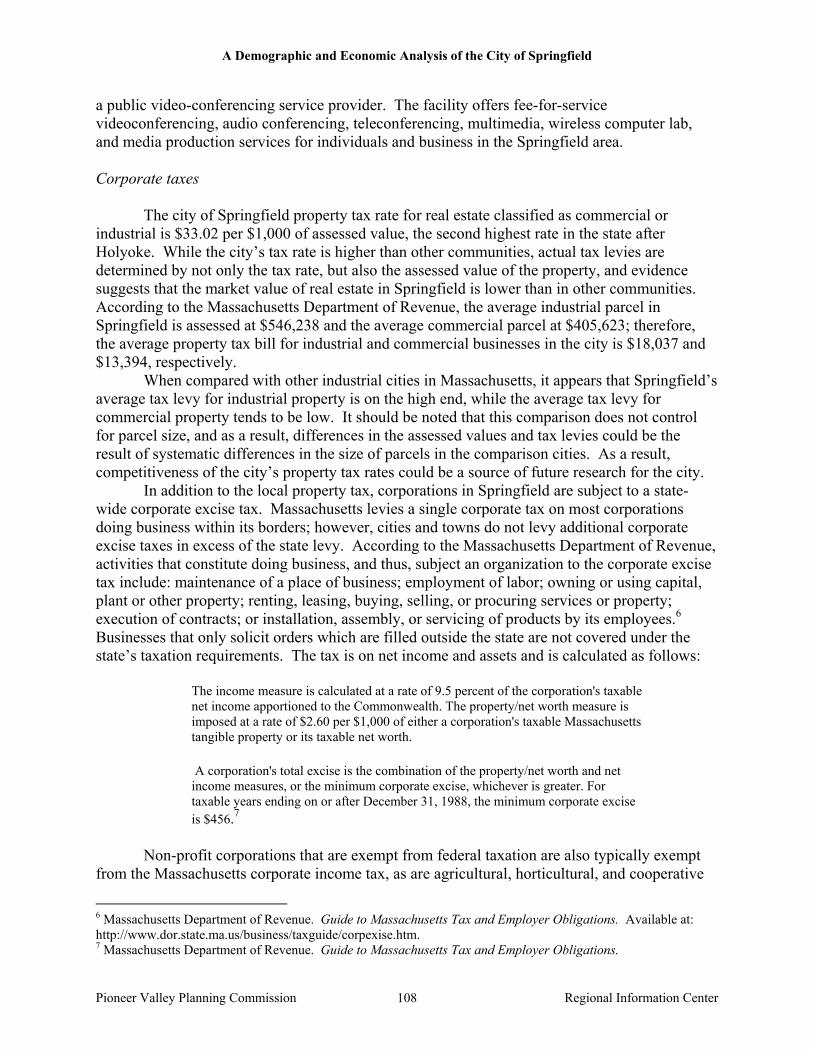
A Demographic and Economic Analysis of the City of Springfield
Pioneer Valley Planning Commission Regional Information Center 108
a public video-conferencing service provider. The facility offers fee-for-service videoconferencing, audio conferencing, teleconferencing, multimedia, wireless computer lab, and media production services for individuals and business in the Springfield area. Corporate taxes The city of Springfield property tax rate for real estate classified as commercial or industrial is $33.02 per $1,000 of assessed value, the second highest rate in the state after Holyoke. While the city’s tax rate is higher than other communities, actual tax levies are determined by not only the tax rate, but also the assessed value of the property, and evidence suggests that the market value of real estate in Springfield is lower than in other communities. According to the Massachusetts Department of Revenue, the average industrial parcel in Springfield is assessed at $546,238 and the average commercial parcel at $405,623; therefore, the average property tax bill for industrial and commercial businesses in the city is $18,037 and $13,394, respectively.
When compared with other industrial cities in Massachusetts, it appears that Springfield’s average tax levy for industrial property is on the high end, while the average tax levy for commercial property tends to be low. It should be noted that this comparison does not control for parcel size, and as a result, differences in the assessed values and tax levies could be the result of systematic differences in the size of parcels in the comparison cities. As a result, competitiveness of the city’s property tax rates could be a source of future research for the city.
In addition to the local property tax, corporations in Springfield are subject to a state-wide corporate excise tax. Massachusetts levies a single corporate tax on most corporations doing business within its borders; however, cities and towns do not levy additional corporate excise taxes in excess of the state levy. According to the Massachusetts Department of Revenue, activities that constitute doing business, and thus, subject an organization to the corporate excise tax include: maintenance of a place of business; employment of labor; owning or using capital, plant or other property; renting, leasing, buying, selling, or procuring services or property; execution of contracts; or installation, assembly, or servicing of products by its employees.6 Businesses that only solicit orders which are filled outside the state are not covered under the state’s taxation requirements. The tax is on net income and assets and is calculated as follows:
The income measure is calculated at a rate of 9.5 percent of the corporation's taxable net income apportioned to the Commonwealth. The property/net worth measure is imposed at a rate of $2.60 per $1,000 of either a corporation's taxable Massachusetts tangible property or its taxable net worth.
A corporation's total excise is the combination of the property/net worth and net income measures, or the minimum corporate excise, whichever is greater. For taxable years ending on or after December 31, 1988, the minimum corporate excise is $456.7
Non-profit corporations that are exempt from federal taxation are also typically exempt from the Massachusetts corporate income tax, as are agricultural, horticultural, and cooperative
6 Massachusetts Department of Revenue. Guide to Massachusetts Tax and Employer Obligations. Available at: http://www.dor.state.ma.us/business/taxguide/corpexise.htm. 7 Massachusetts Department of Revenue. Guide to Massachusetts Tax and Employer Obligations.

A Demographic and Economic Analysis of the City of Springfield
Pioneer Valley Planning Commission Regional Information Center 109
organizations formally organized under Massachusetts General Laws, Chapter 157, Section 10. Banking and financial institutions, insurance companies, safe deposit companies, public utility corporations, and corporate trusts are also not subject to the corporate excise tax, but are subject to other state tax levies.
Table 22: Average Valuation, Tax Rate, and Tax Levy on Parcels by Class for Select Massachusetts
Industrial Cities, 2006
Average Assessed
Value Tax Rate (per
$1,000) Average Tax Levy
Industrial Property Holyoke $ 374,181 $ 37.13 $ 13,893 Lowell $ 705,471 $ 19.89 $ 14,032 Springfield $ 546,238 $ 33.02 $ 18,037 Worcester $ 651,063 $ 25.20 $ 16,407
Commercial Property Holyoke $ 619,703 $ 37.13 $ 23,010 Lowell $ 370,527 $ 19.89 $ 7,370 Springfield $ 405,623 $ 33.02 $ 13,394 Worcester $ 606,924 $ 25.20 $ 15,294
Source: MA Department of Revenue. Available incentives
Springfield is part of an Economic Target Area identified by the state of Massachusetts, a designation that allows municipal officials to offer economic incentives to help create and retain local jobs. One such incentive is tax increment financing (TIF), which enables cities and towns to offer certain property tax exemptions subsidizing private development. When using TIF financing, city officials work with current and prospective business owners to offer property tax exemptions on a percentage of the value added as a result construction and improvement activities; such exemptions remain in effect for between five and twenty years, depending on the agreement between the city and the business’ owners. Cities and towns may assess betterment fees to help finance infrastructure investments necessary to support the new development. According to the Massachusetts Department of Economic Development, between July 2002 and June 2004, Springfield had used TIF financing for two projects that invested a total of $1.9 million into two city businesses and retained 27 jobs. The larger project, with an investment of $1.4 million, was granted a tax exemption on a portion of the new investment for 20 years; the smaller project, which invested $500,000, was granted a five-year exemption. Training grants are another source of economic incentives used to promote business growth and job creation in the city. The largest category of grants, general program grants, subsidize employer training activities, improving worker skills and increasing productivity. Grants are awarded in amounts between $2,000 and $250,000; employers must match grant funds 100 percent. According to the Hampden County Regional Employment Board, between 1998 and 2005, nearly $3.3 million dollars was awarded by the Massachusetts Department of Workforce Development to Springfield businesses through this program, 32.8 percent of the total of $10.5 million awarded in the Hampden County Workforce Investment Area.

A Demographic and Economic Analysis of the City of Springfield
Pioneer Valley Planning Commission Regional Information Center 110
Transportation infrastructure According to the Massachusetts Department of Revenue, 497.9 miles of roadways traverse the City of Springfield. Of these, 102.2 miles are principal arterials, or majors highways that serve corridor movements and have trip lengths and travel densities to indicate substantial travel. These routes provide access to and within the city. In addition, 97.2 miles of local roads facilitate short distance travel and provide access to adjacent land. A majority of the road miles in Springfield make up officially accepted municipal roads under the jurisdiction of the city. However, a significant percentage of the city’s roads, 89.3 miles or 17.9 percent of the total road miles, are unaccepted roads or private ways. These roads are not officially accepted by municipal authorities, and as such, are not maintained by state or local authorities, and may vary in their layout, construction, and condition. Springfield’s Department of Public Works has developed a program to help bring unaccepted roads up to current engineering standards so that they can be officially accepted and maintained by the city.
Since 2000, the Massachusetts Highway Department has contracted for more than $55 million in roadways improvement projects in Springfield. Among these, more than $13 million was spent on a ramp reversal project on Interstate 91 near the new Basketball Hall of Fame. This project eliminated weave maneuvers previously necessary for cars entering and exiting the interstate in the downtown area. There are an additional $26 million in roadways improvement projects in Springfield in the current regional transportation improvement program. Among these projects is nearly $10 million for State Street improvements related to the city’s overall State Street Corridor improvement project. While the funding for the State Street improvements appears to be secure, funding for the remaining $16 million in projects is uncertain as it is subject to the state budget and competes with numerous other projects around the state including repairs to the Central Artery Tunnel project in Boston.
Springfield is connected to major urban centers in New England by two major highways, Interstate 90 (the Massachusetts Turnpike), which travels east-west, and Interstate 91, which travels north-south. These routes offer easy access to all markets in the eastern United States and Canada. Because of its geographic proximity and transportation infrastructure, people and goods can travel from Springfield to major population centers in New England, including Albany, Boston, Hartford, and New York City, within hours.
One transportation-related problem that Springfield faces, common to most urban centers, is congestion. From 1990 to 2000, the U.S. Census Bureau reports that the average drive time to work for Springfield residents increased 15.9 percent, from 18.5 minutes to 21.5 minutes. In addition, the number of registered vehicles in Springfield has increased steadily from 2000 to 2005, with the exception of a brief pause in growth during the period of the 2001 economic recession. Much of this growth has been in the registration of light trucks. Over the course of this five-year period, there was a net increase of 11,099 vehicles registered in the city, 8,556 of which were light trucks (which includes sports-utility vehicles). Automobiles accounted for 366 additional vehicle registrations during the same period. In 2003, seven sites in Springfield were identified as problem locations as part of the Pioneer Valley Region’s Congestion Management System, including entry points to the city from Agawam and Ludlow, and five intra-city locations including Sumner Avenue and the Interstate 291 Rotary at Magazine Street and Armory Street.
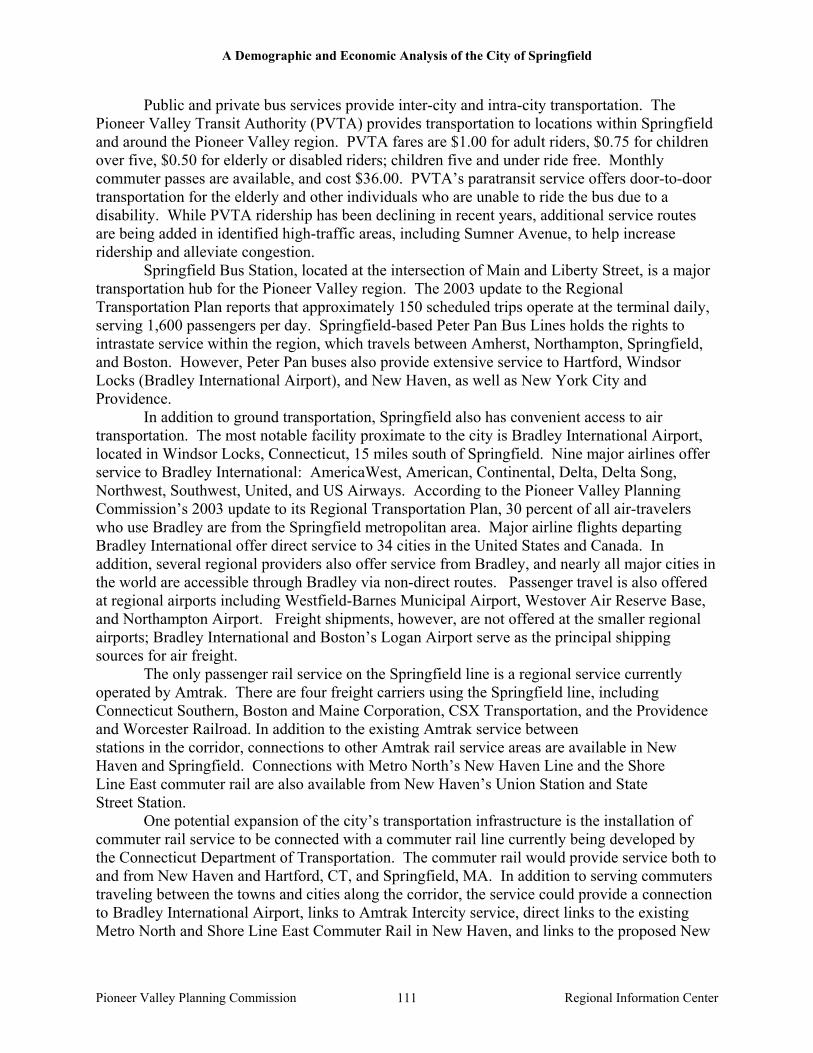
A Demographic and Economic Analysis of the City of Springfield
Pioneer Valley Planning Commission Regional Information Center 111
Public and private bus services provide inter-city and intra-city transportation. The Pioneer Valley Transit Authority (PVTA) provides transportation to locations within Springfield and around the Pioneer Valley region. PVTA fares are $1.00 for adult riders, $0.75 for children over five, $0.50 for elderly or disabled riders; children five and under ride free. Monthly commuter passes are available, and cost $36.00. PVTA’s paratransit service offers door-to-door transportation for the elderly and other individuals who are unable to ride the bus due to a disability. While PVTA ridership has been declining in recent years, additional service routes are being added in identified high-traffic areas, including Sumner Avenue, to help increase ridership and alleviate congestion.
Springfield Bus Station, located at the intersection of Main and Liberty Street, is a major transportation hub for the Pioneer Valley region. The 2003 update to the Regional Transportation Plan reports that approximately 150 scheduled trips operate at the terminal daily, serving 1,600 passengers per day. Springfield-based Peter Pan Bus Lines holds the rights to intrastate service within the region, which travels between Amherst, Northampton, Springfield, and Boston. However, Peter Pan buses also provide extensive service to Hartford, Windsor Locks (Bradley International Airport), and New Haven, as well as New York City and Providence.
In addition to ground transportation, Springfield also has convenient access to air transportation. The most notable facility proximate to the city is Bradley International Airport, located in Windsor Locks, Connecticut, 15 miles south of Springfield. Nine major airlines offer service to Bradley International: AmericaWest, American, Continental, Delta, Delta Song, Northwest, Southwest, United, and US Airways. According to the Pioneer Valley Planning Commission’s 2003 update to its Regional Transportation Plan, 30 percent of all air-travelers who use Bradley are from the Springfield metropolitan area. Major airline flights departing Bradley International offer direct service to 34 cities in the United States and Canada. In addition, several regional providers also offer service from Bradley, and nearly all major cities in the world are accessible through Bradley via non-direct routes. Passenger travel is also offered at regional airports including Westfield-Barnes Municipal Airport, Westover Air Reserve Base, and Northampton Airport. Freight shipments, however, are not offered at the smaller regional airports; Bradley International and Boston’s Logan Airport serve as the principal shipping sources for air freight.
The only passenger rail service on the Springfield line is a regional service currently operated by Amtrak. There are four freight carriers using the Springfield line, including Connecticut Southern, Boston and Maine Corporation, CSX Transportation, and the Providence and Worcester Railroad. In addition to the existing Amtrak service between stations in the corridor, connections to other Amtrak rail service areas are available in New Haven and Springfield. Connections with Metro North’s New Haven Line and the Shore Line East commuter rail are also available from New Haven’s Union Station and State Street Station. One potential expansion of the city’s transportation infrastructure is the installation of commuter rail service to be connected with a commuter rail line currently being developed by the Connecticut Department of Transportation. The commuter rail would provide service both to and from New Haven and Hartford, CT, and Springfield, MA. In addition to serving commuters traveling between the towns and cities along the corridor, the service could provide a connection to Bradley International Airport, links to Amtrak Intercity service, direct links to the existing Metro North and Shore Line East Commuter Rail in New Haven, and links to the proposed New

A Demographic and Economic Analysis of the City of Springfield
Pioneer Valley Planning Commission Regional Information Center 112
Britain-Hartford Busway. The line itself would utilize 62 miles of existing rail line, owned and operated by Amtrak, beginning in New Haven at Union Station, continuing through several towns and the cities of Meriden and Hartford, and ending at Union Station in Springfield.
Figure 82
Functional Classification of Springfield Miles of Roadways (Total miles of roadway = 497.8 miles)
Principal Arterials47%
Local Roads45%
Interstates4%
Major collectors4%
Source: Pioneer Valley Planning Commission, Regional Transportation Plan, 2003 Update
Table 23: Classification of Miles of Roadway in Springfield
Accepted City 395.0 miles Mass Highway 12.1 miles State Institutional 1.4 miles Unaccepted 89.3 miles
Source: Pioneer Valley Planning Commission.

A Demographic and Economic Analysis of the City of Springfield
Pioneer Valley Planning Commission Regional Information Center 113
Figure 83
Number of Registered Vehicles in Springfield, 2000-2005
50,000
60,000
70,000
80,000
90,000
100,000
110,000
120,000
2000 2001 2002 2003 2004 2005
All
Reg
iste
red
Veh
icle
s
Source: Massachusetts Department of Revenue, Municipal Databank
Table 24: Primary Destinations of Flights from Bradley International Airport
Atlanta, GA Milwaukee, WI Baltimore, MD Minneapolis, MN Buffalo, NY Montreal, QC (Canada) Charlotte, NC Nashville, TN Chicago, IL Newark, NJ Cleveland, OH Orlando, FL Columbus, OH Philadelphia, PA Cincinnati, OH Phoenix, AZ Dallas-Fort Worth, TX Pittsburgh, PA Detroit, MI Raleigh-Durham, NC Fort Lauderdale, FL Rochester, NY Fort Myers, FL San Juan, Puerto Rico Houston, TX St. Louis, MO Indianapolis, IN Syracuse, NY Las Vegas, NV Tampa, FL Los Angeles, CA Toronto, ON (Canada) Miami, FL Washington, DC
Source: Bradley International Airport, available at http://www.bradleyairport.com/flights/destinations.php.

A Demographic and Economic Analysis of the City of Springfield
Pioneer Valley Planning Commission Regional Information Center 114
Analyzing Peer Cities For purposes of understanding Springfield, and for identifying areas of strength and weakness, it is important to compare the city to other cities that might in some respect seem comparable. The purpose of this chapter is to analyze Springfield in comparison to similarly sized cities from across the country. The intention is to identify strengths and weaknesses that are not evident when analyzing Springfield’s data alone or even when comparing Springfield to the state of Massachusetts as a whole. Initially, thirteen cities were identified for comparison to Springfield. These thirteen cities are a selection of the cities that had a 2000 population within about 20,000 people (plus or minus) that of Springfield. While other cities than these thirteen had populations similar to that of Springfield, cities that would be familiar to a typical reader of this report were favored over cities that might be unfamiliar to most readers. Therefore, we selected Dayton, Ohio rather than Fontana, California on the entirely subjective basis that Dayton is likely more recognizable to most readers than Fontana. Subsequently, Hartford, Connecticut was added to the list of peer cities because of its relevance as Springfield’s nearby “sister city.”
Table 25: Population of Peer Cities, 2000
City 2000 Population Worcester, MA 172,648 Dayton, OH 166,193 Tempe, AZ 158,426 Huntsville, AL 157,899 Fort Lauderdale, FL 152,125 Springfield, MA 152,082 Tallahassee, FL 150,581 Paterson, NJ 149,222 Syracuse, NY 147,326 Hampton, VA 146,437 Vancouver, WA 143,226 Warren, MI 138,276 Eugene, OR 137,799 Salem, OR 136,694 Hartford, CT 121,578
Source: U.S. Census Bureau, 2000 Census. Selection might have been conducted differently, without such a reliance on a single
similarity like population size. For example, it was considered whether Springfield ought to be compared with a city against which it competes either for residents or businesses. However, assembling a list of cities against which Springfield competes would have been inconsistent with the realities of economic development and population attraction. Residents and businesses choose to locate in regions not in particular municipalities, therefore an appropriate analysis of Springfield’s competitors would require comparing Springfield’s region with that of other regions. The city of Springfield competes within its region for businesses and residents who have already elected to locate within or near the Pioneer Valley. Therefore, we decided to compare Springfield to other cities of a similar size because cities of a similar size likely face similar challenges at least with respect to scale.

A Demographic and Economic Analysis of the City of Springfield
Pioneer Valley Planning Commission Regional Information Center 115
Upon further analysis of the initial list of thirteen comparison cities, it was decided to further limit the list to those cities that are the principal city of their respective region or metropolitan area. This was decided because the reality and circumstances of a city like Tempe, Arizona are heavily influenced by its being a part of the much larger Phoenix metropolitan area. Cities of a size similar to Springfield but located in the same region as a much larger city are much more likely to be partly employment centers and partly bedroom communities for other employment centers. Therefore, for purposes of this chapter, Hampton, Virginia; Paterson, New Jersey; Tempe, Arizona; Vancouver, Washington; and, Warren, Michigan are excluded because they are not the principal city of their respective metropolitan area. Finally, Salem, Oregon was excluded from the analysis because it seemed unnecessary to include two similarly-sized cities from Oregon. Fort Lauderdale and Tallahassee, though both in Florida, were each included because they are very different cities in very different parts of Florida.
Figure 84
Total Population of Peer Cities, 2000
0
20,000
40,000
60,000
80,000
100,000
120,000
140,000
160,000
180,000
200,000
Spring
field,
MA
Dayton
, OH
Eugen
e, OR
Fort Lau
derda
le, FL
Hartfor
d, CT
Huntsv
ille, A
L
Syracu
se, N
Y
Tallah
assee,
FL
Worc
ester,
MA
Source: U.S. Census Bureau, 2000 Census.

A Demographic and Economic Analysis of the City of Springfield
Pioneer Valley Planning Commission Regional Information Center 116
Population Demographics and Socio-Economics Among the final eight peer cities, Springfield’s population is nearly in the middle, with three cities slightly larger and five cities slightly smaller. Worcester, Massachusetts has an estimated 2000 population of 172,648 and is the largest, while Hartford, Connecticut is the smallest with a 2000 estimated population of 121,578. Between 2000 and 2005 the population of Springfield, as estimated by the U.S. Census Bureau, has remained relatively stable while that of some peer cities has increased and others decreased. Both Dayton and Syracuse lost population between 2000 and 2005, while the other peer cities grew. Fort Lauderdale experienced the largest population gain, above 8 percent.
An immediate distinction between Springfield and the peer cities emerge when you observe that Springfield’s population is less than half white, non-Hispanic. Other than Hartford, Connecticut, every peer city has a population that is at least 50 percent white, non-Hispanic. Interestingly, among the original comparison cities, Springfield did not have the lowest percentage white, non-Hispanic, but once similarly sized cities that are part of larger metropolitan areas are eliminated Springfield has the lowest percentage excepting Hartford. This suggests that Springfield is unusually diverse for a city of its size that is also the central city of its metropolitan area. More than one-quarter of Springfield’s population is of Hispanic origin. Among peer cities, only Hartford has a percentage Hispanic higher than that of Springfield. Worcester has the next highest percentage with around 15 percent of its population being of Hispanic origin. Excluding Hartford, which is included not for its similar size but proximate location, it is immediately evident in our analysis that Springfield has more racial and ethnic diversity than similarly-sized communities. Springfield is also younger than seven of the eight peer cities analyzed here. Again, Hartford is the exception with a slightly higher percentage of the population under 18. In 2000, 27.8 percent of Springfield’s population was under the age of 18, compared to only 24 percent for Dayton and Syracuse. Whether this is good or bad news depends on how effectively the city’s families and social support networks contribute to the healthy growth and development of this large concentration of children. It is good news if this population of young people can be given the skills and training necessary to integrate themselves into the workforce of the future, otherwise it will be bad news. Given the overwhelming migration of retirees to southern climates, it is unsurprising that Fort Lauderdale and Tallahassee have the lowest percentages children. Nearly half of families with children in Springfield are headed by a single female. Similar percentages of families are headed by single females in Dayton and Syracuse, but in several peer cities, notably Eugene, less than one in four families with children are headed by single females. A large population of children and a large percentage of families with children headed by a single parent is a worrisome reality for Springfield given the additional challenges, statistically, faced by children raised in single-mother households. Again, the reality in Springfield pales in comparison to that of Hartford where nearly 60 percent of families with children are headed by single females. Turning to the issue of migration and mobility, it is evident that Springfield has one of the most stable populations among the group of comparison cities. Nearly 90 percent of Springfield’s residents in 2000 lived in the same county (Hampden County, Massachusetts) in 1995. Dayton, Hartford, and Worcester have similarly high percentages of stable residents, but no other peer city has a percentage above 80 percent.
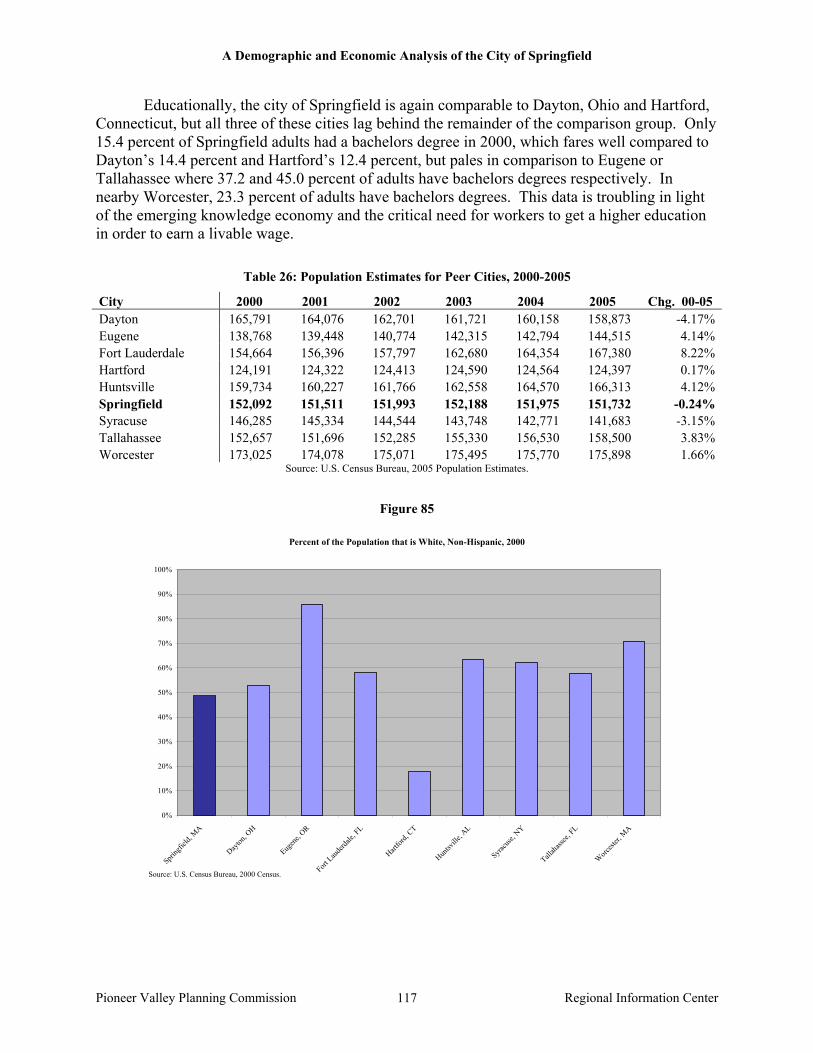
A Demographic and Economic Analysis of the City of Springfield
Pioneer Valley Planning Commission Regional Information Center 117
Educationally, the city of Springfield is again comparable to Dayton, Ohio and Hartford, Connecticut, but all three of these cities lag behind the remainder of the comparison group. Only 15.4 percent of Springfield adults had a bachelors degree in 2000, which fares well compared to Dayton’s 14.4 percent and Hartford’s 12.4 percent, but pales in comparison to Eugene or Tallahassee where 37.2 and 45.0 percent of adults have bachelors degrees respectively. In nearby Worcester, 23.3 percent of adults have bachelors degrees. This data is troubling in light of the emerging knowledge economy and the critical need for workers to get a higher education in order to earn a livable wage.
Table 26: Population Estimates for Peer Cities, 2000-2005
City 2000 2001 2002 2003 2004 2005 Chg. 00-05 Dayton 165,791 164,076 162,701 161,721 160,158 158,873 -4.17% Eugene 138,768 139,448 140,774 142,315 142,794 144,515 4.14% Fort Lauderdale 154,664 156,396 157,797 162,680 164,354 167,380 8.22% Hartford 124,191 124,322 124,413 124,590 124,564 124,397 0.17% Huntsville 159,734 160,227 161,766 162,558 164,570 166,313 4.12% Springfield 152,092 151,511 151,993 152,188 151,975 151,732 -0.24% Syracuse 146,285 145,334 144,544 143,748 142,771 141,683 -3.15% Tallahassee 152,657 151,696 152,285 155,330 156,530 158,500 3.83% Worcester 173,025 174,078 175,071 175,495 175,770 175,898 1.66%
Source: U.S. Census Bureau, 2005 Population Estimates.
Figure 85
Percent of the Population that is White, Non-Hispanic, 2000
0%
10%
20%
30%
40%
50%
60%
70%
80%
90%
100%
Spring
field,
MA
Dayton
, OH
Eugen
e, OR
Fort Lau
derda
le, FL
Hartfor
d, CT
Huntsv
ille, A
L
Syracu
se, N
Y
Tallah
assee,
FL
Worc
ester,
MA
Source: U.S. Census Bureau, 2000 Census.

A Demographic and Economic Analysis of the City of Springfield
Pioneer Valley Planning Commission Regional Information Center 118
Figure 86
Percent of the Population that is of Hispanic Origin, 2000
0%
5%
10%
15%
20%
25%
30%
35%
40%
45%
Spring
field,
MA
Dayton
, OH
Eugen
e, OR
Fort Lau
derda
le, FL
Hartfor
d, CT
Huntsv
ille, A
L
Syracu
se, N
Y
Tallah
assee,
FL
Worc
ester,
MA
Source: U.S. Census Bureau, 2000 Census.
Figure 87
Percent of the Population that is Under 18 Years of Age, 2000
0.0%
5.0%
10.0%
15.0%
20.0%
25.0%
30.0%
35.0%
Spring
field,
MA
Dayton
, OH
Eugen
e, OR
Fort Lau
derda
le, FL
Hartfor
d, CT
Huntsv
ille, A
L
Syracu
se, N
Y
Tallah
assee,
FL
Worc
ester,
MA
Source: U.S. Census Bureau, 2000 Census.

A Demographic and Economic Analysis of the City of Springfield
Pioneer Valley Planning Commission Regional Information Center 119
Figure 88
Percent of Families, with Children under 18, Headed by a Single Female, 2000
0.0%
10.0%
20.0%
30.0%
40.0%
50.0%
60.0%
70.0%
Spring
field,
MA
Dayton
, OH
Eugen
e, OR
Fort Lau
derda
le, FL
Hartfor
d, CT
Huntsv
ille, A
L
Syracu
se, N
Y
Tallah
assee,
FL
Worc
ester,
MA
Source: U.S. Census Bureau, 2000 Census.
Figure 89
Percent of Households Living in the Same County in 2000 as in 1995
0%
10%
20%
30%
40%
50%
60%
70%
80%
90%
100%
Spring
field,
MA
Dayton
, OH
Eugen
e, OR
Fort Lau
derda
le, FL
Hartfor
d, CT
Huntsv
ille, A
L
Syracu
se, N
Y
Tallah
assee,
FL
Worc
ester,
MA
Source: U.S. Census Bureau, 2000 Census.
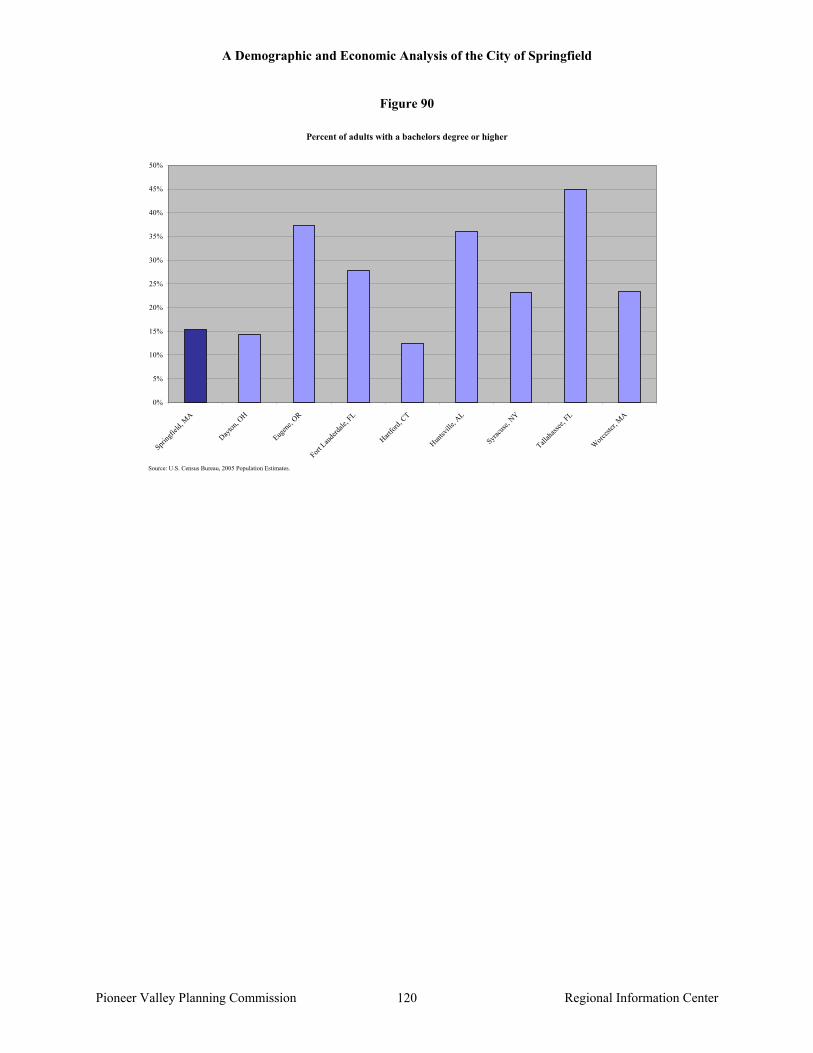
A Demographic and Economic Analysis of the City of Springfield
Pioneer Valley Planning Commission Regional Information Center 120
Figure 90
Percent of adults with a bachelors degree or higher
0%
5%
10%
15%
20%
25%
30%
35%
40%
45%
50%
Spring
field,
MA
Dayton
, OH
Eugen
e, OR
Fort Lau
derda
le, FL
Hartfor
d, CT
Huntsv
ille, A
L
Syracu
se, N
Y
Tallah
assee,
FL
Worc
ester,
MA
Source: U.S. Census Bureau, 2005 Population Estimates.

A Demographic and Economic Analysis of the City of Springfield
Pioneer Valley Planning Commission Regional Information Center 121
Household Economics
Both the low levels of educational attainment and the high percentage of families headed by a single parent make it unsurprising that Springfield has one of the highest poverty rates among peer cities. Hartford, Syracuse, and Tallahassee each have higher poverty rates than Springfield, at 30.6, 27.3, and 24.7 percent respectively. Springfield’s poverty rate, at 23.1 percent, is unacceptably high, more than ten percentage points above that of the nation and meaning that nearly one in four Springfield residents live below the Federal poverty line.
Turning to child poverty rates (the percent of children living in households with incomes below the Federal poverty line), in Hartford, Springfield, and Syracuse more than one in three children live in poverty. Child poverty rates are high in all the peer cities, but seem drastically so in Hartford, Springfield, and Syracuse. This is one byproduct of so many children living in single-parent households in a city with low levels of educational attainment. Low earning power workers living in households with only one wage earner is a recipe for high poverty rates. Given the high poverty rates in Springfield, which reflects low income, it is perhaps unsurprising that 41.8 percent of Springfield households who rent are spending 30 percent or more of their income on housing. Nevertheless, in five peer cities – Eugene, Fort Lauderdale, Hartford, Syracuse, and Tallahassee – a higher percentage of renters spend 30 percent or more of their income on housing than is the case in Springfield. Despite Springfield’s location in New England, and despite the relatively low income of its population, housing in Springfield remains more affordable for renters than is the case in a majority of similarly-sized cities.
The per capita income in the Springfield area (Hampden County) in 2004 was $31,070, with the counties of six of the eight peer cities having higher per capita incomes. Only the counties of Eugene and Tallahassee had per capita incomes lower than that of Springfield. Between 2001 and 2004, Hampden County’s per capita income increased by 2.3 percent. While this rate of growth lags behind three of the peer cities, Springfield’s home county substantially outpaced the counties of nearby Hartford and Worcester. Because per capita incomes were adjusted for inflation before calculating percent changes, an increase reflects an actual increase in the income of the county’s residents, though it does not address the distribution of that income among people within the area. Nevertheless, if the Springfield area can maintain a positive rate of growth in per capita income, it can only be good for the city. Interestingly, despite being in generally high-cost Massachusetts, the Springfield metropolitan area does not have the highest housing prices among comparison cities’ metropolitan areas. Median sale prices for existing single-family homes are significantly higher than Springfield in Fort Lauderdale, Hartford, and Worcester. That Worcester metropolitan area prices are 44.1 percent higher than in Springfield indicates that the rapid rise of housing prices in the Greater Boston area has significantly impacted Worcester, but has not affected Springfield. It also suggests that the Springfield area remains a low-cost haven for families who can longer afford the high prices to the East and South. Springfield is also third among peer cities in the rate of housing price growth between 2003 and 2005. During that period the Springfield metropolitan area saw the median sale price for an existing single-family home rise by 17.1 percent. Only Eugene and Fort Lauderdale had larger price increases. That Springfield’s rate of price appreciation was higher than Worcester’s between 2003 and 2005 indicates the possibility that the high housing prices spreading west from Boston, that had already impacted Worcester by 2003, are now reaching parts of the Springfield metropolitan area.
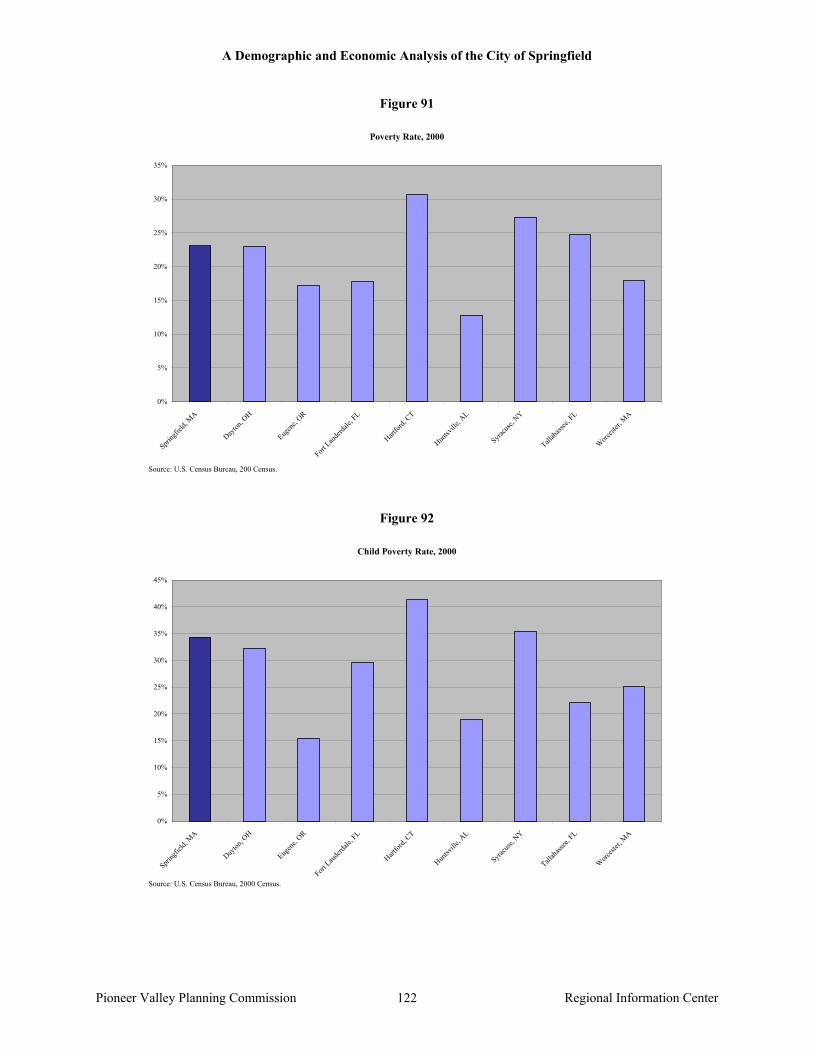
A Demographic and Economic Analysis of the City of Springfield
Pioneer Valley Planning Commission Regional Information Center 122
Figure 91
Poverty Rate, 2000
0%
5%
10%
15%
20%
25%
30%
35%
Spring
field,
MA
Dayton
, OH
Eugen
e, OR
Fort Lau
derda
le, FL
Hartfor
d, CT
Huntsv
ille, A
L
Syracu
se, N
Y
Tallah
assee,
FL
Worc
ester,
MA
Source: U.S. Census Bureau, 200 Census.
Figure 92
Child Poverty Rate, 2000
0%
5%
10%
15%
20%
25%
30%
35%
40%
45%
Spring
field,
MA
Dayton
, OH
Eugen
e, OR
Fort Lau
derda
le, FL
Hartfor
d, CT
Huntsv
ille, A
L
Syracu
se, N
Y
Tallah
assee,
FL
Worc
ester,
MA
Source: U.S. Census Bureau, 2000 Census.
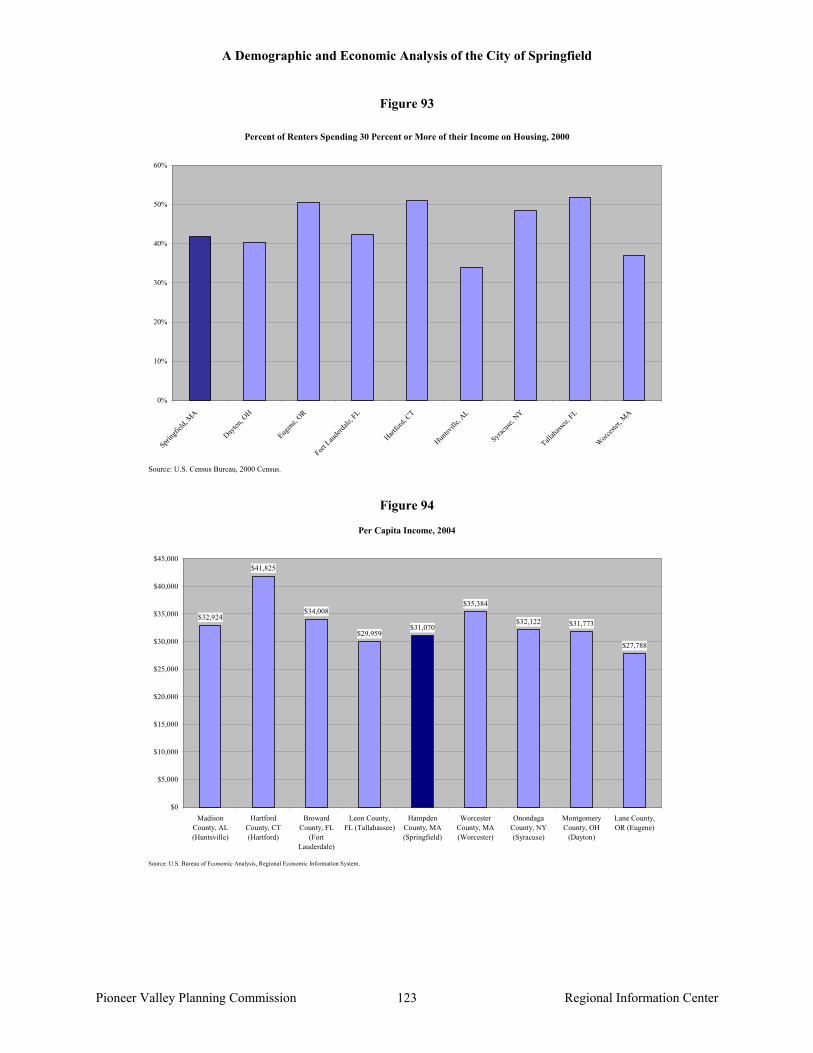
A Demographic and Economic Analysis of the City of Springfield
Pioneer Valley Planning Commission Regional Information Center 123
Figure 93
Percent of Renters Spending 30 Percent or More of their Income on Housing, 2000
0%
10%
20%
30%
40%
50%
60%
Spring
field,
MA
Dayton
, OH
Eugen
e, OR
Fort Lau
derda
le, FL
Hartfor
d, CT
Huntsv
ille, A
L
Syracu
se, N
Y
Tallah
assee,
FL
Worc
ester,
MA
Source: U.S. Census Bureau, 2000 Census.
Figure 94
Per Capita Income, 2004
$32,924
$41,825
$34,008
$29,959$31,070
$35,384
$32,122 $31,773
$27,788
$0
$5,000
$10,000
$15,000
$20,000
$25,000
$30,000
$35,000
$40,000
$45,000
MadisonCounty, AL(Huntsville)
HartfordCounty, CT(Hartford)
BrowardCounty, FL
(FortLauderdale)
Leon County,FL (Tallahassee)
HampdenCounty, MA(Springfield)
WorcesterCounty, MA(Worcester)
OnondagaCounty, NY(Syracuse)
MontgomeryCounty, OH
(Dayton)
Lane County,OR (Eugene)
Source: U.S. Bureau of Economic Analysis, Regional Economic Information System.

A Demographic and Economic Analysis of the City of Springfield
Pioneer Valley Planning Commission Regional Information Center 124
Figure 95
Change in Per Capita Income, 2001-2004 (inflation-adjusted)
5.23%
0.11%
1.23%
3.08%
2.31%
-0.56%
3.65%
-0.13%
0.38%
-1%
0%
1%
2%
3%
4%
5%
6%
Madison County,AL (Huntsville)
Hartford County,CT (Hartford)
Broward County,FL (Fort
Lauderdale)
Leon County, FL(Tallahassee)
HampdenCounty, MA(Springfield)
WorcesterCounty, MA(Worcester)
OnondagaCounty, NY(Syracuse)
MontgomeryCounty, OH
(Dayton)
Lane County,OR (Eugene)
Source: U.S. Bureau of Economic Analysis, Regional Economic Information System.
Figure 96
Median Sale Price of Existing Single-Family Homes by Metropolitan Area, 2005
$119,700
$197,600
$370,100
$253,300
$201,800
$110,600
$167,600
$290,700
$0
$50,000
$100,000
$150,000
$200,000
$250,000
$300,000
$350,000
$400,000
Dayton, OH Eugene, OR Fort Lauderdale,FL
Hartford, CT Springfield, MA Syracuse, NY Tallahassee, FL Worcester, MA
Source: National Association of Realtors.Note: No data available for Huntsville, AL.

A Demographic and Economic Analysis of the City of Springfield
Pioneer Valley Planning Commission Regional Information Center 125
Figure 97
Percent Change in Sale Price of Existing Single-Family Homes by Metropolitan Area, 2003-2005(adjusted for inflation)
-1.59%
22.72%
50.56%
13.60%17.14%
9.68%
15.17%
8.42%
-10%
0%
10%
20%
30%
40%
50%
60%
Dayton
, OH
Eugen
e, OR
Fort Lau
derda
le, FL
Hartfor
d, CT
Spring
field,
MA
Syracu
se, N
Y
Tallah
assee,
FL
Worc
ester,
MA
Source: National Association of Realtors.Note: No data available for Huntsville, AL.
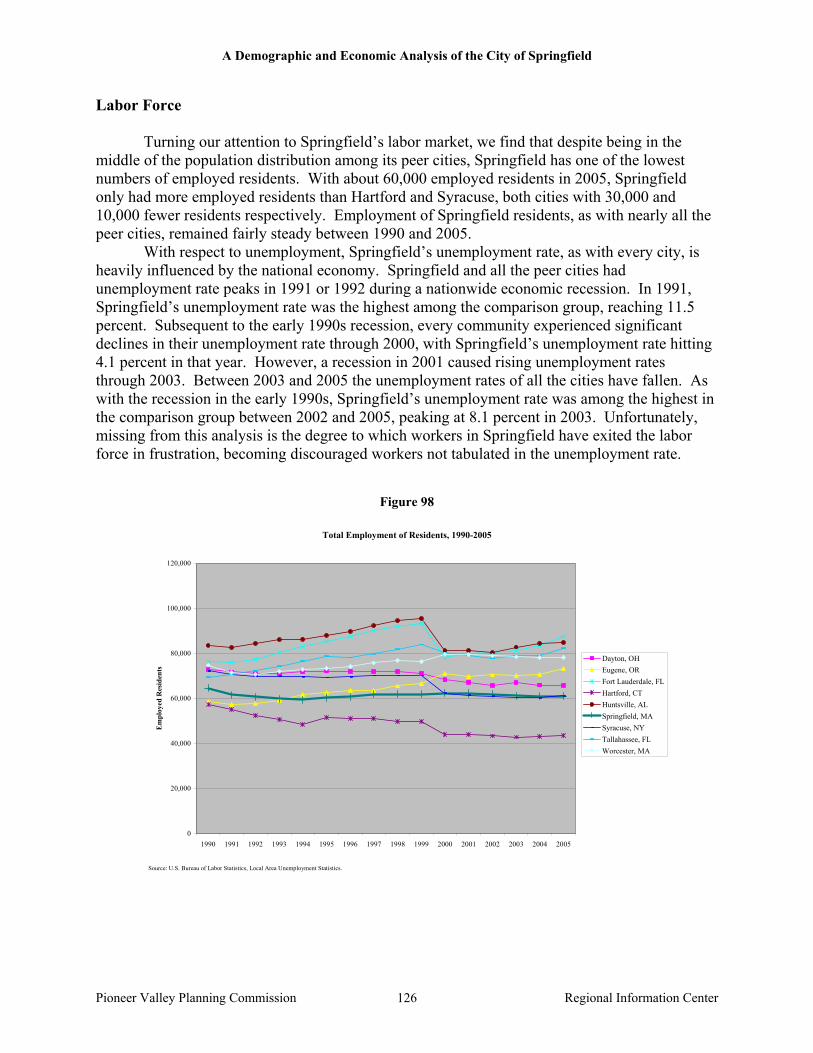
A Demographic and Economic Analysis of the City of Springfield
Pioneer Valley Planning Commission Regional Information Center 126
Labor Force Turning our attention to Springfield’s labor market, we find that despite being in the middle of the population distribution among its peer cities, Springfield has one of the lowest numbers of employed residents. With about 60,000 employed residents in 2005, Springfield only had more employed residents than Hartford and Syracuse, both cities with 30,000 and 10,000 fewer residents respectively. Employment of Springfield residents, as with nearly all the peer cities, remained fairly steady between 1990 and 2005. With respect to unemployment, Springfield’s unemployment rate, as with every city, is heavily influenced by the national economy. Springfield and all the peer cities had unemployment rate peaks in 1991 or 1992 during a nationwide economic recession. In 1991, Springfield’s unemployment rate was the highest among the comparison group, reaching 11.5 percent. Subsequent to the early 1990s recession, every community experienced significant declines in their unemployment rate through 2000, with Springfield’s unemployment rate hitting 4.1 percent in that year. However, a recession in 2001 caused rising unemployment rates through 2003. Between 2003 and 2005 the unemployment rates of all the cities have fallen. As with the recession in the early 1990s, Springfield’s unemployment rate was among the highest in the comparison group between 2002 and 2005, peaking at 8.1 percent in 2003. Unfortunately, missing from this analysis is the degree to which workers in Springfield have exited the labor force in frustration, becoming discouraged workers not tabulated in the unemployment rate.
Figure 98
Total Employment of Residents, 1990-2005
0
20,000
40,000
60,000
80,000
100,000
120,000
1990 1991 1992 1993 1994 1995 1996 1997 1998 1999 2000 2001 2002 2003 2004 2005
Em
ploy
ed R
esid
ents
Dayton, OHEugene, ORFort Lauderdale, FLHartford, CTHuntsville, ALSpringfield, MASyracuse, NYTallahassee, FLWorcester, MA
Source: U.S. Bureau of Labor Statistics, Local Area Unemployment Statistics.
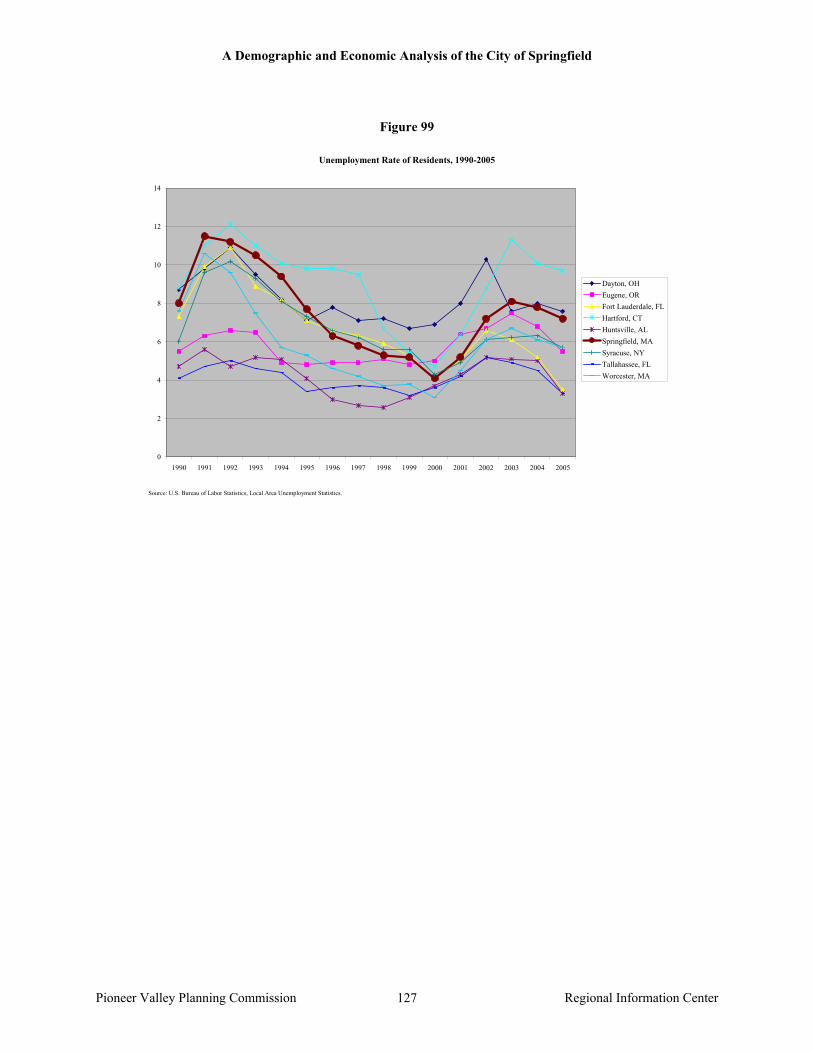
A Demographic and Economic Analysis of the City of Springfield
Pioneer Valley Planning Commission Regional Information Center 127
Figure 99
Unemployment Rate of Residents, 1990-2005
0
2
4
6
8
10
12
14
1990 1991 1992 1993 1994 1995 1996 1997 1998 1999 2000 2001 2002 2003 2004 2005
Dayton, OHEugene, ORFort Lauderdale, FLHartford, CTHuntsville, ALSpringfield, MASyracuse, NYTallahassee, FLWorcester, MA
Source: U.S. Bureau of Labor Statistics, Local Area Unemployment Statistics.
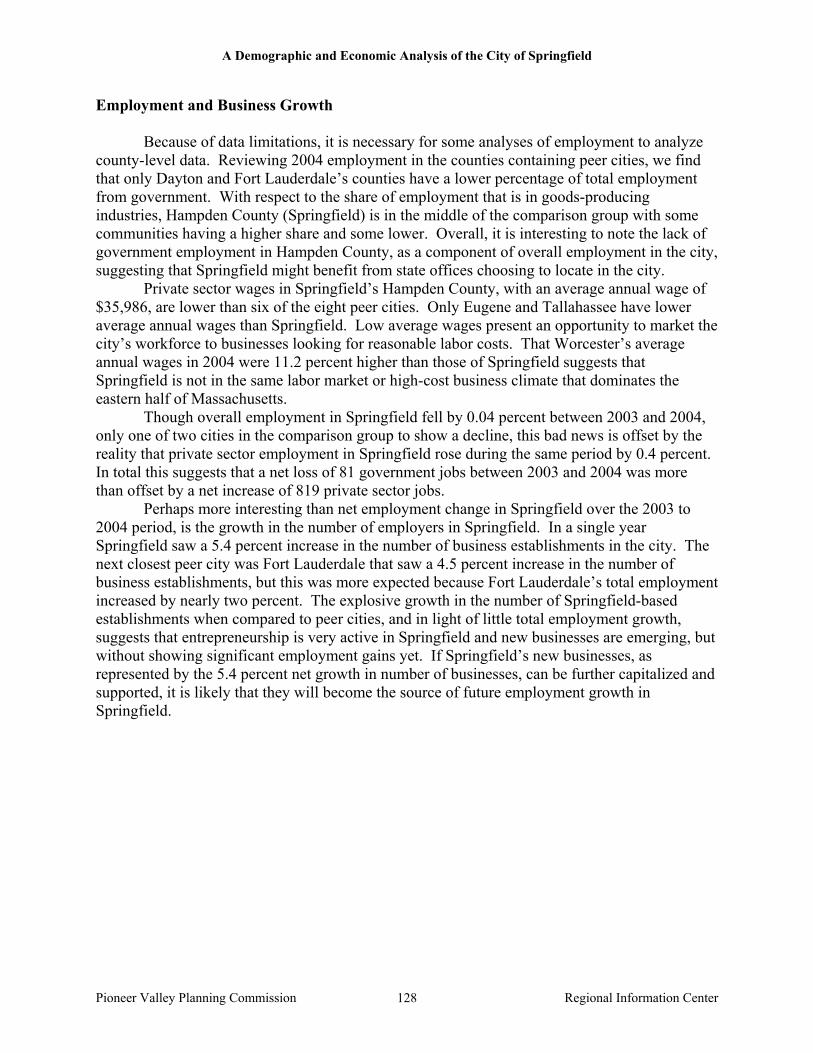
A Demographic and Economic Analysis of the City of Springfield
Pioneer Valley Planning Commission Regional Information Center 128
Employment and Business Growth Because of data limitations, it is necessary for some analyses of employment to analyze county-level data. Reviewing 2004 employment in the counties containing peer cities, we find that only Dayton and Fort Lauderdale’s counties have a lower percentage of total employment from government. With respect to the share of employment that is in goods-producing industries, Hampden County (Springfield) is in the middle of the comparison group with some communities having a higher share and some lower. Overall, it is interesting to note the lack of government employment in Hampden County, as a component of overall employment in the city, suggesting that Springfield might benefit from state offices choosing to locate in the city. Private sector wages in Springfield’s Hampden County, with an average annual wage of $35,986, are lower than six of the eight peer cities. Only Eugene and Tallahassee have lower average annual wages than Springfield. Low average wages present an opportunity to market the city’s workforce to businesses looking for reasonable labor costs. That Worcester’s average annual wages in 2004 were 11.2 percent higher than those of Springfield suggests that Springfield is not in the same labor market or high-cost business climate that dominates the eastern half of Massachusetts. Though overall employment in Springfield fell by 0.04 percent between 2003 and 2004, only one of two cities in the comparison group to show a decline, this bad news is offset by the reality that private sector employment in Springfield rose during the same period by 0.4 percent. In total this suggests that a net loss of 81 government jobs between 2003 and 2004 was more than offset by a net increase of 819 private sector jobs.
Perhaps more interesting than net employment change in Springfield over the 2003 to 2004 period, is the growth in the number of employers in Springfield. In a single year Springfield saw a 5.4 percent increase in the number of business establishments in the city. The next closest peer city was Fort Lauderdale that saw a 4.5 percent increase in the number of business establishments, but this was more expected because Fort Lauderdale’s total employment increased by nearly two percent. The explosive growth in the number of Springfield-based establishments when compared to peer cities, and in light of little total employment growth, suggests that entrepreneurship is very active in Springfield and new businesses are emerging, but without showing significant employment gains yet. If Springfield’s new businesses, as represented by the 5.4 percent net growth in number of businesses, can be further capitalized and supported, it is likely that they will become the source of future employment growth in Springfield.
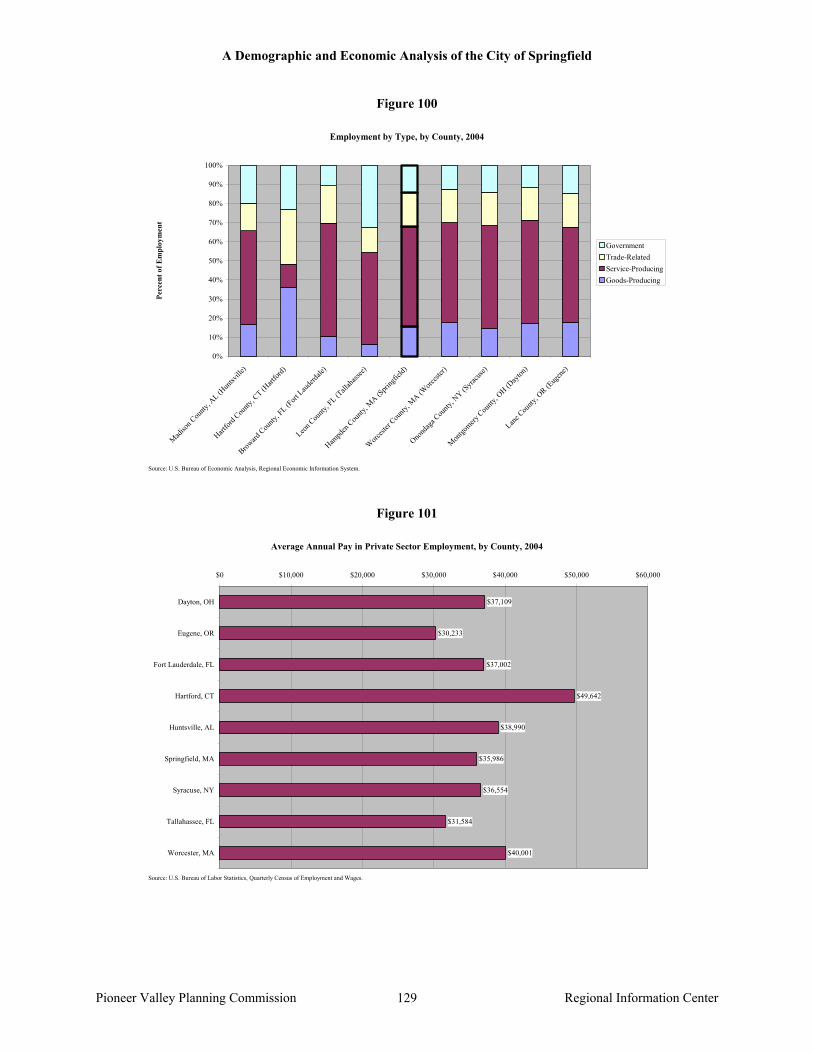
A Demographic and Economic Analysis of the City of Springfield
Pioneer Valley Planning Commission Regional Information Center 129
Figure 100
Employment by Type, by County, 2004
0%
10%
20%
30%
40%
50%
60%
70%
80%
90%
100%
Madiso
n Cou
nty, A
L (Hun
tsville
)
Hartfor
d Cou
nty, C
T (Hart
ford)
Broward
County
, FL (F
ort Lau
derda
le)
Leon C
ounty
, FL (T
allah
assee)
Hampd
en Cou
nty, M
A (Spri
ngfie
ld)
Worc
ester
County
, MA (W
orcest
er)
Onond
aga C
ounty
, NY (S
yracu
se)
Montgo
mery Cou
nty, O
H (Day
ton)
Lane C
ounty
, OR (E
ugen
e)
Perc
ent o
f Em
ploy
men
t
GovernmentTrade-RelatedService-ProducingGoods-Producing
Source: U.S. Bureau of Economic Analysis, Regional Economic Information System.
Figure 101
Average Annual Pay in Private Sector Employment, by County, 2004
$37,109
$30,233
$37,002
$49,642
$38,990
$35,986
$36,554
$31,584
$40,001
$0 $10,000 $20,000 $30,000 $40,000 $50,000 $60,000
Dayton, OH
Eugene, OR
Fort Lauderdale, FL
Hartford, CT
Huntsville, AL
Springfield, MA
Syracuse, NY
Tallahassee, FL
Worcester, MA
Source: U.S. Bureau of Labor Statistics, Quarterly Census of Employment and Wages.
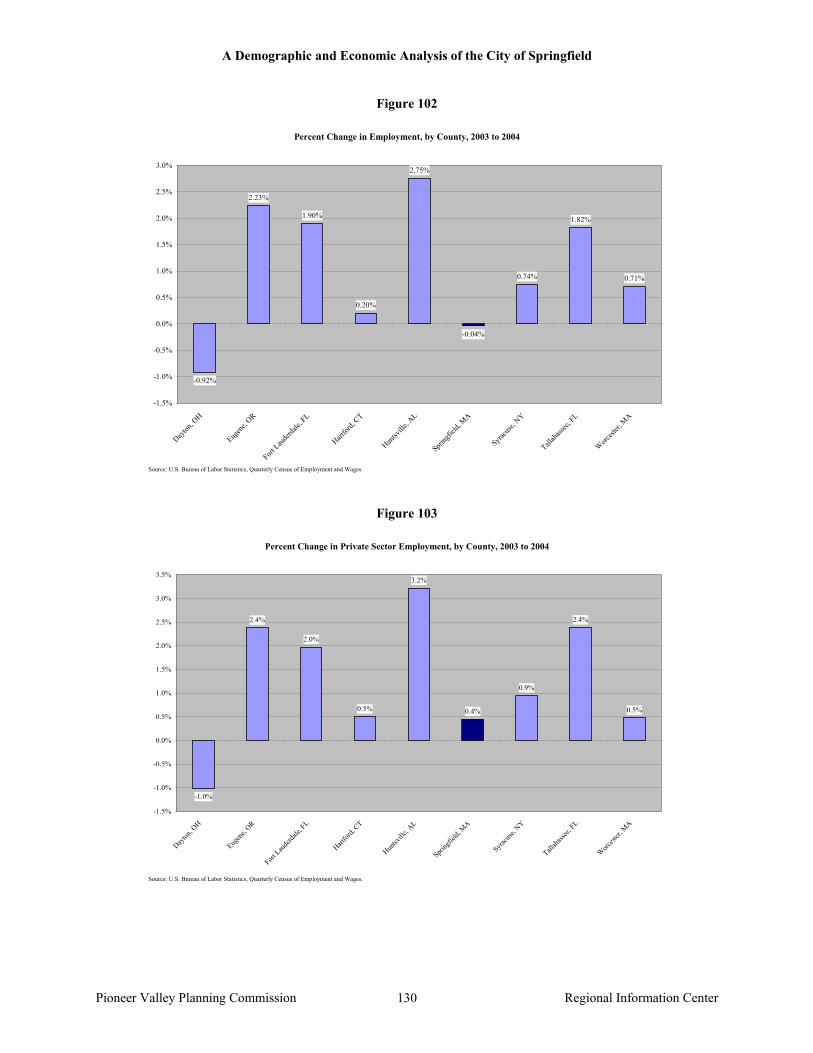
A Demographic and Economic Analysis of the City of Springfield
Pioneer Valley Planning Commission Regional Information Center 130
Figure 102
Percent Change in Employment, by County, 2003 to 2004
-0.92%
2.23%
1.90%
0.20%
2.75%
-0.04%
0.74%
1.82%
0.71%
-1.5%
-1.0%
-0.5%
0.0%
0.5%
1.0%
1.5%
2.0%
2.5%
3.0%
Dayton
, OH
Eugen
e, OR
Fort Lau
derda
le, FL
Hartfor
d, CT
Huntsv
ille, A
L
Spring
field,
MA
Syracu
se, N
Y
Tallah
assee,
FL
Worc
ester,
MA
Source: U.S. Bureau of Labor Statistics, Quarterly Census of Employment and Wages.
Figure 103
Percent Change in Private Sector Employment, by County, 2003 to 2004
-1.0%
2.4%
2.0%
0.5%
3.2%
0.4%
0.9%
2.4%
0.5%
-1.5%
-1.0%
-0.5%
0.0%
0.5%
1.0%
1.5%
2.0%
2.5%
3.0%
3.5%
Dayton
, OH
Eugen
e, OR
Fort Laud
erdale
, FL
Hartfor
d, CT
Huntsv
ille, A
L
Spring
field,
MA
Syracu
se, N
Y
Tallah
assee,
FL
Worc
ester,
MA
Source: U.S. Bureau of Labor Statistics, Quarterly Census of Employment and Wages.
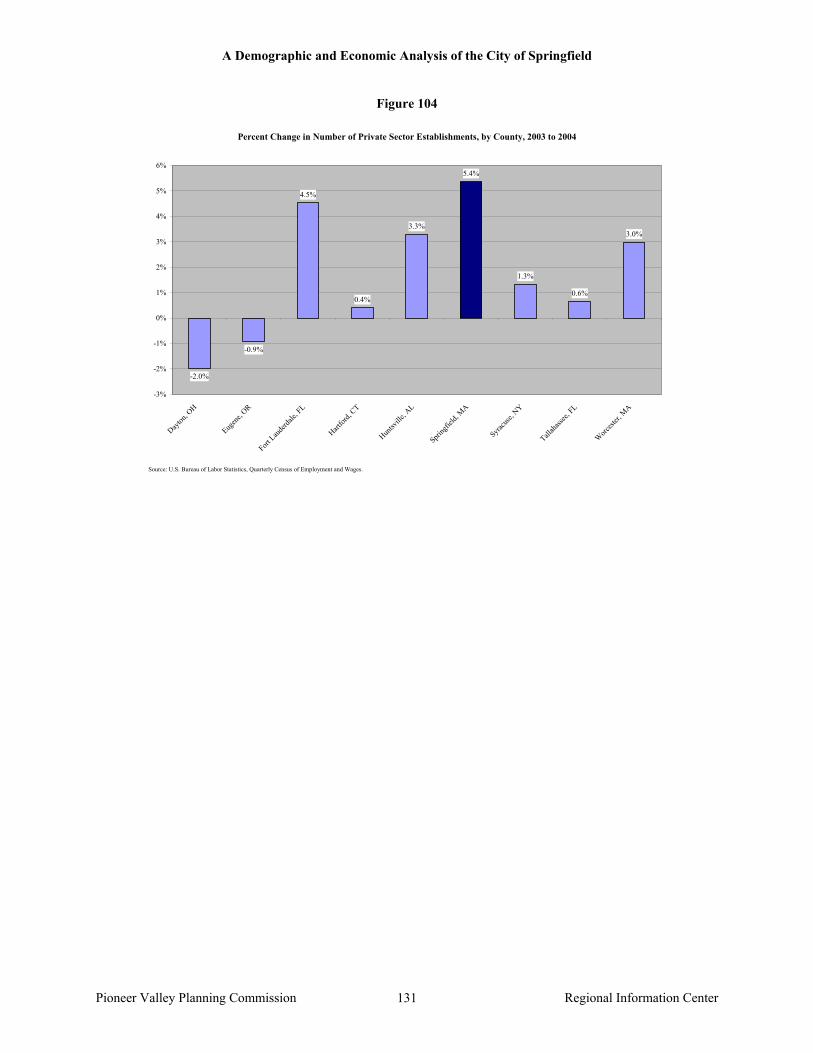
A Demographic and Economic Analysis of the City of Springfield
Pioneer Valley Planning Commission Regional Information Center 131
Figure 104
Percent Change in Number of Private Sector Establishments, by County, 2003 to 2004
-2.0%
-0.9%
4.5%
0.4%
3.3%
5.4%
1.3%
0.6%
3.0%
-3%
-2%
-1%
0%
1%
2%
3%
4%
5%
6%
Dayton
, OH
Eugen
e, OR
Fort Lau
derda
le, FL
Hartfor
d, CT
Huntsv
ille, A
L
Spring
field,
MA
Syracu
se, N
Y
Tallah
assee,
FL
Worc
ester,
MA
Source: U.S. Bureau of Labor Statistics, Quarterly Census of Employment and Wages.

A Demographic and Economic Analysis of the City of Springfield
Pioneer Valley Planning Commission Regional Information Center 132
Crime One of the challenges that has faced Springfield for years is the perception, and in some cases the reality, of high rates of crime. High rates of motor vehicle theft create significant extra expense for city residents in purchasing auto insurance. Concerns about violent or property crime can be a deterrent for potential residents and businesses. Nevertheless, it is important to compare the level of crime in Springfield to that of similarly-sized cities. One note of caution: it has been acknowledge by the Springfield Police Department that crime data reported prior to 2006 was often inaccurate, but in order to report comparable data, we elected to use the data as reported to the U.S. Department of Justice, knowing it may not be completely accurate.
Averaging crime data across 2004 and 2005, Springfield’s rate of violent crime was 8.66 violent crimes per 1,000 residents. This rate is 52.4 percent higher than the violent crime rate of Hartford, the city with the next highest rate. Beyond Hartford, Springfield’s rate of violent crime rate is 84.6 percent higher than the next two highest cities, Dayton and Syracuse. Springfield’s rate of violent crime is also more than double that of nearby Worcester. It is important to note that Springfield’s violent crime rate exceeds that of cities with higher poverty rates. Positively, Springfield does not have the highest 2004-2005 murder rate among comparison cities. Dayton, Hartford, and Syracuse all have higher murder rates than Springfield, but Springfield is fourth with 5.3 murders annually per 100,000 residents. This translates to an average of eight murders per year in Springfield. As with violent crime, Springfield’s murder rate is double that of Worcester. Unsurprisingly, the high rates for auto insurance in Springfield are not unwarranted. Among comparison cities, Springfield has the second highest rate of motor vehicle theft with 6.9 motor vehicles stolen per 1,000 residents. Only Hartford has a higher rate and Dayton has a similarly high rate, but Springfield’s rate doubles that of four of the eight peer cities. Finally, and more positively, Springfield’s overall property crime rate ranks fifth among the nine cities with 29.9 property crimes per 1,000 residents. While four peer cities exceed this rate, Springfield still has a property crime rate 68 percent higher than that of neighbor Worcester.

A Demographic and Economic Analysis of the City of Springfield
Pioneer Valley Planning Commission Regional Information Center 133
Figure 105
Violent Crime Rate, 2004-2005 Average
0
1
2
3
4
5
6
7
8
9
10
Dayton
, OH
Eugen
e, OR
Fort Lau
derda
le, FL
Hartfor
d, CT
Huntsv
ille, A
L
Spring
field,
MA
Syracu
se, N
Y
Tallah
assee,
FL
Worc
ester,
MA
Vio
lent
Crim
es p
er 1
,000
Peo
ple
Source: Federal Bureau of Investigation, Uniform Crime Reports.
Figure 106
Murder Rate, 2004-2005 Average
0
1
2
3
4
5
6
7
8
9
10
Dayton
, OH
Eugen
e, OR
Fort Lau
derda
le, FL
Hartfor
d, CT
Huntsv
ille, A
L
Spring
field,
MA
Syracu
se, N
Y
Tallah
assee,
FL
Worc
ester,
MA
Mur
ders
per
100
,000
Peo
ple
Source: Federal Bureau of Investigation, Uniform Crime Reports.
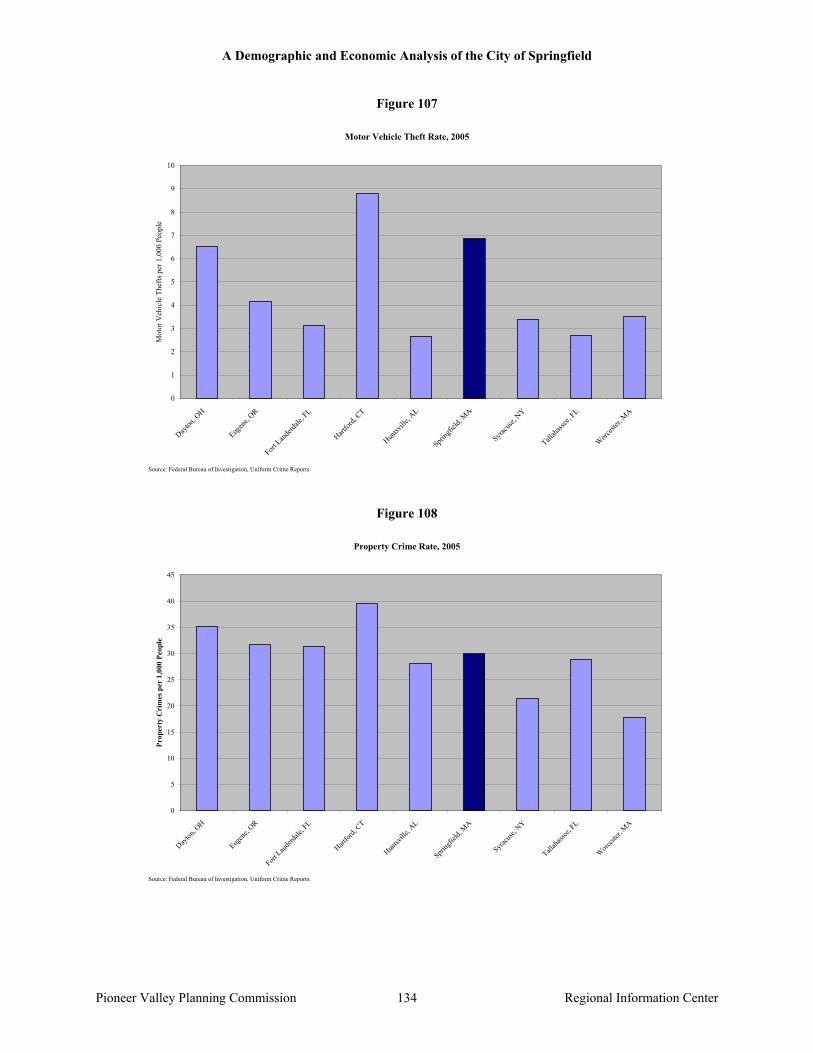
A Demographic and Economic Analysis of the City of Springfield
Pioneer Valley Planning Commission Regional Information Center 134
Figure 107
Motor Vehicle Theft Rate, 2005
0
1
2
3
4
5
6
7
8
9
10
Dayton
, OH
Eugen
e, OR
Fort Lau
derda
le, FL
Hartfor
d, CT
Huntsv
ille, A
L
Spring
field,
MA
Syracu
se, N
Y
Tallah
assee,
FL
Worc
ester,
MA
Mot
or V
ehic
le T
hefts
per
1,0
00 P
eopl
e
Source: Federal Bureau of Investigation, Uniform Crime Reports.
Figure 108
Property Crime Rate, 2005
0
5
10
15
20
25
30
35
40
45
Dayton
, OH
Eugen
e, OR
Fort Lau
derda
le, FL
Hartfor
d, CT
Huntsv
ille, A
L
Spring
field,
MA
Syracu
se, N
Y
Tallah
assee,
FL
Worc
ester,
MA
Prop
erty
Cri
mes
per
1,0
00 P
eopl
e
Source: Federal Bureau of Investigation, Uniform Crime Reports.
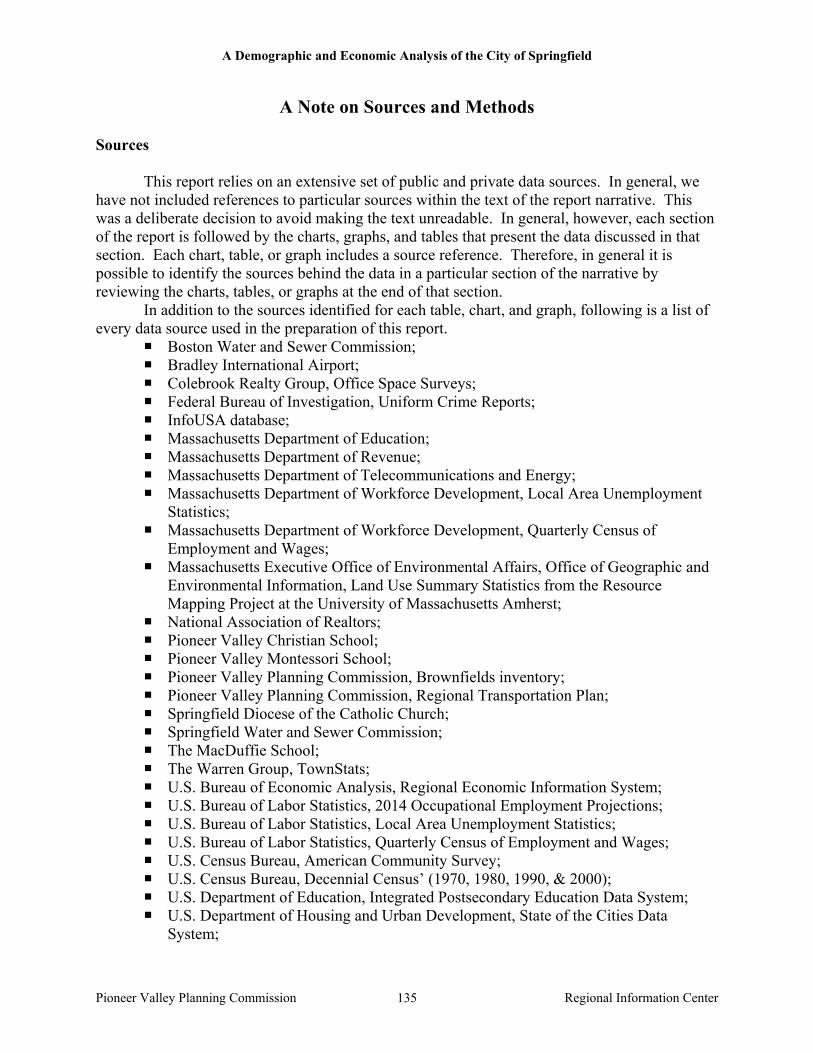
A Demographic and Economic Analysis of the City of Springfield
Pioneer Valley Planning Commission Regional Information Center 135
A Note on Sources and Methods Sources This report relies on an extensive set of public and private data sources. In general, we have not included references to particular sources within the text of the report narrative. This was a deliberate decision to avoid making the text unreadable. In general, however, each section of the report is followed by the charts, graphs, and tables that present the data discussed in that section. Each chart, table, or graph includes a source reference. Therefore, in general it is possible to identify the sources behind the data in a particular section of the narrative by reviewing the charts, tables, or graphs at the end of that section. In addition to the sources identified for each table, chart, and graph, following is a list of every data source used in the preparation of this report.
Boston Water and Sewer Commission; Bradley International Airport; Colebrook Realty Group, Office Space Surveys; Federal Bureau of Investigation, Uniform Crime Reports; InfoUSA database; Massachusetts Department of Education; Massachusetts Department of Revenue; Massachusetts Department of Telecommunications and Energy; Massachusetts Department of Workforce Development, Local Area Unemployment
Statistics; Massachusetts Department of Workforce Development, Quarterly Census of
Employment and Wages; Massachusetts Executive Office of Environmental Affairs, Office of Geographic and
Environmental Information, Land Use Summary Statistics from the Resource Mapping Project at the University of Massachusetts Amherst;
National Association of Realtors; Pioneer Valley Christian School; Pioneer Valley Montessori School; Pioneer Valley Planning Commission, Brownfields inventory; Pioneer Valley Planning Commission, Regional Transportation Plan; Springfield Diocese of the Catholic Church; Springfield Water and Sewer Commission; The MacDuffie School; The Warren Group, TownStats; U.S. Bureau of Economic Analysis, Regional Economic Information System; U.S. Bureau of Labor Statistics, 2014 Occupational Employment Projections; U.S. Bureau of Labor Statistics, Local Area Unemployment Statistics; U.S. Bureau of Labor Statistics, Quarterly Census of Employment and Wages; U.S. Census Bureau, American Community Survey; U.S. Census Bureau, Decennial Census’ (1970, 1980, 1990, & 2000); U.S. Department of Education, Integrated Postsecondary Education Data System; U.S. Department of Housing and Urban Development, State of the Cities Data
System;

A Demographic and Economic Analysis of the City of Springfield
Pioneer Valley Planning Commission Regional Information Center 136
City of Worcester, Massachusetts; and, www.loopnet.com.
Methods Throughout this report particular methods are generally documented as they are employed in analysis. For example, a description of how location quotients are calculated can be found in the section on industry clusters. Similarly, the approach used to define Springfield’s peer cities is discussed in the introduction to the peer cities analysis. Nevertheless, one global methodological note regards inflation adjustments. Whenever dollar figures are reported for multiple periods of time the numbers are adjusted for inflation. This represents a judgment call and there are reasons to report amounts in nominal versus real figures. However, we decided to be consistent throughout the report and because the purpose of this report is to identify Springfield’s current state and the trends leading to it, we elected to adjust for inflation so trends that are in fact negative do not appear positive. For example, median family income has steadily increased for forty years in Springfield, but after adjusting for inflation actual median family income has been declining. We did not adjust all dollar figures to a particular year, so it is necessary to identify the particular year for which dollars are represented in a given chart or passage of the narrative. In all cases dollar figures are adjusted using the U.S. Bureau of Labor Statistics’ consumer price index for all goods and all urban consumers in the Northeast region.