
Demographic and Labor Market Profile: City of...
35
Demographic and Labor Market Profile: City of Pontiac May 2017 Prepared by: State of Michigan Department of Technology, Management, and Budget Bureau of Labor Market Information and Strategic Initiatives
Transcript of Demographic and Labor Market Profile: City of...
Demographic and Labor Market Profile: City of Pontiac
May 2017
Prepared by:
State of Michigan
Department of Technology, Management, and Budget
Bureau of Labor Market Information and Strategic Initiatives

Demographic and Labor Market Profile: City of Pontiac
2 | P a g e
Demographic and Labor Market Profile: City of Pontiac
State of Michigan
Department of Technology, Management, and Budget
Bureau of Labor Market Information and Strategic Initiatives
Jason S. Palmer, Ph.D.
Director
Scott Powell, Ph.D.
Director of Research
By:
Eric Guthrie
Michigan’s State Demographer
&
Leonidas Murembya, Ph.D.
Regional Economic Research Coordinator

Demographic and Labor Market Profile: City of Pontiac
3 | P a g e
Table of Contents
SUMMARY STATISTICS 2015 ...................................................................................................................................................... 4
EXECUTIVE SUMMARY ................................................................................................................................................................ 5
PART I: POPULATION INDICATORS .............................................................................................................................................. 7
Population Trends ............................................................................................................................................................... 7
Population Structure and Characteristics – Age and Gender Distribution ......................................................................... 9
Population Structure and Characteristics – Race and Ethnicity .......................................................................................... 9
Population Structure and Characteristics – Educational Attainment ............................................................................... 10
Population Structure and Characteristics – English Language Skills ................................................................................. 11
PART II: FAMILY AND HOUSEHOLD CHARACTERISTICS ................................................................................................................. 12
Distribution of Household by Types .................................................................................................................................. 12
Distribution of Families with Children by Household Types ............................................................................................. 13
PART III: INCOME AND HOUSING .............................................................................................................................................. 14
Household and Per Capita Income .................................................................................................................................... 14
Housing Value and Ownership .......................................................................................................................................... 16
PART IV: POVERTY STATUS ....................................................................................................................................................... 17
PART V: DISABILITY STATUS...................................................................................................................................................... 19
PART VI: LABOR MARKET INDICATORS ...................................................................................................................................... 21
Employment, Unemployment, and Labor Force Participation Trends ............................................................................. 21
Industry and Occupational Employment .......................................................................................................................... 23
PART VII: WORKERS’ COMMUTING PATTERNS AND CHARACTERISTICS ........................................................................................ 25
Workers’ Commuting Patterns ......................................................................................................................................... 25
Workers’ Characteristics – Age and Earnings ................................................................................................................... 27
Workers’ Characteristics – Educational Attainment ......................................................................................................... 28
Workers’ Characteristics – Industry of Employment ........................................................................................................ 29
Workers’ Characteristics – Race and Gender.................................................................................................................... 30
Workers’ Destination and Origin ...................................................................................................................................... 31
PART VIII: REAL-TIME ONLINE IN-DEMAND JOBS AND TOP JOB ADVERTISERS IN PONTIAC ........................................................... 32
APPENDIX A – HOUSEHOLDS AND FAMILIES DEFINITIONS ........................................................................................................... 33
1. Households and Families ........................................................................................................................................... 33
2. Family Types .............................................................................................................................................................. 33
APPENDIX B – POVERTY THRESHOLDS ....................................................................................................................................... 34

Demographic and Labor Market Profile: City of Pontiac
4 | P a g e
This profile was produced by the Department of Technology, Management, and Budget, Bureau of Labor Market Information and Strategic Initiatives (BLMISI), to provide an overview of the labor market, population, and other socio-economic indicators, such as educational attainment, income, housing, etc., for the City of Pontiac in comparison to Oakland County and the state as a whole. To access more statewide and regional labor market information, please visit our website at www.michigan.gov/lmi.
SUMMARY STATISTICS 2015
Source: 1) U.S. Census Bureau, 2015 Population Estimates; 2) U.S. Census Bureau, 2015 TIGER/Line Shapefiles. & Eric Guthrie, Michigan’s State Demographer (map); 3) Bureau of Labor Market Information and Strategic Initiatives (for unemployment rate and labor force); 4) U.S. Census Bureau, 2011-2015 American Community Survey, 5-year Estimates (for Participation Rate).
59,917 Population
20 mi2
Size
2,996 Density
(Population/Mi2)
27,963 Labor Force
61.3% Participation Rate
11.6% Unemployment Rate

Demographic and Labor Market Profile: City of Pontiac
5 | P a g e
EXECUTIVE SUMMARY
o The City of Pontiac’s population was 59,917 in 2015.
In 2010, for the first time since 1920, the population
in Pontiac was enumerated at a level below 60,000
and has stabilized around that level since.
o The City of Pontiac’s population is much younger
and much less educated than that of Oakland
County or the state.
o Over half of household families with children in
Pontiac are headed by a female with no spouse
present. This is in clear contrast with the county of
Oakland and the state, where married-couple
households are the majority.
o On average, a household in the City of Pontiac
makes about 40 cents for every dollar in the county
and 57 cents for every dollar in the state. An average
person in the City of Pontiac makes $21,800 and
$10,700 less income than a comparable person in
the county or the state.
o The value of a typical housing unit in the City of
Pontiac is about a third of the home value in
Oakland County and about 44 percent of the value
statewide.
o The City of Pontiac displays characteristics of
concentrated urban poverty. Over half of children
under 18 years are living in poverty, which is much
higher than the county or state.
o The unemployment rate in the City of Pontiac has
been about double the rates registered in Oakland
County and the State, but has displayed similar
trends since 2000.
o The City of Pontiac displays a similar rate of labor
force participation as the statewide average but a
rate lower than that for the county by five
percentage points.
Metric City of Pontiac
Oakland County
Michigan
Population and Demographics
Population (2015) 59,917 1,242,304 9,922,600
Median Age 32.8 40.8 39.5
Adult Population w/ Bachelor’s or More
11.5% 44.4% 27.0%
Types of Households w/ Children
Married-couple (2011-2015)
37.3% 74.0% 65.9%
Male-headed, no spouse (2011-2015)
10.3% 6.7% 8.4%
Female-headed, no spouse (2011-2015)
52.4% 19.3% 25.8%
Income, Housing, and Poverty
Household Median Income (2011-2015)
$28,505 $67,465 $49,576
Per Capita Income (2011-2015)
$15,900 $37,700 $26,600
Housing Value (2011-2015)
$54,100 $178,900 $122,400
Poverty, Children Under 18 Years (2011-2015)
51.4% 13.1% 23.5%
Labor Force and Unemployment
Unemployment Rate (2016)
9.9% 4.2% 4.9%
Labor Force Participation Rate (2011-2015)
61.3 66.4 61.3
Labor Force (2011-2015) 27,963 656,139 4,858,631
Total Employment (2011-2015)
22,671 606,731 4,375,145
Employment Change (2005-2010 & 2011-2015)
1.9% 3.7% 0.1%
Demographic and Labor Market Profile: City of Pontiac
6 | P a g e
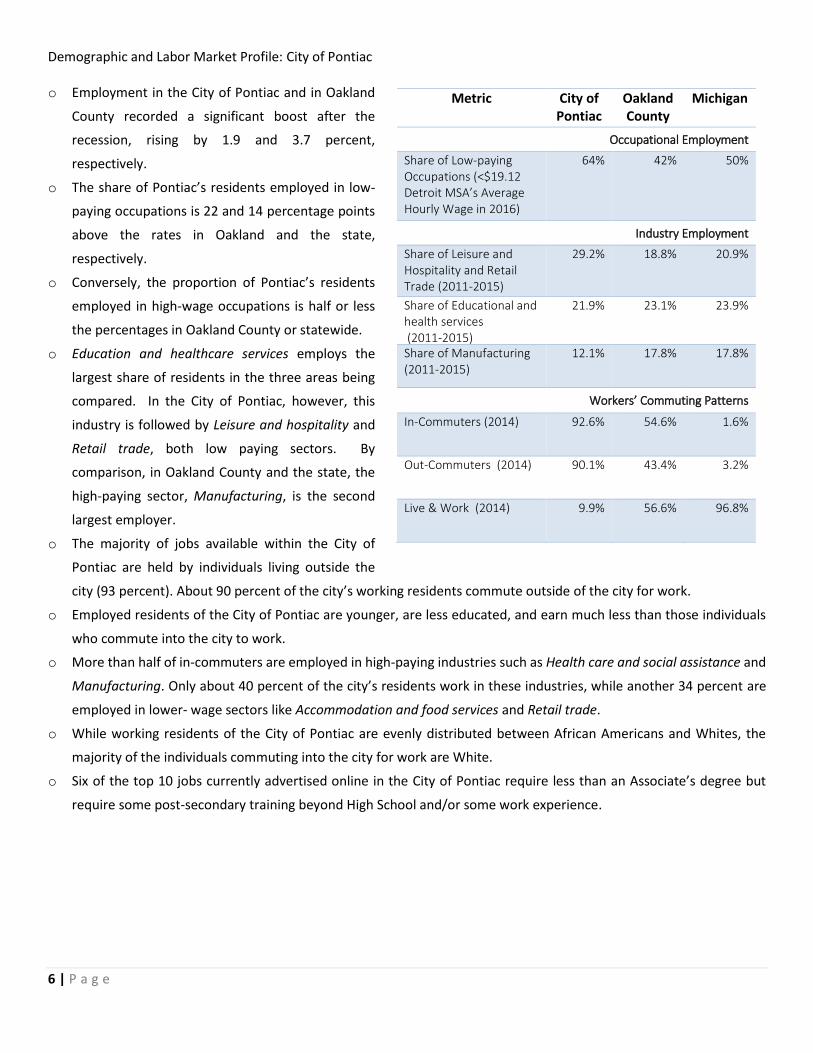
o Employment in the City of Pontiac and in Oakland
County recorded a significant boost after the
recession, rising by 1.9 and 3.7 percent,
respectively.
o The share of Pontiac’s residents employed in low-
paying occupations is 22 and 14 percentage points
above the rates in Oakland and the state,
respectively.
o Conversely, the proportion of Pontiac’s residents
employed in high-wage occupations is half or less
the percentages in Oakland County or statewide.
o Education and healthcare services employs the
largest share of residents in the three areas being
compared. In the City of Pontiac, however, this
industry is followed by Leisure and hospitality and
Retail trade, both low paying sectors. By
comparison, in Oakland County and the state, the
high-paying sector, Manufacturing, is the second
largest employer.
o The majority of jobs available within the City of
Pontiac are held by individuals living outside the
city (93 percent). About 90 percent of the city’s working residents commute outside of the city for work.
o Employed residents of the City of Pontiac are younger, are less educated, and earn much less than those individuals
who commute into the city to work.
o More than half of in-commuters are employed in high-paying industries such as Health care and social assistance and
Manufacturing. Only about 40 percent of the city’s residents work in these industries, while another 34 percent are
employed in lower- wage sectors like Accommodation and food services and Retail trade.
o While working residents of the City of Pontiac are evenly distributed between African Americans and Whites, the
majority of the individuals commuting into the city for work are White.
o Six of the top 10 jobs currently advertised online in the City of Pontiac require less than an Associate’s degree but
require some post-secondary training beyond High School and/or some work experience.
Metric City of Pontiac
Oakland County
Michigan
Occupational Employment
Share of Low-paying Occupations (<$19.12 Detroit MSA’s Average Hourly Wage in 2016)
64% 42% 50%
Industry Employment
Share of Leisure and Hospitality and Retail Trade (2011-2015)
29.2% 18.8% 20.9%
Share of Educational and health services (2011-2015)
21.9% 23.1% 23.9%
Share of Manufacturing (2011-2015)
12.1% 17.8% 17.8%
Workers’ Commuting Patterns
In-Commuters (2014) 92.6% 54.6% 1.6%
Out-Commuters (2014) 90.1% 43.4% 3.2%
Live & Work (2014) 9.9% 56.6% 96.8%

Demographic and Labor Market Profile: City of Pontiac
7 | P a g e
PART I: POPULATION INDICATORS Understanding general population trend indicators is essential for human resource planning and development. Characteristics of the general population have important implications for both current and future employment and training policies. The demographics of an area's population, such as age, disability status, educational attainment, gender, marital status, race and ethnicity, etc., have a major influence on its labor supply.
Population Trends The City of Pontiac’s population has been flat since the Great Recession, after declining for several years between 2000 and 2010. This is in contrast with the Oakland County population which had a steady increase over this period.
Figure 1: Total Population of Pontiac, 2000-2015
67,400
59,491
59,917
50,000
55,000
60,000
65,000
70,000
75,000
2000 2001 2002 2003 2004 2005 2006 2007 2008 2009 2010 2011 2012 2013 2014 2015
Source: U.S. Census Bureau, 2015 Population Estimates and 2010 Intercensal Estimates
Source: U.S. Census Bureau, 2015 Population Estimates and 2010 Intercensal Estimates
Figure 3: Population Change Indexed to 2000 Figure 2: Annual Population Change, 2001-2015
-2.0%
-1.5%
-1.0%
-0.5%
0.0%
0.5%
1.0%
1.5%
20
01
20
02
20
03
20
04
20
05
20
06
20
07
20
08
20
09
20
10
20
11
20
12
20
13
20
14
20
15
Michigan Oakland Pontiac
-0.3%
3.9%
-11.1%
-14%
-12%
-10%
-8%
-6%
-4%
-2%
0%
2%
4%
6%
20
00
20
01
20
02
20
03
20
04
20
05
20
06
20
07
20
08
20
09
20
10
20
11
20
12
20
13
20
14
20
15
Michigan Oakland Pontiac
Demographic and Labor Market Profile: City of Pontiac
8 | P a g e
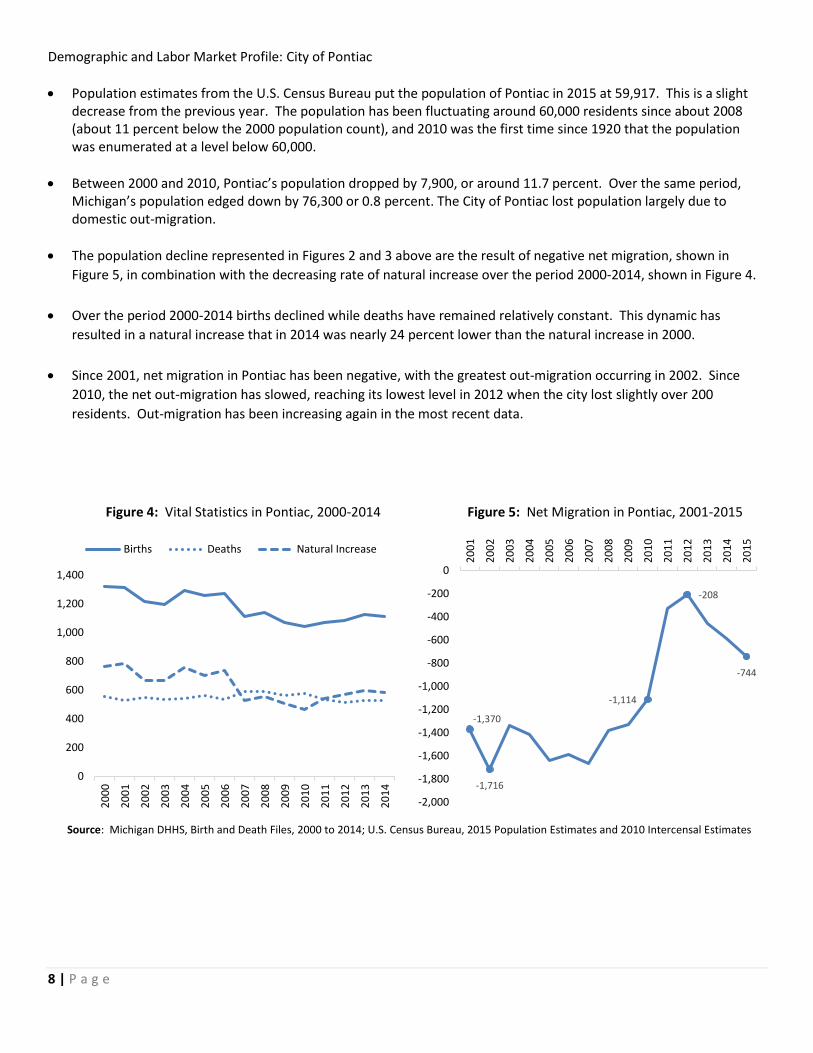
Population estimates from the U.S. Census Bureau put the population of Pontiac in 2015 at 59,917. This is a slight decrease from the previous year. The population has been fluctuating around 60,000 residents since about 2008 (about 11 percent below the 2000 population count), and 2010 was the first time since 1920 that the population was enumerated at a level below 60,000.
Between 2000 and 2010, Pontiac’s population dropped by 7,900, or around 11.7 percent. Over the same period, Michigan’s population edged down by 76,300 or 0.8 percent. The City of Pontiac lost population largely due to domestic out-migration.
The population decline represented in Figures 2 and 3 above are the result of negative net migration, shown in
Figure 5, in combination with the decreasing rate of natural increase over the period 2000-2014, shown in Figure 4.
Over the period 2000-2014 births declined while deaths have remained relatively constant. This dynamic has
resulted in a natural increase that in 2014 was nearly 24 percent lower than the natural increase in 2000.
Since 2001, net migration in Pontiac has been negative, with the greatest out-migration occurring in 2002. Since
2010, the net out-migration has slowed, reaching its lowest level in 2012 when the city lost slightly over 200
residents. Out-migration has been increasing again in the most recent data.
Source: Michigan DHHS, Birth and Death Files, 2000 to 2014; U.S. Census Bureau, 2015 Population Estimates and 2010 Intercensal Estimates
Figure 5: Net Migration in Pontiac, 2001-2015
Figure 4: Vital Statistics in Pontiac, 2000-2014
0
200
400
600
800
1,000
1,200
1,400
20
00
20
01
20
02
20
03
20
04
20
05
20
06
20
07
20
08
20
09
20
10
20
11
20
12
20
13
20
14
Births Deaths Natural Increase
-1,370
-1,716
-1,114
-208
-744
-2,000
-1,800
-1,600
-1,400
-1,200
-1,000
-800
-600
-400
-200
0
20
01
20
02
20
03
20
04
20
05
20
06
20
07
20
08
20
09
20
10
20
11
20
12
20
13
20
14
20
15

Demographic and Labor Market Profile: City of Pontiac
9 | P a g e
Population Structure and Characteristics – Age and Gender Distribution
The population structure of the City of Pontiac is younger than that of Oakland County or of Michigan as a whole. This
can be seen in the population pyramid below and in the median ages for the areas, which are 39.5, 40.8 and 32.8 for
Michigan, Oakland County, and Pontiac respectively.
Pontiac’s proportionally larger population of child-bearing age, whose fertility is higher than both the county and the
state’s, is causing the population in the youngest cohorts (0-9 years) to expand while the same cohorts are shrinking
in the county and the state.
Pontiac displays a larger share of the 20-29 year old population group, which is usually indicative of a college or
university population. This may be due to the proximity of Oakland University in neighboring Auburn Hills and
Rochester Hills.
Population Structure and Characteristics – Race and Ethnicity
The racial and ethnic makeup of the population are similar in Oakland County and the state of Michigan overall but
differs significantly in the City of Pontiac. Pontiac’s population is predominantly African American.
Figure 6: Pontiac and Michigan Population Structure, 2011-2015
6% 4% 2% 0% 2% 4% 6%
0-4
5-9
10-14
15-19
20-24
25-29
30-34
35-39
40-44
45-49
50-54
55-59
60-64
65-69
70-74
75-79
80-84
85+
Pontiac Males Pontiac Females Michigan Males Michigan Females
Source: U.S. Census Bureau, 2011-2015 American Community Survey 5-year Estimates

Demographic and Labor Market Profile: City of Pontiac
10 | P a g e
Unlike the state and Oakland County whose populations are predominantly White, non-Hispanic (76 and 73 percent,
respectively), about half of the population in the City of Pontiac is African American. Whites constitute the second
largest group with 26.6 percent of the city’s residents. The City of Pontiac also has a much larger share of the
population identifying as Hispanic or Latino (16.8 percent) than Oakland County (3.7 percent) or the state overall
(4.7 percent).
While the overall proportions are small, Pontiac has nearly double the share of residents identifying as two or more
races when compared to the share of this group in the state’s and county’s population. Additionally, the proportion
of residents who identify as Asian is only a third of the share of this group in the county’s population. Pontiac’s
Asian proportion is also slightly lower than the state’s.
Population Structure and Characteristics – Educational Attainment The City of Pontiac’s population is much less educated than the Michigan or Oakland County average. While Oakland County has levels of educational attainment that are higher than the state, the City of Pontiac lags behind both areas by a considerable amount. This, together with other factors, likely has significant implications for the levels of household income and the poverty rate in the city.
Pontiac has double the statewide proportion of persons over 25 years of age who have less than a high school
education, and over three times the same share for Oakland County.
The largest proportions of Pontiac’s population have either a high school education or some college but no degree,
which is similar to Michigan overall but higher than Oakland County.
75.9%
13.8%
2.7% 2.3%4.7%
73.5%
13.8%
6.3%2.3% 3.7%
26.6%
50.2%
1.9%4.1%
16.8%
0%
10%
20%
30%
40%
50%
60%
70%
80%
White African American Asian Two or more Hispanic or Latino
Michigan Oakland County Pontiac city
Figure 7: Racial/Ethnic Breakdown, 2011-2015
Source: U.S. Census Bureau, 2011-2015 American Community Survey 5-year Estimates

Demographic and Labor Market Profile: City of Pontiac
11 | P a g e
The largest difference between Pontiac and the county is in the proportion of the 25 year old and over population
that have a Bachelor’s degree or higher. Oakland County has nearly four times the proportion of residents in this
group than does the City of Pontiac. Similarly, the state has well over double the proportion of persons with a
Bachelor’s degree or higher.
Population Structure and Characteristics – English Language Skills
The overall proportion of the state’s population that speaks a language other than English is smaller than it is in
either the City of Pontiac or Oakland County, where the proportions were not significantly different.
When we divide the population that speaks a language other than English by their ability to speak English, Pontiac
and the state as a whole are not significantly different, while Oakland County has a lower proportion of individuals
that speak English less than very well.
Michigan Oakland Pontiac
Percent which speaks only English 90.8% 85.6% 83.8%
Speak a language other than English 9.2% 14.4% 16.2%
Speak English very well 64.3% 67.8% 60.7%
Speak English less than very well 35.7% 32.2% 39.3%
Source: U.S. Census Bureau, American Community Service (2012)
Table 1: Spoken English Skills, 2011-2015
Source: U.S. Census Bureau, 2011-2015 American Community Survey 5-year Estimates
Source: U.S. Census Bureau, 2011-2015 American Community Survey 5-year Estimates
Figure 8: Educational Attainment for Population 25 Years and Over, 2011-2015
10.4%
6.8%
21.5%
29.9%
20.1%
32.7%
32.70%
28.8%
34.40%
27.0%
44.4%
11.5%
0% 5% 10% 15% 20% 25% 30% 35% 40% 45% 50%
Michigan
Oakland
Pontiac
Bachelor's and above Some college High school or equivalency Less than high school

Demographic and Labor Market Profile: City of Pontiac
12 | P a g e
PART II: FAMILY AND HOUSEHOLD CHARACTERISTICS According to the U.S. Census Bureau, a household consists of all people who occupy a housing unit regardless of the relationship. A household may consist of a person living alone or multiple unrelated individuals or families living together. A family consists of two or more people (one of whom is the householder), related by birth, marriage, or adoption, residing in the same housing unit.1
Distribution of Household by Types The composition of households by types is considerably different in the City of Pontiac than in either Oakland County or the state overall. The City of Pontiac has a higher share of female and male headed households without spouses than the county or the state.
The City of Pontiac has a considerably higher proportion of persons that are living in nonfamily households than do
the state or Oakland County. Nonfamily households include people living alone and cohabitants that are not related
to one another by birth, marriage, or adoption.
The City of Pontiac also has over twice the proportion of family households headed by a female with no spouse
present. Likewise, the proportion of male headed families is larger in the City of Pontiac than in either Oakland
County or Michigan.
Pontiac has around half the proportion of married-couple families than either Oakland County or Michigan as a
whole.
1 See Appendix A for details.
47.8%50.7%
25.4%
4.6% 3.9%6.8%
12.7%10.6%
26.4%
35.0% 34.7%
41.4%
0%
10%
20%
30%
40%
50%
60%
Michigan Oakland Pontiac
Married-couple household Male headed, no spouse Female headed, no spouse Nonfamily
Figure 9: Distribution of Households, 2011-2015
Source: U.S. Census Bureau, 2011-2015 American Community Survey 5-year Estimates

Demographic and Labor Market Profile: City of Pontiac
13 | P a g e
Distribution of Families with Children by Household Types
The distribution of family households with children under 18 by type is considerably different in the City of Pontiac than in
either Oakland County or the state overall. The City of Pontiac has a higher share of one-parent family households than in
the county or the state.
The proportion of married-couple families with children in Oakland County is nearly double that of Pontiac.
Similarly, the state as a whole has a significantly higher proportion of married-couple families with children.
Pontiac has a slightly higher proportion of male headed households with no spouse present raising children than
either the state or county, but the largest difference can be seen in the proportion of female headed households
with no spouse. The 52 percent share of this group in the City of Pontiac is more than double that of the county and
state.
65.9%
74.0%
37.3%
8.4%6.7%
10.3%
25.8%
19.3%
52.4%
0%
10%
20%
30%
40%
50%
60%
70%
80%
Michigan Oakland Pontiac
Married-couple household Male headed, no spouse Female headed, no spouse
Figure 10: Distribution of Families with Children, 2011-2015
Source: U.S. Census Bureau, 2011-2015 American Community Survey 5-year Estimates

Demographic and Labor Market Profile: City of Pontiac
14 | P a g e
PART III: INCOME AND HOUSING Income is traditionally used by economists to measure material wellbeing of persons and households. Housing value and home ownership are also important indicators of wealth. Aside from providing a place to live and tying one to a community, these provide a mechanism for intergenerational wealth transfer.
Household and Per Capita Income
Median household income was lower in the City of Pontiac, in all household categories, than in Oakland County and the
state as a whole. The rank order was also the same for all household classifications, as Oakland County had a higher
median income than the statewide average and significantly higher than the average in the City of Pontiac.
In 2015, a median household made $28,500 in the City of Pontiac while the state median household income was
measured at $49,600; a difference of $21,100. This was likely the result of a combination of several factors, some of
which were reviewed earlier, such as a younger population, lower educational attainment, and the predominance of
single-parent households.
While Pontiac saw significantly lower median incomes in all categories, the distribution of median incomes among
household types followed the same pattern in Pontiac as in the county and state. Married-couple families do better
than other family types and family households do better than nonfamily households.
$49,576
$62,247
$75,133
$29,391
$67,465
$87,216
$102,082
$39,787
$28,505$32,195
$52,679
$21,205
0
20,000
40,000
60,000
80,000
100,000
120,000
Households Families Married-couple families Nonfamily households
Michigan Oakland Pontiac
Figure 11: Median Income by Household Type, 2011-2015
Source: U.S. Census Bureau, 2011-2015 American Community Survey 5-year Estimates

Demographic and Labor Market Profile: City of Pontiac
15 | P a g e
When incomes are compared by the racial group of the householder, the same pattern observed above holds true.
Oakland County has the highest median income in every category, followed by the state.
An interesting point to note is how close household median incomes are in the City of Pontiac for Whites, African
Americans, and Latinos, a noticeable contrast to statewide figures and even more so in Oakland County. In the City
of Pontiac, household median income for Whites was only $4,000 higher than that of African Americans, which is
just over 14 percent. Statewide, that difference was almost $23,000 (78.4 percent) and in Oakland County, it was
$24,000 (51.1 percent). Latinos’ household median income was between that of African Americans and Whites in
the City of Pontiac but about $11,000 (28 percent) and $21,000 (43 percent) below statewide and countywide
averages for Hispanics, respectively. Asian households earn more than any other racial or ethnic group across all
three areas.
Regardless of race or ethnicity, the City of Pontiac has lower levels and a flatter distribution of income on a per
capita basis than countywide or statewide. On average in 2015, a person made $10,700 less in Pontiac than
statewide ($15,900 vs. $26,600 statewide). The same person made $21,800 less income compared to the Oakland
County average.
$52,937
$29,678
$74,517
$37,344
$36,354
$39,571
$70,729
$46,821
$101,426
$47,542
$51,284
$49,646
$30,529
$26,678
$49,025
$35,600
$26,803
$28,458
$0 $20,000 $40,000 $60,000 $80,000 $100,000 $120,000
White
African American
Asian
Some other race
Two or more
Hispanic or Latino
Pontiac Oakland Michigan
Figure 12: Median Income by Householder Race/Ethnicity, 2011-2015
Source: U.S. Census Bureau, 2011-2015 American Community Survey 5-year Estimates

Demographic and Labor Market Profile: City of Pontiac
16 | P a g e
Housing Value and Ownership
Besides income, wealth is a good measure of material well-being. Home value and home ownership are important
metrics of household wealth in America. Generally speaking, housing value and ownership are much lower in the City of
Pontiac than in Oakland County and in the state as a whole.
Over the period 2011-2015, the median value for an owner-occupied home in Pontiac was estimated at $54,100,
representing only 44.2 percent of the same value statewide ($122,400), and 30.2 percent of the median home value
in Oakland County ($178,900).
Building equity through home ownership is not a reality for the majority of residents in Pontiac where only 43.4
percent of households are living in owner-occupied housing units. In fact, the only household type where a majority
are living in owner-occupied units in Pontiac are married-couple households. This contrasts with both the state and
Oakland County where all household types have a majority living in owner occupied housing units.
The household type most likely to be renting a home in Pontiac was the female headed household with no spouse
present.
Source: U.S. Census Bureau, 2011-2015 American Community Survey 5-year Estimates
0%
10%
20%
30%
40%
50%
60%
70%
80%
90%
100%
Total M-C M HH F HH NF HH Total M-C M HH F HH NF HH Total M-C M HH F HH NF HH
Michigan Oakland Pontiac
Owner-occupied Renter-occupied
Figure 13: Housing Occupancy by Household Type, 2011-2015
M-C = Married-couple family household; F HH = Female-headed family household with no spouse present;
M HH = Male-headed family household with no spouse present; NF HH = Non-Family Household
Demographic and Labor Market Profile: City of Pontiac
17 | P a g e
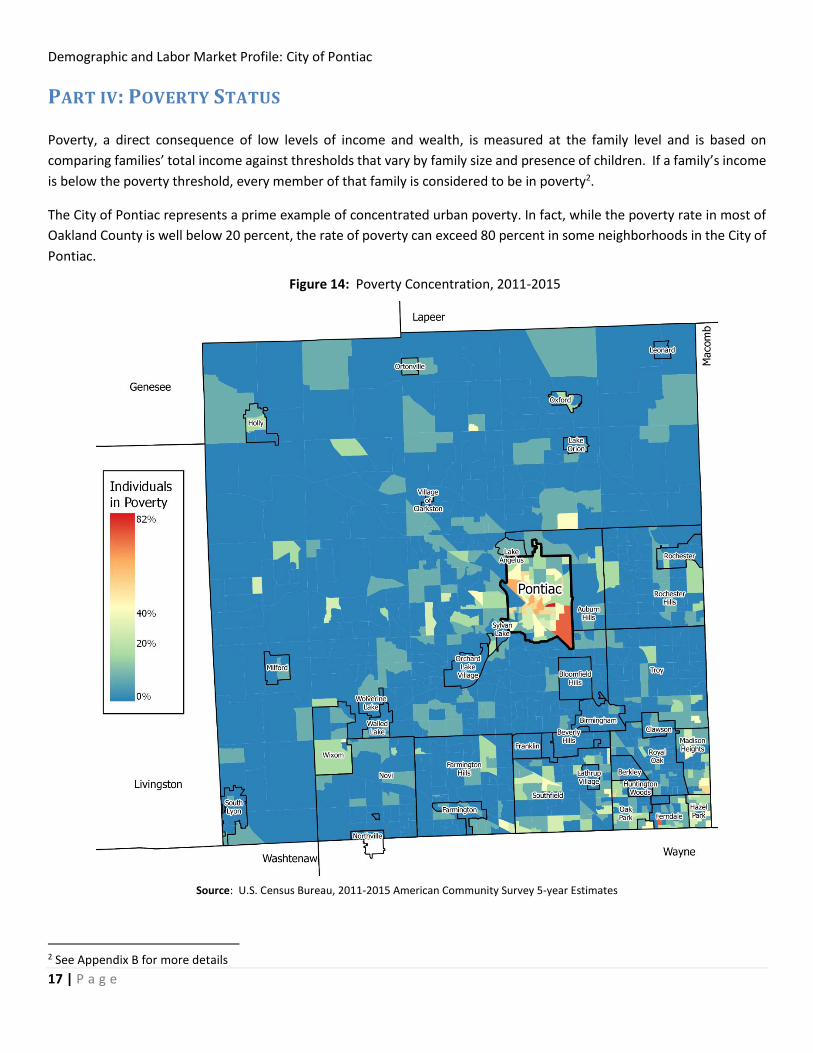
PART IV: POVERTY STATUS
Poverty, a direct consequence of low levels of income and wealth, is measured at the family level and is based on
comparing families’ total income against thresholds that vary by family size and presence of children. If a family’s income
is below the poverty threshold, every member of that family is considered to be in poverty2.
The City of Pontiac represents a prime example of concentrated urban poverty. In fact, while the poverty rate in most of
Oakland County is well below 20 percent, the rate of poverty can exceed 80 percent in some neighborhoods in the City of
Pontiac.
2 See Appendix B for more details
Source: U.S. Census Bureau, 2011-2015 American Community Survey 5-year Estimates
Figure 14: Poverty Concentration, 2011-2015
Demographic and Labor Market Profile: City of Pontiac
18 | P a g e
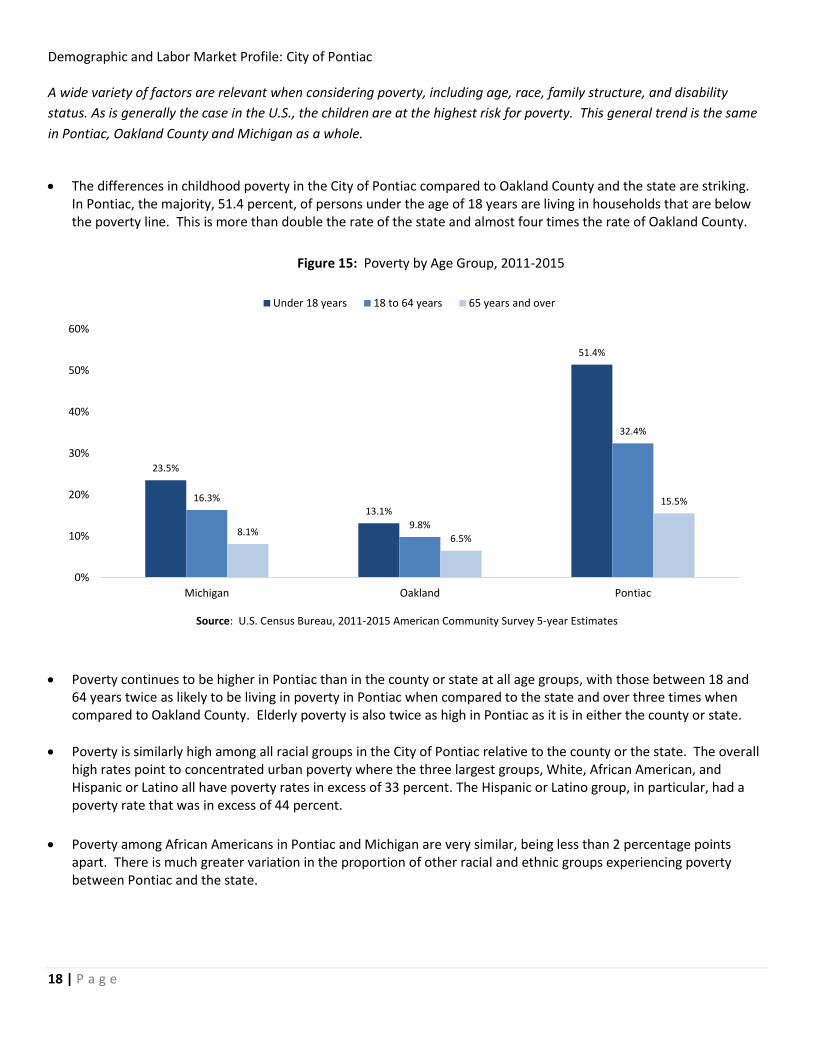
A wide variety of factors are relevant when considering poverty, including age, race, family structure, and disability
status. As is generally the case in the U.S., the children are at the highest risk for poverty. This general trend is the same
in Pontiac, Oakland County and Michigan as a whole.
The differences in childhood poverty in the City of Pontiac compared to Oakland County and the state are striking. In Pontiac, the majority, 51.4 percent, of persons under the age of 18 years are living in households that are below the poverty line. This is more than double the rate of the state and almost four times the rate of Oakland County.
Poverty continues to be higher in Pontiac than in the county or state at all age groups, with those between 18 and 64 years twice as likely to be living in poverty in Pontiac when compared to the state and over three times when compared to Oakland County. Elderly poverty is also twice as high in Pontiac as it is in either the county or state.
Poverty is similarly high among all racial groups in the City of Pontiac relative to the county or the state. The overall high rates point to concentrated urban poverty where the three largest groups, White, African American, and Hispanic or Latino all have poverty rates in excess of 33 percent. The Hispanic or Latino group, in particular, had a poverty rate that was in excess of 44 percent.
Poverty among African Americans in Pontiac and Michigan are very similar, being less than 2 percentage points apart. There is much greater variation in the proportion of other racial and ethnic groups experiencing poverty between Pontiac and the state.
23.5%
13.1%
51.4%
16.3%
9.8%
32.4%
8.1%6.5%
15.5%
0%
10%
20%
30%
40%
50%
60%
Michigan Oakland Pontiac
Under 18 years 18 to 64 years 65 years and over
Figure 15: Poverty by Age Group, 2011-2015
Source: U.S. Census Bureau, 2011-2015 American Community Survey 5-year Estimates

Demographic and Labor Market Profile: City of Pontiac
19 | P a g e
PART V: DISABILITY STATUS
Disability is an additional factor that can lead to poverty and other forms of economic distress. Disability conditions
included in the U.S. Census Bureau’s American Community Survey are:
o Hearing difficulty: Deaf or having serious difficulty hearing
o Vision difficulty: Blind or having serious difficulty seeing, even when wearing glasses
o Cognitive difficulty: Because of a physical, mental, or emotional problem, having difficulty remembering,
concentrating, or making decisions
o Ambulatory difficulty: Having serious difficulty walking or climbing stairs
o Self-care difficulty: Having difficulty bathing or dressing
o Independent living difficulty: Because of a physical, mental, or emotional problem, having difficulty doing
errands alone such as visiting a doctor’s office or shopping
13.1%
34.6%
14.5%
28.5% 28.4%27.1%
8.6%
18.3%
6.1%
17.3% 17.9%
20.7%
33.8%36.4%
23.6%
36.2%
47.5%
44.1%
0%
5%
10%
15%
20%
25%
30%
35%
40%
45%
50%
White African American Asian Some other race Two or more Hispanic or Latino
Michigan Oakland Pontiac
Figure 16: Poverty by Racial/Ethnic Group, 2011-2015
Source: U.S. Census Bureau, 2011-2015 American Community Survey 5-year Estimates

Demographic and Labor Market Profile: City of Pontiac
20 | P a g e
Disability rates increase by age in all geographies under consideration, Michigan, Oakland County, and the City of
Pontiac. Disability rates in Pontiac were higher than the county and state rates for all age groups.
Over the period of 2011-2015, disability status for individuals 18 to 34 years of age was similar across all three areas,
with differences within half a percentage point between Pontiac and the state, and of less than two percentage
points between Pontiac and Oakland County.
The age group with the largest proportional difference of persons with a disability was the group between 35 to 64
years of age. This group, in the City of Pontiac, was over 12 percentage points higher than Michigan as a whole and
over 16 percentage points higher than Oakland County.
Disability among all racial/ethnic groups, except the Asian group, were higher in the City of Pontiac than in Oakland
County or the state
Figure 17: Disability by Age Group, 2011-2015
0.9%
6.4% 7.3%
15.0%
25.9%
49.5%
1.3%5.1% 6.0%
10.7%
22.2%
47.3%
2.6%
9.8%7.8%
27.2%
36.0%
59.0%
0%
10%
20%
30%
40%
50%
60%
70%
Under 5 5 to 17 18 to 34 35 to 64 65 to 74 75 and over
Michigan Oakland Pontiac
Source: U.S. Census Bureau, 2011-2015 American Community Survey 5-year Estimates

Demographic and Labor Market Profile: City of Pontiac
21 | P a g e
PART VI: LABOR MARKET INDICATORS The size of the civilian labor force and its component parts of employed and unemployed follow trends in population and economic development. Information on the labor force can be used to gauge the number of individuals experiencing unemployment problems and to adapt the responsiveness of training programs to changing conditions. The level of employment and the types of jobs held by residents of an area greatly affect the income levels of an area.
Employment, Unemployment, and Labor Force Participation Trends The unemployment rate in the City of Pontiac has been well above the rates registered in Oakland County and the State, but has displayed similar trends since 2000.
In general, the unemployment rate in the City of Pontiac is much higher than the countywide and statewide rates (about double). However, as shown in Figure 18, jobless rates in the City of Pontiac have followed the countywide and statewide trend over the past 16 years, rising substantially during the Great Recession in 2009 and dropping thereafter.
Jobless rates in the City of Pontiac, Oakland County, and the state rose between 2000 and 2003 and remained stable from 2004 to 2007, but at higher levels than in 2000. In 2008, the housing sector crashed, and in 2009, the automotive industry experienced severe financial difficulties, sending unemployment rates for Oakland County and the state to double digits, and in the City of Pontiac to over 30 percent.
Recently, unemployment rates have shown improvement, reflecting the national and state economic recoveries. During 2016, jobless rates fell to 9.9 percent in Pontiac, 4.2 percent in Oakland County, and 4.9 percent statewide, and were lower than the 2007 pre-recessionary levels in all three areas.
0
5
10
15
20
25
30
35
2000
2001
2002
2003
2004
2005
2006
2007
2008
2009
2010
2011
2012
2013
2014
2015
2016
Michigan Oakland Pontiac
Figure 18: Annual Unemployment Rates: 2000 - 2016
Source: Bureau of Labor Market Information and Strategic Initiatives

Demographic and Labor Market Profile: City of Pontiac
22 | P a g e
The level and participation rate of the labor force in the City of Pontiac remained virtually flat before, during and after the Great Recession. However, employment recorded a significant boost after the recession.
Labor Force Participation
2006-2010 2011-2015 Change
City of Pontiac 61.2% 61.3% +0.1
Oakland County 67.6% 66.4% -1.2
Michigan 63.1% 61.3% -1.8
Civilian Labor Force
2006-2010 2011-2015 Change Percent Change
City of Pontiac 27,825 27,963 137 0.5%
Oakland County 642,020 656,139 14,119 2.2%
Michigan 4,944,714 4,858,631 -86,083 -1.7%
Employment
2006-2010 2011-2015 Change Percent Change
City of Pontiac 22,142 22,671 529 1.9%
Oakland County 583,136 606,731 23,595 3.7%
Michigan 4,372,663 4,375,145 2,482 0.1%
Over the two five-year periods of 2006-2010 and 2011-2015, the labor force participation rate in the City of Pontiac
was virtually flat, inching up by one tenth of a percent, while the rates in both Oakland County and the state
declined. The reasons for the decline in labor participation are largely related to the aging of the population but
could also include other factors such as care for a family (children, elderly), disability, schooling, or simply
discouragement. The population of the City of Pontiac was generally younger than Oakland County and statewide,
which could promote participation.
The recent economic growth in and around the City of Pontiac could reflect more available jobs for the city’s
residents. Employment in Pontiac rose by almost two percent over the same two five-year periods.
Source: U.S. Census Bureau, American Community Survey 5-year Estimates, 2006-2010 & 2011-2015
Table 2: Labor Force Participation, Civilian Labor Force, & Employment of the Population 16 Years of Age and Older

Demographic and Labor Market Profile: City of Pontiac
23 | P a g e
Industry and Occupational Employment Knowing the level of employment for an area is important to understand a region’s earnings potential. However, not all industries or occupations pay the same. So, it is important to understand the industry and occupational distribution of an area’s employed residents. A greater share of Pontiac’s residents are employed in low-paying occupations and industries than Oakland County and the State.
Over the period of 2011-2015, 64 percent of employed residents of the City of Pontiac worked in occupations that paid below the average hourly wage of $19.12 in the Detroit Metropolitan Statistical Area (MSA). These occupations included Office and administrative support, Food preparation and service, Sales, Building and grounds cleaning and maintenance, Personal care and service, Construction and extraction, Material moving, Transportation, and Protective services. The shares of these occupations in the state’s and Oakland County’s employment were 50 and 42 percent, respectively.
Table 3: City of Pontiac: Occupational Employment of the Population 16 Years of Age and Older, 2011-2015
Occupational Employment Distribution (Population 16 Years and Over)
Occupational Groups Percent of Total Employment Median Wage*
Pontiac Oakland Michigan
Civilian employed population 16 years and over 100% 100% 100% $19.12
Office and administrative support 14% 12% 13% $12.58
Food preparation and serving 12% 5% 6% $18.50
Production 11% 5% 9% $22.18
Sales 10% 12% 10% $9.92
Building and grounds cleaning and maintenance 7% 3% 4% $9.48
Management, business, and financial 7% 19% 13% $51.14
Personal care and service 6% 3% 4% $11.23
Construction and extraction 6% 3% 4% $10.11
Healthcare support 4% 2% 3% $31.48
Healthcare practitioner and technical 4% 7% 6% $22.58
Material moving 4% 1% 3% $16.34
Transportation 3% 2% 3% $18.76
Education, training, and library 3% 6% 6% $41.40
Protective service 2% 1% 2% $13.49
Installation, maintenance, and repair 2% 2% 3% $25.86
Computer and mathematical 2% 4% 2% $33.11
Community and social services 2% 2% 2% $31.10
Architecture and engineering 1% 5% 3% $38.45
Arts, design, entertainment, sports, and media 1% 2% 2% $22.64
Legal 0% 2% 1% $20.19
Life, physical, and social science 0% 1% 1% $41.60
Farming, fishing, and forestry 0% 0% 1% $16.82
*2016 Median Hourly Wage in the Detroit Metropolitan Statistical Area
Source: U.S. Census Bureau, American Community Survey 5-year Estimates, 2011-2015

Demographic and Labor Market Profile: City of Pontiac
24 | P a g e
In contrast, the proportion of the Pontiac’s residents employed in high-wage occupations such as Management, business and financial, Life, physical, and social science, Architecture and engineering, Computer and mathematical, and others (Table 3) is half or less the percentages in Oakland County or statewide.
Over the period of 2011-2015, the sector of Educational and health care services displayed the highest share of payroll employment in all three areas of Pontiac, Oakland, and the state. However in Pontiac, this sector was followed in order by the low-paying sectors of Leisure and hospitality and Retail trade, while in Oakland County and the state as a whole, the high-wage Manufacturing sector was the second largest employer (Figure 19).
Private employment represents the highest proportion of payroll jobs in Oakland County and the state, and an even
larger proportion in the City of Pontiac (79 percent, or eight percentage points above the statewide share and seven
above the share in the county).
However, self-employment is very low in the City of Pontiac (about half the share in the county or the state).
1.3%
2.4%
1.6%
3.6%
4.2%
5.4%
4.7%
4.8%
9.3%
17.8%
11.4%
9.5%
23.9%
0.3%
2.7%
2.1%
2.8%
2.7%
7.7%
4.2%
3.9%
14.0%
17.8%
10.2%
8.6%
23.1%
0.2%
1.1%
1.3%
2.7%
4.6%
4.8%
5.4%
6.3%
10.6%
12.1%
12.9%
16.3%
21.9%
0.0% 5.0% 10.0% 15.0% 20.0% 25.0% 30.0%
Agriculture
Wholesale trade
Information
Public administration
Transportation and utilities
Financial activities
Other private services
Construction
Professional and bus. services
Manufacturing
Retail trade
Leisure and hospitality
Educational and health care services
Pontiac Oakland Michigan
Figure 19: City of Pontiac: Share of Employed Residents by Major Industry, 2011-2015
Source: U.S. Census Bureau, American Community Survey 5-year Estimates, 2011-2015

Demographic and Labor Market Profile: City of Pontiac
25 | P a g e
PART VII: WORKERS’ COMMUTING PATTERNS AND CHARACTERISTICS
Businesses and residents of the City of Pontiac depend on the economic health of the entire Detroit metro area for
customers, a quality workforce, and jobs. Information on workers’ commuting patterns between the city and the
surrounding region is important for economic and workforce developers to understand. This includes the characteristics
of the City of Pontiac’s residents who work (wherever they are employed), as well as those individuals who hold jobs
within the city’s boundaries (no matter where they reside). Examples of questions that will be answered in this section
include the following: 1) what are the characteristics of the employed residents of Pontiac? 2) Do they work in the city or
do they commute outside of the city? 3) Of those individuals that work in the city, how many also live in the city?
Workers’ Commuting Patterns
Over the past 13 years, an increasing share of the City of Pontiac’s residents work outside the city. More and more
residents of the City of Pontiac have been commuting outside the city to work. This rise in the city’s out-commuters has
been particularly noticeable since the Great Recession of 2009.
A very minute portion of the City of Pontiac’s employed residents live and work in the city. In 2014, only 10% of
Pontiac working residents or about 1,900 people were actually also employed in the city. That represented about
only seven percent of all the 25,350 individuals that worked in the city.
Source: U. S. Census Bureau, Local Employment Dynamics (LED), 2014
Figure 20: Pontiac City: Workers Commuting Patterns, 2014
Work & Live:
1,875 In-commute: 23,417
Out-commute: 17,007

Demographic and Labor Market Profile: City of Pontiac
26 | P a g e
Figure 21 shows that the percentage of out-commuters compared to the share of the residents that live and work in
the city has increased by 15 percentage points since 2003. But, this does not mean that there are no jobs available
within the city’s limits. In fact, as shown in Figure 20 above, while 17,000 Pontiac residents commuted outside to
work in 2014, about 23,400 individuals commuted into the city to work. A partial explanation of this situation can be
provided by the characteristics of workers in the two groups (in- and out-commuters) in terms of age, gender,
educational attainment, race/ethnicity, and industries in which they were employed.
Source: U. S. Census Bureau, Local Employment Dynamics (LED), Origin-Destination Statistics, 2014
Figure 21: Pontiac City: Change in Worker Commuting Patterns, 2003-2014
0.0%
5.0%
10.0%
15.0%
20.0%
25.0%
65.0%
70.0%
75.0%
80.0%
85.0%
90.0%
95.0%
2003 2004 2005 2006 2007 2008 2009 2010 2011 2012 2013 2014P
ecen
t o
f P
on
tiac
Res
iden
ts E
mp
loye
d in
Cit
y
Per
cem
t o
f P
on
tiac
Res
iden
ts E
mp
loye
d O
uts
ide
Living in Pontiac but Employed Outside Living and Employed in Pontiac

Demographic and Labor Market Profile: City of Pontiac
27 | P a g e
Workers’ Characteristics – Age and Earnings
Employed residents of the City of Pontiac are younger and earn much less than those individuals who commute into the
city to work.
In 2014, 30 percent of the 17,000 individuals that commuted outside to work were 29 years of age or younger. Only
18 percent of in-commuters fell in this category.
On the other hand, 58 percent of individuals that commute to Pontiac for work earn more than $40,000 a year,
compared to only about 28 percent of Pontiac’s working residents in this category. Statewide and countywide, about
41 and 49 percent of workers are in this group of high-income earners, respectively.
Live & Work Out-commute In-commute
Age Distribution 100% 100% 100%
Workers Aged 29 or younger 21.0% 30.4% 17.9%
Workers Aged 30 to 54 55.3% 55.0% 58.6%
Workers Aged 55 or older 23.7% 14.6% 23.5%
Earnings 100% 100% 100%
Workers Earning $15,000 per year or less 22.9% 28.5% 14.5%
Workers Earning $15,001 to $40,000 per year 50.2% 42.8% 27.2%
Workers Earning More than $40,000 per year 26.9% 28.7% 58.3%
Source: U. S. Census Bureau, Local Employment Dynamics (LED), Origin-Destination Statistics, 2014
Table 4: Pontiac City: Workers by Age and Earnings, 2014

Demographic and Labor Market Profile: City of Pontiac
28 | P a g e
Workers’ Characteristics – Educational Attainment
Employed residents of the City of Pontiac display lower educational attainment than those individuals that commute into
the city to work.
The share of in-commuters with a Bachelor’s degree or more was 12 percentage points above the share of this
group in the city’s working residents (36 vs. 24 percent), which could partially explain the higher earnings of in-
commuters. Statewide, the share of this group in total employment was about 30 percent.
The shares of other educational categories (Some college or Associate’s degree, High school or equivalent, Less than
high school) are higher for the residents of the City of Pontiac than for those individuals that commute into the city
to work. For instance, the proportion of Pontiac’s working residents with less than a high school (13.4 percent) is
almost twice the share of this group among those that commute into the city to work (7.7 percent).
Source: U. S. Census Bureau, Local Employment Dynamics (LED), Origin-Destination Statistics, 2014
13.4%
29.5%
33.1%
24.0%
7.7%
23.5%
32.3%
36.5%
0% 10% 20% 30% 40%
Less than high school
High school or equivalent
Some college or Associate degree
Bachelor's degree or advanced degree
In-Commuters City Residents
Figure 22: Pontiac City: Educational Attainment of Employed, 2014

Demographic and Labor Market Profile: City of Pontiac
29 | P a g e
Workers’ Characteristics – Industry of Employment
A higher share of Pontiac’s residents work in low-paying industries compared to individuals that commute into the city
for work.
Healthcare and social assistance was the major employer for both the city’s residents and in-commuters in 2014.
Besides young age and lower educational attainment, another factor that could explain the lower earnings for
Pontiac residents relative to individuals that commute into the city for work is the industries in which the two groups
are employed. About 54% of the in-commuters are employed in the high-paying industries of Health care and social
assistance, Manufacturing and Professional, scientific, and technical services. In contrast, only about 40% of the
city’s residents work in these industries, while another 34 percent were employed in the lower wage sectors of
Accommodation and food services, Retail trade, and Administrative support and waste management.
Source: U. S. Census Bureau, Local Employment Dynamics (LED), Origin-Destination Statistics, 2014
Figure 23: Pontiac City: Industries Where Workers Are Employed, 2014
1.2%
1.5%
1.7%
1.8%
2.3%
2.4%
2.6%
3.1%
3.5%
3.6%
4.7%
7.7%
10.7%
11.4%
11.6%
12.6%
17.3%
0.5%
0.5%
3.2%
3.2%
2.3%
3.6%
3.1%
3.3%
2.7%
1.5%
4.4%
9.7%
3.8%
5.9%
8.0%
18.9%
25.4%
0% 5% 10% 15% 20% 25% 30%
Arts, Entertainment, and Recreation
Real Estate and Rental and Leasing
Information
Management of Companies and Enterprises
Public Administration
Construction
Transportation and Warehousing
Other Private Services
Wholesale Trade
Finance and Insurance
Educational Services
Professional, Scientific, and Technical Services
Accommodation and Food Services
Adm. & Support, Waste Manag.
Retail Trade
Manufacturing
Health Care and Social Assistance
In-commuters City Residents

Demographic and Labor Market Profile: City of Pontiac
30 | P a g e
Workers’ Characteristics – Race and Gender
While working residents of the City of Pontiac are evenly distributed between African Americans and Whites, the majority
of the individuals commuting into the city to work are White.
African Americans and Whites each comprise about 47 percent of the city’s working residents. However, close to 78
percent of in-commuters are White, with only 17 percent of this group being African American. In-commuters are
also slightly majority male (52 percent) in contrast with the city’s employed residents who command a slight female
majority at 53 percent.
*AIAN: American Indians and Alaska Natives
Source: U. S. Census Bureau, Local Employment Dynamics (LED), Origin-Destination Statistics, 2014
47.7% 46.6%
3.8%1.9%
10.1%
47.0%
53.0%
77.8%
17.1%
4.0%1.2%
4.1%
51.6%48.4%
0%
20%
40%
60%
80%
100%
WhiteAlone
Black Alone Asian &AIAN*
Two orMore Race
Groups
Hispanic orLatino
Male Female
City Residents In-Commuters
Figure 24: Pontiac City: Workers by Race and Gender, 2014

Demographic and Labor Market Profile: City of Pontiac
31 | P a g e
Workers’ Destination and Origin
While the majority of working residents of the City of Pontiac travel outside for work, most of those that work in the city commute from surrounding areas.
About half of the Pontiac’s employed residents either work in the city or surrounding cities like Auburn Hills, Troy, Rochester Hills, and Detroit (Table 5). In 2014, 10.5 percent of the working residents of the City of Pontiac traveled greater than 50 miles to work. This share was estimated at 7.2 percent for Oakland County and 14.4 percent statewide.
The majority of in-commuters reside outside Pontiac in surrounding cities such as Detroit, Rochester Hills and
others, while some drive from as far as Ann Arbor, Grand Rapids, or Lansing. In fact, 10.0 percent (or 2,500 persons)
that worked in the city in 2014 commuted more than 50 miles. This share was 9.0 percent for Oakland County and
13.7 percent statewide.
Source: U. S. Census Bureau, Local Employment Dynamics (LED), Origin-Destination Statistics, 2014
Where Pontiac Residents Work, 2014 Where Workers in Pontiac Live, 2014
Count Share Count Share
Pontiac 1,875 9.9% Pontiac 1,875 7.4%
Auburn Hills 1,864 9.9% Detroit 877 3.5%
Troy 1,154 6.1% Rochester Hills 847 3.3%
Rochester Hills 934 4.9% Sterling Heights 746 2.9%
Detroit 925 4.9% Troy 736 2.9%
Southfield 818 4.3% Farmington Hills 444 1.8%
Farmington Hills 454 2.4% Southfield 417 1.6%
Livonia 442 2.3% Royal Oak 416 1.6%
Warren 425 2.3% Warren 402 1.6%
Birmingham 335 1.8% Auburn Hills 360 1.4%
All Other Locations 9,656 51.1% All Other Locations 18,226 71.9%
Table 5: Top 10 Cities of Workers’ Origin and Destination, 2014

Demographic and Labor Market Profile: City of Pontiac
32 | P a g e
PART VIII: REAL-TIME ONLINE IN-DEMAND JOBS AND TOP JOB ADVERTISERS IN
PONTIAC Online advertised jobs are one measure used to tally the so-called “real-time” demand for workers by an area’s businesses. Workforce developers are interested in this information to learn what jobs are available in the labor market right now. Six of the top 10 jobs currently advertised online in the City of Pontiac require less than an Associate’s degree but require some post-secondary training beyond High School and/or some work experience.
Occupation # Ads
2022 Projected
Job Growth*
Education Required 25th Perc. Wage*
75th Perc. Wage*
Registered Nurses 115 11.8% Associate's $28.6 $37.4
Industrial Engineers 59 20.2% Bachelor's $35.7 $50.2
Security Guards 51 9.5% High school or GED $10.4 $14.1
Mechanical Engineers 45 13.8% Bachelor's $36.2 $52.0
Maintenance & Repair Workers 23 7.0% High school or GED $12.9 $23.0
First-Line Supervisors of Prod. Workers 21 8.2% Postsecondary non-degree $24.4 $43.4
Electrical Engineers 20 10.2% Bachelor's $36.4 $51.5
Computer User Support Specialists 20 25.8% Some college, no degree $15.2 $27.7
Heavy and Tractor-Trailer Truck Drivers 19 16.1% Postsecondary non-degree $15.9 $25.6
First-Line Supervisors of Retail Workers 18 6.6% High school or GED $13.4 $22.9
* This data is for the Detroit Metro Prosperity Region (Macomb, Oakland, and Wayne counties)
Source: Conference Board, Help Wanted Online©, March 14 – April 13, 2017 for the number of ads; Michigan Bureau of Labor Market and Strategic Initiatives for all other information
With the exceptions of Security Guards and Maintenance & Repair Workers, all other eight top jobs advertised online in Pontiac in April pay above the regional Metro Detroit average wage. Employment in these occupations is also expected to grow above regional average rate until 2022.
Three of the top 10 job ads are in engineering, and two are supervisory positions in retail and manufacturing production. Registered nurses and Heavy trailer truck drivers are sought after in every corner of Michigan and the nation. Registered nurses are in high demand in response to aggressive growth in healthcare services, partially due to an aging baby boomer population.
__________________________________________________________________________________________________ For more information on this profile, please contact the authors of this study: Leonidas Murembya, PhD at (517) 241-
6574 ([email protected]) or Eric Guthrie (517) 241-8667 ([email protected]). Please visit our website at
www.michigan.gov/lmi for more statewide and regional labor market information.
Table 6: Top 10 Detailed Job Ads Posted Online in the City of Pontiac, April 2017

Demographic and Labor Market Profile: City of Pontiac
33 | P a g e
APPENDIX A – HOUSEHOLDS AND FAMILIES DEFINITIONS
1. Households and Families
Households and families are different units that have different characteristics. These appear separately in the census data
and, as such, it is important to understand what is being referred to when the terms are used. According to the Census
Bureau, a household:
…includes the related family members and all the unrelated people, if any, such as lodgers, foster children, wards,
or employees who share the housing unit. A person living alone in a housing unit, or a group of unrelated people
sharing a housing unit such as partners or roomers, is also counted as a household. The count of households
excludes group quarters. There are two major categories of households, "family" and "nonfamily."3
It is evident from this definition that a family is a related but different category in census data. A family is a type of
household that:
…includes a householder and one or more people living in the same household who are related to the householder
by birth, marriage, or adoption. All people in a household who are related to the householder are regarded as
members of his or her family.
A family household may contain people not related to the householder, but those people are not included as part
of the householder's family in census tabulations. Thus, the number of family households is equal to the number
of families, but family households may include more members than do families.4
These definitions seem confusing at first glance, at least in part because they use the same terms to define different things.
A “householder” is the person that fills out the census forms. So if people are related to the householder, they are part
of his or her family and considered a family household. If they are not then they are considered a nonfamily household.
Within the family designation, there are three separate types of families that can exist. According to the Census definition,
“[f]amilies may be a ‘Married Couple Family,’ ‘Female householder, no spouse present’ or ‘Male householder, no spouse
present’.”5 These categories are self-explanatory with the caveat that the last two, female and male householders are not
only single parent families. These family types would include grandparents and grandchildren, uncles caring for nieces
and nephews, and the plethora of other family compositions that can exist that are not married-couples.
2. Family Types
When a discussion of family types is initiated, the conversation eventually turns to single parent households. This is an
important topic because these families have different needs and experience different levels of hardship than do their
counterparts that either do not have children or are in married-couple families. Data on these types of families can be
obtained by looking at the male and female-headed households that are listed as not having a spouse present. There is a
subcategory that indicates whether these families have their own children under the age of 18 present. This is not a
perfect breakout of the family type, but it is the best available measure. There become issues associated with cohabitating
couples that are not married falling into this category, but there is not a way to separate out those situations. Additionally,
there are issues with same-sex-couple families in this categorization scheme.
3 Census Glossary, https://www.census.gov/glossary/ 4 Ibid 5 Ibid

Demographic and Labor Market Profile: City of Pontiac
34 | P a g e
APPENDIX B – POVERTY THRESHOLDS
If the total income of a family is below the poverty threshold, then the entire family is considered to be living in poverty.
The following guidelines are used to determine total family income:
- Includes earnings, unemployment compensation, workers' compensation, Social Security, Supplemental Security
Income, public assistance, veterans' payments, survivor benefits, pension or retirement income, interest,
dividends, rents, royalties, income from estates, trusts, educational assistance, alimony, child support, assistance
from outside the household, and other miscellaneous sources
- Noncash benefits (such as food stamps and housing subsidies) do not count
- All earnings are counted before taxes
- Excludes capital gains or losses
- If a person lives with a family, add up the income of all family members. (Non-relatives, such as housemates, do
not count.)6
The data presented in this profile compared incomes to the 2015 poverty thresholds. The thresholds do not vary by
geography and are based on the cost of a minimum diet, which is updated annually using the Consumer Price Index (CPI).
The most current guidelines, which are simplified versions derived from the Census Bureau’s thresholds used to determine
eligibility for many programs, are presented below:
2017 Poverty Guidelines for the 48 Contiguous States and the District of Columbia
Persons in family/household Poverty guideline
1 $12,060 2 $16,240 3 $20,420 4 $24,600 5 $28,780 6 $32,960 7 $37,140 8 $41,320
For families/households with more than 8 persons, add $4,180 for each additional person
6 U.S. Census Bureau, “How the Census Measures Poverty”, http://www.census.gov/topics/income-poverty/poverty/guidance/poverty-measures.html
Demographic and Labor Market Profile: City of Pontiac
35 | P a g e
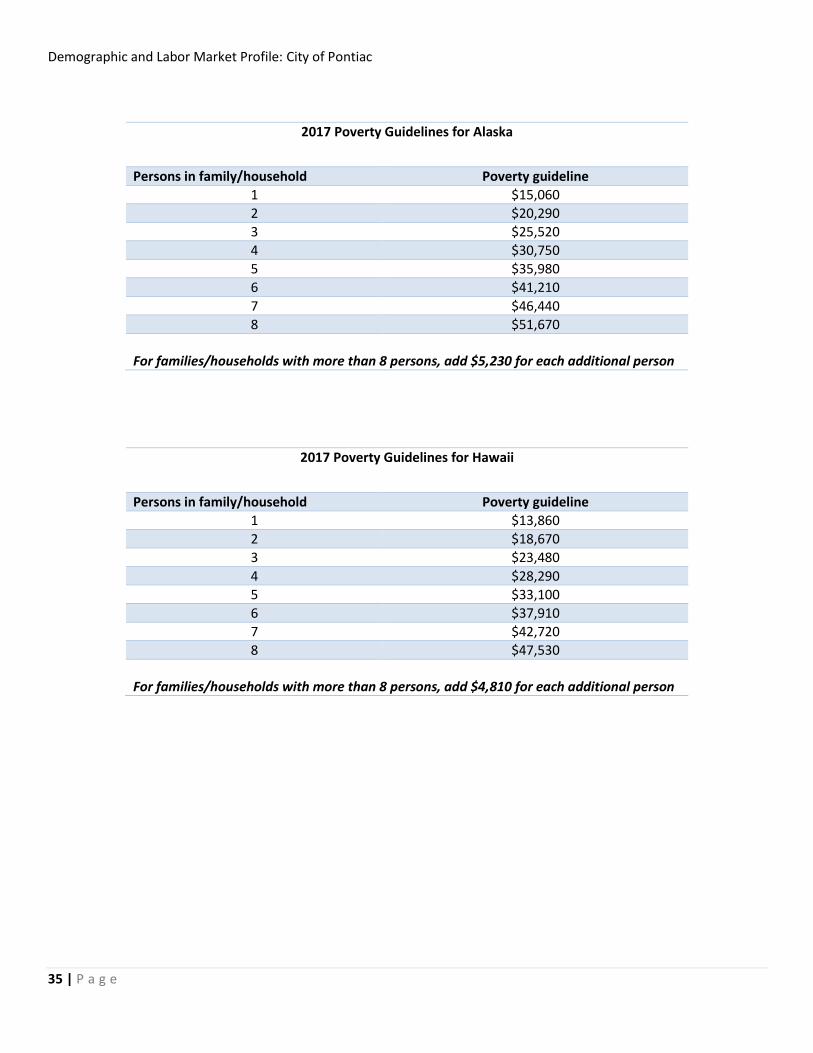
2017 Poverty Guidelines for Alaska
Persons in family/household Poverty guideline 1 $15,060
2 $20,290
3 $25,520
4 $30,750
5 $35,980
6 $41,210
7 $46,440
8 $51,670
For families/households with more than 8 persons, add $5,230 for each additional person
2017 Poverty Guidelines for Hawaii
Persons in family/household Poverty guideline
1 $13,860 2 $18,670 3 $23,480 4 $28,290 5 $33,100 6 $37,910 7 $42,720 8 $47,530
For families/households with more than 8 persons, add $4,810 for each additional person


![Demographic and Labor Market Profile of Jackson - 10-24-16[2]...A Demographic and Labor Market Profile of Jackson County DTMB, Bureau of Labor Market Information and Strategic Initiatives](https://static.fdocuments.us/doc/165x107/5f8b7a41275218337f375cda/demographic-and-labor-market-profile-of-jackson-10-24-162-a-demographic.jpg)


