
A comprehensive modelling strategy for Horizontal...
27
STAR Global Conference 7-9 th March 2016 A comprehensive modelling strategy for Horizontal Axis Wind Turbine (HAWT) aerodynamics J. O’Brien, P. Griffin, T. Young, J. Early Presenter: Jerry O’Brien Department of Mechanical, Aeronautical & Biomedical Engineering University of Limerick, Ireland STAR Global Conference 7-9 th March 2016
Transcript of A comprehensive modelling strategy for Horizontal...

STAR Global Conference
7-9th March 2016
A comprehensive modelling strategy for Horizontal
Axis Wind Turbine (HAWT) aerodynamics
J. O’Brien, P. Griffin, T. Young, J. Early
Presenter: Jerry O’Brien
Department of Mechanical, Aeronautical & Biomedical Engineering
University of Limerick, Ireland
STAR Global Conference
7-9th March 2016
Overview
2
Introduction
Current State of the Art
Trends within numerical research
Experimental Conditions
Introduction
Measurement techniques
Numerical Model
Introduction
Boundary conditions and mesh generation
Results
Introduction
Velocity Deficit
Stall
Turbulence characteristics
Conclusions
STAR Global Conference
7-9th March 2016
Introduction Blade-wake interactions in wind turbine applications
3
Kyoto Agreement, European energy agreements of 2020 and 2050
Larger turbines – Energy harvested is proportional to rotor area
Large turbine – Results in design complications
Flexible composite blades
Fluid-Structure Interaction (FSI) modelling
This presentation will focus on the aerodynamic modelling of the wind turbine structure
Validation of numerical models
STAR Global Conference
7-9th March 2016

Current state of the art Trends within the literature – Numerical studies
4
Simplified – Time and computational expense!
Often one blade is modelled (120o periodic boundary condition)
Tower structure not modelled
Not representative of “real life”
Transient effects from the tower and nacelle on the rotor are ignored
STAR Global Conference
7-9th March 2016

Current state of the art Trends within the literature – Numerical studies
5
STAR Global Conference
7-9th March 2016

Experimental Conditions Introduction
6
Investigation carried out at U of 10m/s (Queen’s University, Belfast)
Tip speed ratio (λ) of 2.54 and 3.87
Two component hot-wire (X-probe)
λ = Ω𝑅 𝑈∞
STAR Global Conference
7-9th March 2016
Test Section entrance
HAWT model
X-wire
Traverse system (fixed to test section roof)
Optically transparent side walls

Experimental Conditions Measurement techniques
7
Sampling rate and time were 1 kHz for 1s respectively
5 data planes were recorded behind the HAWT in the near wake
Detailed data measurement – 1558 data points per plane
STAR Global Conference
7-9th March 2016

Numerical model Introduction
8
Investigate the ability of several turbulence models to predict wake turbulence
SST k- turbulence model (Vorticity Confinement model & curvature correction terms)
Reynolds Stress Transport (RST) turbulence model
All simulations were modelled on ICHEC* HPC cluster (Fionn)
144 and 192 cores respectively
2s of physical time modelled
Time cost: 50hrs and 144hrs respectively
*Irish Centre for High End Computing
STAR Global Conference
7-9th March 2016
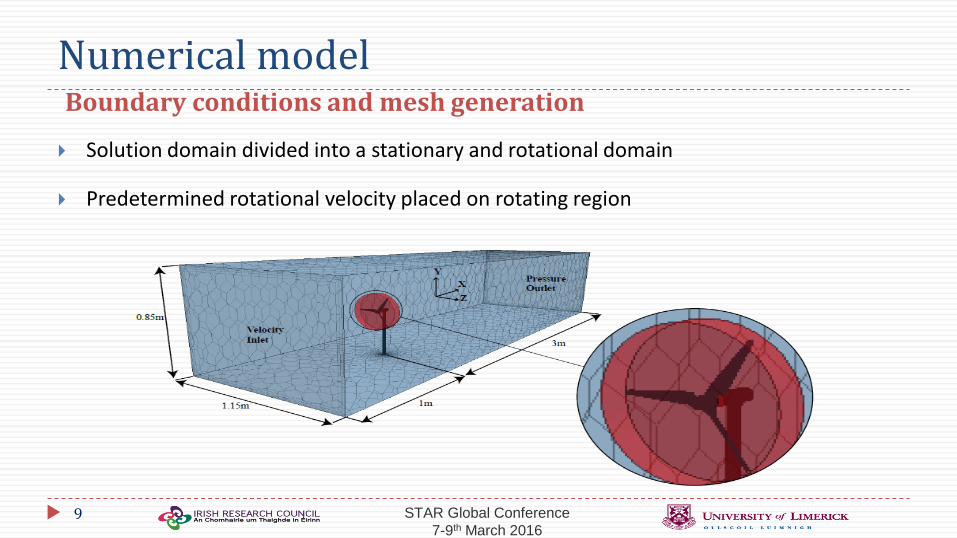
Numerical model Boundary conditions and mesh generation
9
Solution domain divided into a stationary and rotational domain
Predetermined rotational velocity placed on rotating region
STAR Global Conference
7-9th March 2016

Numerical model Boundary conditions and mesh generation
10
Divided the meshing process into two parts;
Meshing process for the rotating region
Meshing process for the wake/stationary region
STAR Global Conference
7-9th March 2016

Numerical model Boundary conditions and mesh generation
11
Meshing process for rotating region
Drag, Surface Avg. Pressure and Y+ values over the turbine blades
Base Size (mm) No. of Elements Surface Avg.
Pressure (Pa)
Drag (N)
20 6.69x10⁶ -71.50 0.301
30 5.19x10⁶ -71.22 0.281
38 4.28x10⁶ -71.20 0.273
40 3.9x10⁶ -71.20 0.264
60 2.4x10⁶ -71.09 0.210
STAR Global Conference
7-9th March 2016

Numerical model Boundary conditions and mesh generation
12
STAR Global Conference
7-9th March 2016

Numerical model Boundary conditions and mesh generation
13
STAR Global Conference
7-9th March 2016

Numerical model Boundary conditions and mesh generation
14
Meshing process for wake region
Volume change
STAR Global Conference
7-9th March 2016

Numerical model Boundary conditions and mesh generation
15
STAR Global Conference
7-9th March 2016

Numerical model Boundary conditions and mesh generation
16
Region No. of Cells Percentage of Total
Cells
Stationary 5.009x10⁶ 53.9%
Rotating 4.286x10⁶ 46.1%
Total 9.295x10⁶ 100%
STAR Global Conference
7-9th March 2016

Results Introduction
17
Mean velocity deficit and Reynolds stress (u′v′) for both TSR values
The u′v′ component of Reynolds stress is normalized by U2∞
Velocity measurements are normalized by U
Flow is time dependant Experimental results represent a statistical average of the
flow field for a large amount of rotor rotations
To represent the turbulence characteristics, data was taken from a line through the
centre of the wake in both the y and z directions.
Field variance monitors used such that numerical and experimental would both be
statistically averaged results
STAR Global Conference
7-9th March 2016

Results Velocity deficit λ = 2.54
18
SST k- > 5% of exp
RST > 3% of exp
Tower and nacelle have a major
impact of the velocity deficit
STAR Global Conference
7-9th March 2016

Results Velocity deficit λ = 3.87
19
Deficit not a severe as λ = 2.54
Tower and nacelle have a major
impact of the velocity deficit
SST k- > 8.32% of exp
RST > 9.46% of exp
Stall
STAR Global Conference
7-9th March 2016
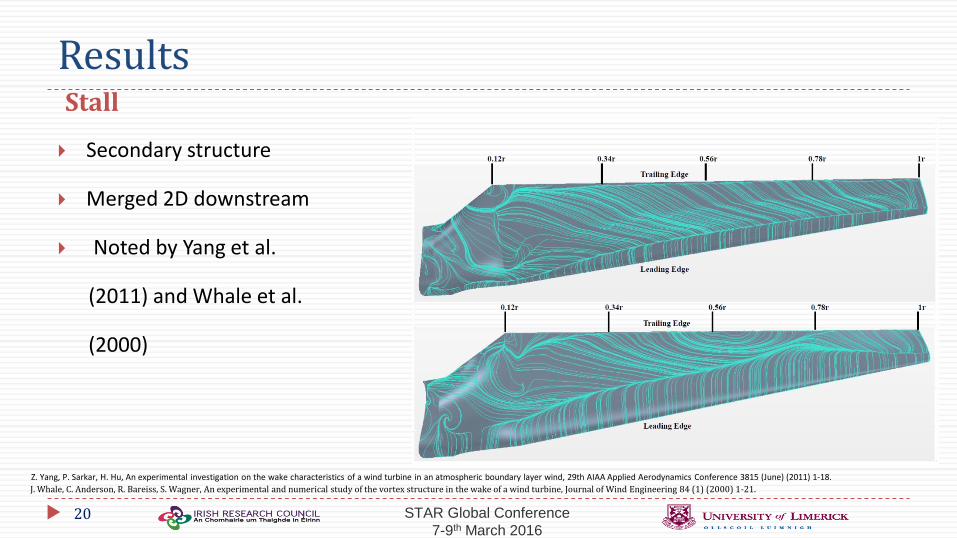
Results Stall
20
Secondary structure
Merged 2D downstream
Noted by Yang et al.
(2011) and Whale et al.
(2000)
STAR Global Conference
7-9th March 2016
Z. Yang, P. Sarkar, H. Hu, An experimental investigation on the wake characteristics of a wind turbine in an atmospheric boundary layer wind, 29th AIAA Applied Aerodynamics Conference 3815 (June) (2011) 1-18.
J. Whale, C. Anderson, R. Bareiss, S. Wagner, An experimental and numerical study of the vortex structure in the wake of a wind turbine, Journal of Wind Engineering 84 (1) (2000) 1-21.

Results Stall
21
STAR Global Conference
7-9th March 2016

Results Experimental and numerical Data – TSR 2.54
22
STAR Global Conference
7-9th March 2016

Results Experimental and numerical Data – TSR 2.54
23
STAR Global Conference
7-9th March 2016

Results Turbulence characteristics – Z_direction
24
Turbulence Model Tip Speed Ratio Percentage Error
SST k- turbulence
model
2.54 30.7
3.87 119.7
Reynolds Stress
Transport model
2.54 3.6
3.87 6.73
STAR Global Conference
7-9th March 2016

Results Turbulence characteristics – Y_direction
25
Turbulence Model Tip Speed Ratio Percentage Error
SST k- turbulence
model
2.54 10.66
3.87 162
Reynolds Stress
Transport model
2.54 5.17
3.87 10.46
STAR Global Conference
7-9th March 2016
Current Conclusions Conclusions
26
Both the SST and the RST turbulence models are capable of predicting the mean
velocity characteristics within a HAWT wake. (RST model appeared to correlate
stronger with experimental result)
Both models capable of accurately modelling the onset of stall
Tower structure is a major contributor of turbulence in the wake
Both models had difficultly modelling the fluctuating velocity components of the
flow
STAR Global Conference
7-9th March 2016

Thank you for your attention
Acknowledgements
27 STAR Global Conference
7-9th March 2016


![Welcome [2021.dla-conference.com]](https://static.fdocuments.us/doc/165x107/61e59a9c03d2f14de9314df8/welcome-2021dla-.jpg)
