A Comparison of the Hispanic Counts from the 2000 Census and the 2010 Census · 2019-07-16 · The...
38
THE HISPANIC POPULATION IN TEXAS A Comparison of the Hispanic Counts from the 2000 Census and the 2010 Census
Transcript of A Comparison of the Hispanic Counts from the 2000 Census and the 2010 Census · 2019-07-16 · The...

THE HISPANIC POPULATION IN TEXAS A Comparison of the Hispanic Counts from the 2000 Census and the 2010 Census

1
THE HISPANIC POPULATION IN TEXAS
A Comparison of the Hispanic Counts from the 2000 Census and the 2010 Census
Maya Halebic
SABÉR Research Institute
200 East Grayson Street, Suite 203
San Antonio, Texas 78215
One Camino Santa Maria
San Antonio, Texas 78228
(210) 208-8212
www.saberinstitute.org
August 2011
Publication Number 11-08

2
ABOUT THIS PUBLICATION
This publication presents population-related information regarding the state of Texas. Texas’
rapidly growing Hispanic population is dramatically changing the state’s demographic and
economic landscape. Over the past decade, the Hispanic population in Texas grew 41.8%,
making up 37.6% of the state’s total population. Births have surpassed immigration as the main
driver of the dynamic growth in the state’s Hispanic population. If this trend continues, it is
likely to be the main driver of growth in the Hispanic population into the future, even if
immigration slows. Looking at the Hispanic population by region, the West and South are home
to a majority of Hispanics, while growth has been most rapid in the South and Midwest. This
provides evidence that the Hispanic population is spreading throughout the country in substantial
numbers instead of being highly concentrated in just a few traditionally Hispanic states.
The author would like to thank Dr. Steve Nivin, Director and Chief Economist of the SABÉR
Research Institute, for reviewing this publication and for providing his input. Furthermore, the
author would like to acknowledge with appreciation Jon Alonzo in providing the photographs for
this publication.
Questions concerning this publication shall be directed to Maya Halebic at
[email protected], (210) 208-8212.

3
THE HISPANIC POPULATION IN TEXAS
A Comparison of the Hispanic Counts from the 2000 Census and the 2010 Census
Introduction
The 2010 Census counted 9,460,921 Hispanics in Texas, making up 37.6% of the state’s total
population. The state’s Hispanic population, which was 6,669,666 in 2000, grew 41.8% over the
decade. In comparison, non-Hispanic population grew by 10.6% since 2000.
Among children ages 17 and younger, there were 3,317,777 Hispanics in 2010, or 48.3% of this
age group. The number of Hispanic children grew 39.0% over the decade. In 2000, there were
2,386,765 Hispanic children, who were 40.5% of the population under age 18 (see Table 1).
There were 6,143,144 Hispanics ages 18 and older in 2010, a 43.4% increase from 2000.
Hispanics made up 33.6% of the adult population in 2010, compared with 28.6% and 4,282,901
people in 2000 (see Table 1).
Table 1
Hispanic Child and Adult Populations for Texas, 2000 and 2010
All Children Adults
Hispanic Population
2010 9,460,921 3,317,777 6,143,144
2000 6,669,666 2,386,765 4,282,901
Hispanic Population
Growth, 2000-2010
Absolute Growth 2,791,255 931,012 1,860,243
Percent Growth 41.8% 39.0% 43.4%
Hispanic Share of Total
2010 37.6% 48.3% 33.6%
2000 32.0% 40.5% 28.6%
Notes: Children are those younger than 18; Adults are those 18 years of age or older.
Source: SABÉR Research Institute tabulations of U.S. Census Bureau Redistricting_Files-PL_94- 171 for states

4
Hispanics, who can be of any race, are the state’s largest minority group (see Figure 1). Looking
at the major groups of single-race Hispanics and non-Hispanics in 2010, 70.4% were white;
11.8% were black; and 3.8% were Asian. There was 2.7% of the state’s population, who reported
more than one race (see Figure 2). With respect to percent growth of the major racial groups over
the decade the white population increased by 19.6%, followed by blacks (23.9%), two or more
races (31.9%), and Asians (71.5%).
Figure 1
Source: SABÉR Research Institute tabulations of U.S. Census Bureau Redistricting_Files- PL_94-171 for states
Figure 2
Notes: Racial groups include Hispanics and non-Hispanics. Hispanics are of any race.
Source: SABÉR Research Institute tabulations of U.S. Census Bureau Redistricting_Files-PL_94-171 for states
0.0% 20.0% 40.0% 60.0% 80.0%
Not Hispanic
Hispanic
Percent of Population
Population by Hispanic Origin for Texas, 2010
Series1
Change 2000-2010
41.8%
10.6%
2.7%
10.5%
0.1%
3.8%
0.7%
11.8%
70.4%
0.0% 20.0% 40.0% 60.0% 80.0%
Two or More Races
Some Other Race alone
Native Hawaiian and Other Pacific Islander alone
Asian alone
American Indian and Alaska Native alone
Black or African American alone
White alone
Percent of Population
Population by Race for Texas, 2010
Series1
Change
2000-2010
19.6%
23.9%
44.4%
71.5%
50.0%
7.8%
31.9%

5
Births have surpassed immigration as the main driver of the dynamic growth in the state’s
Hispanic population. This trend is especially evident among the largest of all Hispanic groups –
Mexican-Americans.1 Between 2000 and 2010, the nation’s Mexican-American population grew
by 7.2 million as a result of births and 4.2 million as a result of new immigrant arrivals (see
Figure 3). The current surge in births among Mexican-Americans is largely attributable to the
immigration wave that has brought more than 10 million immigrants to the U.S. from Mexico
since 1970. Between 2006 and 2010 alone, 53% of all Mexican-American births were to
Mexican immigrant parents. As a group, these immigrants are more likely than U.S.-born
Americans to be in their prime child-bearing years and they also have much higher fertility.2 If
this trend continues, it is likely to be a key driver of growth in the Hispanic population into the
future, even if immigration slows.
Figure 3
Source: Pew Research Center
1 The term “Mexican-American” refers to Hispanics who were born in Mexico or U.S.-born Hispanics who trace
their ancestry to Mexico. 2 Pew Hispanic Center. 2011. The Mexican-American Boom: Births Overtake Immigration. Washington, DC: Pew
Hispanic Center, July. http://pewhispanic.org/files/reports/144.pdf
2.7
4.7
7.2
3.1
4.74.2
0
1
2
3
4
5
6
7
8
1980-1990 1990-2000 2000-2010
Bir
ths
(mil
lio
ns)
Mexican-American Population Growth, 1980-2010
Births during decade
New immigrants during
decade

6
Geographically, most Hispanics still live in five states that have large, long-stranding Hispanic
communities, including California, Texas, Florida, New York, and Illinois (see Table 2 & 3). In
2010, 46.5% of Hispanics lived in California and Texas alone. In 2000, that share was 50%.
Source: SABÉR Research Institute tabulations of Source: SABÉR Research Institute tabulations of U.S. Census Bureau Redistricting_Files-PL_94-171 U.S. Census Bureau Redistricting_Files-PL_94-171
for states for states
However, the share of Hispanics living in other states has been growing. In this respect, the
states with the largest percent growth in their Hispanic populations include South Carolina,
Alabama, Tennessee, Kentucky, Arkansas, North Carolina, Maryland, Mississippi, and South
Dakota. In these states, the Hispanic population more than doubled over the past decade (see
Table 4). Part of the reason for these large growth rates is due to the small Hispanic population
base, but it still indicates strong growth in these states.
Table 2
States with Largest Hispanic
Populations, 2010
(thousands)
State Population
California 14,014
Texas 9,461
Florida 4,224
New York 3,417
Illinois 2,028
Arizona 1,895
New Jersey 1,555
Colorado 1,039
New Mexico 953
Georgia 854
Table 3
States with Largest Hispanic Share
of Total Population, 2010
(%)
State Hispanic Share
New Mexico 46.3
Texas 37.6
California 37.6
Arizona 29.6
Nevada 26.5
Florida 22.5
Colorado 20.7
New Jersey 17.7
New York 17.6
Illinois 15.8

7
Source: SABÉR Research Institute tabulations of U.S. Census Bureau Redistricting_Files-PL_94-171 for states
Looking at the Hispanic population by region, the West and South are home to a majority of
Hispanics, while growth has been most rapid in the South and Midwest (see Map 1). This
provides evidence that the Hispanic population is spreading throughout the country in substantial
numbers instead of being so highly concentrated in just a few states.
Map 1
Hispanic Population Growth, 2000-2010
Source: Pew Research Center
Table 4
States with Largest Hispanic Population
Growth, 2000-2010
(%)
State Growth, 2000-2010
South Carolina 148
Alabama 145
Tennessee 134
Kentucky 122
Arkansas 114
North Carolina 111
Maryland 106
Mississippi 106
South Dakota 103

8
The Hispanic Population in Texas
In 2010, the U.S. Census Bureau released population counts indicating that there were 9,460,921
Hispanics living in Texas. Hispanics account for 37.6% of the state’s total population. Hispanics
are defined by the U.S. Census Bureau as people of Cuban, Mexican, Puerto Rican, South or
Central American, or other Spanish culture or origin regardless of race.3 The 2000 Census
enumerated 6,669,666 Hispanics living in Texas which was 32.0% of the total population. From
2000 to 2010, the number of Hispanics in the state increased by 2,791,255 persons or by 41.8%.
This is equivalent to a 3.56% annualized growth rate. From 2000 to 2010, the total population of
Texas increased by 4,293,741 persons, from 20,851,820 in 2000 to 25,145,561 in 2010. Hence,
the total population grew by 20.6%, and Texas had an annualized growth rate of 1.89%. Since
the 2000 Census, Hispanics contributed 65.01% to the increase of the state’s total population,
while non-Hispanics accounted for 34.99% of the population growth of Texas (see Tables 5 &
6).
Texas and Other States
With an increase of 41.8% in Hispanic population between 2000 and 2010, Texas ranked 42nd
in
the nation (see Table 9). Compared to other states, however, Texas ranked second with respect to
the total number of Hispanics residing in the state. Along with Texas, the states of California,
Florida, New York, and Illinois had the largest numerical concentrations of Hispanics in 2010.
Since the 2000 Census, California, Texas, and Florida witnessed the largest absolute increase of
Hispanics with Texas ranking second. The states with the largest percent growth in their
Hispanic populations include South Carolina, Alabama, Tennessee, Kentucky, Arkansas, North
Carolina, Maryland, Mississippi, and South Dakota. In these nine states, the Hispanic population
more than doubled since 2000.
Spatial Variation within Texas
Between 2000 and 2010, the Hispanic population growth varied across the Texas counties. The
average annualized growth for Hispanic population within the counties was 3.2%. This compares
3 Ennis, Sharon R., Merarys Rios-Vargas, and Nora G. Albert. 2011. The Hispanic Population: 2010. C2010BR-04.
Washington, D.C.: U.S. Census Bureau, May. http://www.census.gov/prod/cen2010/briefs/c2010br-04.pdf

9
to an overall state annualized growth rate of 1.9%. These rates ranged from a low of -3.3% in
Foard County to a high of 10.3% in San Jacinto County. The median annualized growth rate in
Hispanic population for the counties was 2.8%.
The Hispanic population was not evenly distributed in Texas from 2000 to 2010. In 2010, 57.4%
of the state’s Hispanic population resided in counties including Harris, Bexar, Dallas, Hidalgo,
El Paso, and Tarrant. With respect to percentage distributions, eight counties had percentage
concentrations of at least 90%. Hispanics comprised more than 90% of the 2010 total population
in the following eight counties: Webb (95.7%), Starr (95.7%), Maverick (95.7%), Zavala
(93.9%), Zapata (93.3%), Jim Hogg (92.6%), Brooks (91.2), and Hidalgo (90.6%).
Although the Hispanic population continued to grow from 2000 to 2010, some of the counties
saw a decline in their percentage growth. The following nine counties had percentage decline of
at least 10%: Foard (-29.4%), Newton (-29.4%), Sterling (-15.5%), Culberson (-15.0%), Live
Oak (-13.3%), Cottle (-12.2%), Throckmorton (-12.1%), Terrell (-11.1%), and Glasscock (-
10.0%). The following map (Map 2) shows the state’s population percent change by county for
the period 2000-2010.
Map 2
Population Change by County, 2000-2010
Source: U.S. Census Bureau, Redistricting Data

10
Table 5
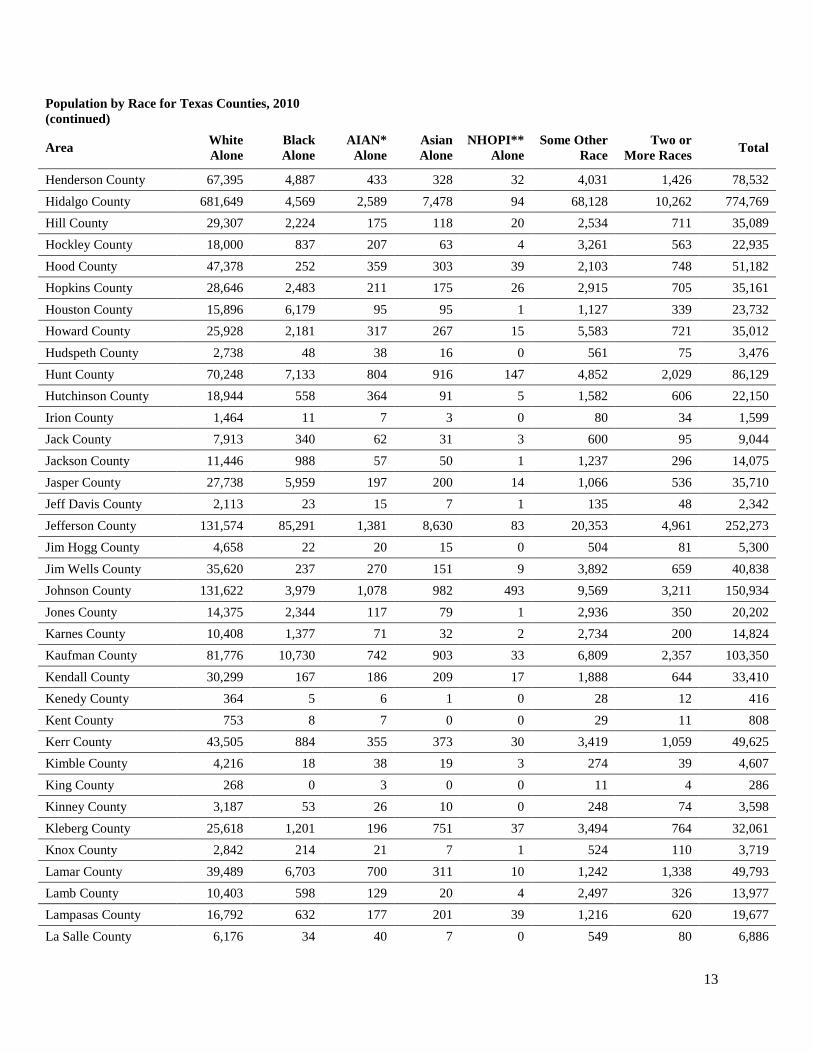
Population by Race for Texas Counties, 2010
Area White
Alone
Black
Alone
AIAN*
Alone
Asian
Alone
NHOPI**
Alone
Some Other
Race
Two or
More Races Total
Texas State 17,701,552 2,979,598 170,972 964,596 21,656 2,628,186 679,001 25,145,561
Anderson County 38,632 12,310 259 291 21 5,952 993 58,458
Andrews County 11,749 222 142 91 1 2,289 292 14,786
Angelina County 62,537 13,035 411 785 13 8,466 1,524 86,771
Aransas County 20,231 303 171 455 8 1,467 523 23,158
Archer County 8,504 40 60 18 3 295 134 9,054
Armstrong County 1,774 11 15 0 0 80 21 1,901
Atascosa County 38,130 359 341 156 30 4,879 1,016 44,911
Austin County 22,379 2,668 138 118 1 2,489 624 28,417
Bailey County 5,392 86 103 30 6 1,406 142 7,165
Bandera County 19,010 98 166 57 2 782 370 20,485
Bastrop County 54,750 5,772 739 489 66 10,206 2,149 74,171
Baylor County 3,410 75 11 4 3 146 77 3,726
Bee County 25,092 2,592 165 177 17 3,080 738 31,861
Bell County 190,553 66,700 2,496 8,748 2,430 23,834 15,474 310,235
Bexar County 1,250,252 128,892 14,475 41,739 2,350 217,389 59,676 1,714,773
Blanco County 9,475 69 74 51 4 623 201 10,497
Borden County 600 0 2 1 0 28 10 641
Bosque County 16,372 296 104 41 2 1,079 318 18,212
Bowie County 63,641 22,387 694 734 51 3,077 1,981 92,565
Brazoria County 219,416 37,761 1,770 17,227 89 28,656 8,247 313,166
Brazos County 142,814 21,414 865 10,083 119 14,997 4,559 194,851
Brewster County 7,993 104 103 66 5 699 262 9,232
Briscoe County 1,433 41 3 0 0 120 40 1,637
Brooks County 6,471 37 25 21 1 570 98 7,223
Brown County 32,962 1,382 216 163 14 2,569 800 38,106
Burleson County 13,392 2,098 107 28 3 1,233 326 17,187
Burnet County 37,825 766 290 203 17 2,855 794 42,750
Caldwell County 28,865 2,585 305 357 13 4,975 966 38,066
Calhoun County 17,432 565 104 948 8 1,883 441 21,381
Callahan County 12,724 141 75 57 8 292 247 13,544
Cameron County 353,423 2,155 1,688 2,689 113 39,905 6,247 406,220
Camp County 8,402 2,163 82 60 17 1,337 340 12,401
Carson County 5,803 35 67 19 0 153 105 6,182
Cass County 24,079 5,315 161 91 4 390 424 30,464

11
Population by Race for Texas Counties, 2010
(continued)
Area White
Alone
Black
Alone
AIAN*
Alone
Asian
Alone
NHOPI**
Alone
Some Other
Race
Two or
More Races Total
Castro County 5,532 162 76 33 0 2,129 130 8,062
Chambers County 27,582 2,872 219 339 21 3,320 743 35,096
Cherokee County 36,450 7,498 342 237 9 5,207 1,102 50,845
Childress County 5,774 698 40 50 2 376 101 7,041
Clay County 10,224 57 123 28 1 138 181 10,752
Cochran County 2,288 125 36 5 3 586 84 3,127
Coke County 3,036 8 37 5 1 169 64 3,320
Coleman County 7,841 197 58 32 1 593 173 8,895
Collin County 560,036 66,387 4,448 87,752 448 40,087 23,183 782,341
Collingsworth County 2,338 134 52 4 0 405 124 3,057
Colorado County 15,676 2,740 125 77 16 1,846 394 20,874
Comal County 97,044 1,727 645 849 51 5,808 2,348 108,472
Comanche County 12,417 53 92 35 4 1,143 230 13,974
Concho County 3,553 77 16 14 5 345 77 4,087
Cooke County 32,943 1,054 402 290 19 2,901 828 38,437
Coryell County 53,033 11,943 639 1,423 662 3,881 3,807 75,388
Cottle County 1,212 133 5 0 1 123 31 1,505
Crane County 3,243 125 44 16 0 847 100 4,375
Crockett County 3,092 30 34 13 3 483 64 3,719
Crosby County 4,784 209 35 6 4 898 123 6,059
Culberson County 1,892 15 31 24 0 369 67 2,398
Dallam County 5,371 84 83 41 6 871 247 6,703
Dallas County 1,267,861 528,200 17,133 119,250 1,222 367,610 66,863 2,368,139
Dawson County 10,606 905 99 49 7 1,854 313 13,833
Deaf Smith County 15,075 242 176 61 2 3,352 464 19,372
Delta County 4,461 380 72 30 0 141 147 5,231
Denton County 497,260 55,534 4,551 43,478 462 41,916 19,413 662,614
DeWitt County 15,206 1,876 88 44 0 2,414 469 20,097
Dickens County 2,052 99 38 22 0 192 41 2,444
Dimmit County 8,860 99 34 56 0 785 162 9,996
Donley County 3,307 164 18 9 2 111 66 3,677
Duval County 10,247 110 45 22 5 1,152 201 11,782
Eastland County 16,697 335 124 62 9 1,062 294 18,583
Ector County 104,653 6,141 1,351 1,080 119 20,384 3,402 137,130
Edwards County 1,739 11 26 7 0 197 22 2,002
Ellis County 117,662 13,482 893 851 95 13,344 3,283 149,610

12
Population by Race for Texas Counties, 2010
(continued)
Area White
Alone
Black
Alone
AIAN*
Alone
Asian
Alone
NHOPI**
Alone
Some Other
Race
Two or
More Races Total
El Paso County 656,993 24,864 6,007 8,284 999 83,796 19,704 800,647
Erath County 32,441 451 291 257 13 3,796 641 37,890
Falls County 10,832 4,524 101 46 10 2,010 343 17,866
Fannin County 29,172 2,312 369 125 7 1,228 702 33,915
Fayette County 20,491 1,632 177 66 7 1,849 332 24,554
Fisher County 3,444 136 20 8 0 286 80 3,974
Floyd County 4,916 232 47 11 1 1,163 76 6,446
Foard County 1,211 53 3 5 0 54 10 1,336
Fort Bend County 296,310 125,818 2,302 99,370 226 44,328 17,021 585,375
Franklin County 9,178 417 72 50 2 696 190 10,605
Freestone County 14,484 3,193 140 58 5 1,614 322 19,816
Frio County 13,326 584 85 367 1 2,518 336 17,217
Gaines County 14,726 305 102 44 0 1,996 353 17,526
Galveston County 211,088 40,112 1,748 8,690 149 21,631 7,891 291,309
Garza County 5,348 420 36 8 3 571 75 6,461
Gillespie County 22,667 89 154 89 11 1,520 307 24,837
Glasscock County 1,044 15 4 1 2 145 15 1,226
Goliad County 6,035 343 50 15 2 595 170 7,210
Gonzales County 14,158 1,468 190 78 5 3,474 434 19,807
Gray County 18,363 1,097 200 91 1 2,238 545 22,535
Grayson County 101,371 7,081 1,835 1,046 41 6,261 3,242 120,877
Gregg County 81,928 24,390 728 1,343 56 10,543 2,742 121,730
Grimes County 19,409 4,390 139 63 7 2,020 576 26,604
Guadalupe County 105,017 8,512 897 1,861 186 11,053 4,007 131,533
Hale County 25,670 1,925 350 142 21 7,097 1,068 36,273
Hall County 2,579 242 26 3 2 449 52 3,353
Hamilton County 7,913 46 68 34 1 366 89 8,517
Hansford County 4,593 36 52 16 0 789 127 5,613
Hardeman County 3,538 246 26 12 0 211 106 4,139
Hardin County 49,505 3,193 217 276 6 720 718 54,635
Harris County 2,318,256 775,492 27,763 253,032 3,018 583,566 131,332 4,092,459
Harrison County 45,020 14,398 447 339 31 4,277 1,119 65,631
Hartley County 5,272 418 22 29 3 250 68 6,062
Haskell County 4,876 220 39 31 0 579 154 5,899
Hays County 126,712 5,536 1,224 1,821 137 17,232 4,445 157,107
Hemphill County 3,310 9 15 18 3 383 69 3,807
13
Population by Race for Texas Counties, 2010
(continued)
Area White
Alone
Black
Alone
AIAN*
Alone
Asian
Alone
NHOPI**
Alone
Some Other
Race
Two or
More Races Total
Henderson County 67,395 4,887 433 328 32 4,031 1,426 78,532
Hidalgo County 681,649 4,569 2,589 7,478 94 68,128 10,262 774,769
Hill County 29,307 2,224 175 118 20 2,534 711 35,089
Hockley County 18,000 837 207 63 4 3,261 563 22,935
Hood County 47,378 252 359 303 39 2,103 748 51,182
Hopkins County 28,646 2,483 211 175 26 2,915 705 35,161
Houston County 15,896 6,179 95 95 1 1,127 339 23,732
Howard County 25,928 2,181 317 267 15 5,583 721 35,012
Hudspeth County 2,738 48 38 16 0 561 75 3,476
Hunt County 70,248 7,133 804 916 147 4,852 2,029 86,129
Hutchinson County 18,944 558 364 91 5 1,582 606 22,150
Irion County 1,464 11 7 3 0 80 34 1,599
Jack County 7,913 340 62 31 3 600 95 9,044
Jackson County 11,446 988 57 50 1 1,237 296 14,075
Jasper County 27,738 5,959 197 200 14 1,066 536 35,710
Jeff Davis County 2,113 23 15 7 1 135 48 2,342
Jefferson County 131,574 85,291 1,381 8,630 83 20,353 4,961 252,273
Jim Hogg County 4,658 22 20 15 0 504 81 5,300
Jim Wells County 35,620 237 270 151 9 3,892 659 40,838
Johnson County 131,622 3,979 1,078 982 493 9,569 3,211 150,934
Jones County 14,375 2,344 117 79 1 2,936 350 20,202
Karnes County 10,408 1,377 71 32 2 2,734 200 14,824
Kaufman County 81,776 10,730 742 903 33 6,809 2,357 103,350
Kendall County 30,299 167 186 209 17 1,888 644 33,410
Kenedy County 364 5 6 1 0 28 12 416
Kent County 753 8 7 0 0 29 11 808
Kerr County 43,505 884 355 373 30 3,419 1,059 49,625
Kimble County 4,216 18 38 19 3 274 39 4,607
King County 268 0 3 0 0 11 4 286
Kinney County 3,187 53 26 10 0 248 74 3,598
Kleberg County 25,618 1,201 196 751 37 3,494 764 32,061
Knox County 2,842 214 21 7 1 524 110 3,719
Lamar County 39,489 6,703 700 311 10 1,242 1,338 49,793
Lamb County 10,403 598 129 20 4 2,497 326 13,977
Lampasas County 16,792 632 177 201 39 1,216 620 19,677
La Salle County 6,176 34 40 7 0 549 80 6,886

14
Population by Race for Texas Counties, 2010
(continued)
Area White
Alone
Black
Alone
AIAN*
Alone
Asian
Alone
NHOPI**
Alone
Some Other
Race
Two or
More Races Total
Lavaca County 16,563 1,301 60 56 17 939 327 19,263
Lee County 13,101 1,807 104 55 18 1,204 323 16,612
Leon County 14,258 1,202 71 81 2 946 241 16,801
Liberty County 58,363 8,202 430 348 26 6,789 1,485 75,643
Limestone County 16,139 4,103 121 90 7 2,464 460 23,384
Lipscomb County 2,845 25 37 10 0 311 74 3,302
Live Oak County 10,107 502 92 57 3 592 178 11,531
Llano County 18,319 112 118 77 5 397 273 19,301
Loving County 65 0 4 0 0 7 6 82
Lubbock County 215,519 20,952 2,040 5,753 188 27,512 6,867 278,831
Lynn County 4,748 127 72 8 0 822 138 5,915
McCulloch County 6,947 160 55 29 1 941 150 8,283
McLennan County 164,037 34,767 1,473 3,220 107 25,497 5,805 234,906
McMullen County 643 8 0 3 0 35 18 707
Madison County 9,149 2,719 68 79 3 1,407 239 13,664
Marion County 7,752 2,325 85 50 3 105 226 10,546
Martin County 4,067 78 30 12 3 524 85 4,799
Mason County 3,731 18 18 7 0 199 39 4,012
Matagorda County 26,137 4,200 258 719 8 4,530 850 36,702
Maverick County 49,617 135 642 177 4 3,138 545 54,258
Medina County 39,369 1,012 331 296 36 3,950 1,012 46,006
Menard County 1,847 13 18 3 0 324 37 2,242
Midland County 105,302 9,087 1,013 1,715 54 16,431 3,270 136,872
Milam County 19,347 2,473 171 96 1 2,228 441 24,757
Mills County 4,440 26 19 11 1 364 75 4,936
Mitchell County 6,433 1,060 70 28 0 1,662 150 9,403
Montague County 18,384 53 175 62 4 717 324 19,719
Montgomery County 380,593 19,401 3,348 9,546 311 31,854 10,693 455,746
Moore County 15,886 336 280 1,337 18 3,583 464 21,904
Morris County 9,014 2,976 93 45 7 545 254 12,934
Motley County 1,115 24 10 0 0 48 13 1,210
Nacogdoches County 44,249 11,731 365 797 25 6,067 1,290 64,524
Navarro County 33,142 6,606 305 253 382 5,978 1,069 47,735
Newton County 11,105 2,901 80 62 1 86 210 14,445
Nolan County 12,728 715 95 67 0 1,267 344 15,216
Nueces County 277,402 13,637 2,128 5,731 269 32,797 8,259 340,223

15
Population by Race for Texas Counties, 2010
(continued)
Area White
Alone
Black
Alone
AIAN*
Alone
Asian
Alone
NHOPI**
Alone
Some Other
Race
Two or
More Races Total
Ochiltree County 8,747 39 98 28 4 1,067 240 10,223
Oldham County 1,850 62 13 17 0 80 30 2,052
Orange County 70,478 6,979 426 804 43 1,681 1,426 81,837
Palo Pinto County 24,497 621 202 134 14 2,137 506 28,111
Panola County 18,267 3,867 105 73 3 1,064 417 23,796
Parker County 106,862 1,915 909 639 40 4,431 2,131 116,927
Parmer County 7,969 119 100 25 21 1,815 220 10,269
Pecos County 12,307 572 125 79 5 2,092 327 15,507
Polk County 35,082 5,211 881 188 10 3,280 761 45,413
Potter County 84,523 12,365 1,004 4,822 63 14,611 3,685 121,073
Presidio County 6,715 47 57 76 0 771 152 7,818
Rains County 9,953 256 113 55 1 366 170 10,914
Randall County 107,305 2,867 822 1,684 41 5,311 2,695 120,725
Reagan County 2,596 70 20 6 0 613 62 3,367
Real County 2,996 22 37 2 12 175 65 3,309
Red River County 9,838 2,233 125 23 1 410 230 12,860
Reeves County 10,645 690 64 119 6 2,047 212 13,783
Refugio County 5,943 483 42 33 0 735 147 7,383
Roberts County 871 1 3 2 0 33 19 929
Robertson County 11,247 3,586 96 103 1 1,262 327 16,622
Rockwall County 65,514 4,521 472 1,897 56 4,246 1,631 78,337
Runnels County 8,735 192 71 21 3 1,304 175 10,501
Rusk County 38,512 9,435 290 214 19 3,800 1,060 53,330
Sabine County 9,658 784 56 33 0 133 170 10,834
San Augustine County 6,375 2,016 35 23 0 293 123 8,865
San Jacinto County 21,693 2,710 164 123 9 1,164 521 26,384
San Patricio County 55,660 1,071 386 537 58 5,522 1,570 64,804
San Saba County 5,166 204 48 13 0 605 95 6,131
Schleicher County 2,780 38 16 4 0 527 96 3,461
Scurry County 13,325 799 106 59 4 2,247 381 16,921
Shackelford County 3,145 29 19 9 1 113 62 3,378
Shelby County 17,467 4,432 89 81 0 3,021 358 25,448
Sherman County 2,680 14 23 7 0 264 46 3,034
Smith County 147,086 37,629 1,141 2,597 79 17,024 4,158 209,714
Somervell County 7,220 57 72 53 1 857 230 8,490
Starr County 58,585 69 77 133 0 1,811 293 60,968

16
Population by Race for Texas Counties, 2010
(continued)
Area White
Alone
Black
Alone
AIAN*
Alone
Asian
Alone
NHOPI**
Alone
Some Other
Race
Two or
More Races Total
Stephens County 8,161 201 51 32 1 1,023 161 9,630
Sterling County 1,013 14 23 0 0 71 22 1,143
Stonewall County 1,306 39 8 14 0 94 29 1,490
Sutton County 3,662 17 17 8 0 361 63 4,128
Swisher County 5,901 566 72 10 4 1,150 151 7,854
Tarrant County 1,205,530 268,983 11,827 84,561 3,184 180,672 54,277 1,809,034
Taylor County 104,409 9,699 892 2,073 123 10,040 4,270 131,506
Terrell County 828 7 9 4 0 121 15 984
Terry County 10,283 605 78 30 0 1,331 324 12,651
Throckmorton County 1,555 11 12 7 0 43 13 1,641
Titus County 21,848 3,091 354 237 16 6,034 754 32,334
Tom Green County 90,069 4,445 877 1,118 100 10,484 3,131 110,224
Travis County 709,814 87,308 8,555 59,333 718 124,706 33,832 1,024,266
Trinity County 12,302 1,378 69 42 3 576 215 14,585
Tyler County 17,930 2,390 115 51 6 1,010 264 21,766
Upshur County 33,466 3,416 259 150 3 1,167 848 39,309
Upton County 2,516 63 58 0 0 649 69 3,355
Uvalde County 20,631 170 146 134 6 4,534 784 26,405
Val Verde County 41,534 746 240 238 44 5,067 1,010 48,879
Van Zandt County 47,784 1,427 457 171 33 1,741 966 52,579
Victoria County 69,013 5,513 503 899 23 8,747 2,095 86,793
Walker County 45,511 15,257 302 631 28 4,737 1,395 67,861
Waller County 25,254 10,739 354 214 10 5,682 952 43,205
Ward County 8,227 522 98 32 1 1,429 349 10,658
Washington County 25,008 5,947 99 445 8 1,679 532 33,718
Webb County 220,201 1,132 1,006 1,464 30 22,782 3,689 250,304
Wharton County 29,793 5,817 161 160 2 4,596 751 41,280
Wheeler County 4,469 113 44 23 0 638 123 5,410
Wichita County 101,331 13,811 1,394 2,669 101 8,368 3,826 131,500
Wilbarger County 10,585 1,086 145 98 6 1,271 344 13,535
Willacy County 18,995 473 63 140 7 2,048 408 22,134
Williamson County 330,191 26,196 2,629 20,433 413 29,336 13,481 422,679
Wilson County 38,231 701 281 163 9 2,614 919 42,918
Winkler County 5,238 156 71 17 0 1,410 218 7,110
Wise County 52,448 627 461 244 16 4,093 1,238 59,127
Wood County 37,213 1,972 280 161 21 1,724 593 41,964

17
Population by Race for Texas Counties, 2010
(continued)
Area White
Alone
Black
Alone
AIAN*
Alone
Asian
Alone
NHOPI**
Alone
Some Other
Race
Two or
More Races Total
Yoakum County 5,868 70 59 31 1 1,640 210 7,879
Young County 16,748 232 138 65 5 1,004 358 18,550
Zapata County 13,122 19 42 32 0 725 78 14,018
Zavala County 10,301 89 41 4 16 1,062 164 11,677
*AIAN stands for American Indian and Alaska Native.
** NHOPI stands for Native Hawaiian and Other Pacific Islander.
Source: U.S. Census Bureau, Census 2010 Summary File 1

18
Table 6
Hispanic Percent Share for Texas by County, 2000 and 2010
Total Hispanic Population Hispanic Share of State Total (%) Population Change, 2000 to 2010
Area 2000 2010 2000 2010 Numeric Change Percent Change
Texas State 6,669,666 9,460,921 32.0 37.6 2,791,255 41.8%
Anderson County 6,705 9,287 12.2 15.9 2,582 38.5%
Andrews County 5,202 7,195 40.0 48.7 1,993 38.3%
Angelina County 11,496 17,145 14.3 19.8 5,649 49.1%
Aransas County 4,571 5,690 20.3 24.6 1,119 24.5%
Archer County 431 675 4.9 7.5 244 56.6%
Armstrong County 116 124 5.4 6.5 8 6.9%
Atascosa County 22,620 27,785 58.6 61.9 5,165 22.8%
Austin County 3,805 6,641 16.1 23.4 2,836 74.5%
Bailey County 3,119 4,283 47.3 59.8 1,164 37.3%
Bandera County 2,384 3,415 13.5 16.7 1,031 43.2%
Bastrop County 13,845 24,190 24.0 32.6 10,345 74.7%
Baylor County 382 455 9.3 12.2 73 19.1%
Bee County 17,450 17,906 53.9 56.2 456 2.6%
Bell County 39,701 67,010 16.7 21.6 27,309 68.8%
Bexar County 757,033 1,006,958 54.3 58.7 249,925 33.0%
Blanco County 1,290 1,909 15.3 18.2 619 48.0%
Borden County 87 95 11.9 14.8 8 9.2%
Bosque County 2,104 2,926 12.2 16.1 822 39.1%
Bowie County 3,992 6,062 4.5 6.5 2,070 51.9%
Brazoria County 55,063 86,643 22.8 27.7 31,580 57.4%
Brazos County 27,253 45,405 17.9 23.3 18,152 66.6%
Brewster County 3,867 3,918 43.6 42.4 51 1.3%
Briscoe County 407 411 22.7 25.1 4 1.0%
Brooks County 7,304 6,590 91.6 91.2 -714 -9.8%
Brown County 5,793 7,453 15.4 19.6 1,660 28.7%
Burleson County 2,411 3,166 14.6 18.4 755 31.3%
Burnet County 5,044 8,652 14.8 20.2 3,608 71.5%
Caldwell County 13,018 17,922 40.4 47.1 4,904 37.7%
Calhoun County 8,448 9,922 40.9 46.4 1,474 17.4%
Callahan County 812 1,025 6.3 7.6 213 26.2%
Cameron County 282,736 357,747 84.3 88.1 75,011 26.5%
Camp County 1,707 2,648 14.8 21.4 941 55.1%
Carson County 458 525 7.0 8.5 67 14.6%
Cass County 526 1,053 1.7 3.5 527 100.2%

19
Hispanic Percent Share for Texas by County, 2000 and 2010 (continued)
Total Hispanic Population Hispanic Share of State Total (%) Population Change, 2000 to 2010
Area 2000 2010 2000 2010 Numeric Change Percent Change
Castro County 4,279 4,828 51.6 59.9 549 12.8%
Chambers County 2,810 6,635 10.8 18.9 3,825 136.1%
Cherokee County 6,178 10,499 13.2 20.6 4,321 69.9%
Childress County 1,574 1,885 20.5 26.8 311 19.8%
Clay County 404 467 3.7 4.3 63 15.6%
Cochran County 1,646 1,654 44.1 52.9 8 0.5%
Coke County 653 602 16.9 18.1 -51 -7.8%
Coleman County 1,289 1,419 14.0 16.0 130 10.1%
Collin County 50,510 115,354 10.3 14.7 64,844 128.4%
Collingsworth County 655 916 20.4 30.0 261 39.8%
Colorado County 4,024 5,452 19.7 26.1 1,428 35.5%
Comal County 17,609 26,989 22.6 24.9 9,380 53.3%
Comanche County 2,928 3,605 20.9 25.8 677 23.1%
Concho County 1,639 2,173 41.3 53.2 534 32.6%
Cooke County 3,627 5,997 10.0 15.6 2,370 65.3%
Coryell County 9,424 11,973 12.6 15.9 2,549 27.0%
Cottle County 360 316 18.9 21.0 -44 -12.2%
Crane County 1,753 2,409 43.9 55.1 656 37.4%
Crockett County 2,242 2,352 54.7 63.2 110 4.9%
Crosby County 3,460 3,171 48.9 52.3 -289 -8.4%
Culberson County 2,149 1,827 72.2 76.2 -322 -15.0%
Dallam County 1,766 2,717 28.4 40.5 951 53.9%
Dallas County 662,729 905,940 29.9 38.3 243,211 36.7%
Dawson County 7,222 7,387 48.2 53.4 165 2.3%
Deaf Smith County 10,654 13,039 57.4 67.3 2,385 22.4%
Delta County 165 288 3.1 5.5 123 74.5%
Denton County 52,619 120,836 12.2 18.2 68,217 129.6%
DeWitt County 5,452 6,502 27.2 32.4 1,050 19.3%
Dickens County 660 708 23.9 29.0 48 7.3%
Dimmit County 8,708 8,616 85.0 86.2 -92 -1.1%
Donley County 243 309 6.3 8.4 66 27.2%
Duval County 11,544 10,424 88.0 88.5 -1,120 -9.7%
Eastland County 1,976 2,673 10.8 14.4 697 35.3%
Ector County 51,306 72,331 42.4 52.7 21,025 41.0%
Edwards County 974 1,027 45.1 51.3 53 5.4%
Ellis County 20,508 35,161 18.4 23.5 14,653 71.5%

20
Hispanic Percent Share for Texas by County, 2000 and 2010 (continued)
Total Hispanic Population Hispanic Share of State Total (%) Population Change, 2000 to 2010
Area 2000 2010 2000 2010 Numeric Change Percent Change
El Paso County 531,654 658,134 78.2 82.2 126,480 23.8%
Erath County 4,959 7,279 15.0 19.2 2,320 46.8%
Falls County 2,941 3,716 15.8 20.8 775 26.4%
Fannin County 1,753 3,226 5.6 9.5 1,473 84.0%
Fayette County 2,786 4,585 12.8 18.7 1,799 64.6%
Fisher County 928 999 21.4 25.1 71 7.7%
Floyd County 3,569 3,410 45.9 52.9 -159 -4.5%
Foard County 265 187 16.3 14.0 -78 -29.4%
Fort Bend County 74,871 138,967 21.1 23.7 64,096 85.6%
Franklin County 842 1,333 8.9 12.6 491 58.3%
Freestone County 1,465 2,694 8.2 13.6 1,229 83.9%
Frio County 11,987 13,401 73.8 77.8 1,414 11.8%
Gaines County 5,175 6,413 35.8 36.6 1,238 23.9%
Galveston County 44,939 65,270 18.0 22.4 20,331 45.2%
Garza County 1,810 3,046 37.2 47.1 1,236 68.3%
Gillespie County 3,309 4,969 15.9 20.0 1,660 50.2%
Glasscock County 420 378 29.9 30.8 -42 -10.0%
Goliad County 2,439 2,462 35.2 34.1 23 0.9%
Gonzales County 7,381 9,353 39.6 47.2 1,972 26.7%
Gray County 2,959 5,365 13.0 23.8 2,406 81.3%
Grayson County 7,519 13,688 6.8 11.3 6,169 82.0%
Gregg County 10,183 20,018 9.1 16.4 9,835 96.6%
Grimes County 3,787 5,652 16.1 21.2 1,865 49.2%
Guadalupe County 29,561 46,889 33.2 35.6 17,328 58.6%
Hale County 17,532 20,269 47.9 55.9 2,737 15.6%
Hall County 1,040 1,087 27.5 32.4 47 4.5%
Hamilton County 610 863 7.4 10.1 253 41.5%
Hansford County 1,690 2,430 31.5 43.3 740 43.8%
Hardeman County 685 889 14.5 21.5 204 29.8%
Hardin County 1,223 2,384 2.5 4.4 1,161 94.9%
Harris County 1,119,751 1,671,540 32.9 40.8 551,789 49.3%
Harrison County 3,316 7,254 5.3 11.1 3,938 118.8%
Hartley County 758 1,448 13.7 23.9 690 91.0%
Haskell County 1,249 1,414 20.5 24.0 165 13.2%
Hays County 28,859 55,401 29.6 35.3 26,542 92.0%
Hemphill County 522 1,086 15.6 28.5 564 108.0%

21
Hispanic Percent Share for Texas by County, 2000 and 2010 (continued)
Total Hispanic Population Hispanic Share of State Total (%) Population Change, 2000 to 2010
Area 2000 2010 2000 2010 Numeric Change Percent Change
Henderson County 5,071 8,490 6.9 10.8 3,419 67.4%
Hidalgo County 503,100 702,206 88.3 90.6 199,106 39.6%
Hill County 4,360 6,427 13.5 18.3 2,067 47.4%
Hockley County 8,459 9,993 37.2 43.6 1,534 18.1%
Hood County 2,975 5,234 7.2 10.2 2,259 75.9%
Hopkins County 2,967 5,368 9.3 15.3 2,401 80.9%
Houston County 1,739 2,364 7.5 10.0 625 35.9%
Howard County 12,597 13,255 37.5 37.9 658 5.2%
Hudspeth County 2,509 2,768 75.0 79.6 259 10.3%
Hunt County 6,366 11,751 8.3 13.6 5,385 84.6%
Hutchinson County 3,506 4,386 14.7 19.8 880 25.1%
Irion County 436 407 24.6 25.5 -29 -6.7%
Jack County 691 1,283 7.9 14.2 592 85.7%
Jackson County 3,551 4,079 24.7 29.0 528 14.9%
Jasper County 1,384 2,017 3.9 5.6 633 45.7%
Jeff Davis County 783 790 35.5 33.7 7 0.9%
Jefferson County 26,536 42,899 10.5 17.0 16,363 61.7%
Jim Hogg County 4,752 4,907 90.0 92.6 155 3.3%
Jim Wells County 29,772 32,254 75.7 79.0 2,482 8.3%
Johnson County 15,375 27,319 12.1 18.1 11,944 77.7%
Jones County 4,346 5,009 20.9 24.8 663 15.3%
Karnes County 7,324 7,376 47.4 49.8 52 0.7%
Kaufman County 7,925 17,548 11.1 17.0 9,623 121.4%
Kendall County 4,248 6,829 17.9 20.4 2,581 60.8%
Kenedy County 327 319 79.0 76.7 -8 -2.4%
Kent County 78 120 9.1 14.9 42 53.8%
Kerr County 8,353 11,895 19.1 24.0 3,542 42.4%
Kimble County 926 1,077 20.7 23.4 151 16.3%
King County 34 39 9.6 13.6 5 14.7%
Kinney County 1,707 2,004 50.5 55.7 297 17.4%
Kleberg County 20,635 22,495 65.4 70.2 1,860 9.0%
Knox County 1,067 1,101 25.1 29.6 34 3.2%
Lamar County 1,614 3,223 3.3 6.5 1,609 99.7%
Lamb County 6,393 7,231 43.5 51.7 838 13.1%
Lampasas County 2,677 3,443 15.1 17.5 766 28.6%
La Salle County 4,524 5,920 77.1 86.0 1,396 30.9%

22
Hispanic Percent Share for Texas by County, 2000 and 2010 (continued)
Total Hispanic Population Hispanic Share of State Total (%) Population Change, 2000 to 2010
Area 2000 2010 2000 2010 Numeric Change Percent Change
Lavaca County 2,183 3,077 11.4 16.0 894 41.0%
Lee County 2,848 3,724 18.2 22.4 876 30.8%
Leon County 1,213 2,260 7.9 13.5 1,047 86.3%
Liberty County 7,660 13,602 10.9 18.0 5,942 77.6%
Limestone County 2,859 4,465 13.0 19.1 1,606 56.2%
Lipscomb County 633 1,007 20.7 30.5 374 59.1%
Live Oak County 4,683 4,060 38.0 35.2 -623 -13.3%
Llano County 875 1,542 5.1 8.0 667 76.2%
Loving County 7 18 10.4 22.0 11 157.1%
Lubbock County 66,609 88,924 27.5 31.9 22,315 33.5%
Lynn County 2,923 2,743 44.6 46.4 -180 -6.2%
McCulloch County 2,219 2,476 27.0 29.9 257 11.6%
McLennan County 38,233 55,471 17.9 23.6 17,238 45.1%
McMullen County 282 261 33.1 36.9 -21 -7.4%
Madison County 2,042 2,688 15.8 19.7 646 31.6%
Marion County 263 328 2.4 3.1 65 24.7%
Martin County 1,925 2,086 40.6 43.5 161 8.4%
Mason County 783 864 20.9 21.5 81 10.3%
Matagorda County 11,898 14,074 31.3 38.3 2,176 18.3%
Maverick County 44,938 51,914 95.0 95.7 6,976 15.5%
Medina County 17,873 22,871 45.5 49.7 4,998 28.0%
Menard County 748 790 31.7 35.2 42 5.6%
Midland County 33,676 51,600 29.0 37.7 17,924 53.2%
Milam County 4,516 5,780 18.6 23.3 1,264 28.0%
Mills County 671 818 13.0 16.6 147 21.9%
Mitchell County 3,009 3,481 31.0 37.0 472 15.7%
Montague County 1,035 1,930 5.4 9.8 895 86.5%
Montgomery County 37,150 94,698 12.6 20.8 57,548 154.9%
Moore County 9,558 11,542 47.5 52.7 1,984 20.8%
Morris County 477 1,003 3.7 7.8 526 110.3%
Motley County 173 163 12.1 13.5 -10 -5.8%
Nacogdoches County 6,660 11,356 11.2 17.6 4,696 70.5%
Navarro County 7,113 11,345 15.8 23.8 4,232 59.5%
Newton County 571 403 3.8 2.8 -168 -29.4%
Nolan County 4,431 5,103 28.0 33.5 672 15.2%
Nueces County 174,951 206,293 55.8 60.6 31,342 17.9%

23
Hispanic Percent Share for Texas by County, 2000 and 2010 (continued)
Total Hispanic Population Hispanic Share of State Total (%) Population Change, 2000 to 2010
Area 2000 2010 2000 2010 Numeric Change Percent Change
Ochiltree County 2,863 4,982 31.8 48.7 2,119 74.0%
Oldham County 241 243 11.0 11.8 2 0.8%
Orange County 3,073 4,766 3.6 5.8 1,693 55.1%
Palo Pinto County 3,667 4,985 13.6 17.7 1,318 35.9%
Panola County 798 1,970 3.5 8.3 1,172 146.9%
Parker County 6,211 12,410 7.0 10.6 6,199 99.8%
Parmer County 4,927 6,164 49.2 60.0 1,237 25.1%
Pecos County 10,262 10,430 61.1 67.3 168 1.6%
Polk County 3,861 5,959 9.4 13.1 2,098 54.3%
Potter County 31,921 42,692 28.1 35.3 10,771 33.7%
Presidio County 6,162 6,521 84.4 83.4 359 5.8%
Rains County 505 839 5.5 7.7 334 66.1%
Randall County 10,718 19,775 10.3 16.4 9,057 84.5%
Reagan County 1,646 2,051 49.5 60.9 405 24.6%
Real County 688 814 22.6 24.6 126 18.3%
Red River County 669 849 4.7 6.6 180 26.9%
Reeves County 9,640 10,233 73.4 74.2 593 6.2%
Refugio County 3,490 3,487 44.6 47.2 -3 -0.1%
Roberts County 28 74 3.2 8.0 46 164.3%
Robertson County 2,359 2,990 14.7 18.0 631 26.7%
Rockwall County 4,771 12,470 11.1 15.9 7,699 161.4%
Runnels County 3,372 3,361 29.3 32.0 -11 -0.3%
Rusk County 3,998 7,609 8.4 14.3 3,611 90.3%
Sabine County 189 344 1.8 3.2 155 82.0%
San Augustine County 320 532 3.6 6.0 212 66.3%
San Jacinto County 1,084 2,880 4.9 10.9 1,796 165.7%
San Patricio County 33,181 35,248 49.4 54.4 2,067 6.2%
San Saba County 1,333 1,715 21.5 28.0 382 28.7%
Schleicher County 1,278 1,536 43.5 44.4 258 20.2%
Scurry County 4,544 6,149 27.8 36.3 1,605 35.3%
Shackelford County 251 340 7.6 10.1 89 35.5%
Shelby County 2,489 4,164 9.9 16.4 1,675 67.3%
Sherman County 874 1,227 27.4 40.4 353 40.4%
Smith County 19,521 36,088 11.2 17.2 16,567 84.9%
Somervell County 915 1,626 13.4 19.2 711 77.7%
Starr County 52,278 58,337 97.5 95.7 6,059 11.6%

24
Hispanic Percent Share for Texas by County, 2000 and 2010 (continued)
Total Hispanic Population Hispanic Share of State Total (%) Population Change, 2000 to 2010
Area 2000 2010 2000 2010 Numeric Change Percent Change
Stephens County 1,418 2,011 14.7 20.9 593 41.8%
Sterling County 432 365 31.0 31.9 -67 -15.5%
Stonewall County 199 209 11.8 14.0 10 5.0%
Sutton County 2,106 2,459 51.7 59.6 353 16.8%
Swisher County 2,951 3,149 35.2 40.1 198 6.7%
Tarrant County 285,290 482,977 19.7 26.7 197,687 69.3%
Taylor County 22,328 29,074 17.6 22.1 6,746 30.2%
Terrell County 525 467 48.6 47.5 -58 -11.0%
Terry County 5,626 6,211 44.1 49.1 585 10.4%
Throckmorton County 173 152 9.4 9.3 -21 -12.1%
Titus County 7,960 12,799 28.3 39.6 4,839 60.8%
Tom Green County 31,946 39,315 30.7 35.7 7,369 23.1%
Travis County 229,048 342,766 28.2 33.5 113,718 49.6%
Trinity County 668 1,117 4.8 7.7 449 67.2%
Tyler County 742 1,487 3.6 6.8 745 100.4%
Upshur County 1,394 2,613 4.0 6.6 1,219 87.4%
Upton County 1,449 1,644 42.6 49.0 195 13.5%
Uvalde County 17,089 18,299 65.9 69.3 1,210 7.1%
Val Verde County 33,849 39,199 75.5 80.2 5,350 15.8%
Van Zandt County 3,201 4,847 6.6 9.2 1,646 51.4%
Victoria County 32,959 38,113 39.2 43.9 5,154 15.6%
Walker County 8,712 11,389 14.1 16.8 2,677 30.7%
Waller County 6,344 12,536 19.4 29.0 6,192 97.6%
Ward County 4,580 5,074 42.0 47.6 494 10.8%
Washington County 2,647 4,641 8.7 13.8 1,994 75.3%
Webb County 182,070 239,653 94.3 95.7 57,583 31.6%
Wharton County 12,888 15,445 31.3 37.4 2,557 19.8%
Wheeler County 664 1,344 12.6 24.8 680 102.4%
Wichita County 16,097 21,859 12.2 16.6 5,762 35.8%
Wilbarger County 3,015 3,508 20.5 25.9 493 16.4%
Willacy County 17,209 19,297 85.7 87.2 2,088 12.1%
Williamson County 42,990 98,034 17.2 23.2 55,044 128.0%
Wilson County 11,834 16,412 36.5 38.2 4,578 38.7%
Winkler County 3,156 3,824 44.0 53.8 668 21.2%
Wise County 5,248 10,112 10.8 17.1 4,864 92.7%
Wood County 2,102 3,551 5.7 8.5 1,449 68.9%

25
Hispanic Percent Share for Texas by County, 2000 and 2010 (continued)
Total Hispanic Population Hispanic Share of State Total (%) Population Change, 2000 to 2010
Area 2000 2010 2000 2010 Numeric Change Percent Change
Yoakum County 3,363 4,622 45.9 58.7 1,259 37.4%
Young County 1,906 3,045 10.6 16.4 1,139 59.8%
Zapata County 10,328 13,084 84.8 93.3 2,756 26.7%
Zavala County 10,582 10,961 91.2 93.9 379 3.6%
Source: U.S. Census Bureau, Census 2010 Summary File 1

26
Table 7
Texas State Population, 2000 and 2010
Area Total Population, 2010 Total Population, 2000 Population Change, 2000 to 2010
Numeric Change Percent Change
Texas State 25,145,561 20,851,820 4,293,741 20.6%
Anderson County 58,458 55,109 3,349 6.1%
Andrews County 14,786 13,004 1,782 13.7%
Angelina County 86,771 80,130 6,641 8.3%
Aransas County 23,158 22,497 661 2.9%
Archer County 9,054 8,854 200 2.3%
Armstrong County 1,901 2,148 -247 -11.5%
Atascosa County 44,911 38,628 6,283 16.3%
Austin County 28,417 23,590 4,827 20.5%
Bailey County 7,165 6,594 571 8.7%
Bandera County 20,485 17,645 2,840 16.1%
Bastrop County 74,171 57,733 16,438 28.5%
Baylor County 3,726 4,093 -367 -9.0%
Bee County 31,861 32,359 -498 -1.5%
Bell County 310,235 237,974 72,261 30.4%
Bexar County 1,714,773 1,392,931 321,842 23.1%
Blanco County 10,497 8,418 2,079 24.7%
Borden County 641 729 -88 -12.1%
Bosque County 18,212 17,204 1,008 5.9%
Bowie County 92,565 89,306 3,259 3.6%
Brazoria County 313,166 241,767 71,399 29.5%
Brazos County 194,851 152,415 42,436 27.8%
Brewster County 9,232 8,866 366 4.1%
Briscoe County 1,637 1,790 -153 -8.5%
Brooks County 7,223 7,976 -753 -9.4%
Brown County 38,106 37,674 432 1.1%
Burleson County 17,187 16,470 717 4.4%
Burnet County 42,750 34,147 8,603 25.2%
Caldwell County 38,066 32,194 5,872 18.2%
Calhoun County 21,381 20,647 734 3.6%
Callahan County 13,544 12,905 639 5.0%
Cameron County 406,220 335,227 70,993 21.2%
Camp County 12,401 11,549 852 7.4%
Carson County 6,182 6,516 -334 -5.1%
Cass County 30,464 30,438 26 0.1%

27
Texas State Population, 2000 and 2010 (continued)
Area Total Population, 2010 Total Population, 2000 Population Change, 2000 to 2010
Numeric Change Percent Change
Castro County 8,062 8,285 -223 -2.7%
Chambers County 35,096 26,031 9,065 34.8%
Cherokee County 50,845 46,659 4,186 9.0%
Childress County 7,041 7,688 -647 -8.4%
Clay County 10,752 11,006 -254 -2.3%
Cochran County 3,127 3,730 -603 -16.2%
Coke County 3,320 3,864 -544 -14.1%
Coleman County 8,895 9,235 -340 -3.7%
Collin County 782,341 491,675 290,666 59.1%
Collingsworth County 3,057 3,206 -149 -4.6%
Colorado County 20,874 20,390 484 2.4%
Comal County 108,472 78,021 30,451 39.0%
Comanche County 13,974 14,026 -52 -0.4%
Concho County 4,087 3,966 121 3.1%
Cooke County 38,437 36,363 2,074 5.7%
Coryell County 75,388 74,978 410 0.5%
Cottle County 1,505 1,904 -399 -21.0%
Crane County 4,375 3,996 379 9.5%
Crockett County 3,719 4,099 -380 -9.3%
Crosby County 6,059 7,072 -1,013 -14.3%
Culberson County 2,398 2,975 -577 -19.4%
Dallam County 6,703 6,222 481 7.7%
Dallas County 2,368,139 2,218,899 149,240 6.7%
Dawson County 13,833 14,985 -1,152 -7.7%
Deaf Smith County 19,372 18,561 811 4.4%
Delta County 5,231 5,327 -96 -1.8%
Denton County 662,614 432,976 229,638 53.0%
DeWitt County 20,097 20,013 84 0.4%
Dickens County 2,444 2,762 -318 -11.5%
Dimmit County 9,996 10,248 -252 -2.5%
Donley County 3,677 3,828 -151 -3.9%
Duval County 11,782 13,120 -1,338 -10.2%
Eastland County 18,583 18,297 286 1.6%
Ector County 137,130 121,123 16,007 13.2%
Edwards County 2,002 2,162 -160 -7.4%
Ellis County 149,610 111,360 38,250 34.3%

28
Texas State Population, 2000 and 2010 (continued)
Area Total Population, 2010 Total Population, 2000 Population Change, 2000 to 2010
Numeric Change Percent Change
El Paso County 800,647 679,622 121,025 17.8%
Erath County 37,890 33,001 4,889 14.8%
Falls County 17,866 18,576 -710 -3.8%
Fannin County 33,915 31,242 2,673 8.6%
Fayette County 24,554 21,804 2,750 12.6%
Fisher County 3,974 4,344 -370 -8.5%
Floyd County 6,446 7,771 -1,325 -17.1%
Foard County 1,336 1,622 -286 -17.6%
Fort Bend County 585,375 354,452 230,923 65.1%
Franklin County 10,605 9,458 1,147 12.1%
Freestone County 19,816 17,867 1,949 10.9%
Frio County 17,217 16,252 965 5.9%
Gaines County 17,526 14,467 3,059 21.1%
Galveston County 291,309 250,158 41,151 16.5%
Garza County 6,461 4,872 1,589 32.6%
Gillespie County 24,837 20,814 4,023 19.3%
Glasscock County 1,226 1,406 -180 -12.8%
Goliad County 7,210 6,928 282 4.1%
Gonzales County 19,807 18,628 1,179 6.3%
Gray County 22,535 22,744 -209 -0.9%
Grayson County 120,877 110,595 10,282 9.3%
Gregg County 121,730 111,379 10,351 9.3%
Grimes County 26,604 23,552 3,052 13.0%
Guadalupe County 131,533 89,023 42,510 47.8%
Hale County 36,273 36,602 -329 -0.9%
Hall County 3,353 3,782 -429 -11.3%
Hamilton County 8,517 8,229 288 3.5%
Hansford County 5,613 5,369 244 4.5%
Hardeman County 4,139 4,724 -585 -12.4%
Hardin County 54,635 48,073 6,562 13.7%
Harris County 4,092,459 3,400,578 691,881 20.3%
Harrison County 65,631 62,110 3,521 5.7%
Hartley County 6,062 5,537 525 9.5%
Haskell County 5,899 6,093 -194 -3.2%
Hays County 157,107 97,589 59,518 61.0%
Hemphill County 3,807 3,351 456 13.6%

29
Texas State Population, 2000 and 2010 (continued)
Area Total Population, 2010 Total Population, 2000 Population Change, 2000 to 2010
Numeric Change Percent Change
Henderson County 78,532 73,277 5,255 7.2%
Hidalgo County 774,769 569,463 205,306 36.1%
Hill County 35,089 32,321 2,768 8.6%
Hockley County 22,935 22,716 219 1.0%
Hood County 51,182 41,100 10,082 24.5%
Hopkins County 35,161 31,960 3,201 10.0%
Houston County 23,732 23,185 547 2.4%
Howard County 35,012 33,627 1,385 4.1%
Hudspeth County 3,476 3,344 132 3.9%
Hunt County 86,129 76,596 9,533 12.4%
Hutchinson County 22,150 23,857 -1,707 -7.2%
Irion County 1,599 1,771 -172 -9.7%
Jack County 9,044 8,763 281 3.2%
Jackson County 14,075 14,391 -316 -2.2%
Jasper County 35,710 35,604 106 0.3%
Jeff Davis County 2,342 2,207 135 6.1%
Jefferson County 252,273 252,051 222 0.1%
Jim Hogg County 5,300 5,281 19 0.4%
Jim Wells County 40,838 39,326 1,512 3.8%
Johnson County 150,934 126,811 24,123 19.0%
Jones County 20,202 20,785 -583 -2.8%
Karnes County 14,824 15,446 -622 -4.0%
Kaufman County 103,350 71,313 32,037 44.9%
Kendall County 33,410 23,743 9,667 40.7%
Kenedy County 416 414 2 0.5%
Kent County 808 859 -51 -5.9%
Kerr County 49,625 43,653 5,972 13.7%
Kimble County 4,607 4,468 139 3.1%
King County 286 356 -70 -19.7%
Kinney County 3,598 3,379 219 6.5%
Kleberg County 32,061 31,549 512 1.6%
Knox County 3,719 4,253 -534 -12.6%
Lamar County 49,793 48,499 1,294 2.7%
Lamb County 13,977 14,709 -732 -5.0%
Lampasas County 19,677 17,762 1,915 10.8%
La Salle County 6,886 5,866 1,020 17.4%

30
Texas State Population, 2000 and 2010 (continued)
Area Total Population, 2010 Total Population, 2000 Population Change, 2000 to 2010
Numeric Change Percent Change
Lavaca County 19,263 19,210 53 0.3%
Lee County 16,612 15,657 955 6.1%
Leon County 16,801 15,335 1,466 9.6%
Liberty County 75,643 70,154 5,489 7.8%
Limestone County 23,384 22,051 1,333 6.0%
Lipscomb County 3,302 3,057 245 8.0%
Live Oak County 11,531 12,309 -778 -6.3%
Llano County 19,301 17,044 2,257 13.2%
Loving County 82 67 15 22.4%
Lubbock County 278,831 242,628 36,203 14.9%
Lynn County 5,915 6,550 -635 -9.7%
McCulloch County 8,283 8,205 78 1.0%
McLennan County 234,906 213,517 21,389 10.0%
McMullen County 707 851 -144 -16.9%
Madison County 13,664 12,940 724 5.6%
Marion County 10,546 10,941 -395 -3.6%
Martin County 4,799 4,746 53 1.1%
Mason County 4,012 3,738 274 7.3%
Matagorda County 36,702 37,957 -1,255 -3.3%
Maverick County 54,258 47,297 6,961 14.7%
Medina County 46,006 39,304 6,702 17.1%
Menard County 2,242 2,360 -118 -5.0%
Midland County 136,872 116,009 20,863 18.0%
Milam County 24,757 24,238 519 2.1%
Mills County 4,936 5,151 -215 -4.2%
Mitchell County 9,403 9,698 -295 -3.0%
Montague County 19,719 19,117 602 3.1%
Montgomery County 455,746 293,768 161,978 55.1%
Moore County 21,904 20,121 1,783 8.9%
Morris County 12,934 13,048 -114 -0.9%
Motley County 1,210 1,426 -216 -15.1%
Nacogdoches County 64,524 59,203 5,321 9.0%
Navarro County 47,735 45,124 2,611 5.8%
Newton County 14,445 15,072 -627 -4.2%
Nolan County 15,216 15,802 -586 -3.7%
Nueces County 340,223 313,645 26,578 8.5%

31
Texas State Population, 2000 and 2010 (continued)
Area Total Population, 2010 Total Population, 2000 Population Change, 2000 to 2010
Numeric Change Percent Change
Ochiltree County 10,223 9,006 1,217 13.5%
Oldham County 2,052 2,185 -133 -6.1%
Orange County 81,837 84,966 -3,129 -3.7%
Palo Pinto County 28,111 27,026 1,085 4.0%
Panola County 23,796 22,756 1,040 4.6%
Parker County 116,927 88,495 28,432 32.1%
Parmer County 10,269 10,016 253 2.5%
Pecos County 15,507 16,809 -1,302 -7.7%
Polk County 45,413 41,133 4,280 10.4%
Potter County 121,073 113,546 7,527 6.6%
Presidio County 7,818 7,304 514 7.0%
Rains County 10,914 9,139 1,775 19.4%
Randall County 120,725 104,312 16,413 15.7%
Reagan County 3,367 3,326 41 1.2%
Real County 3,309 3,047 262 8.6%
Red River County 12,860 14,314 -1,454 -10.2%
Reeves County 13,783 13,137 646 4.9%
Refugio County 7,383 7,828 -445 -5.7%
Roberts County 929 887 42 4.7%
Robertson County 16,622 16,000 622 3.9%
Rockwall County 78,337 43,080 35,257 81.8%
Runnels County 10,501 11,495 -994 -8.6%
Rusk County 53,330 47,372 5,958 12.6%
Sabine County 10,834 10,469 365 3.5%
San Augustine County 8,865 8,946 -81 -0.9%
San Jacinto County 26,384 22,246 4,138 18.6%
San Patricio County 64,804 67,138 -2,334 -3.5%
San Saba County 6,131 6,186 -55 -0.9%
Schleicher County 3,461 2,935 526 17.9%
Scurry County 16,921 16,361 560 3.4%
Shackelford County 3,378 3,302 76 2.3%
Shelby County 25,448 25,224 224 0.9%
Sherman County 3,034 3,186 -152 -4.8%
Smith County 209,714 174,706 35,008 20.0%
Somervell County 8,490 6,809 1,681 24.7%
Starr County 60,968 53,597 7,371 13.8%

32
Texas State Population, 2000 and 2010 (continued)
Area Total Population, 2010 Total Population, 2000 Population Change, 2000 to 2010
Numeric Change Percent Change
Stephens County 9,630 9,674 -44 -0.5%
Sterling County 1,143 1,393 -250 -17.9%
Stonewall County 1,490 1,693 -203 -12.0%
Sutton County 4,128 4,077 51 1.3%
Swisher County 7,854 8,378 -524 -6.3%
Tarrant County 1,809,034 1,446,219 362,815 25.1%
Taylor County 131,506 126,555 4,951 3.9%
Terrell County 984 1,081 -97 -9.0%
Terry County 12,651 12,761 -110 -0.9%
Throckmorton County 1,641 1,850 -209 -11.3%
Titus County 32,334 28,118 4,216 15.0%
Tom Green County 110,224 104,010 6,214 6.0%
Travis County 1,024,266 812,280 211,986 26.1%
Trinity County 14,585 13,779 806 5.8%
Tyler County 21,766 20,871 895 4.3%
Upshur County 39,309 35,291 4,018 11.4%
Upton County 3,355 3,404 -49 -1.4%
Uvalde County 26,405 25,926 479 1.8%
Val Verde County 48,879 44,856 4,023 9.0%
Van Zandt County 52,579 48,140 4,439 9.2%
Victoria County 86,793 84,088 2,705 3.2%
Walker County 67,861 61,758 6,103 9.9%
Waller County 43,205 32,663 10,542 32.3%
Ward County 10,658 10,909 -251 -2.3%
Washington County 33,718 30,373 3,345 11.0%
Webb County 250,304 193,117 57,187 29.6%
Wharton County 41,280 41,188 92 0.2%
Wheeler County 5,410 5,284 126 2.4%
Wichita County 131,500 131,664 -164 -0.1%
Wilbarger County 13,535 14,676 -1,141 -7.8%
Willacy County 22,134 20,082 2,052 10.2%
Williamson County 422,679 249,967 172,712 69.1%
Wilson County 42,918 32,408 10,510 32.4%
Winkler County 7,110 7,173 -63 -0.9%
Wise County 59,127 48,793 10,334 21.2%
Wood County 41,964 36,752 5,212 14.2%

33
Texas State Population, 2000 and 2010 (continued)
Area Total Population, 2010 Total Population, 2000 Population Change, 2000 to 2010
Numeric Change Percent Change
Yoakum County 7,879 7,322 557 7.6%
Young County 18,550 17,943 607 3.4%
Zapata County 14,018 12,182 1,836 15.1%
Zavala County 11,677 11,600 77 0.7%
Source: U.S. Census Bureau, Census 2010 Summary File 1

34
Table 8
Total Population by Age Group for Texas, 2000 and 2010
2000 2010
Age Group Male Female Total Male Female Total
0 to 4 830,745 793,883 1,624,628 984,149 944,324 1,928,473
5 to 9 844,959 809,225 1,654,184 983,814 944,420 1,928,234
10 to 14 834,526 796,666 1,631,192 962,866 919,017 1,881,883
15 to 19 847,462 788,770 1,636,232 968,686 914,438 1,883,124
20 to 24 794,799 744,605 1,539,404 932,353 884,726 1,817,079
25 to 29 810,965 780,557 1,591,522 938,966 914,073 1,853,039
30 to 34 798,051 772,510 1,570,561 882,887 877,547 1,760,434
35 to 39 849,270 839,613 1,688,883 876,139 887,448 1,763,587
40 to 44 819,334 814,021 1,633,355 846,865 847,930 1,694,795
45 to 49 702,056 714,122 1,416,178 874,863 885,604 1,760,467
50 to 54 587,762 607,197 1,194,959 827,933 846,936 1,674,869
55 to 59 436,105 460,416 896,521 691,275 731,649 1,422,924
60 to 64 334,695 366,974 701,669 565,820 608,947 1,174,767
65 to 69 283,517 326,915 610,432 403,269 449,831 853,100
70 to 74 234,965 297,211 532,176 283,865 335,291 619,156
75 to 79 175,337 248,697 424,034 208,530 268,715 477,245
80 to 84 100,142 167,808 267,950 139,029 208,177 347,206
85 or older 68,220 169720 237,940 100,971 204,208 305,179
Total 10,352,910 10,498,910 20,851,820 12,472,280 12,673,281 25,145,561
Source: U.S. Census Bureau, Census 2000 Summary File 1; U.S. Census Bureau, Census 2010 Summary File 1.

35
Table 9
Hispanic Population by State, 2000 and 2010
Hispanic Population
(thousands) Hispanic Share (%)
Numeric Change
(thousands) Percent Change
2010 Rank 2000 2010 Rank 2000 2000-2010 2000-2010 Rank
United States 50,478
35,306 16.3
12.5 15,172 43.0%
Alabama 186 33 76 3.9 40 1.7 110 144.7% 2
Alaska 39 44 26 5.5 33 4.1 13 50.0% 37
Arizona 1,895 6 1,296 29.6 4 25.3 599 46.2% 40
Arkansas 186 32 87 6.4 29 3.2 99 113.8% 5
California 14,014 1 10,967 37.6 3 32.4 3,047 27.8% 48
Colorado 1,039 8 736 20.7 7 17.1 303 41.2% 43
Connecticut 479 17 320 13.4 11 9.4 159 49.7% 38
Delaware 73 41 37 8.2 26 4.8 36 97.3% 10
District of Columbia 55 42 45 9.1 20 7.9 10 22.2% 50
Florida 4,224 3 2,683 22.5 6 16.8 1,541 57.4% 36
Georgia 854 10 435 8.8 24 5.3 419 96.3% 11
Hawaii 121 39 88 8.9 22 7.2 33 37.5% 45
Idaho 176 34 102 11.2 16 7.9 74 72.5% 27
Illinois 2,028 5 1,530 15.8 10 12.3 498 32.5% 47
Indiana 390 21 215 6 30 3.5 175 81.4% 17
Iowa 152 36 82 5 35 2.8 70 85.4% 14
Kansas 300 26 188 10.5 17 7 112 59.6% 33
Kentucky 133 37 60 3.1 43 1.5 73 121.7% 4
Louisiana 193 31 108 4.2 39 2.4 85 78.7% 22
Maine 17 49 9 1.3 50 0.7 8 88.9% 19
Maryland 471 18 228 8.2 27 4.3 243 106.6% 7
Massachusetts 628 16 429 9.6 18 6.8 199 46.4% 39
Michigan 436 20 324 4.4 38 3.3 112 34.6% 46
Minnesota 250 28 143 4.7 36 2.9 107 74.8% 25
Mississippi 81 40 40 2.7 46 1.4 41 102.5% 8
Missouri 212 30 119 3.5 41 2.1 93 78.2% 20
Montana 29 46 18 2.9 44 2 11 61.1% 35
Nebraska 167 35 94 9.2 19 5.5 73 77.7% 24
Nevada 717 14 394 26.5 5 19.7 323 82.0% 16
New Hampshire 37 45 20 2.8 45 1.7 17 85.0% 21
New Jersey 1,555 7 1,117 17.7 8 13.3 438 39.2% 44
New Mexico 953 9 765 46.3 1 42.1 188 24.6% 49
New York 3,417 4 2,868 17.6 9 15.1 549 19.1% 51

36
Hispanic Population by State, 2000 and 2010 (continued)
Hispanic Population
(thousands) Hispanic Share (%)
Numeric Change
(thousands) Percent Change
2010 Rank 2000 2010 Rank 2000 2000-2010 2000-2010 Rank
North Carolina 800 11 379 8.4 25 4.7 421 111.1% 6
North Dakota 13 50 8 2 48 1.2 5 62.5% 28
Ohio 355 23 217 3.1 42 1.9 138 63.6% 32
Oklahoma 332 25 179 8.9 23 5.2 153 85.5% 13
Oregon 450 19 275 11.7 14 8 175 63.6% 31
Pennsylvania 720 13 394 5.7 32 3.2 326 82.7% 15
Rhode Island 131 38 91 12.4 13 8.7 40 44.0% 41
South Carolina 236 29 95 5.1 34 2.4 141 148.4% 1
South Dakota 22 48 11 2.7 47 1.4 11 100.0% 9
Tennessee 290 27 124 4.6 37 2.2 166 133.9% 3
Texas 9,461 2 6,670 37.6 2 32 2,791 41.8% 42
Utah 358 22 202 13 12 9 156 77.2% 23
Vermont 9 51 6 1.5 49 0.9 3 50.0% 30
Virginia 632 15 330 7.9 28 4.7 302 91.5% 12
Washington 756 12 442 11.2 15 7.5 314 71.0% 29
West Virginia 22 47 12 1.2 51 0.7 10 83.3% 18
Wisconsin 336 24 193 5.9 31 3.6 143 74.1% 26
Wyoming 50 43 32 8.9 21 6.4 18 56.3% 34
Source: U.S. Census Bureau, Census 2000 Summary File 1; U.S. Census Bureau, Census 2010 Summary File 1.

37
SABÉR Research Institute
200 East Grayson Street, Suite 203
San Antonio, Texas 78215
One Camino Santa Maria
San Antonio, Texas 78228
(210) 208-8212
www.saberinstitute.org