A comparison of label-based review and ALE … Comparison of Label-Based Review and ALE...
16
A Comparison of Label-Based Review and ALE Meta-Analysis in the Stroop Task Angela R. Laird, 1 * Kathryn M. McMillan, 2 Jack L. Lancaster, 1 Peter Kochunov, 1 Peter E. Turkeltaub, 3 Jose V. Pardo, 4 and Peter T. Fox 1 1 Research Imaging Center, University of Texas Health Science Center, San Antonio, Texas 2 Department of Medical Physics, University of Wisconsin, Madison, Wisconsin 3 Center for the Study of Learning, Georgetown University Medical Center, Washington, DC 4 Cognitive Neuroimaging Unit, Psychiatry Service, Minneapolis Veterans Affairs Medical Center, Minneapolis, Minnesota Abstract: Meta-analysis is an important tool for interpreting results of functional neuroimaging studies and is highly influential in predicting and testing new outcomes. Although traditional label-based review can be used to search for agreement across multiple studies, a new function- location meta-analysis technique called activation likelihood estimation (ALE) offers great improve- ments over conventional methods. In ALE, reported foci are modeled as Gaussian functions and pooled to create a statistical whole-brain image. ALE meta-analysis and the label-based review were used to investigate the Stroop task in normal subjects, a paradigm known for its effect of producing conflict and response inhibition due to subjects’ tendency to perform word reading as opposed to color naming. Both methods yielded similar activation patterns that were dominated by response in the anterior cingulate and the inferior frontal gyrus. ALE showed greater involvement of the anterior cingulate as compared to that in the label-based technique; however, this was likely due to the increased spatial level of distinction allowed with the ALE method. With ALE, further analysis of the anterior cingulate revealed evidence for somatotopic mapping within the rostral and caudal cingulate zones, an issue that has been the source of some conflict in previous reviews of the anterior cingulate cortex. Hum Brain Mapp 25:6 –21, 2005. © 2005 Wiley-Liss, Inc. Key words: Stroop task; meta-analysis; activation likelihood estimation; ALE; BrainMap; anterior cingu- late; ACC INTRODUCTION Meta-analysis, the post-hoc combination of results from independent studies to estimate better a parameter of inter- est, is a tool that has been utilized for decades in many medical fields [Conn, 1997; Mosteller and Colditz, 1996; Petitti, 1997]. As opposed to narrative reviews, meta-analy- sis is a formal, statistical integration in which studies are collected, coded, and interpreted in an analytical and unbi- ased manner. In human functional brain mapping, authors have widely adopted the practice of reporting the brain locations of task-induced activations as 3D (x, y, z) coordi- nates in stereotactic space. Due to this standard, meta-anal- ysis is emerging as a tool for identifying reliable patterns of Contract grant sponsor: National Library of Medicine; Contract grant number: RO1-LM6858. *Correspondence to: Angela R. Laird, Research Imaging Center, University of Texas Health Science Center San Antonio, 7703 Floyd Curl Drive, San Antonio, TX 78229-3900. E-mail: [email protected] Received for publication 11 November 2004; Accepted 1 February 2005 DOI: 10.1002/hbm.20129 Published online in Wiley InterScience (www.interscience.wiley. com). Human Brain Mapping 25:6 –21(2005) © 2005 Wiley-Liss, Inc.
Transcript of A comparison of label-based review and ALE … Comparison of Label-Based Review and ALE...

A Comparison of Label-Based Review andALE Meta-Analysis in the Stroop Task
Angela R. Laird,1* Kathryn M. McMillan,2 Jack L. Lancaster,1
Peter Kochunov,1 Peter E. Turkeltaub,3 Jose V. Pardo,4 and Peter T. Fox1
1Research Imaging Center, University of Texas Health Science Center, San Antonio, Texas2Department of Medical Physics, University of Wisconsin, Madison, Wisconsin
3Center for the Study of Learning, Georgetown University Medical Center, Washington, DC4Cognitive Neuroimaging Unit, Psychiatry Service, Minneapolis Veterans Affairs Medical Center,
Minneapolis, Minnesota
! !
Abstract: Meta-analysis is an important tool for interpreting results of functional neuroimagingstudies and is highly influential in predicting and testing new outcomes. Although traditionallabel-based review can be used to search for agreement across multiple studies, a new function-location meta-analysis technique called activation likelihood estimation (ALE) offers great improve-ments over conventional methods. In ALE, reported foci are modeled as Gaussian functions andpooled to create a statistical whole-brain image. ALE meta-analysis and the label-based review wereused to investigate the Stroop task in normal subjects, a paradigm known for its effect of producingconflict and response inhibition due to subjects’ tendency to perform word reading as opposed tocolor naming. Both methods yielded similar activation patterns that were dominated by response inthe anterior cingulate and the inferior frontal gyrus. ALE showed greater involvement of the anteriorcingulate as compared to that in the label-based technique; however, this was likely due to theincreased spatial level of distinction allowed with the ALE method. With ALE, further analysis of theanterior cingulate revealed evidence for somatotopic mapping within the rostral and caudal cingulatezones, an issue that has been the source of some conflict in previous reviews of the anterior cingulatecortex. Hum Brain Mapp 25:6 –21, 2005. © 2005 Wiley-Liss, Inc.
Key words: Stroop task; meta-analysis; activation likelihood estimation; ALE; BrainMap; anterior cingu-late; ACC
! !
INTRODUCTION
Meta-analysis, the post-hoc combination of results fromindependent studies to estimate better a parameter of inter-est, is a tool that has been utilized for decades in manymedical fields [Conn, 1997; Mosteller and Colditz, 1996;Petitti, 1997]. As opposed to narrative reviews, meta-analy-sis is a formal, statistical integration in which studies arecollected, coded, and interpreted in an analytical and unbi-ased manner. In human functional brain mapping, authorshave widely adopted the practice of reporting the brainlocations of task-induced activations as 3D (x, y, z) coordi-nates in stereotactic space. Due to this standard, meta-anal-ysis is emerging as a tool for identifying reliable patterns of
Contract grant sponsor: National Library of Medicine; Contractgrant number: RO1-LM6858.*Correspondence to: Angela R. Laird, Research Imaging Center,University of Texas Health Science Center San Antonio, 7703 FloydCurl Drive, San Antonio, TX 78229-3900. E-mail: [email protected] for publication 11 November 2004; Accepted 1 February2005DOI: 10.1002/hbm.20129Published online in Wiley InterScience (www.interscience.wiley.com).
! Human Brain Mapping 25:6–21(2005) !
© 2005 Wiley-Liss, Inc.

activation wherein effects from multiple studies are com-bined to assess concordance and guide interpretation [Fox etal., 1998]. Traditional meta-analyses merge nonsignificantresults to test for significance in pooled data. In contrast, anew category of meta-analysis exists in human brain map-ping, termed function-location meta-analysis, whichsearches for locations of functional agreement among statis-tically significant effects. The primary goal of function-loca-tion meta-analysis is to determine consistent activity withinthe literature for certain paradigm classes or behavioraldomains. Although the main objective is synthesizing largebodies of literature, it can also be useful in modeling ex-pected activations in advance of an experiment, generatingnew hypotheses, or detecting outliers within results.
Meta-analysis must be distinguished from literature re-view. The most common method of literature review is toconstruct a figure or table that summarizes the activationpatterns of the studies under consideration. This can be doneeither by plotting foci on a standard brain or constructingtables that list coordinates of activation. This method is usedwidely for finding concordance among studies with similarexperimental contrasts and is a well-accepted technique[Barch et al., 2001; Becker et al., 1999; Buckner and Petersen,1996; Bush et al., 2000; Fiez et al., 1996; Owen, 1997; Picardand Strick, 1996]. A common modification of the literaturereview is label-based, in which reported anatomical loca-tions, or labels, are tallied and plotted [Ingham et al., 2003;Phan et al., 2002]. Labels can be derived directly from thepublications (author labels) or through the use of a standardbrain atlas (atlas labels). Despite their popularity, interpre-tation of these tables can be difficult. In addition, literaturereviews typically are not quantitative and yield no formalestimate of probability.
Activation likelihood estimation (ALE) is a new method ofquantitative, function-location meta-analysis, developed byTurkeltaub et al. [2002], that does not rely on the traditionaltabular technique of establishing agreement across studies.In ALE, a set of studies dealing with a specific domain orparadigm in human brain mapping is collected and ana-lyzed for concordance by modeling each reported focus ofactivation as the center of a Gaussian probability distribu-tion. The 3D Gaussian distributions are then summed tocreate a whole-brain statistical map that estimates the like-lihood of activation for each voxel for that task as deter-mined by the entire set of studies. In comparison with tab-ulation-based meta-analyses, the output of ALE is asimulated statistical parametric image (pseudo-SPI) that al-lows for easier interpretation than do tabular literature re-views. Once the activation foci are selected from the litera-ture, the ALE method is fully automated, quantifies thedegree of agreement across studies, and uses significancethresholds to create statistically defensible conclusions[Chein et al., 2002; Turkeltaub et al., 2002].
The ALE approach differs from label-based reviews in afundamental way. In the voxel-based ALE method (mostautomated), a group of coordinates are input, the spatialdistribution of these coordinates is analyzed to search for
concordance, and anatomical labels are applied to the result-ant clusters as a last step. However, in a label-based reviewthe anatomical labels are applied first and then the cluster-ing of labels is analyzed. In an atlas-label review, coordi-nates are assigned by consulting an atlas, whereas author-label reviews, the least automated technique described here,utilize the published labels assigned by authors.
Because agreement across studies is examined at the voxellevel, ALE analyzes the task-related activity with standard-ized location information. In contrast, label-based reviewsmake use of generalized location information, as activationis often evaluated across large regions (e.g., entire gyri oreven lobes). Incongruence in labeling or mislabeling by in-dividual investigators reduces the tabular frequency forsome labels and distributes these observations across nearbyor possibly unrelated labels. As ALE is voxel-based, it isunique in that it is not susceptible to errors caused by lack ofspatial level distinction.
The primary objective of this study was to validate theALE meta-analysis method as compared to the more tradi-tional label-based methods to determine its relativestrengths and weaknesses. This study was intended to ex-tend the validation of ALE presented by Turkeltaub et al.[2002], which was relative to prospective functional mag-netic resonance imaging (fMRI). By comparing ALE to label-based reviews, we used the same coordinate-based data, yetviewed in alternative ways. We hypothesized that the ALEmeta-analysis would return the expected results of concor-dance but that the greater level of spatial distinction allowedwith ALE (relative to label-based review) would providenew insight in converging activation results.
Two variations of the label-based review and an ALEmeta-analysis of the Stroop color–word task [Stroop, 1935]in normal subjects were carried out in this study. In theStroop task, subjects view color names presented in variousink colors and are instructed to name the presented inkcolor. In the incongruent (Stroop interference) condition,color names are presented in nonmatching ink colors (e.g.,the word “green” presented in red ink). The Stroop task isrecognized universally as a standard in examining the neu-ral substrates involved in attentional control because correctperformance in color naming often competes with the ten-dency to execute the relatively automated function of wordreading. During the incongruent condition, the two conflict-ing sources of color information cause an effect known asStroop interference during which reaction times are pro-longed due to the competing responses.
There is much discussion in the Stroop literature as to thetrends of activation and this task is generally perceived asactivating the anterior cingulate cortex, the prefrontal cortex,and parietal regions. In a brief literature author-label reviewof 12 studies, Brown et al. [1999] determined that the twomost common locations activated in response to perfor-mance of the Stroop task are the frontal cortex (10 of 13experiments) and the anterior cingulate (8 of 13 experi-ments), but did not supply any further location informationconcerning these activations. The authors acknowledge in
! Label-Based Review and ALE in the Stroop Task !
! 7 !

their review that “although most studies reported lateral orpolar frontal lobe activation, the specific areas of frontalactivation varied widely across studies.” The secondary ob-jective of this study was to systematically identify regions ofconcordance in the Stroop task to understand more fully thenetwork responsible for detection of conflict and responseselection.
The Stroop studies may be parsed into two differentgroups based on use of a verbal response (overt or covert) ora manual (button press) response. Although the Stroop taskis essentially a verbal task and it is reasonable to assume thatsome form of covert vocalization occurs during the manualStroop, we hypothesized that the two response modalitieswould display different activation patterns due to a strongeremphasis on vocalization and articulation in the verbal asopposed to that in the manual Stroop task. Previous studiesand reviews have examined the role that response modalityplays in monitoring conflict in the anterior cingulate [Barchet al., 2001; Paus et al., 1993; Picard and Strick, 1996] andfound conflicting results. The final objective here was tostudy the patterns of convergence in verbal and manualStroop to resolve the disagreement concerning the presenceor absence of somatotopic mapping in the anterior cingulatecortex.
MATERIALS AND METHODS
Literature Search and Selection
A comprehensive search for the body of literature inves-tigating Stroop interference in normal subjects was carriedout using an online citation indexing service (Medline) forstudies with the keyword “Stroop” that were classified un-der the MeSH subject heading of Brain Mapping. Fifty-fourarticles were returned. These search results were filteredto include only functional neuroimaging studies thatpublished activation results as 3D coordinates (x, y, z) instereotactic space. Filtering the results yielded 26 articles,which were entered into the BrainMap database (www.brainmap.org).
Data Coding and Correction
The 26 Stroop articles represented a total of 75 experi-ments, which were formed from the contrasts of 93 uniqueconditions. In the BrainMap database, a condition is definedas the behavioral state during which subjects are presentedwith a stimulus and given instructions as to the appropriateresponse. The contrasts that are generated when comparingbrain activity across conditions are referred to as experiments,from which localized maxima of activation are extracted andreported via Talairach coordinates [Talairach and Tournoux,1988]. Details on the conditions, experiments, subjectgroups, and imaging modality were entered into BrainMapfor the 26 Stroop articles. These 75 experiments reported 552coordinate locations. Functional neuroimaging articles re-port coordinates that are spatially normalized relative to avariety of anatomical templates. The template of each article
was noted and the coordinates were subsequently trans-formed to allow analysis relative to a single template. Forexample, coordinates published in Montreal NeurologicalInstitute (MNI) space were transformed to the Talairachtemplate according to the nonlinear Brett transformation[Brett, 1999] included in the BrainMap environment.
Selection of Conditions and Contrasts
The BrainMap coding scheme provides criteria that guidethe selection of experiments; therefore we utilized BrainMapto carry out further filtering of the studies at the experimentlevel. In the present meta-analysis, we included only thosestudies that explored activations in the standard color-wordStroop task. Several of the 75 experiments were eliminatedas they included data acquired on non-Stroop tasks such asthe Flanker task and the Simon task [Derbyshire et al., 1998;Fan et al., 2003; Peterson et al., 2002]. This restriction alsoeliminated variations of the Stroop task such as the emo-tional Stroop [Isenberg et al., 1999; George et al., 1994;Whalen et al., 1998], the counting Stroop [Bantick et al., 2002;Bush et al., 1998], and other variations of the Stroop task [deZubicaray et al., 2001; Milham et al., 2003]. Subject groupswere limited to normal subjects [Milham et al., 2002; Yucel etal., 2002]. Deactivations were omitted. Coordinates corre-sponding to the analysis of the control subjects in Yucel et al.[2002] were omitted as they were results of individual sub-jects, rather than group-mean data. These restrictions re-duced the number of articles from 26 to 19 and the numberof experiments from 70 to 27.
The final set of 27 experiments compared the incongruentcondition to a control condition. In this group of Stroopstudies, three control conditions were employed: congruent,neutral, and non-lexical. In the congruent control condition,color names were displayed in matching ink colors (e.g., theword “green” presented in green ink). The neutral controlutilized color-neutral words, presented in various ink colors.The color-neutral words were taken from categories such asanimal names [Brown et al., 1999; Carter et al., 1995], articlesof clothing [Mead et al., 2002], directions [Bench et al., 1993],or a random selection of words unrelated to color [Banich etal., 2000; Milham et al., 2001, 2002; Taylor et al., 1997]. In thenon-lexical control condition, subjects named the color ofnon-lexical stimuli such as crosses [Bench et al., 1993],squares [Brown et al., 1999], letters “XXXX” [Ruff et al., 2001;Steel et al., 2001], or pound signs “####” [George et al., 1994;Taylor et al., 1997]. The design of the various Stroop taskswas also differentiated by modality of response. In 6 studies,subjects were instructed to manually indicate the ink colorby pressing one of three or four buttons, whereas 13 studiesrequired subjects to verbally name the ink color eitherovertly or covertly. We elected not to include multiple con-trasts from the same article so as not to bias the results of themeta-analysis in favor of any subset of articles (i.e., thosereporting the greatest number of contrasts). In those studiesthat included multiple experiments that met the selectioncriteria [Banich et al., 2000; Bench et al., 1993; Brown et al.,1999; Carter et al., 1995; Mead et al., 2002; Taylor et al., 1997],
! Laird et al. !
! 8 !

sets of coordinates were chosen for the Stroop task meta-analysis by selecting the contrasts of the incongruent condi-tion with the highest-level control condition. That is, theexperiments that contrasted the Stroop interference condi-tion with the congruent condition were first selected forinclusion in the meta-analysis, followed by those with theneutral condition, and lastly, those with the non-lexical con-dition. The final collection of 19 color-word Stroop studiesincluded in the meta-analysis consisted of 13 fMRI and 6positron emission tomography (PET) studies (Table I).
Label-Based Reviews
Label-based reviews of a particular domain of humanfunctional brain mapping are often highly influential andwell cited. To examine thoroughly the differences in resultsobtained with ALE meta-analysis as compared to label-based review, two different tabular reviews were carriedout: an author-label review that used author assigned ana-tomical labels (as-published) and an atlas-label review thatutilized labels derived from the Talairach Daemon [Lan-caster et al., 2000]. Anatomical labels of the regions of acti-vations were collected directly from the publication or viathe Talairach Daemon using the search for nearest graymatter. The number of times each label appeared was re-corded, tallied, and plotted.
Activation Likelihood Estimation
ALE maps were created as described by Turkeltaub et al.[2002] using a full-width half-maximum (FWHM) of 10 mm.Statistical significance was determined using a permutation
test of randomly generated foci. No assumptions were madeconcerning the distribution or spatial separation of theserandom foci. Five thousand permutations were computedusing the same FWHM value and the same number of fociused in computing the ALE values. The test was correctedfor multiple comparisons using the false discovery rate(FDR) method [Genovese et al., 2002; Laird et al., 2005]. Alldata processing was carried out using an in-house Javaversion of ALE developed at the Research Imaging Center.Three different ALE maps were computed for all Stroopstudies, Stroop studies that required an overt or covert ver-bal response, and Stroop studies that required a manualresponse. Whole-brain maps of the ALE values were im-ported into AFNI [Cox, 1996] and overlaid onto an anatom-ical template generated by spatially normalizing the Inter-national Consortium for Brain Mapping (ICBM) template toTalairach space [Kochunov et al., 2002].
RESULTS
Selected contrasts from the Stroop literature comparingthe incongruent condition with a control condition yielded atotal of 205 foci. These foci are viewed in Talairach space inthe BrainMap database Java-based application Search&View(Fig. 1). In this image, each color/symbol combination iden-tifies a study within the BrainMap database, and the numberdisplayed along with each focus refers to the experimentwithin the corresponding article. Pooling the results of 19experiments onto a single brain resulted in a diffuse patternof activation across all lobes, with some clustering evident inthe frontal lobes.
TABLE I. Data sources
Author n Modality Control Response
Banich et al., 2000 14 fMRI Neutral ManualBench et al., 1993 6 PET Neutral, nonlexical VerbalBrown et al., 1999 8 fMRI Neutral, nonlexical VerbalCarter et al., 1995 15 PET Congruent, neutral VerbalCarter et al., 2000 12 fMRI Congruent VerbalDerbyshire et al., 1998 6 PET Congruent VerbalFan et al., 2003 12 fMRI Congruent ManualGeorge et al., 1994 21 PET Nonlexical VerbalLeung et al., 2000 13 fMRI Congruent VerbalMacDonald et al., 2000 12 fMRI Congruent VerbalMead et al., 2002 18 fMRI Congruent, neutral ManualMilham et al., 2001 16 fMRI Neutral ManualMilham et al., 2002 12 fMRI Congruent, neutral ManualPardo et al., 1990 8 PET Congruent VerbalPeterson et al., 1999 34 fMRI Congruent VerbalPeterson et al., 2002 10 fMRI Congruent VerbalRuff et al., 2001 12 fMRI Neutral ManualSteel et al., 2001 7 fMRI Nonlexical VerbalTaylor et al., 1997 12 PET Neutral, nonlexical Verbal
Nineteen publications were included in the Stroop meta-analysis and literature review. All studies used a traditional color–word Strooptask in normal volunteers. All reported response locations in stereotactic coordinates. Studies differed in their control conditions andresponse modality (manual or verbal). The average number of subjects (n) in each study was 13.1 with a standard deviation of 6.4.
! Label-Based Review and ALE in the Stroop Task !
! 9 !

Label-Based Reviews
Author-label review
A review of author-assigned labels was carried out inwhich each author label from the 205 coordinates wasrecorded, tallied, and plotted (Fig. 2). A standard nomen-clature system was not employed for author labels acrossall 19 studies (Table II). Although many authors chose toreport anatomical locations in terms of gyral anatomy(e.g., superior temporal gyrus), some preferred to usesulcal terms (e.g., superior temporal sulcus) or selectedlabels not indicative of any specific anatomical boundary(e.g., superior temporal, superior temporal region, or su-perior temporal cortex). To reduce the total number oflabels, these various anatomical descriptors were merged(e.g., superior temporal). Some authors simply reportedthe lobe of activation, such as the parietal cortex [Taylor etal., 1997] and the occipital cortex [George et al., 1994;Peterson et al., 1999]. Labels that specified location onlyby lobe were not merged.
Anatomical labels were reported in all 19 articles. Somearticles interspersed functional labels with anatomical onesin their results tables. For example, in Peterson et al. [1999],amid reports of activation in anatomical locations such as
the middle temporal gyrus and inferior parietal cortex, ac-tivations were also listed in the sensorimotor cortex. Thelack of standardization is evident by inspecting the bargraph of author-assigned anatomical labels (Fig. 2). Al-though these trends in reporting anatomical labels are notinaccurate, they do present difficulties when attempting toinclude each focus in a review of author labels because thislack of consistency in naming schemes makes agreementdifficult to assess and interpret.
The most frequently reported activation was in the leftinferior frontal region (14 foci), followed by the left inferiorparietal region (13 foci), and right and left anterior cingulate(13 and 11 foci, respectively). A high degree of agreementwas found in the anterior cingulate gyrus (ACG)/cingulateregion: authors reported 24 foci in the anterior cingulate (13on the right; 11 on the left) and 8 foci in the cingulate gyrus(split equally across both hemispheres). Two additional fociwere reported by George et al. [1994] in the right and leftmidcingulate sulcus.
Atlas-label review
In the atlas-label review of the Stroop studies, the 205coordinates were assigned an anatomical label via the Ta-lairach Daemon and tallied in bar graph format (Fig. 3).
Figure 1.Stroop foci. Activation foci of the studies included in the Stroopmeta-analyses are seen here in Talairach space in the BrainMapSearch&View environment. Selected contrasts within the 19 stud-ies yielded a total of 205 foci. A diffuse pattern of activation is seenthroughout the brain in the three orthogonal views, although
some convergence is evident in the cingulate cortex (sagittal view).Each color/symbol combination identifies a study within the Brain-Map database, and the number displayed along with each focusrefers to the experiment within the corresponding article.
! Laird et al. !
! 10 !

Activation was reported most frequently in the right and leftinferior frontal gyrus (11 and 13 foci, respectively), right andleft cingulate gyrus (9 and 11 foci, respectively), left middlefrontal gyrus (11 foci), left inferior parietal lobule (11 foci),and the left precuneus (9 foci).
Comparison of author and atlas labels
Each author label was compared individually to the cor-responding atlas label. We found that although 123 authorlabels agreed with the results of the Talairach Daemon
Figure 2.Author-label review of the Stroop task. Author labels were recorded and tallied for all 205 foci inthe Stroop articles. Labels were anatomical (“inferior frontal”), directional (“lateral frontal”), orfunctional (“sensorimotor”). Agreement was observed in the bilateral anterior cingulate, left inferiorfrontal, left inferior parietal, and left middle frontal regions.
! Label-Based Review and ALE in the Stroop Task !
! 11 !

search, 52 author labels did not. For example, a coordinate inthe right inferior frontal gyrus was assigned the author labelof “right temporal pole.” The remaining 30 labels weremismatches and included cases such as labeling a coordinatein the inferior parietal lobule as “parietal lobe” or the middlefrontal gyrus as “lateral frontal cortex.” Although they af-fected the outcome of the author-label review, these mis-matches are not erroneous. Of 205 foci, 153 author labelsthus agreed with their corresponding atlas labels and 52 didnot.
The graphical results of the author-label review and theatlas-label review are similar but not identical, due to vari-ations between authors as to the exact spatial extent of theneuroanatomical regions and to the lack of a standard no-menclature in anatomical labels. The author-label reviewwas based on 37 labels whereas the atlas-label review usedonly 27. By using a wide range of naming styles, authorsreduced the frequencies across the anatomical labels. Forexample, within the frontal lobe, “precentral gyrus” wasseen more frequently within the atlas-label review than inthe author-label review because some authors chose to nametheir coordinates in this region “sensorimotor.” This dilutionof labels is the source for the differences seen in Figures 2and 3, seen most clearly in the frontal lobe (5 atlas comparedto 10 author labels).
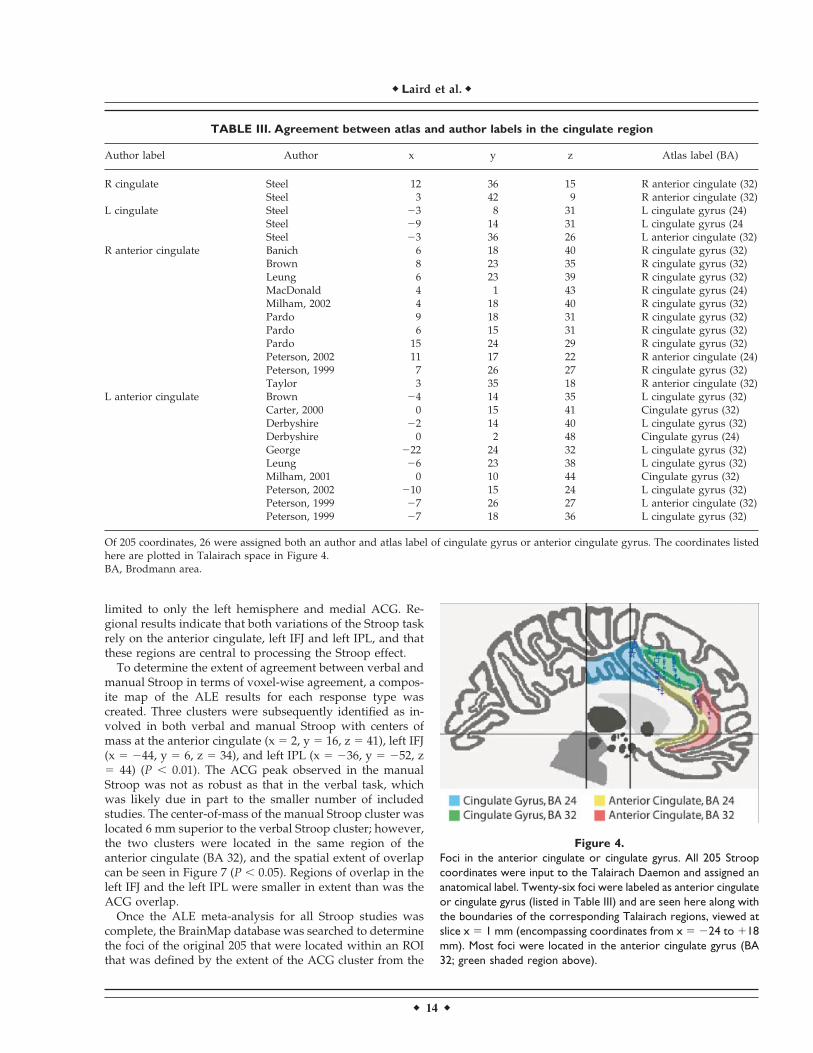
According to both the author-label review and the atlas-label review, a high degree of agreement was seen in theACG/cingulate region. The Talairach Daemon returned 26foci in the anterior cingulate (4 foci in the right hemisphere;2 foci in the left hemisphere) and cingulate gyrus (9 in theright; 11 in the left) (Table III). These foci were all labeled ascingulate or anterior cingulate coordinates by their respec-tive authors and are plotted in Figure 4, in the sagittal viewat x ! 1 with the boundaries of the relevant Talairachregions. Most foci in Table III were assigned an atlas label ofBrodmann area (BA) 32 of the cingulate gyrus (green region
in Fig. 4). Of 34 cingulate foci in the author-label review,most were classified as anterior cingulate: 24 anterior cingu-late foci, 8 cingulate foci, and 2 midcingulate sulcus foci.Twenty-six foci were confirmed by the Talairach Daemon tolie within the ACG/cingulate region. Eight foci were thuslabeled as ACG/cingulate coordinates by authors but as-signed labels from other regions by the Talairach Daemon(Table IV). Figure 5 allows for visual comparison betweenthese eight foci and the nearby anterior cingulate and cin-gulate boundaries. In this figure, the coordinates are viewedat x ! 1 mm (encompassing coordinates from x ! "22 mmto x ! #28 mm). Thus, while the George et al. [1994]coordinates appear to be located in the cingulate gyrus, theyare actually located more laterally in the caudate.
Activation Likelihood Estimation
Pooled Stroop
The ALE meta-analysis of Stroop studies revealed highALE values in the limbic, frontal, and parietal lobes (Table V;Fig. 6A). Thirteen clusters were seen in the ACG (two clus-ters; one medial, one in the left hemisphere), bilateral frontallobe (six clusters; four in the left hemisphere, two in the righthemisphere), left inferior parietal lobule (IPL), left precu-neus, bilateral insula, and left supramarginal gyrus (P$ 0.01). Extremely high ALE values were observed in theanterior cingulate gyrus (x ! 1, y ! 16, z ! 38) with a clustervolume of 4,288 mm3. The clusters in the frontolateral cortexwere identified as bilateral inferior frontal junction (IFJ),located between the precentral gyrus and inferior frontalgyrus. This region is known to be involved in cognitivecontrol and is activated commonly in tasks such as theStroop and the n-back tasks [Derrfuss et al., 2004].
Verbal Stroop
In the ALE meta-analysis of Stroop tasks that requiredan overt or covert verbal response (13 studies with 153coordinate sets), regions of high ALE values were identi-fied in the left inferior frontal gyrus (IFG) near BA 44 andbilateral insula (P $ 0.01), two regions commonly in-volved in articulation (Table V; Fig. 6B). The focus locatedin the ACG (x ! 0, y ! 17, z ! 35) exhibited the highestactivation likelihood and extended twice the volume ofthe second largest cluster (volume ! 3,200 mm3). Smallerregions were found in the right superior frontal gyrus,bilateral IFJ, and left IPL.
Manual Stroop
In the Stroop literature, studies requiring a verbal re-sponse greatly outnumbered those requiring a manual(button press) response. Six studies with 52 coordinateswere included in the manual Stroop meta-analysis. Pool-ing these studies resulted in the determination of fiveclusters of significant ALE values in the left IFJ (BA 6/9),medial ACG, left IPL, left middle frontal gyrus, and leftprecuneus (P $ 0.01; Table V, Fig. 6C). The left IFJ peak (x
TABLE II. Categories of author nomenclature
Author nomenclature % of Foci
“Gyrus” 35.6Sulcus 2.4Lobule 6.3Cortex 11.7Lobe 5.4Nuclei 5.9None 27.8Functional 4.9
Many authors reported locations in gyral terms (73 foci), whereassulcal labels were used for 5 foci. Thirteen foci were labeled “infe-rior” parietal lobule. Cortex descriptors (24 foci) included labelssuch as mesial frontal cortex and inferior parietal cortex, whereaslobe labels (11 foci) included parietal lobe. Twelve labels indicatednuclei (12 foci; i.e., thalamus, putamen, or caudate). No specificanatomical descriptor was indicated for 57 labels, such as middlefrontal or inferior temporal. Ten labels were functional (i.e., premo-tor or supplementary motor area).
! Laird et al. !
! 12 !

! "43, y ! 4, z ! 35) exhibited the highest ALE valueswith a volume of 2,136 mm3. The ACG cluster was muchsmaller in the manual Stroop results (volume ! 960 mm3)than it was in the verbal Stroop results (volume ! 3,200mm3). Notably missing from ALE map of manual Stroopstudies were the areas involved in speech productionobserved previously in the verbal Stroop results, namelyleft BA 44 and bilateral insula.
Verbal Stroop vs. manual Stroop
One similarity between the verbal and manual Stroopmeta-analyses was the agreement across lobes. High ALEvalues were found in regions inside the limbic, frontal, andparietal lobes in both Stroop tasks. Although the ALE mapfor the verbal Stroop meta-analysis included peaks in boththe right and left hemispheres, manual Stroop results were
Figure 3.Atlas-label review of the Stroop task. Using a standard nomenclature reduced the number of labelsfrom 37 (authors) to 27 (atlas). The atlas-label review found concordance in bilateral inferior frontalgyrus, bilateral cingulate gyrus, left middle frontal gyrus, left inferior parietal lobule, and leftprecuneus.
! Label-Based Review and ALE in the Stroop Task !
! 13 !
limited to only the left hemisphere and medial ACG. Re-gional results indicate that both variations of the Stroop taskrely on the anterior cingulate, left IFJ and left IPL, and thatthese regions are central to processing the Stroop effect.
To determine the extent of agreement between verbal andmanual Stroop in terms of voxel-wise agreement, a compos-ite map of the ALE results for each response type wascreated. Three clusters were subsequently identified as in-volved in both verbal and manual Stroop with centers ofmass at the anterior cingulate (x ! 2, y ! 16, z ! 41), left IFJ(x ! "44, y ! 6, z ! 34), and left IPL (x ! "36, y ! "52, z! 44) (P $ 0.01). The ACG peak observed in the manualStroop was not as robust as that in the verbal task, whichwas likely due in part to the smaller number of includedstudies. The center-of-mass of the manual Stroop cluster waslocated 6 mm superior to the verbal Stroop cluster; however,the two clusters were located in the same region of theanterior cingulate (BA 32), and the spatial extent of overlapcan be seen in Figure 7 (P $ 0.05). Regions of overlap in theleft IFJ and the left IPL were smaller in extent than was theACG overlap.
Once the ALE meta-analysis for all Stroop studies wascomplete, the BrainMap database was searched to determinethe foci of the original 205 that were located within an ROIthat was defined by the extent of the ACG cluster from the
TABLE III. Agreement between atlas and author labels in the cingulate region
Author label Author x y z Atlas label (BA)
R cingulate Steel 12 36 15 R anterior cingulate (32)Steel 3 42 9 R anterior cingulate (32)
L cingulate Steel "3 8 31 L cingulate gyrus (24)Steel "9 14 31 L cingulate gyrus (24Steel "3 36 26 L anterior cingulate (32)
R anterior cingulate Banich 6 18 40 R cingulate gyrus (32)Brown 8 23 35 R cingulate gyrus (32)Leung 6 23 39 R cingulate gyrus (32)MacDonald 4 1 43 R cingulate gyrus (24)Milham, 2002 4 18 40 R cingulate gyrus (32)Pardo 9 18 31 R cingulate gyrus (32)Pardo 6 15 31 R cingulate gyrus (32)Pardo 15 24 29 R cingulate gyrus (32)Peterson, 2002 11 17 22 R anterior cingulate (24)Peterson, 1999 7 26 27 R cingulate gyrus (32)Taylor 3 35 18 R anterior cingulate (32)
L anterior cingulate Brown "4 14 35 L cingulate gyrus (32)Carter, 2000 0 15 41 Cingulate gyrus (32)Derbyshire "2 14 40 L cingulate gyrus (32)Derbyshire 0 2 48 Cingulate gyrus (24)George "22 24 32 L cingulate gyrus (32)Leung "6 23 38 L cingulate gyrus (32)Milham, 2001 0 10 44 Cingulate gyrus (32)Peterson, 2002 "10 15 24 L cingulate gyrus (32)Peterson, 1999 "7 26 27 L anterior cingulate (32)Peterson, 1999 "7 18 36 L cingulate gyrus (32)
Of 205 coordinates, 26 were assigned both an author and atlas label of cingulate gyrus or anterior cingulate gyrus. The coordinates listedhere are plotted in Talairach space in Figure 4.BA, Brodmann area.
Figure 4.Foci in the anterior cingulate or cingulate gyrus. All 205 Stroopcoordinates were input to the Talairach Daemon and assigned ananatomical label. Twenty-six foci were labeled as anterior cingulateor cingulate gyrus (listed in Table III) and are seen here along withthe boundaries of the corresponding Talairach regions, viewed atslice x ! 1 mm (encompassing coordinates from x ! "24 to #18mm). Most foci were located in the anterior cingulate gyrus (BA32; green shaded region above).
! Laird et al. !
! 14 !

pooled Stroop meta-analysis. The bounding box of this ROIwas obtained from the ALE map (P $ 0.05; x ! "12–16 mm,y ! 0–32 mm, and z ! 22–54 mm). Once the coordinates thatfell within the bounding box were determined, they wereinspected to verify which ones actually fell within the ACGcluster border. The bounding box search results can be seenin Figure 8, and the coordinates lying within the ACG bor-der are listed in Table VI. From the original studies used inthe meta-analysis, 20 foci were located within the ACG ROI:18 in the ACG/cingulate region, one in the medial frontal
gyrus, and one in the right superior frontal gyrus. Of 26ACG/cingulate gyrus foci, 18 were thus returned by back-sampling from the ALE ROI to the articles in BrainMap.
Somatotopy in the cingulate motor area
We compared the ALE meta-analyses for verbal and man-ual Stroop (P $ 0.05) to investigate the issue of functionalsegregation within the cingulate motor area. High ALE val-ues were found in regions extending along the length of thecingulate sulcus, rostral to the vertical plane passingthrough the anterior commissure (VCA), that clearly displaymultiple distinct areas for verbal and manual response types(Fig. 9). The motor region of the anterior cingulate is dividedinto the rostral cingulate zone (rCZ) located anterior to theVCA and superior to the corpus callosum, and the caudalcingulate zone (cCZ), which lies approximately posterior tothe VCA. Furthermore, the rCZ is subdivided into an ante-rior division (rCZa) and a posterior division (rCZp). Tworegions are seen in the rCZa: one large verbal area near thegenu of the corpus callosum (x ! 3, y ! 41, z ! 18) and onesmaller manual area, posterior and superior to the verbalregion (x ! 2, y ! 32, z ! 34). Additionally, a verbal rCZpregion (x ! 1, y ! 16, z ! 36) is located inferior to a manualrCZp region (x ! 3, y ! 15, z ! 43). The verbal rCZp clusterwraps up and around the manual rCZp cluster such that aportion of it lies in the cCZ, near the VCA. The manualregion, in contrast, seems to extend toward the pre-SMA andis located completely anterior to the VCA. Finally, we notethat there are two regions of overlap between the verbal andmanual response types: one large region in the rCZp (x ! 2,y ! 16, z ! 41) and one smaller region in the rCZa (x ! "3,y ! 37, z ! 25).
DISCUSSION
We found agreement between the results of the author-label review, the atlas-label review, and the ALE method ofmeta-analysis. Although we found some evidence that thelack of standard nomenclature caused the labels to be split
TABLE IV. Disagreement between atlas and author labels in the cingulate region
Author label Author x y z Atlas label (BA) % (mm)
R cingulate Steel 9 "61 15 R posterior cingulate (30) 54Steel 12 "56 9 R posterior cingulate (30) 51
L cingulate Fan "4 38 30 L medial frontal gyrus (9) 6R anterior cingulate Carter, 1995 10 8 48 R medial frontal gyrus (6) 5
Milham, 2002 2 32 34 R medial frontal gyrus (8) 4L anterior cingulate Pardo "12 42 21 L medial frontal gyrus (9) 9R midcingulate sulcus George 26 "10 28 R caudate 20L midcingulate sulcus George "20 0 28 L caudate 17
Eight foci were assigned an author label in the cingulate region but assigned an atlas label from a different region by the Talairach Daemon.Most of these coordinates were located in the nearby medial frontal gyrus. The coordinates listed here are plotted in Talairach space inFigure 5. The approximate Euclidean distance from the coordinate to the closest point in the anterior cingulate or cingulate gyrus isindicated by (%).BA, Brodmann area.
Figure 5.Foci mislabeled by authors. Eight coordinates were labeled ascingulate gyrus or anterior cingulate gyrus by the authors, butconsidered mislabeled by the Talairach Daemon (listed in TableIV). The coordinates are viewed at x ! 1 mm (encompassingcoordinates from x ! "22 to #28 mm). The shaded region inwhich they are plotted corresponds to the anatomical label as-signed by the Talairach Daemon.
! Label-Based Review and ALE in the Stroop Task !
! 15 !

too finely in the author-label review, overall results of highagreement in the frontal lobe (specifically, the ACG and leftinferior frontal gyrus) and left IPL are robust on both re-views and agree with the ALE results. The ALE results agreewith the more conventional label-based reviews; however,ALE offers the added benefits of being more quantitativeand providing a measure of statistical reliability.
Label-Based Reviews
Differences between the two label-based reviews are duemainly to the lack of a standard nomenclature, which can beseen in the labels chosen by the authors that were split intoparallel or redundant sets. Inaccuracies in author labelingcan be classified into two categories: errors and mismatches.Errors occurred when the assigned label was simply wrong.Explanations for such mislabeling may include inexperienceor insufficient attention to detail. Fifty-two labels were clas-sified as errors in the author-label review. Mismatches
present a more subtle type of mislabeling and occurred in 30author labels. This mislabeling resulted when authors useda broad term when a more specific one would have workedjust as well (e.g., parietal lobe instead of inferior parietallobe) or when an alternative nomenclature was employed(e.g., motor cortex instead of precentral gyrus). The list ofauthor labels used in the frontal lobe (Fig. 2) shows that thetrue agreement of activation locations is somewhat maskedbecause the conventional anatomical terms such as inferiorfrontal gyrus, middle frontal gyrus, and precentral gyrus aremixed with alternative labels that are either directional (“lat-eral frontal” and “frontal polar”) or functional (“premotor”and “SMA”). This frontal lobe label example illustrates howlabeling schemes are intrinsically problematic and often de-liver ambiguous results.
At first glance, it seemed that there was a large discrep-ancy in results concerning concordance in the anterior cin-gulate and cingulate gyrus between the atlas-label and au-
TABLE V. ALE meta-analysis of the Stroop color–word task*
Anatomical region BA x y z ALE (& 10"2)Volume(mm3)
Anterior cingulate 32 1 16 38 2.4 4,288Pooled
L inferior frontal junction 6/9 "44 5 33 1.9 1,680L inferior parietal lobule 40 "40 "50 45 1.8 992L inferior frontal gyrus 45 "42 23 10 1.4 744L inferior frontal gyrus 44 "48 9 11 1.7 696L precuneus 7 "21 "71 36 1.3 552R inferior frontal junction 6/9 46 9 28 1.6 448L anterior cingulate gyrus 32 "3 38 25 1.4 360R insula 13 36 12 7 1.2 312R superior frontal gyrus 10 20 48 23 1.3 272L middle frontal gyrus 9 "42 30 31 1.3 200L supramarginal gyrus 40 "45 "42 36 1.3 192L insula 13 "26 22 5 1.2 184
VerbalAnterior cingulate 32 0 17 35 2.0 3,200L inferior frontal gyrus 44 "47 12 11 1.7 1152R superior frontal gyrus 10 20 48 23 1.3 520L insula 13 "27 22 5 1.2 368R insula 13 36 10 8 1.1 352R inferior frontal junction 6/9 48 9 28 1.2 184L inferior parietal lobule 40 "40 "52 44 1.2 168L inferior frontal junction 6/9 "46 8 35 1.1 112
ManualL inferior frontal junction 6/9 "43 4 35 1.2 2,136Anterior cingulate 32 3 16 41 1.3 960L inferior parietal lobule 40 "47 "40 47 1.2 792L middle frontal gyrus 46 "34 21 24 1.3 648L precuneus 7 "21 "70 37 1.1 600
*P $ 0.01, all three meta-analyses. In the pooled and verbal ALE meta-analysis, the highest ALE values were found in the anterior cingulategyrus. Meta-analysis of the manual Stroop task showed strong results in the left inferior frontal junction. In the manual Stroopmeta-analysis, the peak observed in the anterior cingulate was much smaller than that seen in the verbal Stroop meta-analysis. Each clusterlisted above was observed with a peak P value of $ 0.0002. Due to the method of statistical inference, it was not possible to assess the Pvalue of the center of each cluster with any greater precision than P $ 0.0002.BA, Brodman area; ALE, activation likelihood estimation.
! Laird et al. !
! 16 !

thor-label reviews. After checking the author labels againstthe Talairach Daemon, eight incompatible cingulate labelswere identified; four were in the medial frontal gyrus,within 10 mm of the cingulate gyrus (red, purple, and blueregions of Fig. 5). This would account for the greater con-cordance assessed in the medial frontal gyrus by TalairachDaemon as compared to author labels; however, these fociwere located in a region that may be considered as cingulategyrus within the bounds of intersubject variability. In thecontext of Stroop task performance, it may be accurate tolabel these foci as cingulate activation. Four other coordi-nates were categorized as errors (green and yellow regionsof Fig. 5), as they were located in the posterior cingulate[Steel et al., 2001] and the caudate [George et al., 1994].Technically, it was not incorrect for Steel et al. [2001] to labelhis foci as “cingulate” because these coordinates were lo-cated in the posterior cingulate; however, within the contextof Stroop articles that focus on activation in the anteriorcingulate cortex, this inexact label of “cingulate” is mislead-ing and is therefore classified as an error. Cingulate concor-dance assessed by the atlas-label review and the author-label
review thus is nearly identical, but only if consideration isallowed for the fact that the author label results were in-flated toward homogeneity and the tendency to report acti-vations in agreement with prior expected results. In addi-tion, we note in Table III that there is no clear or well-accepted distinction between the cingulate gyrus and theanterior cingulate gyrus among authors.
Our comparison of author and atlas labels revealed thatauthor labels retained a discrepancy rate of 25% (52 of 205).Although this number is high, it is inflated in the samemanner that the initial finding of disagreement in the cin-gulate cortex was inflated. In the ACG/cingulate gyrus re-gion, eight foci seemed incorrect, but it was determined thatfour were close to the gyri boundaries and could be consid-ered accurate within the limits of intersubject variability. Byinspection, it was found that 38 of 52 foci with incongruentlabels lay within reasonable distance to the boundaries ofthe authors’ labels. Because most authors utilize high-reso-lution MRI images when assigning anatomical labels and theTalairach Daemon labels are derived from a single atlas, adegree of discordance is expected when comparing author
Figure 6.ALE maps for pooled, verbal, and manual Stroop (P $ 0.01). A: Inthe pooled Stroop ALE meta-analysis (19 studies, 205 foci) signif-icant activation likelihood was seen in the anterior cingulate (z! 28, 38, 44). A lesser degree was seen in the left inferior frontaljunction (z ! 28, 38), the left inferior frontal gyrus (z ! 10), andthe left inferior parietal lobule (z ! 38, 44). B: ALE meta-analysis
of verbal Stroop (13 studies, 153 foci) also revealed high ALEvalues in the anterior cingulate (z ! 28, 38, 44) and left inferiorfrontal gyrus (z ! 10). C: ALE meta-analysis of manual Stroop (6studies, 52 foci) resulted in clusters in the left inferior frontaljunction (z ! 28, 38, 44) and left inferior parietal lobule (z ! 44).
! Label-Based Review and ALE in the Stroop Task !
! 17 !

labels to atlas labels. We argue that of 205 foci, only 14 weretruly inaccurate, and thus the author-label review actuallyretained a discrepancy rate of 7% rather than 25%. Never-theless, we recommend that all label-based reviews should
be carried out with an atlas, such as the Talairach Daemon,and an experienced neuroanatomist should verify the accu-racy of each label.
Activation Likelihood Estimation
By eliminating the issues inherent in label-based tech-niques and relying solely on coordinate data, we concludethat the ALE method is the preferred approach to searchingfor regions of agreement across multiple studies. Our ALEresults of the verbal and manual Stroop color–word taskwere successful in identifying three regions of overlap: theanterior cingulate, left IFJ, and left IPL. These regions thushave been isolated as major components of the network forresponse conflict resolution in the Stroop task. In addition,by using the ALE method we were able to examine thecingulate motor area and find evidence for heterogeneitywithin this region based on response modality. As such, weconclude that ALE offers many benefits not possible withtraditional label-based reviews.
Interestingly, the cingulate gyrus response is much moreprominent in the ALE meta-analysis (Fig. 6) as compared tothat in the label-based reviews (Fig. 2 and 3). This is evi-dence of the effect of the higher level of spatial distinctionallowed with the ALE method. Two things are responsiblefor this result. First, the ACG is a smaller region than areother regions seen in the ALE results, such as the inferiorfrontal gyrus. What seems like a stronger result in the IFG is
Figure 7.Composite maps for verbal and manual Stroop (P $ 0.05). ALEmeta-analysis of the Stroop task with a verbal response (red),manual response (blue), and the overlap between the two re-sponse types (yellow) reveals a large region of overlap within theanterior cingulate gyrus, and two smaller regions of overlap in the
left inferior frontal junction (x ! "46, z ! 34) and left inferiorparietal lobule (z ! 44). Our results suggest that these threeregions are major components of a network for response conflictresolution in the Stroop task.
Figure 8.Backsampling the ALE anterior cingulate gyrus cluster. A region ofinterest (ROI) was drawn around the center of mass of the ALEcluster in the anterior cingulate for the pooled Stroop meta-analysis (left; P $ 0.05) and an ROI search in BrainMapSearch&View determined that 20 foci from the original studiesthat were located within this boundaries of this anterior cingulategyrus ROI (right; coordinates listed in Table VI).
! Laird et al. !
! 18 !

actually smaller in comparison because the foci located inthe IFG are spread out across a larger surface area than thatin the cingulate cortex. Second, most foci reported in thefrontal lobe are located on the lateral side of the brain,whereas the foci reported in the cingulate are located medi-ally. Although label-based reviews interpret the results sep-arately for each hemisphere for the regions in the frontallobe, they therefore should be evaluated collectively for boththe right and left ACG and cingulate gyrus because most ofthese coordinate locations lie along the midline of the brainand thus should be treated effectively as a single unit.
Somatotopy in the cingulate motor area
Controversy exists concerning functional heterogeneitywithin the cingulate motor area. Despite differences in dataand analysis method, there are striking similarities betweenareas of dissociation between verbal and manual responsesin the Picard and Strick reviews [1996; 2001], the Paus et al.[1993] study, and the ALE meta-analysis presented here.Our ALE results agree with these three previous publica-tions in concluding that somatotopic mapping exists in theACG with multiple regions in the rCZ for hand and speechresponse types. In agreement with Paus et al. [1993], Paus[2001], and Picard and Strick [1996], two regions were seenin the rCZa: one large verbal area near the genu of thecorpus callosum and one smaller manual area, posterior and
Figure 9.Somatotopy in the cingulate motor area. ALE meta-analysis maps (P$ 0.05) are shown for the Stroop task for verbal responses (red), manualresponses (blue), and their overlap (yellow) at four slices in the sagittalorientation. A high probability for activation was found in regions thatextend along the length of the cingulate sulcus, rostral to the verticalplane passing through the anterior commissure (VCA), that clearly displaymultiple distinct areas for verbal and manual response types.
TABLE VI. Backsampling from ALE to original foci
Author x y z TD label (BA)
Banich 6 18 40 R cingulate gyrus (32)Brown 8 23 35 R cingulate gyrus (32)Brown "4 14 35 L cingulate gyrus (32)Carter, 2000 0 15 41 Cingulate gyrus (32)Derbyshire "2 14 40 L cingulate gyrus (32)Derbyshire 0 2 48 Cingulate gyrus (24)Leung 6 23 39 R cingulate gyrus (32)Leung "6 23 38 L cingulate gyrus (32)MacDonald 4 1 43 R cingulate gyrus (24)Milham, 2001 0 10 44 Cingulate gyrus (32)Milham, 2002 4 18 40 R cingulate gyrus (32)Milham, 2002 4 10 54 R superior frontal gyrus (6)Milham, 2002 2 32 34 R medial frontal gyrus (6)Pardo 9 18 31 R cingulate gyrus (32)Pardo 6 15 31 R cingulate gyrus (32)Peterson, 1999 7 26 27 R cingulate gyrus (32)Peterson, 1999 "7 18 36 L cingulate gyrus (32)Steel "3 8 31 L cingulate gyrus (24)Steel "9 14 31 L cingulate gyrus (24)
Twenty foci from the studies used in the meta-analysis were locatedwithin the ACG region of interest (ROI): 18 in the ACG/cingulategyrus region, 1 in the medial frontal gyrus, and 1 in the rightsuperior frontal gyrus. Of 26 ACG/cingulate gyrus foci, 18 werethus returned by backsampling from the ALE ROI to the studies inBrainMap. The remaining 8 ACG/cingulate gyrus foci were locatednearby, just outside the boundaries of the ROI.BA, Brodmann area.
! Label-Based Review and ALE in the Stroop Task !
! 19 !

superior to the verbal region. The manual region of therCZp, in contrast, seems to extend toward the pre-SMA andis located completely anterior to the VCA, a result thatdisagrees with the findings of Paus et al. [1993] and Picardand Strick [1996]. Our results agree with Picard and Strick[1996] and Paus et al. [1993] concerning the verbal regions inthe rCZa and rCZp and localization of the hand areas in therCZ in Picard and Strick [1996], but they are not consistentwith idea that activations associated with manual responsesare localized to cCZ.
Supporting our conclusion for functional segregationwithin the ACG is the fact that we have chosen an advancedmethod of meta-analysis that is more systematic than aretraditional methods. ALE searches for regions of agreementand overlap across multiple studies with greater precision.In addition, this study includes additional data that wasunavailable at the time of the previous studies and reviews.Our meta-analysis data represents a cleaner subset of theliterature as we have included only data acquired on thetraditional Stroop task and have not confounded our studywith multiple tasks involving various different types of pro-cessing.
Meta-analysis can only answer the question that it wasdesigned to address. A primary goal of this meta-analysiswas to determine locations of consistent activation withinthe Stroop task, and this question led to a discussion con-cerning the presence of somatotopy within the anterior cin-gulate. A deeper investigation of this topic would likelybenefit from the inclusion of the large collection of data fromalternate tasks that also are known to activate the ACG,namely verbal fluency, selective attention, Go/NoGo, andworking memory. Further work thus will concentrate onexpanding the paradigms included in this meta-analysiswith the goal of determining if the ACG is subdivided byresponse modality for a wider range of tasks. In addition,the questions concerning the strategic versus evaluativefunction [Carter et al., 2000] or the cognitive versus emo-tional divisions [Bush et al., 2000] of the ACG have goneunanswered here. Future paradigm driven or anatomicallydriven meta-analyses may be designed with the goal oftesting these issues.
ACKNOWLEDGMENTS
We thank A. Uecker and P. Mickle Fox for their expertisein software programming and S. Farmer for her help incoding articles and checking author labels.
REFERENCES
Banich MT, Milham MP, Atchley R, Cohen NJ, Webb A, Wszalek T,Kramer AF, Liang Z-P, Wright A, Shenker J, Magin R (2000):fMRI studies of Stroop tasks reveal unique roles of anterior andposterior brain systems in attentional selection. J Cogn Neurosci12:988–1000.
Bantick SJ, Wise RG, Ploghaus A, Clare S, Smith SM, Tracey I (2002):Imaging how attention modulates pain in humans using func-tional MRI. Brain 125:310–319.
Barch DM, Braver TS, Akbudak E, Conturo T, Ollinger J, Snyder A(2001): Anterior cingulate cortex and response conflict: Effects ofresponse modality and processing domain. Cereb Cortex 11:837–848.
Becker JT, MacAndrew DK, Fiez JA (1999): A comment of thefunctional localization of the phonological storage subsystem ofworking memory. Brain Cogn 41:27–38.
Bench CJ, Frith CD, Grasby PM, Friston KJ, Paulesu E, FrackowiakRSJ, Dolan RJ (1993): Investigations of the functional anatomy ofattention using the Stroop test. Neuropsychologia 31:907–922.
Brett M (1999): The MNI brain and the Talairach atlas, Cambridge Imag-ers. http://www.mrc-cbu.cam.ac.uk/Imaging/mnispace.html
Brown GG, Kindermann SS, Siegle GJ, Granholm E, Wong EC,Buxton RB (1999): Brain activation and pupil response duringcovert performance of the Stroop Color Word task. J Int Neuro-psychol Soc 5:308–319.
Buckner RL, Petersen SE (1996): What does neuroimaging tell usabout the role of prefrontal cortex in memory retrieval? SemNeurosci 8:47–55.
Bush G, Luu P, Posner MI (2000): Cognitive and emotional influ-ences in anterior cingulate cortex. Trends Cogn Sci 4:215–222.
Bush G, Whalen PJ, Rosen BR, Jenike MA, McInerney SC, Rauch SL(1998): The counting Stroop: an interference task specialized forfunctional neuroimaging—validation study with functionalMRI. Hum Brain Mapp 6:270–282.
Carter CS, MacDonald AM, Botvinick M, Ross LL, Stenger VA, NollD, Cohen JD (2000): Parsing executive processes: strategic vs.evaluative functions of the anterior cingulate cortex. Proc NatlAcad Sci USA 97:1944–1948.
Carter CS, Mintun M, Cohen JD (1995): Interference and facilitationeffects during selective attention: an H2
15O PET study of Strooptask performance. Neuroimage 2:264–272.
Chein JM, Fissell K, Jacobs S, Fiez JA (2002): Functional heteroge-neity within Broca’s area during verbal working memory.Physiol Behav 77:635–639.
Conn HO (1997): Interpretation of data from multiple trials: a crit-ical review. J Intern Med 241:177–183.
Cox RW (1996): AFNI: Software for analysis and visualization offunctional magnetic resonance neuroimages. Comput BiomedRes 29:162–173.
de Zubicaray GI, Wilson SJ, McMahon KL, Muthiah S (2001): Thesemantic interference effect in the picture-word paradigm: anevent-related fMRI study employing overt responses. HumBrain Mapp 14:218–227.
Derbyshire SW, Vogt BA, Jones AK (1998): Pain and Stroop inter-ference tasks activate separate processing modules in anteriorcingulate cortex. Exp Brain Res 118:52–60.
Derrfuss J, Brass M, von Cramon DY (2004): Cognitive control in theposterior frontolateral cortex: evidence from common activa-tions in task coordination, interference control, and workingmemory. Neuroimage 23:604–612.
Fan J, Flombaum JI, McCandliss BD, Thomas KM, Posner MI (2003):Cognitive and brain consequences of conflict. Neuroimage 18:42–57.
Fiez JA, Raife EA, Balota DA, Schwarz JP, Raichle ME, Petersen SE(1996): A positron emission tomography study of the short-termmaintenance of verbal information. J Neurosci 16:808–822.
Fox PT, Parson LM, Lancaster JL (1998): Beyond the single study:function/location meta-analysis in cognitive neuroimaging.Curr Opin Neurobiol 8:178–187.
Genovese CR, Lazar NA, Nichols TE (2002): Thresholding of statis-tical maps in functional neuroimaging using the false discoveryrate. Neuroimage 15:870–878.
! Laird et al. !
! 20 !

George MS, Ketter TA, Parekh PI, Rosinsky N, Ring H, Casey BJ,Trimble MR, Horwitz B, Herscovitch P, Post RM (1994): Regionalbrain activity when selecting a response despite interference: anH2
15O PET study of the Stroop and an Emotional Stroop. HumBrain Mapp 1:194–209.
Ingham RJ, Ingham JC, Finn P, Fox PT (2003): Towards a functionalneural systems model of developmental stuttering. J FluencyDisord 28:297–318.
Isenberg N, Silbersweig D, Engelien A, Emmerich S, Malavade K,Beattie B, Leon AC (1999): Linguistic threat activates the humanamygdala. Proc Natl Acad Sci USA 96:10456–10459.
Kochunov P, Lancaster JL, Thompson P, Toga AW, Brewer P, Har-dies J, Fox PT (2002): An optimized individual target brain in theTalairach coordinate system. Neuroimage 17:922–927.
Laird AR, Fox PM, Price CJ, Glahn DC, Uekcer AM, Lancaster JL,Turkeltaub PE, Kochunov P, Fox PT (2005): ALE meta-analysis:controlling the false discovery rate and performing statisticalcontrasts. Hum Brain Mapp 25:155–164.
Lancaster JL, Woldorff MG, Parsons LM, Liotti M, Freitas CS,Rainey L, Kochunov PV, Nickerson D, Mikiten SA, Fox PT(2000): Automated Talairach labels for functional brain map-ping. Hum Brain Mapp 10:120–131.
Leung HC, Skudlarski P, Gatenby JC, Peterson BS, Gore JC (2000):An event-related functional MRI study of the Stroop Color WordInterference Task. Cereb Cortex 10:552–560.
MacDonald III AW, Cohen JD, Stenger VA, Carter CS (2000): Dis-sociating the role of the dorsolateral prefrontal and anteriorcingulate cortex in cognitive control. Science 288:1835–1838.
Mead LA, Mayer AR, Bobholz JA, Woodley SJ, Cunningham JM,Hammeke TA, Rao SM (2002): J Int Neuropsychol Soc 8:735–742.
Milham MP, Banich MT, Claus ED, Cohen NJ (2003): Practice-related effects demonstrate complementary roles of anterior cin-gulate and prefrontal cortices in attentional control. Neuroimage18:483–493.
Milham MP, Banich MT, Webb A, Barad V, Cohen NJ, Wszalek T,Kramer AF (2001): The relative involvement of anterior cingulateand prefrontal cortex in attentional control depends on nature ofconflict. Brain Res Cogn Brain Res 12:467–473.
Milham MP, Erickson KI, Banich MT, Kramer AF, Webb A, WszalekT, Cohen NJ (2002): Attentional control in the aging brain: In-sights from an fMRI study of the Stroop task. Brain Cogn 49:277–296.
Mosteller F, Colditz GA (1996): Understanding research synthesis(meta-analysis): Annu Rev Public Health 17:1–23.
Owen AM (1997): The functional organization of working memoryprocesses within human lateral frontal cortex: The contributionof functional neuroimaging. Eur J Neurosci 9:1329–1339.
Pardo JV, Pardo PJ, Janer KW, Raichle ME (1990): The anteriorcingulate cortex mediates processing selection in the Stroopattentional conflict paradigm. Proc Natl Acad Sci USA 87:256–259.
Paus T (2001): Primate anterior cingulate cortex: where motor con-trol, drive, and cognition interface. Nat Rev Neurosci 2:417–424.
Paus T, Petrides M, Evans AC, Meyer E (1993): Role of the humananterior cingulate cortex in the control of oculomotor, manual,and speech responses: a positron emission tomography study.J Neurophysiol 70:453–469.
Peterson BS, Kane MJ, Alexander GM, Lacadie C, Skudlarski P,Leung H-C, May J, Gore JC (2002): An event-related fMRI studycomparing interference effects in the Simon and Stroop tasks.Brain Res Cogn Brain Res 13:427–440.
Peterson BS, Skudlarski P, Gatenby JC, Zhang H, Anderson AW,Gore JC (1999): An fMRI study of Stroop Word-Color Interfer-ence: evidence for cingulate subregions subserving multiple dis-tributed attentional systems. Biol Psychiatry 45:1237–1258.
Petitti DB (1997): Meta-analysis and endocrinology. EndocrinolMetab Clin North Am 26:31–44.
Phan LK, Wager T, Taylor SF, Liberzon I (2002): Functional neuro-anatomy of emotion: a meta-analysis of emotion activation stud-ies in PET and fMRI. Neuroimage 16:331–348.
Picard N, Strick PL (1996): Motor areas of the medial wall: a reviewof their location and functional activation. Cereb Cortex 6:342–353.
Picard N, Strick PL (2001): Imaging the premotor areas. Curr OpinNeurobiol 11:663–672.
Ruff CC, Woodward TS, Laurens KR, Liddle PF (2001): The role ofthe anterior cingulate cortex in conflict processing: evidencefrom Reverse Stroop Interference. Neuroimage 14:1150–1158.
Steel C, Haworth EJ, Peters E, Hemsley DR, Sharma T, Gray JA,Pickering A, Gregory L, Simmons A, Bullmore ET, Williams SCR(2001): Neuroimaging correlates of negative priming. Neurore-port 12:3619–3624.
Stroop JR (1935): Studies of interference in serial verbal reactions. JExp Psychol 18:643–662.
Talairach J, Tournoux P (1988): Co-planar stereotaxic atlas of thehuman brain. New York: Thieme.
Taylor SF, Kornblum S, Lauber EJ, Minoshima S, Koeppe RA (1997):Isolation of specific interference processing in the Stroop Task:PET activation studies. Neuroimage 6:81–92.
Turkeltaub PE, Eden GF, Jones KM, Zeffiro TA (2002): Meta-analysisof the functional neuroanatomy of single-word reading: methodand validation. Neuroimage 16:765–780.
Whalen PJ, Bush G, McNally RJ, Wilhelm S, McInerney SC, JenikeMA, Rauch SL (1998): The emotional counting Stroop paradigm:a functional magnetic resonance imaging probe of the anteriorcingulate affective division. Biol Psychiatry 44:1219–1228.
Yucel M, Pantelis C, Stuart GW, Wood SJ, Maruff P, Velakoulis D,Pipingas A, Crowe SF, Tochon-Danguy HJ, Egan GF (2002):Anterior cingulate activation during Stroop task performance: aPET to MRI coregistration study of individual patients withschizophrenia. Am J Psychiatry 159 251–254.
! Label-Based Review and ALE in the Stroop Task !
! 21 !