
A Comparative Study on Seismic Performance Evaluation ...
39
International Journal of Latest Engineering Research and Applications (IJLERA) ISSN: 2455-7137 Volume –06, Issue – 04, April 2021, PP – 26-64 www.ijlera.com 2021 IJLERA – All Right Reserved 26 | Page A Comparative Study on Seismic Performance Evaluation between Reinforced Concrete Structures and Post Tensioned Concrete Structures Using Etabs Aysha S M Tech in Structural Engineering Abstract: The buildings are constructed mostly based on the usual standard codes considering the gravity loads consisting of the self weight of the structure and the live load. These structures are experiencing low magnitude loads in their design life that leads only to elastic response, however strong loads such as sudden earthquake will lead the structure beyond the elastic limit. Seismic design is a vital process of structural analysis while designing a building which is subjected to earthquake motions. Thus seismic analysis is a tool to estimate the structural response of the structure while designing earthquake resistant structures or vulnerably existing structures. In present study, seismic performance evaluation is carried out on a G+4 irregular RCC building situated in Kerala (zone lll) according to IS 1893:2002. The structure was modelled in ETABS 2018, Push over analysis and Time history analysis was performed in the same software. The results are then compared with the same building modelled with post tensioned slabs and carried out the same seismic evaluation methods using ETABS. Keywords: seismic, push over, time history, post tension Introduction 1.1 General The sudden release of energy in the earth‟s crust creates seismic waves which arrive at various instance of time with different intensity levels are called as earthquake. It causes the random ground motion in all directions, radiating from epicentre, which causes structure to vibrate due to which induce inertia forces in them. Many existing structures are seismically deficient due to lack of awareness regarding seismic behaviour of structures. Due to this, there is urgent need to reverse this situation and do the seismic evaluation of existing and new structures. 1.2 Types of Structures 1.2.1 Reinforced Concrete Structures The reinforced concrete structure refers to the members, such as beams, columns, roof trusses, consisting of concrete and steel bars. Reinforced concrete structures can be classified based on different parameters. On the basis of regularity, they are classified as regular and irregular structures. Irregularity can be further sub classified as mass irregular stiffness irregular and geometric irregular. Geometric irregularity is again divided as horizontally irregular (plan) and vertically irregular buildings. Fig.1.1 Irregular buildings
Transcript of A Comparative Study on Seismic Performance Evaluation ...

International Journal of Latest Engineering Research and Applications (IJLERA) ISSN: 2455-7137
Volume –06, Issue – 04, April 2021, PP – 26-64
www.ijlera.com 2021 IJLERA – All Right Reserved 26 | Page
A Comparative Study on Seismic Performance Evaluation
between Reinforced Concrete Structures and Post Tensioned
Concrete Structures Using Etabs
Aysha S M Tech in Structural Engineering
Abstract: The buildings are constructed mostly based on the usual standard codes considering the gravity
loads consisting of the self weight of the structure and the live load. These structures are experiencing low
magnitude loads in their design life that leads only to elastic response, however strong loads such as sudden
earthquake will lead the structure beyond the elastic limit. Seismic design is a vital process of structural analysis
while designing a building which is subjected to earthquake motions. Thus seismic analysis is a tool to estimate
the structural response of the structure while designing earthquake resistant structures or vulnerably existing
structures. In present study, seismic performance evaluation is carried out on a G+4 irregular RCC building
situated in Kerala (zone lll) according to IS 1893:2002. The structure was modelled in ETABS 2018, Push over
analysis and Time history analysis was performed in the same software. The results are then compared with the
same building modelled with post tensioned slabs and carried out the same seismic evaluation methods using
ETABS.
Keywords: seismic, push over, time history, post tension
Introduction
1.1 General
The sudden release of energy in the earth‟s crust creates seismic waves which arrive at various instance
of time with different intensity levels are called as earthquake. It causes the random ground motion in all
directions, radiating from epicentre, which causes structure to vibrate due to which induce inertia forces in them.
Many existing structures are seismically deficient due to lack of awareness regarding seismic behaviour of
structures. Due to this, there is urgent need to reverse this situation and do the seismic evaluation of existing and
new structures.
1.2 Types of Structures
1.2.1 Reinforced Concrete Structures
The reinforced concrete structure refers to the members, such as beams, columns, roof trusses,
consisting of concrete and steel bars. Reinforced concrete structures can be classified based on different
parameters. On the basis of regularity, they are classified as regular and irregular structures. Irregularity can be
further sub classified as mass irregular stiffness irregular and geometric irregular. Geometric irregularity is again
divided as horizontally irregular (plan) and vertically irregular buildings.
Fig.1.1 Irregular buildings

International Journal of Latest Engineering Research and Applications (IJLERA) ISSN: 2455-7137
Volume –06, Issue – 04, April 2021, PP – 26-64
www.ijlera.com 2021 IJLERA – All Right Reserved 27 | Page
Fig.1.2 Plan regular and plan irregular building
1.2.2 Post tensioned structures
Post-tensioning is simply a method of producing prestressed concrete, masonry, and
other structural elements. When the steel is tensioned before concrete placement, the process is called
pretensioning. When the steel is tensioned after concrete placement, the process is called post-tensioning. A post
tension slab is a concrete slab that has steel cables running through it that have been placed under 33,000 +/-
pounds of tension. This tension makes the concrete slab and foundation much stronger than concrete without
reinforcement and helps reduce cracking.
1.3 Seismic Analysis
Seismic analysis is a tool for the estimation of structural response in the process of
designing earthquake resistant structures and vulnerable existing structures. It is part of the process of structural
design, earthquake engineering or structural assessment and retrofit in regions where earthquakes are prevalent.
Seismic analysis methods can be divided into the following categories:
1.3.1 Non linear static analysis
In general, linear procedures are applicable when the structure is expected to remain nearly elastic for
the level of ground motion or when the design results in nearly uniform distribution of nonlinear response
throughout the structure. As the performance objective of the structure implies greater inelastic demands, the
uncertainty with linear procedures increases to a point that requires a high level of conservatism in demand
assumptions and acceptability criteria to avoid unintended performance. Therefore, procedures incorporating
inelastic analysis can reduce the uncertainty and conservatism.
This approach is also known as pushover analysis. A pattern of forces is applied to a structural model
that includes non-linear properties (such as steel yield), and the total force is plotted against a reference
displacement to define a capacity curve. This can then be combined with a demand curve (typically in the form
of an acceleration-displacement response spectrum (ADRS)). This essentially reduces the problem to a single
degree of freedom (SDOF) system.
Nonlinear static procedures use equivalent SDOF structural models and represent seismic ground
motion with response spectra. Storey drifts and component actions are related subsequently to the global
demand parameter by the pushover or capacity curves that are the basis of the non-linear static procedures.
1.3.2 Linear dynamic analysis
Static procedures are appropriate when higher mode effects are not significant. This is generally true
for short, regular buildings. Therefore, for tall buildings, buildings with torsional irregularities, or non-
orthogonal systems, a dynamic procedure is required. In the linear dynamic procedure, the building is modelled
as a multi-degree-of-freedom (MDOF) system with a linear elastic stiffness matrix and an equivalent viscous
damping matrix.
The seismic input is modelled using either modal spectral analysis or time history analysis but in both
cases, the corresponding internal forces and displacements are determined using linear elastic analysis. The
advantage of these linear dynamic procedures with respect to linear static procedures is that higher modes can be
considered. However, they are based on linear elastic response and hence the applicability decreases with
increasing nonlinear behaviour, which is approximated by global force reduction factors.
In linear dynamic analysis, the response of the structure to ground motion is calculated in the time
domain, and all phase information is therefore maintained. Only linear properties are assumed. The analytical
method can use modal decomposition as a means of reducing the degrees of freedom in the analysis.

International Journal of Latest Engineering Research and Applications (IJLERA) ISSN: 2455-7137
Volume –06, Issue – 04, April 2021, PP – 26-64
www.ijlera.com 2021 IJLERA – All Right Reserved 28 | Page
1.3.3 Equivalent static analysis
This approach defines a series of forces acting on a building to represent the effect of earthquake
ground motion, typically defined by a seismic design response spectrum. It assumes that the building responds
in its fundamental mode. For this to be true, the building must be low-rise and must not twist significantly when
the ground moves. The response is read from a design response spectrum, given the natural frequency of the
building (either calculated or defined by the building code). The applicability of this method is extended in
many building codes by applying factors to account for higher buildings with some higher modes, and for low
levels of twisting. To account for effects due to yielding of the structure, many codes apply modification factors
that reduce the design forces (e.g. force reduction factors).
1.3.4 Response spectrum analysis
This approach permits the multiple modes of response of a building to be taken into account (in
the frequency domain). This is required in many building codes for all except very simple or very complex
structures. The response of a structure can be defined as a combination of many special shapes (modes) that in a
vibrating string correspond to the harmonics. Computer analysis can be used to determine these modes for a
structure. For each mode, a response is read from the design spectrum, based on the modal frequency and the
modal mass, and they are then combined to provide an estimate of the total response of the structure. In this we
have to calculate the magnitude of forces in all directions i.e. X, Y & Z and then see the effects on the building.
Combination methods include the following:
absolute – peak values are added together
square root of the sum of the squares (SRSS)
complete quadratic combination (CQC) – a method that is an improvement on SRSS for closely spaced
modes
The result of a response spectrum analysis using the response spectrum from a ground motion is
typically different from that which would be calculated directly from a linear dynamic analysis using that
ground motion directly, since phase information is lost in the process of generating the response spectrum.
In cases where structures are either too irregular, too tall or of significance to a community in disaster
response, the response spectrum approach is no longer appropriate, and more complex analysis is often required,
such as non-linear static analysis or dynamic analysis.
1.3.5 Non linear dynamic analysis
Nonlinear dynamic analysis utilizes the combination of ground motion records with a detailed
structural model, therefore is capable of producing results with relatively low uncertainty. In nonlinear dynamic
analyses, the detailed structural model subjected to a ground-motion record produces estimates of component
deformations for each degree of freedom in the model and the modal responses are combined using schemes
such as the square-root-sum-of-squares.
In non-linear dynamic analysis, the non-linear properties of the structure are considered as part of
a time domain analysis. This approach is the most rigorous, and is required by some building codes for buildings
of unusual configuration or of special importance. However, the calculated response can be very sensitive to the
characteristics of the individual ground motion used as seismic input; therefore, several analyses are required
using different ground motion records to achieve a reliable estimation of the probabilistic distribution of
structural response. Since the properties of the seismic response depend on the intensity, or severity, of the
seismic shaking, a comprehensive assessment calls for numerous nonlinear dynamic analyses at various levels
of intensity to represent different possible earthquake scenarios. This has led to the emergence of methods like
the incremental dynamic analysis.
1.4 Scope of the Present Study
Comparative study between seismic performance of R.C structures and post tensioned structures. There
are different seismic analysis methods, but this project is limited to push over analysis and time history analysis.
Irregularity in structures can be in different manners, but in this study, plan irregularity is considered.
Literature Review 2.1 General
In today‟s world the exploding population creating the disasters like land scarcity which leads us to the
bringing some new construction technology and commercial structures. A normal building structure has number
of beams in it. But while taking flat slabs no beams are casted separately. A structure is said to be more stable
International Journal of Latest Engineering Research and Applications (IJLERA) ISSN: 2455-7137
Volume –06, Issue – 04, April 2021, PP – 26-64
www.ijlera.com 2021 IJLERA – All Right Reserved 29 | Page
when it satisfy the stability. Two approximate methods are adopted by the codes for the design and analyze the
flat slab or say flat plate. These methods can be used provided the limitations specified therein are satisfied. The
two design methods are i) The direct design method, ii) The equivalent frame method. In a developing country
like India the benefits of pre-stressing and particularly of post-tensioning are yet to be recognized. The inherent
hurdle is undoubtedly the higher initial investment that is required from the clients. This has to be overlooked
considering the significant benefits of post-tensioning and the high benefit-aspect ratio that can be
advantageously procured. In the present study an attempt is made to be compare the design and cost
effectiveness of post-tensioned flat slab with respect to the reinforced concrete flat slab system. Pushover
analysis is a popular performance based design method, so there are many studies conducted using this method.
Time history analysis is a non linear dynamic analysis to obtain the dynamic response of the structure subjected
to seismic loading. Most of these studies assumed that the lateral force distribution was an inverted triangular
distribution, according to recommendation of codes only flexural plastic hinges were considered. It was also
studied that mode shapes and the lateral distribution of base shear gives the same results. The following are
some studies in brief:
Chatali Patel, Payal Patel, Grishma Thaker (2018) Pushover analysis of High rise RCC buildings with vertical
irregularities: The seismic behavior of multi-storied building frame during an earthquake motion depends upon
the distribution of strength, mass and stiffness in both horizontal and vertical planes. Pushover analysis is one of
the analysis method which is adopted for the present study. Present study aims towards doing Nonlinear Static
Pushover Analysis of G +20 high rise RCC residential building. This work shows that the comparison seismic
performance and behavior of building frame with and without vertical irregularity in terms of parameter like
storey shear, storey displacement, and storey drift. Also comparison of seismic response of the structure in terms
of base shear and displacement along with the location of the plastic hinges at the performance point of all the
models are considered. All building frames are analyzed by using design and analysis software ETABS and
design as per IS 456:2000 and IS 1893:2002.
P.Lestuzzi, H. Harif, (2018), Nonlinear Time-History Analysis for Validation of the Displacement-Based
Seismic Assessment of the RC Upper Bridge of a Dam: The paper focuses on the nonlinear time-history
analyses which were achieved in order to check the accuracy of the results obtained using the displacement-
based method. The structural characteristics of the reinforced concrete upper bridge are similar to those of
conventional bridges. However, the piers were built with very little reinforcement and consequently they will
exhibit a rocking behavior in case of earthquake loading. Rocking is rather a favorable failure mechanism and is
related to a certain amount of displacement capacity. However, this behavior is not linked to plastic energy
dissipation which may significantly increase the related displacement demand. In order to determine the real
displacement demand, nonlinear time-history analyses were achieved with SDOF systems defined by an “S”
shape hysteretic model. Spectrum compatible stationary synthetic accelerograms and slightly modified recorded
earthquakes were both used for acceleration time-histories. The results showed that the displacement demand
corresponds well with the one determined by usual push-over analysis. The results show a very favorable
seismic situation, related to a relatively stiff structure associated to rock soil conditions with an A class soil. The
seismic safety of the upper bridge is already satisfactory for the current state (without retrofitting).
Consequently, the proposed costly reinforcement for the upper bridge could be significantly reduced.
S.M Patil, Y.M Pudale, V.V Nair (2018) Study of pushover analysis of vertical irregular structures: The seismic
performance of building frame changes with the variation or the discontinuity in stiffness, strength and mass of
the building. This causes the irregularity of the building. So that, pushover analysis is one of the method to study
the seismic behavior of vertical irregular structure when the structure is subjected to earthquake forces. The
vertical irregularity that is irregularity in elevation is considered for present study. Five G+7 RCC building
frames having different percentage of irregularity are considered for the present study and it is designed and
analyzed by using design and analysis software ETABS v9.5.0.All the building frames are designed as per the
IS 456:2000 and IS1893:2002.The purpose of this concerned work is to compare the pushover result obtained in
terms of parameter storey drift, storey displacement, storey shear, Base shear, spectral displacement and spectral
acceleration of different vertical irregular structure and to study the effect of increase in vertical irregularity.
Namani Saikiran, T.Parimala (2017) Study of irregular RC frame buildings under seismic: Buildings may be
considered as asymmetric in plan or in elevation based on the distribution of mass and stiffness along each
storey, throughout the height of the buildings. Most of the hilly regions of India are highly seismic. To study the
effect of varying height of columns in ground storey due to sloping ground, the plan layout is kept similar for

International Journal of Latest Engineering Research and Applications (IJLERA) ISSN: 2455-7137
Volume –06, Issue – 04, April 2021, PP – 26-64
www.ijlera.com 2021 IJLERA – All Right Reserved 30 | Page
both buildings on plane and sloping ground. The models have been conducted and analyzed in the ETABS pro
program by using equivalent linear static method and response spectrum method for comparing and
investigating the changes in structural behavior and the irregularity effect in plan and elevation on sloping
ground. The result of the analysis for displacement and storey drift have been studied and compared with
reference to the serviceability and the time period, storey shear, storey moment and storey torsion, have been
studied and compared for different configurations structure models and it was presenting in graphical and
tabular form.
Anju Nayas, Minu Antony (2017) Push over analysis of plan irregular RC buildings with special columns :
Irregular buildings constitute a major portion of the modern urban infrastructure. The group of people involved
in constructing the building facilities, including owner, architect, structural engineer, contractor and local
authorities, come up with the overall planning, selection of structural system, and its configuration. This may
lead to building structures with irregularities in their mass, stiffness and strength along the height of building.
The objective of this study is to carry out nonlinear static analysis of irregular RC frame using special shaped
columns with plan irregularity. This study also finds out which plan irregular building is the most effective in
resisting lateral loads. The software used for modelling and analysis is ETABS 2015.
A.M Mwafy, S.Khalifa (2017) Impacts of vertical irregularity of seismic design of high rise buildings: Many
tall buildings are practically irregular, as a perfect regular high-rise building rarely exists. The structural
irregularity increases the uncertainty related to the capacity of the building to meet the design objectives. There
is a pressing need to systematically assess the impacts of vertical irregularity on the seismic design of tall
buildings, particularly the extreme irregularity types. This study is thus devoted to evaluate the seismic design
coefficients of the modern tall buildings with different vertical irregularity features. The comprehensive results
obtained from a large number of inelastic pushover and incremental dynamic analyses provide insights into the
local and global seismic response of the reference structures and confirm the unsatisfactory response of tall
buildings with severe vertical irregularities. The study also concluded that although the design coefficients of
regular tall structures and buildings with insignificant irregularities are adequately conservative, they can be
revised to arrive at a more cost-effective design of tall buildings.
Jnanesh Reddy RK (2017) Comparative Study of Post Tensioned and RCC Flat Slab in Multi-Storey
Commercial Building: In the present study the attempt is made to comparing the cost effectiveness of Post-
Tensioned flat slab systems with respect to RF concrete flat slab system. Both the systems are analyzed using
RAPT and ETABS respectively which is based on the design methodology. There are many other benefits of
using PT slab. As the thickness of the slab is much lesser than the R.C.C flat slab, aesthetic look of the building
may get enhanced leading to a clear height for a longer distance. Hence, using a PT Slab is more advisable for a
commercial building than using a R.C.C Flat Slab. Construction of a structure using Post-Tensioned Slab also
leads to a lighter structure as the Dead Load gets reduced.
A.S Patil, P.D Kumbhar (2013) Time History analysis of multi storied building under different seismic
intensities: In the present paper study of nonlinear dynamic analysis of Ten storied RCC building considering
different seismic intensities is carried out and seismic responses of such building are studied. The building under
consideration is modeled with the help of SAP2000-15 software. Five different time histories have been used
considering seismic intensities V, VI, VII, VIII, IX and X on Modified Mercalli's Intensity scale (MMI) for
establishment of relationship between seismic intensities and seismic responses. The results of the study shows
similar variations pattern in Seismic responses such as base shear and storey displacements with intensities V to
X. From the study it is recommended that analysis of multistoried RCC building using Time History method
becomes necessary to ensure safety against earthquake force.
Boskey Bahoria (2010), Comparative Design of RCC & Post-tensioned flat slabs: In the present study the
design of the post-tensioned flat slab is done by using two methods, load balancing method and equivalent
frame method. The technical study of the post-tensioned flat slab by varying the span by 0.5 m interval is done
and results of the different parameters such as thickness of slab, grade of concrete, loss due to stress, normal
reinforcement, reinforcement for the shear, Member of tendons, stressing force per tendons and deflection etc.
are presented in the graphical form. A design of post tensioned beam is also done. For the study of post
tensioned flat slab and beams a case study of multistory office building (G+4floor system) is taken and it is
designed by four cases, the post tensioned flat slab, post-tensioned beams and the RCC flat slab and the RCC
slab and beams. After the design of these four cases the comparative study with respect to economy is carried

International Journal of Latest Engineering Research and Applications (IJLERA) ISSN: 2455-7137
Volume –06, Issue – 04, April 2021, PP – 26-64
www.ijlera.com 2021 IJLERA – All Right Reserved 31 | Page
out. The analysis, design and the estimation of the office building of the four floors systems is done. The study
shows the variation of the rate per square meter for these four different cases.
U. Prawatwong (2008) Seismic performance of post–tensioned interior slab column connections with and
without drop panel: This paper presents an technical study on the seismic activity of two three fifth scale post-
tensioned interior slab column connection models, one without drop panel and another on with drop panel. The
model without drop panelled was designed and constructed to represents a typical connection between interior
column and post-tensioned flat plate with bonded tendons are found in Thailand. The another model was leads
to represent an improved design of typical post-tensioned slab-column connections by using drop panel. Both
models were tested under a constant same gravitational load.
2.2 Summary The seismic behavior of multi-storied building frame during an earthquake motion depends upon the
distribution of strength, mass and stiffness in both horizontal and vertical planes. All models are analyzed by
using design and analysis software ETABS or SAP and designed as per IS 456:2000 and IS 1893:2002. Push
over analysis is a non linear static analysis had been used to obtain the inelastic deformation capability of frame.
Only non-linear dynamic analysis is more accurate than pushover analysis; where non-linear dynamic analysis is
time taking to perform. In order to obtain dynamic response of the structure, Time history analysis is carried out.
So we can conclude that pushover analysis is the appropriate method to use for performance based design to get
the response of the structures. Boskey Bahoria gives the idea about the post tensioned flat slab building structure
having four cases depending upon by varying the span length by 0.5 m interval and discuss the comparative
study of four cases with respect to economy.U. Prawatwong makes a two models one with drop panel shows the
connections between slab-column and another is without drop panel shows connection between interior columns
with PT flat plate and bonded tendons having seismic performance on two three fifth scale pattern under
constant gravity load to investigate the seismic performance. Jnanesh Reddy RK compares the cost effectiveness
of the post-tensioned flat slab with respect to RCC flat slab by using RAPT and ETABS softwares giving the
final statement that PT flat slab is more advisable than RCC flat slab because it reduced the dead load by
reducing thickness of slab.
Objectives
The objectives of the present study is
• To model a G+4 storey RC irregular building in ETABS 2018 as per IS codes. [ Plan irregular building
– L shaped]
• To perform pushover analysis to get the seismic response of the structure.
• To perform time history analysis to obtain dynamic response of the structure
• To compare the results with the same building modelled with post tensioned slab under same seismic
evaluation methods.
Methodology Studying the literature reviews for understanding the concept
Choosing the software and its validation.
Identifying the building plan and material properties.
Modelling the plan in ETABS.
Analysis of the building using non linear static pushover
Analysis of the building using non linear dynamic time history
Modelling of post tensioned slabs and analysis of building using ETABS software
Observation of results and discussions.

International Journal of Latest Engineering Research and Applications (IJLERA) ISSN: 2455-7137
Volume –06, Issue – 04, April 2021, PP – 26-64
www.ijlera.com 2021 IJLERA – All Right Reserved 32 | Page
Validation 5.1 General
The validation object enables to evaluate the quality of mapping across source and target meshes. It
provides quantitative measures that help in identifying regions on the target where the mapping failed to provide
an accurate estimate of the source data.
5.2 Analytical Method Table.5.1 Reference journal details
Title A Proposed Draft for IS : 1893 Provisions on Seismic Design of Buildings –
Part II : Commentary and Examples
Name of journal Journal of Structural Engineering
Author Sudhir K. Jain
Year 1995, July
Table.5.2 Building details
Sl. No. Parameter Value
1 No. of storeys 4
2 Zone III
3 Live load 3 kN/m2
4 Columns 450 x 450 mm
5 Beams 250 x 400 mm
6 Slab thickness 150 mm
7 Wall thickness 120 mm
8 Importance factor 1.0
9 Structure type OMRF
Fig.5.1 Plan and elevation of the building
5.2.1 Calculations
[All values as per IS 1893:2002 Part l]
Fundamental period
o Natural time period Ta = 0.09 (h/√d) => 0.09(12/√22.5) = 0.2277s
Spectral acceleration
o For medium type soil & Ta = 0.2277s =>Sa/g = 2.5
o Zone factor Z = 0.16 (Zone III)
o Importance factor I =1.0
o Response reduction factor R = 3.0 (OMRF)
o Horizontal acceleration coefficient Ah = Z/2 x Sa/g x I/R = 0.0667
Computation of seismic weights

International Journal of Latest Engineering Research and Applications (IJLERA) ISSN: 2455-7137
Volume –06, Issue – 04, April 2021, PP – 26-64
www.ijlera.com 2021 IJLERA – All Right Reserved 33 | Page
o Slab
DL due to weight of slab = (22.5 x 22.5 x 0.15) x 25 = 1898 kN
o Beams
Self weight of beam per unit length = 0.25 x 0.4 x 25 = 2.5 kN/m
Total length = 4 x 22.5 x 2 = 180 m
DL due to weight of beams = 2.5 x 180 = 450 kN
o Columns
Self weight of beam per unit length = 0.45 x 0.4 x 25 = 5.0625 kN/m
DL due to weight of columns = 16 x 5.0625 x 3= 243 kN
o Walls
Self weight of wall per unit length = 0.12 x 3 x 20 = 7.2 kN/m
Total length = 4 x 22.5 x 2 = 180 m
Self weight of wall = 7.2 x 180 = 1296 kN
Total load on each floor = 1898 + 450 + 243 + 1296 = 3890 kN
5.2.2 Seismic weight computation
Live load = 3 x 22.5 x 22.5 = 1518.75 kN
Storey forces : Storey 1 = Storey 2 = Storey 3 = 3890 + 25%(1518.75) = 4270 kN
Storey forces : Storey 4 = 450 + (243/2) + 1898 + (1296/2) = 3118 kN
Seismic weight W = 3 x 4270 + 3118 = 15938 kN
Design base shear VB = W x Ah = 15928 x 0.066 = 917.88 Kn
5.4 Numerical Method
Fig.5.2 Plan and elevation from software
Fig.5.3 3-D View Fig.5.4 Rendered View
International Journal of Latest Engineering Research and Applications (IJLERA) ISSN: 2455-7137
Volume –06, Issue – 04, April 2021, PP – 26-64
www.ijlera.com 2021 IJLERA – All Right Reserved 34 | Page
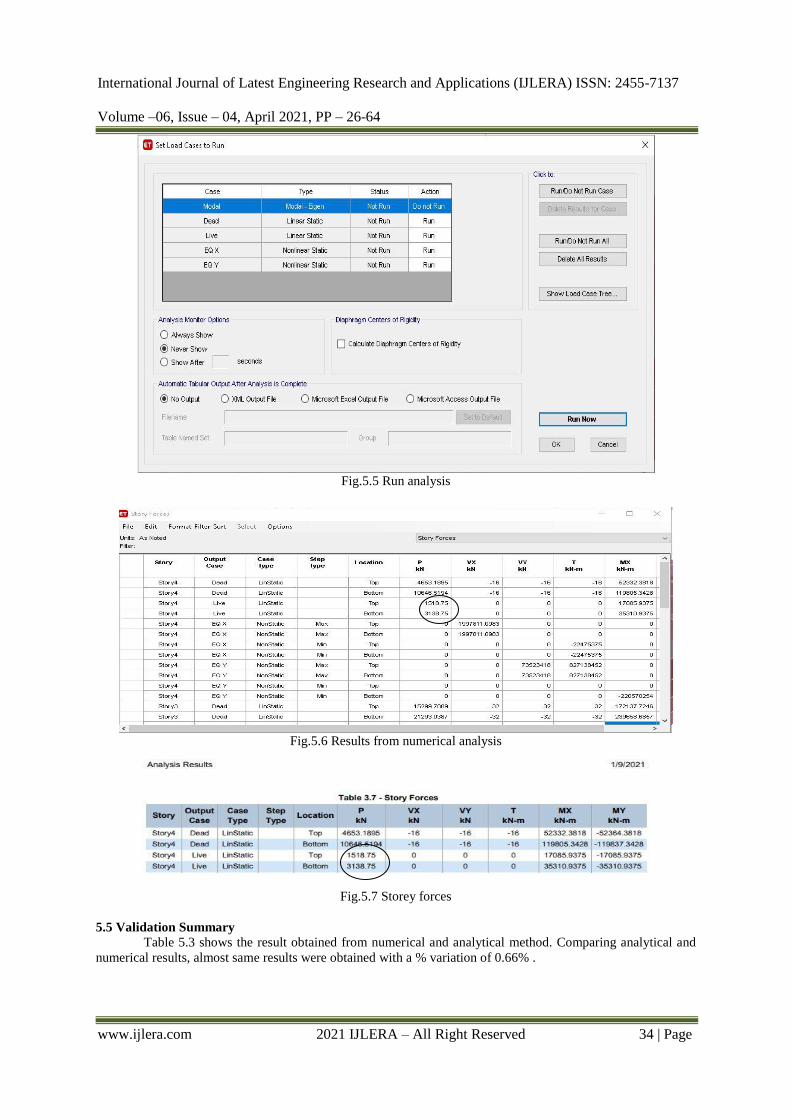
Fig.5.5 Run analysis
Fig.5.6 Results from numerical analysis
Fig.5.7 Storey forces
5.5 Validation Summary
Table 5.3 shows the result obtained from numerical and analytical method. Comparing analytical and
numerical results, almost same results were obtained with a % variation of 0.66% .
International Journal of Latest Engineering Research and Applications (IJLERA) ISSN: 2455-7137
Volume –06, Issue – 04, April 2021, PP – 26-64
www.ijlera.com 2021 IJLERA – All Right Reserved 35 | Page
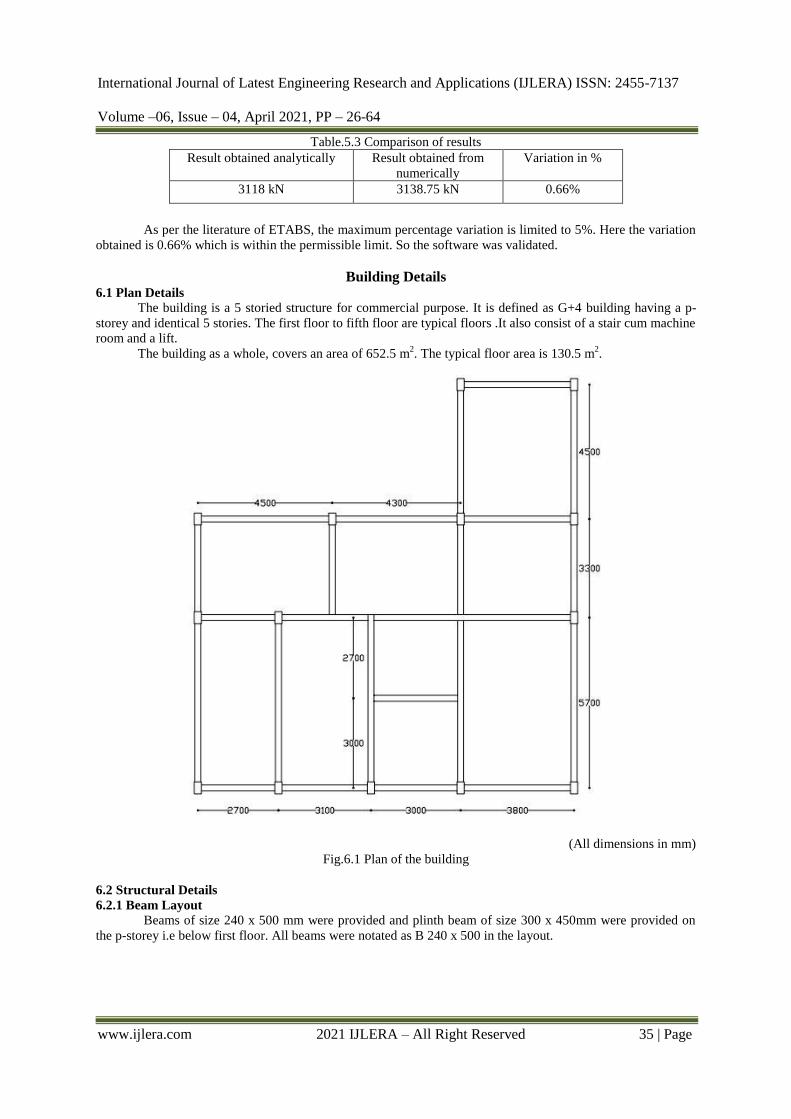
Table.5.3 Comparison of results
Result obtained analytically Result obtained from
numerically
Variation in %
3118 kN 3138.75 kN 0.66%
As per the literature of ETABS, the maximum percentage variation is limited to 5%. Here the variation
obtained is 0.66% which is within the permissible limit. So the software was validated.
Building Details 6.1 Plan Details
The building is a 5 storied structure for commercial purpose. It is defined as G+4 building having a p-
storey and identical 5 stories. The first floor to fifth floor are typical floors .It also consist of a stair cum machine
room and a lift. The building as a whole, covers an area of 652.5 m
2. The typical floor area is 130.5 m
2.
(All dimensions in mm)
Fig.6.1 Plan of the building
6.2 Structural Details
6.2.1 Beam Layout
Beams of size 240 x 500 mm were provided and plinth beam of size 300 x 450mm were provided on
the p-storey i.e below first floor. All beams were notated as B 240 x 500 in the layout.

International Journal of Latest Engineering Research and Applications (IJLERA) ISSN: 2455-7137
Volume –06, Issue – 04, April 2021, PP – 26-64
www.ijlera.com 2021 IJLERA – All Right Reserved 36 | Page
Fig.6.2 Beam layout Fig.6.3 Column layout
6.2.2 Column layout
There are 14 no.s of columns in each floor, with a dimension of 240 x 400mm. All columns were
notated as C 240 x 400 in the layout.
6.2.3 Material properties
The materials used in the designing were M25 grade concrete for beams and slabs, M30 grade concrete
for columns, and Fe 415 grade steel reinforcements.
Table.6.1 Material properties
Parameters Concrete Steel
Young‟s Modulus (E) 21718500 kN/m
2 2×10
3 kN/m
2
Poison‟s Ratio (nu) 0.17 0.3
Density 23.5616 kN/m2 76.8195 kN/m
2
Critical Damping Ratio 0.05 0.03
Table.6.2 Column details
Column C
Column details
Column size 24 x 40 cm

International Journal of Latest Engineering Research and Applications (IJLERA) ISSN: 2455-7137
Volume –06, Issue – 04, April 2021, PP – 26-64
www.ijlera.com 2021 IJLERA – All Right Reserved 37 | Page
Main steel 4 No.s 16 # + 2 No.s 12 #.
Ties details 8# @ 18 cm @ H/4 from top and bottom and 8#
@ 20 cm @ midspan
6.2.4 Foundation details
Table.6.3 Foundation details
Footing F1
Concrete mix M 30
Steel Fe 415
Size of P.C.C 140 x 160 x 15 cm
Size of R.C.C 120 x 140 x 20 cm
Reinforcement details 12 # @ 15 cm c/c both directions
Building Modelling
The complete structure is framed structure. Thus, to analyse the columns and beams, software used is
ETABS.
7.1 Reinforced Concrete Building
7.1.1 Storey and grid data
Fig.7.1 X grid data Fig.7.2 Y grid data
Fig.7.3 Storey data
7.1.2 Defining and assigning beams
Beam size 240 x 500 mm
Concrete M25
Property modifiers
Torsional constant: 0.01

International Journal of Latest Engineering Research and Applications (IJLERA) ISSN: 2455-7137
Volume –06, Issue – 04, April 2021, PP – 26-64
www.ijlera.com 2021 IJLERA – All Right Reserved 38 | Page
I about both axes: 0.35
Fig.7.4 Beam properties Fig.7.5 Assigned beams
7.1.3 Defining and assigning columns
Column size 240 x 400 mm
Concrete M30
Property modifiers
Torsional constant: 0.01
I about both axes: 0.7

International Journal of Latest Engineering Research and Applications (IJLERA) ISSN: 2455-7137
Volume –06, Issue – 04, April 2021, PP – 26-64
www.ijlera.com 2021 IJLERA – All Right Reserved 39 | Page
Fig.7.6 Column properties
Fig.7.7 Assigned columns Fig.7.8 Orientation of columns
7.1.4 Defining and assigning slabs

International Journal of Latest Engineering Research and Applications (IJLERA) ISSN: 2455-7137
Volume –06, Issue – 04, April 2021, PP – 26-64
www.ijlera.com 2021 IJLERA – All Right Reserved 40 | Page
Table.7.1 Slab details
Floor slab Thickness 140 mm Modelling type - membrane
Stair slab Thickness 200 mm
One way distribution
Modelling type – membrane
Concrete M25
Fig.7.9 Assigned slabs
7.1.5 Defining retaining wall
Modelling type – membrane
Thickness – 200 mm
Concrete M30
Fig.7.10 Shear wall with beams Fig.7.11 Shear wall without beams
With the above steps, the modelling in ETABS has been completed.

International Journal of Latest Engineering Research and Applications (IJLERA) ISSN: 2455-7137
Volume –06, Issue – 04, April 2021, PP – 26-64
www.ijlera.com 2021 IJLERA – All Right Reserved 41 | Page
Fig.7.12 3-D view of structure Fig.7.13 3-D rendered view
7.2 Post Tensioned Building
Tendons
• Banded tendons in X direction
– Group of tendons placed together as a narrow strip and is laid along the column line
• Distributed tendons in Y direction
– Bundle of tendons laid perpendicular to banded tendons
In addition to the steps in modelling of reinforced concrete building, the following steps have to be done.
7.2.1 Define materials
Material name - A416Gr270
Material type – Tendon
Symmetry - Uniaxial
Fig.7.14 Define materials Fig.7.15 Material property data

International Journal of Latest Engineering Research and Applications (IJLERA) ISSN: 2455-7137
Volume –06, Issue – 04, April 2021, PP – 26-64
www.ijlera.com 2021 IJLERA – All Right Reserved 42 | Page
7.2.2 Tendon properties
Fig.7.16 Tendon properties Fig.7.17 Tendon property data
Fig .7.18 Tendon property assign Fig.7.19 Tendon load
Fig.7.20 Tendon loss option Fig.7.21 Tendon object type

International Journal of Latest Engineering Research and Applications (IJLERA) ISSN: 2455-7137
Volume –06, Issue – 04, April 2021, PP – 26-64
www.ijlera.com 2021 IJLERA – All Right Reserved 43 | Page
7.2.3 Add Design strips
Fig.7.22 Design strips - X Fig.7.23 Design strips - Y
7.2.4 Tendon layout
(a) Banded tendon
Vertical profile - Parabola
Fig.7.24 Banded tendon layout

International Journal of Latest Engineering Research and Applications (IJLERA) ISSN: 2455-7137
Volume –06, Issue – 04, April 2021, PP – 26-64
www.ijlera.com 2021 IJLERA – All Right Reserved 44 | Page
Fig.7.25 Banded tendon vertical profile
(b) Distributed tendon
Vertical profile – Reverse parabola
Fig.7.26 Distributed tendon layout
Fig.7.27 Distributed tendon vertical profile

International Journal of Latest Engineering Research and Applications (IJLERA) ISSN: 2455-7137
Volume –06, Issue – 04, April 2021, PP – 26-64
www.ijlera.com 2021 IJLERA – All Right Reserved 45 | Page
7.2.5 Design of post tensioned slabs
Design preferences as per IS 456:2000
Concrete strength ratio at transfer = 0.8
Fig.7.28 Concrete slab design preferences
Display type is of two types as follows:
(a) Flexural stress check long term
Design basis – strip based
Stress type – compressive
Scale factor – 1
Plot type – stress diagrams
Fig.7.29 Flexural stress check – long term
International Journal of Latest Engineering Research and Applications (IJLERA) ISSN: 2455-7137
Volume –06, Issue – 04, April 2021, PP – 26-64
www.ijlera.com 2021 IJLERA – All Right Reserved 46 | Page
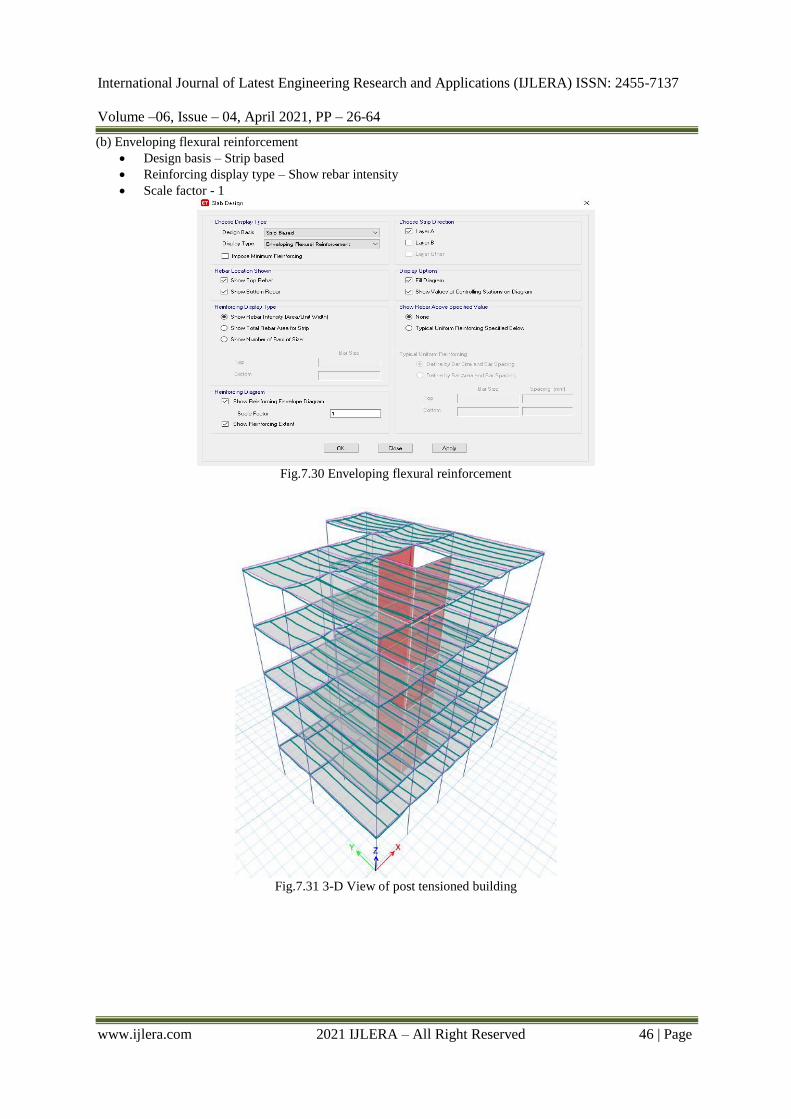
(b) Enveloping flexural reinforcement
Design basis – Strip based
Reinforcing display type – Show rebar intensity
Scale factor - 1
Fig.7.30 Enveloping flexural reinforcement
Fig.7.31 3-D View of post tensioned building

International Journal of Latest Engineering Research and Applications (IJLERA) ISSN: 2455-7137
Volume –06, Issue – 04, April 2021, PP – 26-64
www.ijlera.com 2021 IJLERA – All Right Reserved 47 | Page
Static Non –Linear Pushover Analysis Pushover analysis is a performance based design which is recommended by Euro code and FEMA 273
and FEMA 356. This method considers the nonlinear behaviour of the structure which increases the load taking
capacity of the building. It also focuses on ductility of the structure by providing plastic hinges. Pushover
analysis is applicable to new and existing structures which can be a good method for retrofitting of structures
after its design life is over. It considers target displacement and defining objectives whenever the performance
meet the objectives then the damage at that performance level is acceptable.
8.1 General
The use of the non linear static pushover analysis came into practice in 1970‟s but the potential of
pushover analysis has been recognized for last 10 to 15 years. This procedure is mainly used to estimate the
strength and drift capacity of existing structure and the seismic demand for this structure subjected to selected
earthquake. This procedure can be used for checking the adequacy of the new structural design. Push over
analysis is defined as an analysis wearing a mathematical model directly incorporating the normal load
deformation characteristics of individual components and elements of the building shall be subjected to
monotonically interesting lateral loads representing inertia forces in an earthquake.
8.1.1 Steps involved
Evaluation of Capacity of building i.e. Representation of the structure‟s ability to resist forces
Evaluation of Demand curve i.e. Representation of earthquake ground motion.
Determination of Performance point i.e. Intersection point of demand curve and capacity.
The performance of a building is depended upon the performance of the structural and the non-structural
components. After obtaining the performance point, the performance of the structures is checked against these
performance levels.
8.2 Procedure Pushover analysis includes the application of increasing lateral loads or deformations to a nonlinear
mathematical model of a structure. The nonlinear load-deformation behaviour of each section of the structure is
modelled in separate way. In a force-controlled push, the loads are applied monotonically until either the total
load reaches a target value or the building has a collapse mechanism. In a displacement-controlled push, the
displacements are increased monotonically until either the displacement of a predefined control node in the
building exceeds a target value or the building has a collapse mechanism. For convenience, the control node can
be taken at the design centre of mass of the roof of the building. The target displacement is the maximum
considered displacement that is approximated and predefined initially.
First of all the structure to be designed for gravity loads in any design software and then the pushover
analysis to be performed. The lateral load as per is 1893 is applied in increasing manner or the first fundamental
mode shape is used to take the seismic demand force from the dynamic characteristics. It is very important to
determine the displacement control point and the direction of the first fundamental mode. The plastic hinges to
be defined for each beam and column at both ends. There are two possibilities the first possibility is that the load
may reach its target value and the building at that value of load is safe, where the second case it can reach
collapse mechanism. Even in the collapse mechanism the hinges should be carefully studied and the
performance point maybe observed if the performance point exists and the failure at that level is acceptable then
the overall performance of the structure at that level is acceptable.
• Capacity: The capacity of the structure in general depends on the displacement each individual member
can take or we can say that the capacity of structure depends on the capacities of individual
components deformation. Considering this phenomenon the critical sections are determined and the
mathematical model of the structure is enhanced and the response is calculated again until the demand
is satisfied.
• Demand: As we know the earthquake yields in complex horizontal displacements for any structure. The
maximum target displacement is the displacement assumed to be from the potential earthquake.
Basically this target displacement is the demand. Once the maximum forces applied to the building
laterally could not result in the displacement beyond the target displacement then it is concluded that
the building performed well.
International Journal of Latest Engineering Research and Applications (IJLERA) ISSN: 2455-7137
Volume –06, Issue – 04, April 2021, PP – 26-64
www.ijlera.com 2021 IJLERA – All Right Reserved 48 | Page
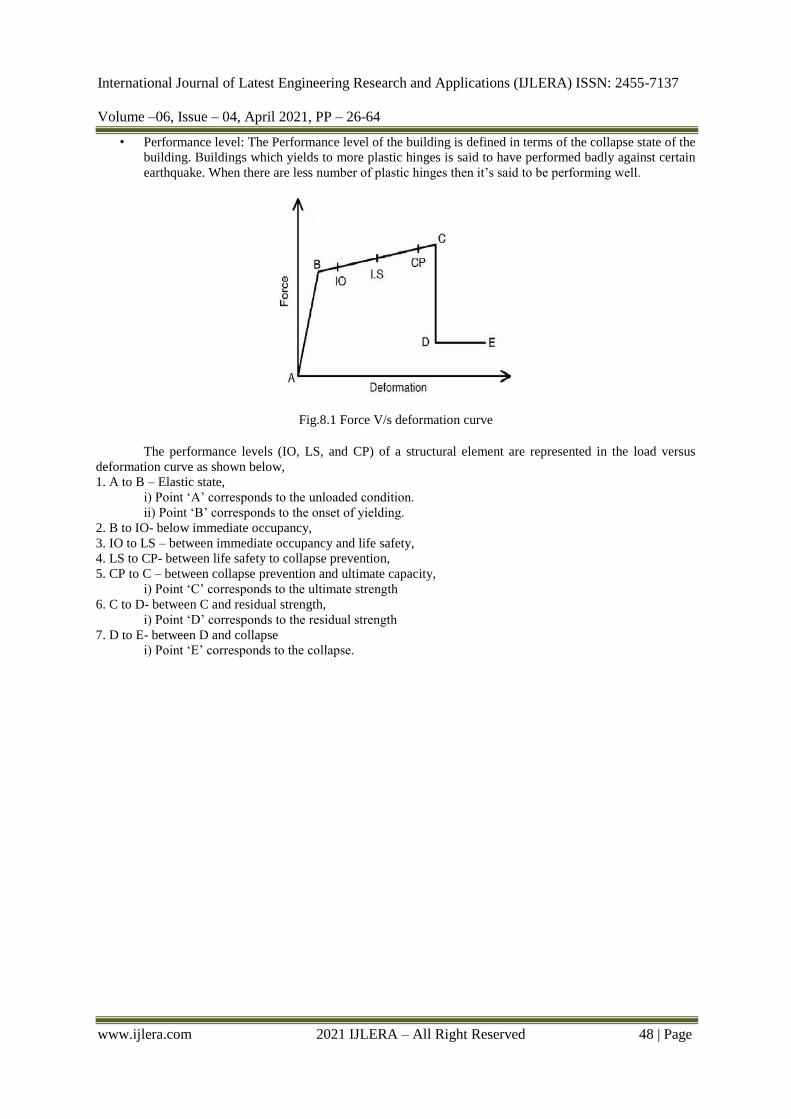
• Performance level: The Performance level of the building is defined in terms of the collapse state of the
building. Buildings which yields to more plastic hinges is said to have performed badly against certain
earthquake. When there are less number of plastic hinges then it‟s said to be performing well.
Fig.8.1 Force V/s deformation curve
The performance levels (IO, LS, and CP) of a structural element are represented in the load versus
deformation curve as shown below,
1. A to B – Elastic state,
i) Point „A‟ corresponds to the unloaded condition.
ii) Point „B‟ corresponds to the onset of yielding.
2. B to IO- below immediate occupancy,
3. IO to LS – between immediate occupancy and life safety,
4. LS to CP- between life safety to collapse prevention,
5. CP to C – between collapse prevention and ultimate capacity,
i) Point „C‟ corresponds to the ultimate strength
6. C to D- between C and residual strength,
i) Point „D‟ corresponds to the residual strength
7. D to E- between D and collapse
i) Point „E‟ corresponds to the collapse.

International Journal of Latest Engineering Research and Applications (IJLERA) ISSN: 2455-7137
Volume –06, Issue – 04, April 2021, PP – 26-64
www.ijlera.com 2021 IJLERA – All Right Reserved 49 | Page
Push Over In Etabs The following steps are done in ETABS for push over analysis.
9.1 Define Load Patterns
In addition to DL and LL, earthquake loads push x and push y is defined.
Fig.9.1 Define load patterns – R.C. Building
For post tensioned structure, an extra load i.e super dead load is also defined in addition to the above.
Fig.9.2 Define load patterns – P.T. Building
9.2 Define Load Cases Push X And Push Y
Fig.9.3 Load cases

International Journal of Latest Engineering Research and Applications (IJLERA) ISSN: 2455-7137
Volume –06, Issue – 04, April 2021, PP – 26-64
www.ijlera.com 2021 IJLERA – All Right Reserved 50 | Page
(i) Push X
Load case type – non linear static
Mass source – MsSrc1
Load type – acceleration
Load application – displacement control
Result saved – multiple states
Load name – UX
Scale factor – 1
(ii) Push Y
Load case type – non linear static
Mass source – MsSrc1
Load type – acceleration
Load application – displacement control
Result saved – multiple states
Load name – UY
Scale factor - 1
9.3 Assign Auto Plastic Hinges To Beams
Hinge property – auto
Auto hinge assignment data
o Type – From tables in ASCE 41-17
o Table – Table 10-7 ( Concrete beams- Flexure) item i
o DOF- M3
Fig.9.4 Auto hinge assignment in beams
Fig.9.5 Assigned auto hinges in beam

International Journal of Latest Engineering Research and Applications (IJLERA) ISSN: 2455-7137
Volume –06, Issue – 04, April 2021, PP – 26-64
www.ijlera.com 2021 IJLERA – All Right Reserved 51 | Page
9.4 Assign Auto Plastic Hinges to Columns
Hinge property – auto
Auto hinge assignment data
o Type – From tables in ASCE 41-17
o Table – Table 10-8 and 10-9 ( Concrete columns)
o DOF- P2-M2-M3
Figure.9.6 Auto hinge assignment in columns Figure.9.7 Assigned auto hinges in columns
10.5 Run Analysis
Run analysis for push X, push Y, Dead Load and Live load cases
Fig.9.8 Run analysis
Time History Analysis
10.1 General
Structural dynamics is a type of structural analysis which covers the behavior of a structure subjected
to dynamic (actions having high acceleration) loading. Dynamic loads include people, wind, waves,
traffic, earthquakes, and blasts. Any structure can be subjected to dynamic loading. Dynamic analysis can be
used to find dynamic displacements, time history, and modal analysis. In time history analysis, the structural
response is computed at a number of subsequent time intervals. In other words, time histories of the structural
response to a given input are obtained and a result.
10.2 Fast Non Linear Analysis
Fast Nonlinear Analysis (FNA) is a modal analysis method useful for the static or dynamic evaluation
of linear or nonlinear structural systems. Because of its computationally efficient formulation, FNA is well-

International Journal of Latest Engineering Research and Applications (IJLERA) ISSN: 2455-7137
Volume –06, Issue – 04, April 2021, PP – 26-64
www.ijlera.com 2021 IJLERA – All Right Reserved 52 | Page
suited for time-history analysis, and often recommended over direct-integration applications. During dynamic-
nonlinear FNA application, analytical models should:
Be primarily linear-elastic.
Have a limited number of predefined nonlinear members.
Lump nonlinear behavior within link objects.
In addition to nonlinear material force-deformation relationships, these link objects may simulate
concentrated damping devices, isolators, and other energy-dissipating technologies. If fuse mechanisms are not
integral to the design intention, an initial elastic analysis may reveal locations where inelasticity is likely to
occur. However, it is always best to predefine inelastic mechanisms such that their design may provide for
sufficient ductility, while elastic systems are ensured sufficient strength. Capacity Design provides for a more
reliable model and a better-performing structure.
The efficiency of FNA formulation is largely due to the separation of the nonlinear-object force
vector RNL(t) from the elastic stiffness matrix and the damped equations of motion, as seen in the fundamental
equilibrium equation of FNA, expressed as:
M ü(t) + C ů(t) + K u(t) + RNL (t) = R(t) Eqn(6)
Stiffness- and mass-orthogonal Load-Dependent Ritz Vectors represent the equilibrium relationships
within the elastic structural system. At each time increment, the uncoupled modal equations are solved exactly,
while forces within the predefined nonlinear DOF, indexed within RNL(t), are resolved through an iterative
process which converges to satisfy equilibrium. Following this procedure, FNA is an efficient and accurate
dynamic-nonlinear application which satisfies equilibrium, force-deformation, and compatibility relationships.
10.3 Time History Function
Linear cases always start from zero, therefore the corresponding time function must also start from
zero.
Nonlinear cases may either start from zero or may continue from a previous case. When starting from
zero, the time function is simply defined to start with a zero value. When analysis continues from a
previous case, it is assumed that the time function also continues relative to its starting value. A long
record may be broken into multiple sequential analyses which use a single function with arrival times.
This prevents the need to create multiple modified functions.
In this study, non linear time function is considered and the program files are extracted from the El Centro
Earthquake.
10.3.1 El Centro earthquake
The 1940 El Centro earthquake (or 1940 Imperial Valley earthquake) occurred at 21:35 Pacific
Standard Time on May 18 (05:35 UTC on May 19) in the Imperial Valley in Southern California near
the international border of the United States and Mexico. It had a moment magnitude of 6.9 and a maximum
perceived intensity of X (Extreme) on the Mercalli intensity scale. It was the first major earthquake to be
recorded by a strong-motion seismograph located next to a fault rupture. The earthquake was characterized as a
typical moderate-sized destructive event with a complex energy release signature. It was the strongest recorded
earthquake to hit the Imperial Valley, and caused widespread damage to irrigation systems and led to the deaths
of nine people.
Table.10.1 Earthquake details
Title El Centro earthquake
Date May 18, 1940
Time 21:35 PST
Magnitude 6.9 Mw
Depth 16 Km
Epi center 32.733°N 115.5°WCoordinates
Type Strike-slip
Affected area United states, Mexico
Total damage $6 Million
Max intensity X, Extreme

International Journal of Latest Engineering Research and Applications (IJLERA) ISSN: 2455-7137
Volume –06, Issue – 04, April 2021, PP – 26-64
www.ijlera.com 2021 IJLERA – All Right Reserved 53 | Page
Time History Analysis In Etabs The following steps are done in ETABS for time history analysis.
11.1 Define Time History Function
Time history function is defined by extracting the time history data of El Centro Earthquake.
Fig.11.1 Time history function definition
11.2 Define Load Cases
In addition to DL, LL, earthquake loads in x and y direction, Time history loads in x and y direction are
defined. Both are defined as fast non linear.
Load case data is provided with following details:
Load case type : Time history
Load case subtype : Non linear Modal
Initial conditions : Zero initial condition
Load type : Acceleration
No. of output time steps : 200
Output time step size : 0.1 sec
Fig.11.2 Load cases

International Journal of Latest Engineering Research and Applications (IJLERA) ISSN: 2455-7137
Volume –06, Issue – 04, April 2021, PP – 26-64
www.ijlera.com 2021 IJLERA – All Right Reserved 54 | Page
Fig.11.3 Load case data
11.3 Run Analysis
The load cases of dead load, live load earthquake load in x and y direction, time history load in x and y
direction are set to run for R.C. Building.
Fig.11.4 Run Analysis – R.C. Structure
In post tensioned structure, in addition to DL, LL, push x, push y, THA x, THA y, Sdead (super dead
load), PT- FINAL, PT –TRANSFER and PT – FINAL -HP are set to run.

International Journal of Latest Engineering Research and Applications (IJLERA) ISSN: 2455-7137
Volume –06, Issue – 04, April 2021, PP – 26-64
www.ijlera.com 2021 IJLERA – All Right Reserved 55 | Page
Fig.11.5 Run analysis – P.T. Structure
Results and Discussion 12.1 Pushover Anaysis Results
Pushover Analysis was carried out over the designed G+4 storey building using ETABS 2018. The
members were assigned with their self-weight of the building considering beams, columns slabs. And the
analysis was carried out for combinations of loads as per IS 1893-2002. The building is pushed in lateral
directions until the collapse mechanism is reached.
12.1.1 Pushover curve
It is the plot between base shear (kN) and monitored displacement(mm)
Table.12.1 Displacements
R.C. Building P.T. Building
Monitored displacement = 168.189 mm Monitored displacement = 44.26 mm
12.1.2 Performance point
The Performance point is the intersection of the demand and capacity curves

International Journal of Latest Engineering Research and Applications (IJLERA) ISSN: 2455-7137
Volume –06, Issue – 04, April 2021, PP – 26-64
www.ijlera.com 2021 IJLERA – All Right Reserved 56 | Page
Table.12.2 Performance point
R.C. Building P.T. Building
12.1.3 Effective time period
Shorter time period indicates greater probabilities of collapse [Ref : WCEE2012_5015]
Table.12.3 Effective time period
Building
type
Effective time period from FEMA 440 Equivalent linearization Time period
(s)
R.C.
0.334
P.T.
0.48
12.1.4 Deformed shape under loads
(a) Dead load
R.C. Building P.T. Building
Fig.12.1 Deformed shape under dead loads

International Journal of Latest Engineering Research and Applications (IJLERA) ISSN: 2455-7137
Volume –06, Issue – 04, April 2021, PP – 26-64
www.ijlera.com 2021 IJLERA – All Right Reserved 57 | Page
(b) Live load
R.C. Building P.T. Building
Fig.12.2 Deformed shape under live loads
(c) Push X
R.C. Building P.T. Building
Fig.12.3 Deformed shape under push X loads
(d) Push Y
R.C. Building P.T. Building

International Journal of Latest Engineering Research and Applications (IJLERA) ISSN: 2455-7137
Volume –06, Issue – 04, April 2021, PP – 26-64
www.ijlera.com 2021 IJLERA – All Right Reserved 58 | Page
Fig.12.4 Deformed shaped under push Y loads
(e) Tendon loads (P.T. Building)
PT-TRANSFER PT-FINAL
Fig.12.5 Deformed shaped under tendon loads
(f) Super imposed deadload (SDead)
International Journal of Latest Engineering Research and Applications (IJLERA) ISSN: 2455-7137
Volume –06, Issue – 04, April 2021, PP – 26-64
www.ijlera.com 2021 IJLERA – All Right Reserved 59 | Page
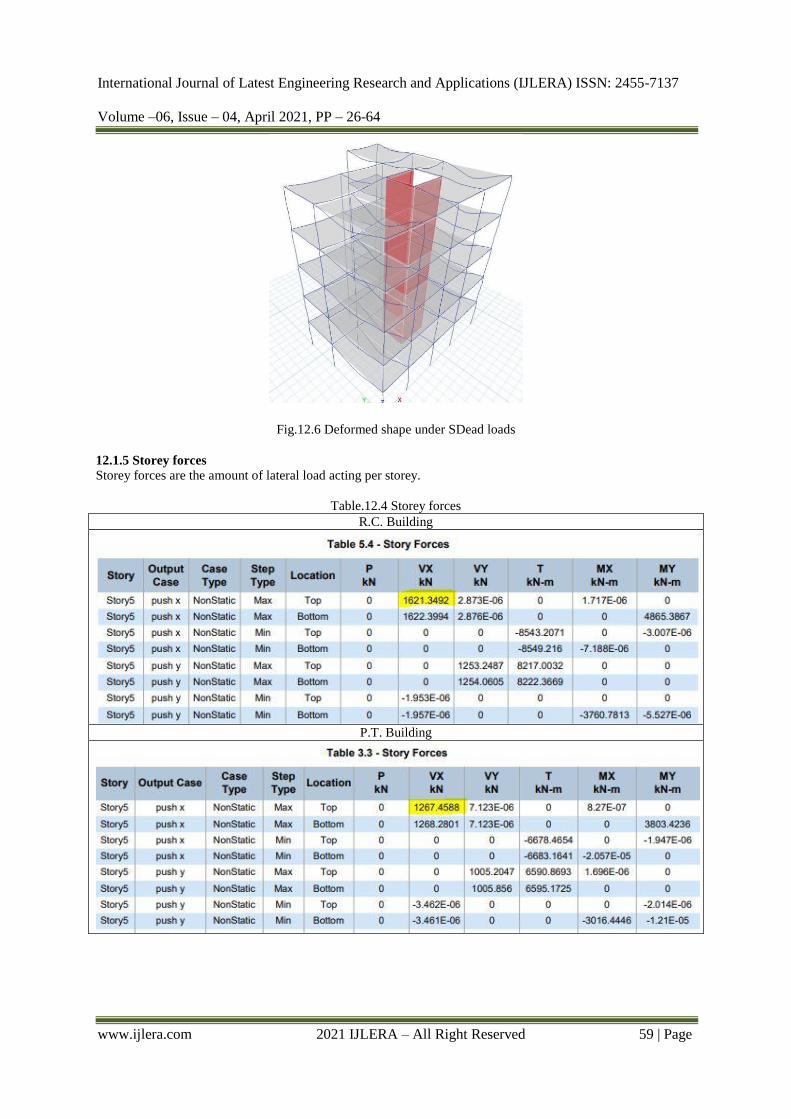
Fig.12.6 Deformed shape under SDead loads
12.1.5 Storey forces
Storey forces are the amount of lateral load acting per storey.
Table.12.4 Storey forces
R.C. Building
P.T. Building

International Journal of Latest Engineering Research and Applications (IJLERA) ISSN: 2455-7137
Volume –06, Issue – 04, April 2021, PP – 26-64
www.ijlera.com 2021 IJLERA – All Right Reserved 60 | Page
12.2 Time History Analysis Results
12.2.1 Modal Periods and frequencies
Table.12.5 Modal periods and frequencies
R.C. Building P.T. Building
Higher Eigen value represents the load magnitude subject to a constraint on structural weight.
12.2.2 Modal directional factors
Modal directional factors identify the predominance of excitation directions. Each factor is a % which
relates its component to the total displacement over the stories
Table.12.6 Modal directional factors
R.C. Building P.T. Building
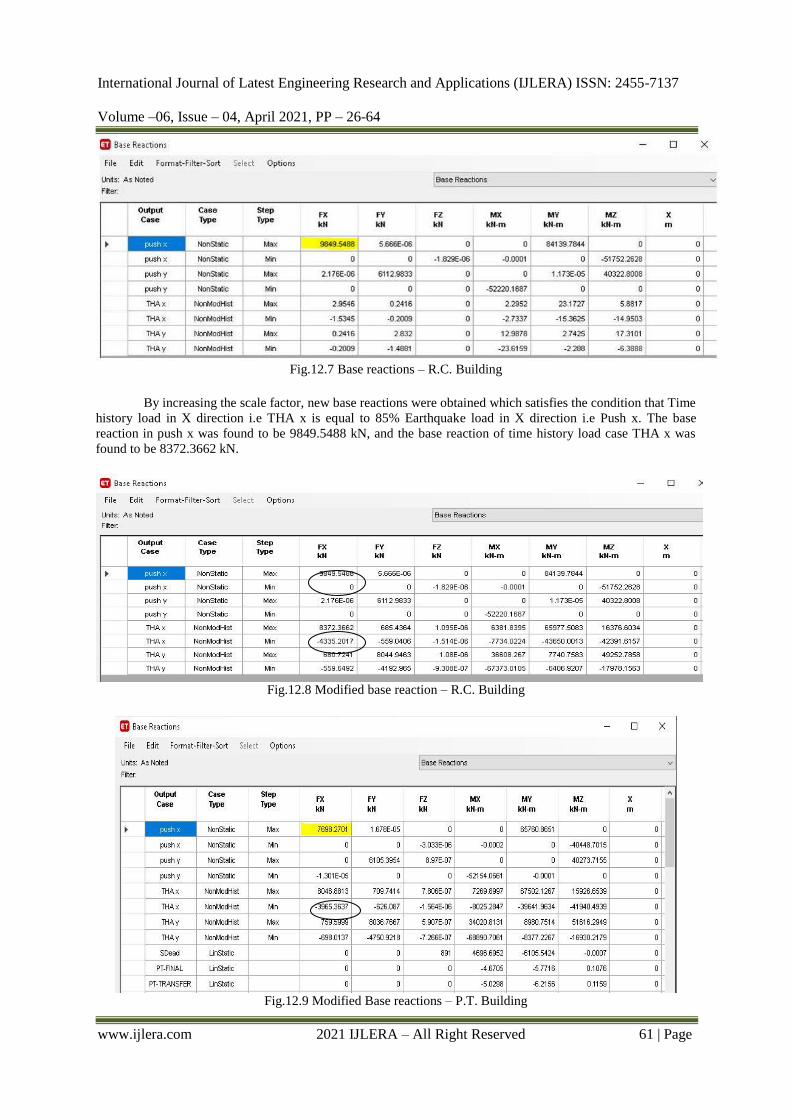
12.2.3 Structure Results
Base reactions are the sum of the vertical force acting at the supports.
International Journal of Latest Engineering Research and Applications (IJLERA) ISSN: 2455-7137
Volume –06, Issue – 04, April 2021, PP – 26-64
www.ijlera.com 2021 IJLERA – All Right Reserved 61 | Page
Fig.12.7 Base reactions – R.C. Building
By increasing the scale factor, new base reactions were obtained which satisfies the condition that Time
history load in X direction i.e THA x is equal to 85% Earthquake load in X direction i.e Push x. The base
reaction in push x was found to be 9849.5488 kN, and the base reaction of time history load case THA x was
found to be 8372.3662 kN.
Fig.12.8 Modified base reaction – R.C. Building
Fig.12.9 Modified Base reactions – P.T. Building
International Journal of Latest Engineering Research and Applications (IJLERA) ISSN: 2455-7137
Volume –06, Issue – 04, April 2021, PP – 26-64
www.ijlera.com 2021 IJLERA – All Right Reserved 62 | Page
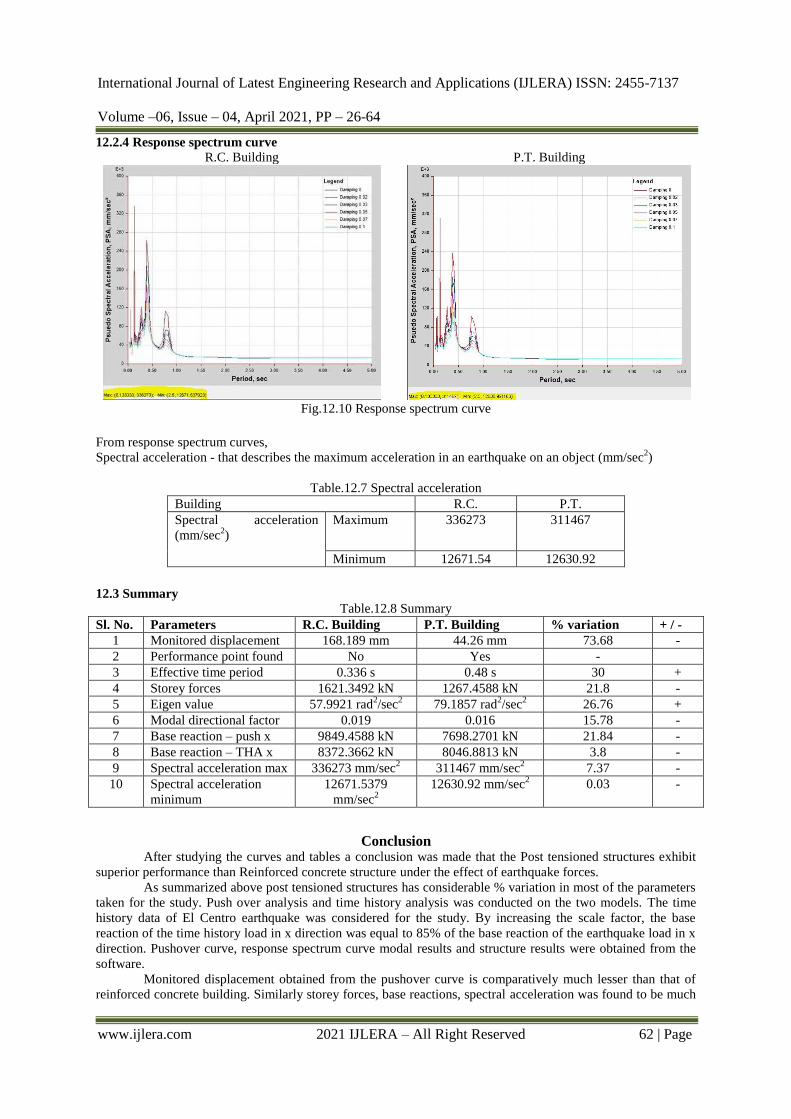
12.2.4 Response spectrum curve
R.C. Building P.T. Building
Fig.12.10 Response spectrum curve
From response spectrum curves,
Spectral acceleration - that describes the maximum acceleration in an earthquake on an object (mm/sec2)
Table.12.7 Spectral acceleration
Building R.C. P.T.
Spectral acceleration
(mm/sec2)
Maximum 336273 311467
Minimum 12671.54 12630.92
12.3 Summary
Table.12.8 Summary
Sl. No. Parameters R.C. Building P.T. Building % variation + / -
1 Monitored displacement 168.189 mm 44.26 mm 73.68 -
2 Performance point found No Yes -
3 Effective time period 0.336 s 0.48 s 30 +
4 Storey forces 1621.3492 kN 1267.4588 kN 21.8 -
5 Eigen value 57.9921 rad2/sec
2 79.1857 rad
2/sec
2 26.76 +
6 Modal directional factor 0.019 0.016 15.78 -
7 Base reaction – push x 9849.4588 kN 7698.2701 kN 21.84 -
8 Base reaction – THA x 8372.3662 kN 8046.8813 kN 3.8 -
9 Spectral acceleration max 336273 mm/sec2
311467 mm/sec2 7.37 -
10 Spectral acceleration
minimum
12671.5379
mm/sec2
12630.92 mm/sec2 0.03 -
Conclusion
After studying the curves and tables a conclusion was made that the Post tensioned structures exhibit
superior performance than Reinforced concrete structure under the effect of earthquake forces.
As summarized above post tensioned structures has considerable % variation in most of the parameters
taken for the study. Push over analysis and time history analysis was conducted on the two models. The time
history data of El Centro earthquake was considered for the study. By increasing the scale factor, the base
reaction of the time history load in x direction was equal to 85% of the base reaction of the earthquake load in x
direction. Pushover curve, response spectrum curve modal results and structure results were obtained from the
software.
Monitored displacement obtained from the pushover curve is comparatively much lesser than that of
reinforced concrete building. Similarly storey forces, base reactions, spectral acceleration was found to be much

International Journal of Latest Engineering Research and Applications (IJLERA) ISSN: 2455-7137
Volume –06, Issue – 04, April 2021, PP – 26-64
www.ijlera.com 2021 IJLERA – All Right Reserved 63 | Page
less for P.T. building, proving the superior performance. Effective time period was found to be 30% higher for
P.T. Building indicating lesser probability for collapse than R.C. Building.
References [1]. Aysha S, (2021), Seismic analysis on a plan irregular multistorey commercial building using etabs,
International Journal of Advance Engineering and Management (IJAEM), Volume 3, Issue 04, pp:89-
117
[2]. Chatali Patel, Payal Patel, Grishma Thaker,(2018), Pushover analysis of High rise RCC buildings with
vertical irregularities, International Journal of Advance Engineering and Research Development
(IJAERD), Volume 5, Issue 05
[3]. P. Lestuzzi, H. Harif, (2018), Nonlinear Time-History Analysis for Validation of the Displacement-
Based Seismic Assessment of the RC Upper Bridge of a Dam, Advances in civil engineering,
Volume 2018, Article ID 9879101,13 pages
[4]. B.G Nareshkumar, Punith.N, Arun Kumar G.N, T.M Prakash, (2018) Comparative Study on Stiffness
Regular and Stiffness Irregular Building Subjected to Seismic Load using Pushover Analysis,
International Journal of Engineering Research & Technology (IJERT), Volume 7, Issue 05
[5]. S.M Patil, Y.M Pudale, V.V Nair,(2018), Study of pushover analysis of vertical irregular structures,
International journal for advance research in science and engineering (IJARSE), Volume 7, Special
issue No. 07
[6]. Jnanesh Reddy R K, Pradeep A R (2017) Comparative Study of Post Tensioned and RCC Flat Slab in
Multi-Storey Commercial Building, , International Research Journal of Engineering and Technology
(IRJET) e-ISSN: 2395 - 0056, p-ISSN: 2395-0072,Volume 4 Issue: 06
[7]. Namani Saikiran, T.Parimala (2017), Study of irregular RC frame buildings under seismic,
International journal of research sciences and advanced engineering (IJRAE), Volume 2, Issue 18, pp :
30-36
[8]. Anju Nayas, Minu Antony, (2017), Push over analysis of plan irregular RC buildings with special
columns, International Journal of Engineering Research & Technology (IJERT), Volume 6, Issue 05
[9]. A.M Mwafy, S.Khalifa, (2017), Impacts of vertical irregularity of seismic design of high rise buildings,
16th
world conference on earthquake, 16WCEE 2017 Santiago Chile, January 9th to 13th
[10]. Alhamd Farqaleet, Akil Ahmed, (2016), Push over analysis and time history analysis of irregular RCC
building frames, Journal of civil engineering & Environmental technology, Volume 3, Issue 09, pp:
737-743
[11]. J.Shaikh Sameer, S.B Shinde, (2016), Seismic response of vertically irregular RC frame with mass
irregularity, Journal of civil engineering & Environmental technology, Volume 7, Issue 05, pp: 257-
264
[12]. S M. Muneer Ahammed , Mr. J. Vara Prasad, (2016), Pushover Analysis For Seismic Assessment Of
High Rise Building Using Etabs, International Journal of Research , Volume 3, Issue 13
[13]. Patil Sadhana M. , D.N.Shinde , (2016), Comparative Pushover Analysis of High Rise RCC Building
Frame with and Without Vertical Irregularities, International research journal of engineering and
technology( IRJET), Volume 3, Issue 18
[14]. Md. Abdul Bari, Prof. Shaik Abdulla, (2016) Linear and Non Linear (Pushover) Analysis of An
Irregular Shape Multistorey Building with Different Shear Wall Position, International Journal of
Engineering Research & Technology (IJERT), Volume 7, Issue 05
[15]. Keerthan M S , Dr. B S Jayashankar Babu, (2016), Seismic Performance Study of RC Frames with
Mass Irregularity from Pushover Analysis, International journal of engineering science and computing
(IJESC), Volume 6, Issue 07
[16]. Mirjunaidali kazi, Ayaz N Shaikh, (2016), Pushover Analysis of Reinforced concrete building with and
without vertical Geometric Irregularity, International research journal of engineering and technology(
IRJET), Volume 3, Issue 18
[17]. Adiya N.Gumble, Dr. Prakash S.Pajgade, (2015) Comparison between Specially Shaped Columns And
Rectangular Columns in RC Structure, International Journal of Advance Engineering and Technology,
Volume 2, Issue 05.
[18]. Dr.Mohd.Hamraj, (2014), Performance based pushover analysis of RC.C frames for plan irregularity,
International journal for science, engineering and technology (IJSET), Volume 2, Issue 07
[19]. Mohommed Anwaruddin Md. Akberuddin, Mohd. Zameeruddin Mohd. Saleemuddin, (2013), Pushover
Analysis of Medium Rise Multi-Storey RCC Frame With and Without Vertical Irregularity,

International Journal of Latest Engineering Research and Applications (IJLERA) ISSN: 2455-7137
Volume –06, Issue – 04, April 2021, PP – 26-64
www.ijlera.com 2021 IJLERA – All Right Reserved 64 | Page
International journal of engineering research and application (IJERA), Volume 3, Issue 05, pp : 540-
546
[20]. A S Patil, P D Kumbhar, (2013) Time history analysis of multistoried RCCbuildings for different
seismic intensities, IJSCER
[21]. Boskey Bahoria, Prof.R.S.Deotale, Dr.D.K.Parbat (2010) Comparative Design of RCC & Post-
tensioned flat slabs, ,Institute of Technology, Nirma University, Ahmedabad – 382 481, 09-11
December
[22]. F. Khoshnoudian , S.A. Mohammad,(2008), Seismic response evaluation of irregular high rise
structures by modal pushover analysis, The 14th
World Conference on Earthquake Engineering ,
October 12-17, Beijing China
[23]. U. Prawatwong, C.H. Tandian and P. Warnitchai (2008) Seismic performance of post–tensioned
interior slabcolumn connections with and without drop panel, , The 14th World Conference on
Earthquake Engineering, Beijing, China October 12-17.
[24]. Chopra A.K, Goel R, (2004) Earthquake engineering and structural dynamics, International Journal of
Advance Engineering and Technology
[25]. American Society Of Civil Engineers, (2000) Pre-Standard and Commentary for the Seismic
Rehabilitation of Buildings, FEMA-356,
[26]. Faella G. and Kiiar V., (1998) Asymmetric Multi storey RC Frame Structures: Pushover versus Non
Linear Dynamic Analysis, Proceedings of 11th European Conference on Earthquake Engineering,
Balkema, Rotterdam, pp- 1123-1139.
[27]. Federal Emergency Management Agency, FEMA-273/274, NEHRP Guidelines and Commentary on
the Guidelines for the Seismic Rehabilitation of Buildings, Washington D C, USA, 1997.
[28]. Applied Technology Council, (1996) Seismic Evaluation and Retrofit of Concrete Buildings, ATC-40,
Volume 1 and 2, Report No. SSC 96- 01, Seismic Safety Commission
[29]. ASTM-A416M: 2002, (2002) Standard Specification for Steel Strand, Uncoated Seven-wire for
Prestress Concrete, ASTM International, USA.
[30]. IS 1893 (Part 1):2002 Indian Standard Criteria for Earthquake Resistant Design of Structures, Part 1
General Provisions and Buildings, (Fifth Revision).