What was the wider German population's response to rising antisemitism 1933-9?
date post
19-Dec-2015Category
view
219download
3
A Comparative Analysis of Croatian Immigrant's and the Australian Population's subjective quality
of life and self-perceived health status
Gorka VuletićRobert A. Cummins
School of PsychologyDeakin University

ObjectiveThe aim of the research is to compare the subjective quality of life and self-perceived health status in Croatian immigrants living in Melbourne with Australian population and examine associations between social support, physical and mental health status, sense of control and life satisfaction in this group.
Also, determine their major sources of satisfaction and dissatisfaction, and to discover links between such factors and health.

Croatian emigration
* Long tradition of immigration to Australia* Size of Croatian community in Australia:
60 000 - approximation
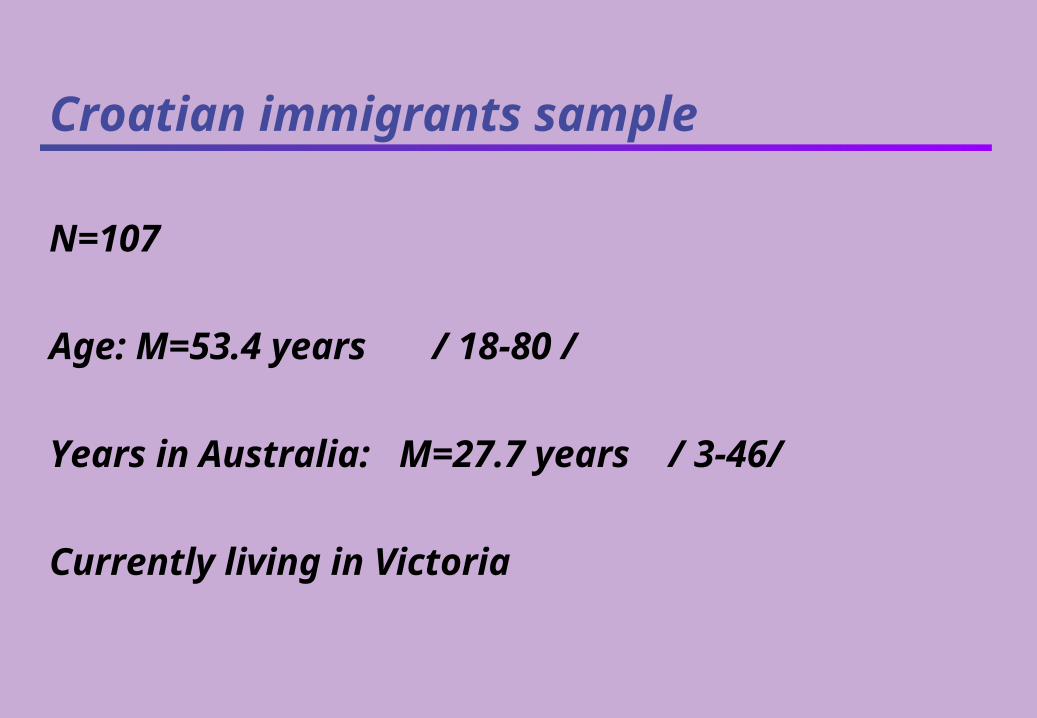
Croatian immigrants sample
N=107
Age: M=53.4 years / 18-80 /
Years in Australia: M=27.7 years / 3-46/
Currently living in Victoria

Distribution by gender
females N=64males N=44
males40.7%
females59.3%

Distribution of respondents regarding education and living status
Living status
w ith other persons19.4%
missing1.9%single
11.1%
w ith partner67.6%
Education
higher school/ university
17.6%
secondary school37.0%
primary school38.9%
missing3.7%
other2.8%

Self assessed health status
Instrument:
The short form – 36 health survey questionnaire (Ware et al. 1993)

SF-36• 36-item short-form health survey• dominant instrument designed to
assess health status
• it measures: physical functioning psychological functioning social functioning role performance perception of well being

36 items 9 scalesPF = physical functioningRP = role-physicalBP = bodily painGH = general healthVT = vitalitySF = social functioningRE = role-emotionalMH = mental healthHT = health transition
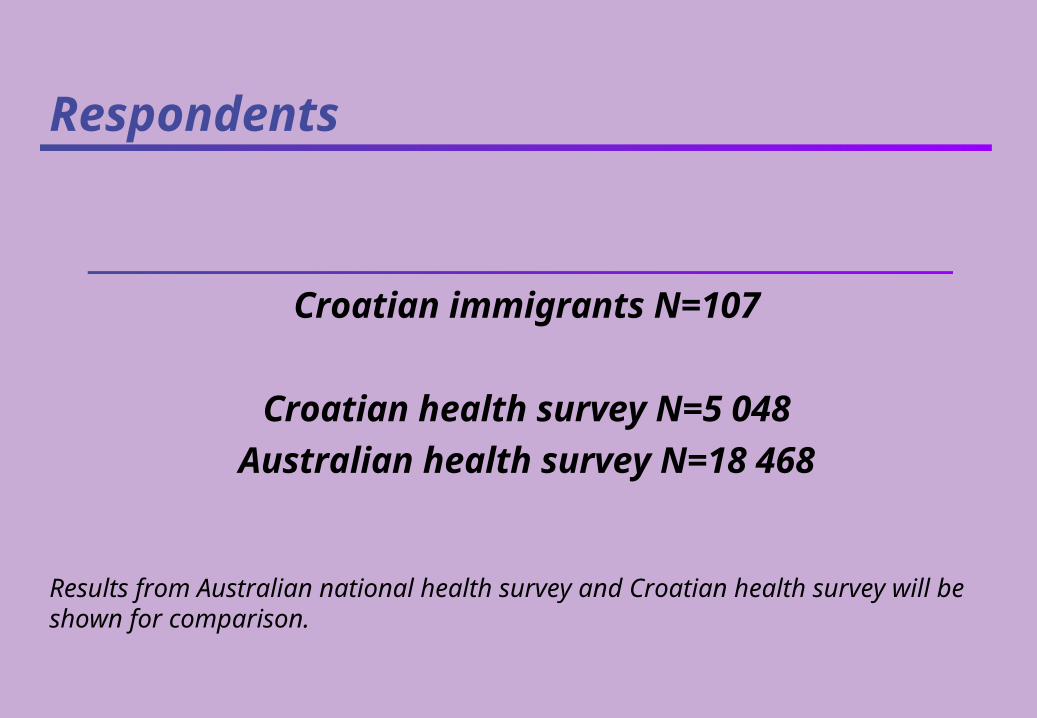
Respondents
Croatian immigrants N=107
Croatian health survey N=5 048Australian health survey N=18 468
Results from Australian national health survey and Croatian health survey will be shown for comparison.

Health status score distribution
Comparison between Croatian immigrants, Croatian and Australian general population in health status dimensions
0
10
20
30
40
50
60
70
80
90
100
Physicalfunctioning
Role physical Bodily pain General health Vitality Socialfunctioning
Role emotional Mental health
SF3
6 s
core
Croatian population-health survey Australian population-health survey Croatian immgrants

Quality of life
Instrument:
Comprehensive Quality of Life scale (Cummins, 1997)
Subjective part

QoL domains
7 domains:
material well being safetyhealth communityproductivity emotional well being intimacy
* measured through questions of importance and satisfaction

Subjective well-beingPopulation mean for the western countries:
70-80%SM
Croatian immigrants SWB M=74.7 %SM SD=10.7
N=107
Australian metropolitan sampleM=75.75 %SM SD=8.03 N=89

Domain importance
76.7
60.1
93.7
79.9
85.0
65.5
92.0
85.3
90.1
71.8
78.1
57.2
87.2
73.3
0
10
20
30
40
50
60
70
80
90
100%SM
material well-being
health productivity relationships safety community emotionalwell-being
Immigrants Australian

Domain importance
* high importance scores on all domains in immigrant group
* highest on Health and Relationships
* the biggest difference in importance on Community domain
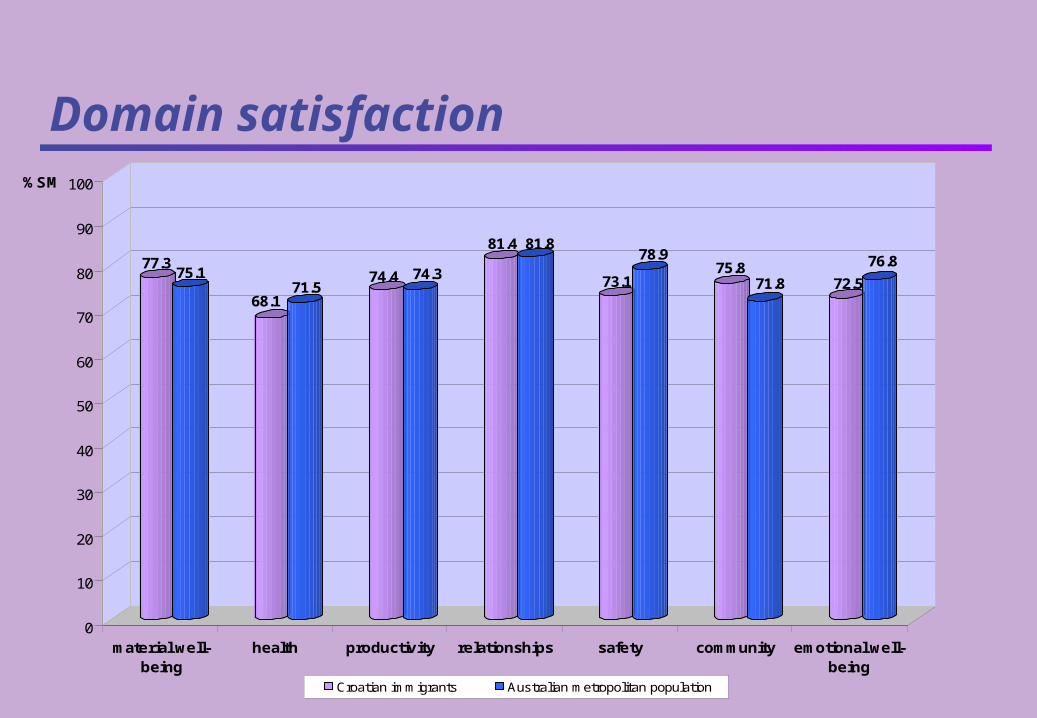
Domain satisfaction
77.375.1
68.171.5
74.4 74.3
81.4 81.8
73.1
78.975.8
71.8 72.5
76.8
0
10
20
30
40
50
60
70
80
90
100%SM
material well-being
health productivity relationships safety community emotional well-being
Croatian immigrants Australian metropolitan population
Domain satisfaction
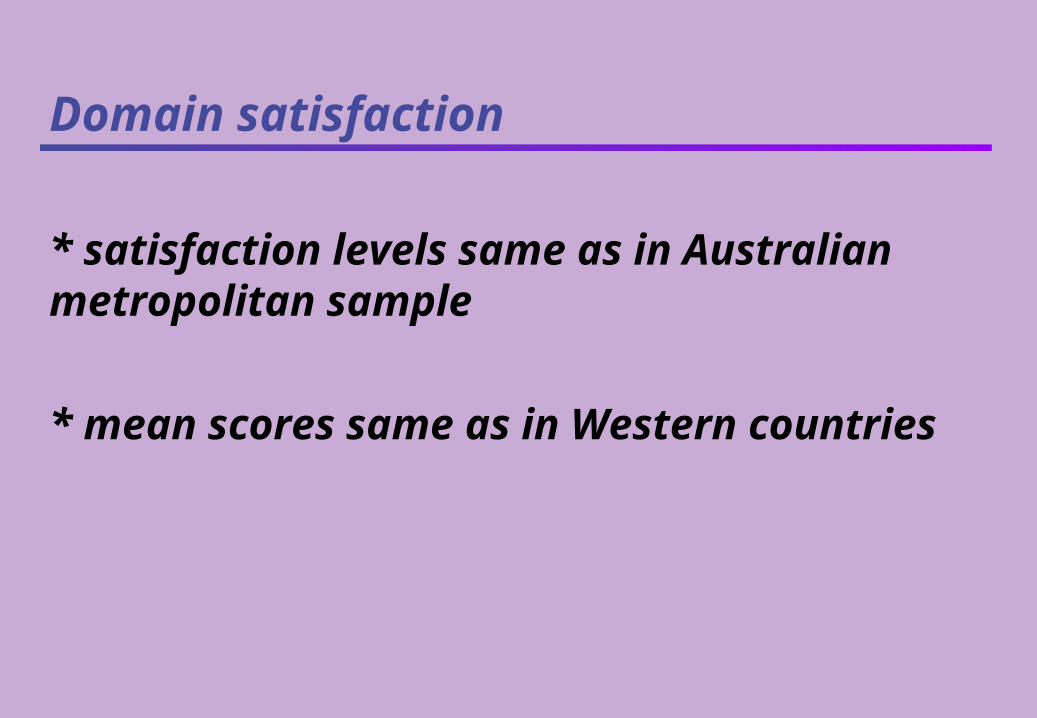
* satisfaction levels same as in Australian metropolitan sample
* mean scores same as in Western countries

Subjective well-being levelGroup I
SWB < 80%SM N=61
Group IISWB >= 80%SM N=43
groups equal by: age, education, living status, years in Australia

Subjective well-being < >HealthDIMENSION SWB < 80%SM SWB >= 80%SM
M M Sg.
Physical Functioning 61.0 74.6 0.01
Role limitation due to Physical problems 46.7 75.0 0.01
Role limitation due to Emotional problems 52.8 76.0 0.05
Social Functioning 57.2 70.3 0.01
Mental Health 61.0 72.3 0.01
Energy & Vitality 51.3 56.5
Pain 56.3 72.6 0.01
General Health Perception 49.9 65.7 0.01
Change in Health 48.7 54.1

Correlation Health - Subjective well-being
SWB
Subjective well-being (SWB) 1.000**
Physical Functioning .289**
Role limitation due to Physical problems .333**
Role limitation due to Emotional problems .324**
Social Functioning .414**
Mental Health' .460**
Energy Vitality .285**
Pain .394**
General Health Perception .500**
Change in Health .115
Age -.066
Years in Australia -.069
Education .135 **=sg. 0.01

Discussion and further research
* high importance ratings on all domains* satisfaction in the range 70-80%SM* strong correlation between self assessed health and SWB* further insight in social support