
GLOBULAR PROTEINS. TYPES OF PROTEINS GLOBULAR PROTEINS FIBROUS PROTEINS.
A CHANDRA X-RAY STUDY OF THE DENSE GLOBULAR CLUSTER TERZAN 5
C. O. Heinke, P. D. Edmonds, J. E. Grindlay, and D. A. Lloyd
Harvard College Observatory, 60 Garden Street, Cambridge,MA 02138;[email protected], [email protected], [email protected],
and
H. N. Cohn and P. M. Lugger
Department of Astronomy, IndianaUniversity, SwainWest 319, Bloomington, IN 47405;[email protected], [email protected]
Received 2002 December 16; accepted 2003March 3
ABSTRACT
We report a Chandra ACIS-I observation of the dense globular cluster Terzan 5. The previously knowntransient low-mass X-ray binary (LMXB) EXO 1745�248 in the cluster entered a rare high state during our2000 August observation, complicating the analysis. Nevertheless, nine additional sources clearly associatedwith the cluster are also detected, ranging from LXð0:5 2:5 keVÞ ¼ 5:6� 1032 down to 8:6� 1031 ergs s�1.Their X-ray colors, luminosities, and spectral fitting indicate that five of them are probably cataclysmicvariables and four are likely quiescent LMXBs containing neutron stars. We estimate the total number ofsources between LXð0:5 2:5 keVÞ ¼ 1032 and 1033 ergs s�1 as 11:4þ4:7
�1:8 by the use of artificial point source testsand note that the numbers of X-ray sources are similar to those detected in NGC 6440. The improved X-rayposition allowed us to identify a plausible infrared counterpart to EXO 1745�248 on our 1998Hubble SpaceTelescope NICMOS images. This blue star (F110W ¼ 18:48, F187W ¼ 17:30) lies within 0>2 of the bore-sighted LMXB position. Simultaneous Rossi X-Ray Timing Explorer spectra, combined with the Chandraspectrum, indicate that EXO 1745�248 is an ultracompact binary system and show a strong broad 6.55 keViron line and an 8 keV smeared reflection edge.
Subject headings: globular clusters: individual (Terzan 5) — novae, cataclysmic variables —stars: neutron — X-rays: binaries — X-rays: individual (EXO 1745�248)
1. INTRODUCTION
The high resolution of the Chandra X-Ray Observatoryhas enabled astronomers to study the low-luminosity X-raysource populations in globular clusters in great detail. Com-bined X-ray, radio, and optical Hubble Space Telescope(HST) studies of the globular cluster 47 Tucanae haverevealed quiescent low-mass X-ray binaries (qLMXBs) thathave not experienced X-ray outbursts in the history ofX-ray astronomy, cataclysmic variables (CVs) as X-rayluminous as any known in the field, flaring behavior fromcoronally active stellar binary systems, and predominantlythermal X-ray emission from millisecond pulsars (MSPs;Grindlay et al. 2001a, 2002). Similar populations have beenuncovered in the globular clusters NGC 6397 (Grindlayet al. 2001b), NGC 6752 (Pooley et al. 2002a), and ! Cen(Rutledge et al. 2002; Cool, Haggard, & Carlin 2002), whilethe luminosities and broad X-ray spectral types of thesesources have allowed classification of sources in the moreobscured cluster NGC 6440 (Pooley et al. 2002b) and M28(Becker et al. 2003).
The globular cluster Terzan 5 contains a known transientLMXB, EXO 1745�248, which was first detected in a burst-ing state by Hakucho (Makishima et al. 1981), and has beenirregularly active since then (Johnston, Verbunt, & Hasinger1995 and references therein). EXO 1745�248 is one of thefew luminous globular cluster LMXBs not analyzed by Sidoliet al. (2001, hereafter SPO01) or Parmar et al. (2001), whoidentify spectral distinctions between normal and ultra-compact LMXBs. Ultracompact LMXBs, defined as havingperiods less than 1 hr, are thought to possess a degenerate
helium white dwarf secondary. Deutsch, Margon, &Anderson (2000) remark on the overabundance of ultracom-pact LMXBs in globular clusters and speculate that the shortperiods may be due to dynamical effects in globular clusters.
Terzan 5 also contains two identified MSPs, with manyadditional MSPs probably making up the extended steep-spectrum radio source at the cluster core (Lyne et al. 2000;Fruchter & Goss 2000). The high central density and largemass of Terzan 5 make it a rich target for studies of binarysystems, but its high reddening and severe crowding makeoptical and even infrared observations extremely difficult.The deepest infrared survey of Terzan 5 was performed withthe HST NICMOS camera by Cohn et al. (2002, hereafterCLG02). The extreme reddening indicates that the clusterparameters are best determined in the infrared. NICMOSobservations produced the first color-magnitude diagrams(CMDs) of Terzan 5 to reach the main-sequence turnoff(CLG02; see also Ortolani et al. 2001). Therefore we utilizethe new cluster parameters derived by CLG02 in our analy-sis, particularly the reddening, distance, core radius, andradial star count profiles. The attempt by Edmonds et al.(2001, hereafter EGC01) to identify EXO 1745�248 and theeclipsing MSP through time series variability analysis andcolor information did not uncover any promising candi-dates because of the crowding and overlapping Airy pro-files, although it did identify two truly variable stars, one ofwhich was shown to be an RR Lyrae variable.
This paper is organized as follows. Section 2.1 describesthe observations we used. Section 2.2 explains our methodsfor detecting sources and performing an astrometriccorrection based upon identification of serendipitous
The Astrophysical Journal, 590:809–821, 2003 June 20
# 2003. The American Astronomical Society. All rights reserved. Printed in U.S.A.
809

sources. Section 2.3 describes our search for an infraredcounterpart for EXO 1745�248, extending the work ofEGC01 by using our Chandra position. Section 2.4 classifiesthe faint X-ray sources and quantifies our detection incom-pleteness (due to the outburst of EXO 1745�248). Section2.5 attempts to make simple spectral fits to the faint sources,while x 2.6 examines the simultaneous Rossi X-Ray TimingExplorer (RXTE) and Chandra spectra of EXO 1745�248.Section 3.1 compares our spectral analysis of EXO1745�248 with other observations of LMXBs. Section 3.2recalculates the central density and collision frequency ofTerzan 5, while x 4 summarizes our conclusions.
2. ANALYSIS
2.1. Description of Observations
The Chandra X-Ray Observatory observed the globularcluster Terzan 5 on 2000 July 24 for 45 ks (0546 to 1822 TT)and on 2000 July 29 for 5 ks (0056 to 0920 TT) with theACIS-I instrument at the focus. Because of an error in theobservation upload, both exposures were performed in 1/8subarray mode (as intended for the shorter observationonly), with frame times of 0.841 s (longer exposure withmore chips) and 0.541 s. EXO 1745�248 entered an out-burst during 2000 July, its 2–10 keV flux varying between 54and 600 mcrab during July and August, approaching itsEddington limit at maximum flux (Markwardt et al. 2000a,2000b). RXTE All-Sky Monitor (ASM) observations(results provided by the ASM/RXTE team)1 show that the2–10 keV count rate from EXO 1745�248 on 2000 July 24was 5:3� 0:9 counts s�1 (�72 mcrab) during our longerChandra observation, rising to 9:8� 0:9 counts s�1 in thesecond observation (Fig. 1).
Unfortunately, the Chandra observation of EXO1745�248 was not optimized to study such a brightobject (Fig. 2). The intense photon flux led to severepileup, which occurs when two or more photons landingin the same or adjacent pixels between frames arerecorded as a single event. Pileup can increase the energyof recorded events or, by altering the grade of therecorded event to a ‘‘ bad ’’ grade, cause the rejection ofthe event either before or after telemetry to the ground.(See the Chandra Proposer’s Observatory Guide, vol. 5,chap. 6.) In this case the pileup was severe enough tocause the pretelemetry rejection of all events recordedwithin �100 of the LMXB position. The X-ray halo of theLMXB, by increasing the local background, greatlydegraded our sensitivity to faint cluster sources. (Thehalo is due to a combination of dust grain scattering andthe intrinsic breadth of the point-spread function of theChandra mirrors.) Nevertheless, the spectacular resolutionof Chandra did allow us to identify additional point sour-ces up to 105 times fainter within 1000 of EXO 1745�248.The readout streak (caused by photons from EXO1745�248 arriving during the readout of the CCD) alsodegraded our survey, but we were able to extract a usefulspectrum of EXO 1745�248 from the readout streak. Wealso analyzed a simultaneous RXTE pointed observationfrom the HEASARC archive2 (on 2000 July 24, 1515 to1616 TT) for broad spectral coverage of the outburst ofEXO 1745�248. The HST NICMOS data we used tosearch for a possible infrared counterpart to EXO1745�248 are described in EGC01 and CLG02.
1 See http://xte.mit.edu/.
500 1000 1500
0
10
20
30
Fig. 1.—RXTE All-Sky Monitor light curve of the LMXB EXO1748�25 in Terzan 5. The dates of the Chandra and HST observations aremarked.
2
3
4
5
6
7
8
9
10
Fig. 2.—Chandra ACIS-I image of the globular cluster Terzan 5, energyrange 0.5–2.0 keV. The dominant feature is the piled-up halo from theLMXB EXO 1745�248 in its high state. The streak is due to out-of-timeLMXB events recorded during the frame transfer, and the position of theLMXB has no good events, due to pulse saturation. Several other sourcesare visible, marked with 100 circles and indicated with their shorthandnames. The cluster core is indicated with a 7>9 (rc) circle.
2 Available at http://heasarc.gsfc.nasa.gov/docs/corp/data.html.
810 HEINKE ET AL. Vol. 590

2.2. Detection and Astrometry
We used the CIAO software package3 to search for pointsources, produce hardness ratios, and extract spectra andlight curves.We reprocessed the two observations to removethe pixel randomization added in standard processing andmerged the two observations. No periods of high back-ground flaring were observed. The X-ray halo of EXO1745�248 displays an X-ray color (defined here as2:5 log½ð0:5 1:5 keV countsÞ=ð1:5 6 keV countsÞ�, follow-ing Grindlay et al. 2001a) of �2.9, harder than most knownfaint globular cluster sources. Therefore, we selected a softband, 0.5–2 keV, to search for point sources. We selected a2:5� 104 pixel (1.7 arcmin2) square region including thecluster and ran WAVDETECT with the significancethreshold set to give false positives at the rate of 10�4.WAVDETECT indeed found two spurious sources (identi-fied as spurious by eye and by not appearing in more thanone energy band) far from the cluster, as expected. Withinthree optical core radii (2400) we identify nine point sourcesbesides EXO 1745�248, each confirmed by visual inspec-tion (see Fig. 2) and with significance above 2.8 �. We namethe nine additional real sources in Table 1 with both posi-tional names and simple reference names W2 through W10(used in the rest of this paper). Outside the globular cluster,we binned the remaining data into 100 pixels and searchedfor back- or foreground serendipitous sources (setting thesignificance threshold to a false rate of 10�6). We identifiedfour sources that also pass visual inspection on the activeportions (36 arcmin2) of the ACIS-I array. As they are allmore than 20 (2.5 half-mass radii) from the cluster center, wehereafter identify them as ‘‘ serendipitous sources.’’ TheROSAT source S2 from Johnston et al. (1995) was notincluded in the field of view. Inspection of the locations ofthe known millisecond pulsars (A and C; Lyne et al. 2000)shows no evidence of X-ray emission (using the astrometrybelow). The upper limits are 3 and 5 counts, respectively, in
the 0.5–2 keV band, giving LX � 2� 1031 and �3� 1031
ergs s�1 for a power law of photon index 2. These are wellabove the X-ray luminosities of all identified millisecondpulsars in 47 Tuc (Grindlay et al. 2002), NGC 6397(Grindlay et al. 2001b), and NGC 6752 (D’Amico et al.2002) but below the luminosity (LX ¼ 1:1� 1033 ergs s�1) ofthe MSP B1821�24 in M28 (Danner et al. 1997). Soft ther-mal spectra give even less constraining limits, because of thehigh extinction. The two variables identified by EGC01 arealso not seen, as expected based on their RR Lyrae andprobable eclipsing blue straggler identifications.
Inspection of a Digital Sky Survey image reveals that oneof the serendipitous sources has a probable optical counter-part. According to the Guide Star Catalog 2.2, a star withV ¼ 13:56 andR ¼ 13:22 is located only 0>36 from the posi-tion derived byWAVDETECT for the X-ray source that wename CXOU J174803.3�244854. This is consistent with the0>6 absolute astrometry (90% confidence level radius)reported by Aldcroft et al. (2000) for Chandra. We estimatea probability of a positional coincidence within 0>5 of oneof the 15 brightest stars on the 70 � 70 survey plate with anyof the four serendipitous X-ray sources of 8� 10�5.Another X-ray source (CXOU J174812.6�244811.1) has afaint star (R ¼ 16:8) 0>14 away (when the frame is shifted tomatch star 1). We estimate the chances of a star this brightor brighter landing within 0>5 of one of four Chandra sour-ces as 4� 10�3. The other two X-ray sources show no starsin the GSC 2.2 catalog within 300. We shift our Chandraframe by +0 9004 in right ascension and +0>396 in declina-tion to match the weighted GSC 2.2 star positions.4
The V and R magnitudes of star 1 suggest an F star, andthe X-ray (0.5–2.5 keV) to V-band flux ratio (V-band fluxdefined as 10�0:4V�5:43 ergs cm�2 s�1) is 2� 10�4, on the highend of values for nearby F stars (Hunsch et al. 1999). Star 2
4 GSC 2.2 absolute astrometric errors, when compared with theinternational celestial reference frame, are of order 0>3–0>75; see http://www-gsss.stsci.edu/gsc/gsc2/GSC2home.htm.
TABLE 1
Names, Positions, and Counts of Detected Sources
Source Name (Label)
R.A.
(J2000.0)
Decl.
(J2000.0)
0.5–4.5 keV
(counts)
0.5–1.5 keV
(counts)
1.5–6 keV
(counts)
EXO 1745�248 (LMXB) .................................. 17 48 05.196 � 0.015 �24 46 47.40 � 0.20 . . . . . . . . .CXOGLB J174806.1�244642.9 (W2) ............... 17 48 06.154 � 0.005 �24 46 42.68 � 0.07 37 � 10 11 � 4 20 � 10
CXOGLB J174805.3�244637.7 (W3) ............... 17 48 05.370 � 0.004 �24 46 37.66 � 0.05 77 � 13 30 � 6 41 � 13
CXOGLB J174804.7�244644.6 (W4) ............... 17 48 04.799 � 0.003 �24 46 44.64 � 0.06 17 � 19 15 � 7 �1 � 21
CXOGLB J174804.4�244638.2 (W5) ............... 17 48 04.402 � 0.006 �24 46 38.15 � 0.09 81 � 11 13 � 4 80 � 12
CXOGLB J174804.3�244703.8 (W6) ............... 17 48 04.366 � 0.004 �24 47 03.75 � 0.07 180 � 16 22 � 5 208 � 17
CXOGLB J174804.2�244641.8 (W7) ............... 17 48 04.214 � 0.005 �24 46 41.79 � 0.09 85 � 11 10 � 4 86 � 12
CXOGLB J174804.2�244648.4 (W8) ............... 17 48 04.225 � 0.05 �24 46 48.34 � 0.2 34 � 12 15 � 5 30 � 12
CXOGLB J174804.0�244640.5 (W9) ............... 17 48 04.059 � 0.009 �24 46 40.53 � 0.06 50 � 10 4 � 3 53 � 11
CXOGLB J174803.5�244649.2 (W10).............. 17 48 03.539 � 0.005 �24 46 49.24 � 0.08 69 � 11 8 � 4 75 � 12
Sources not associated with Terzan 5:
CXOU J174803.3�244854.1 (star 1).............. 17 48 03.334 � 0.004 �24 48 54.04 � 0.06 45 � 8 36 � 7 9 � 5
CXOU J174751.7�244657.4 ......................... 17 47 51.726 � 0.010 �24 46 57.42 � 0.11 36 � 7 9 � 4 35 � 7
CXOU J174814.7�244802.2 ......................... 17 48 14.703 � 0.011 �24 48 02.21 � 0.12 29 � 7 7 � 4 28 � 6
CXOU J174812.6�244811.1 (star 2).............. 17 48 12.649 � 0.010 �24 48 11.10 � 0.13 28 � 8 20 � 6 6 � 5
Note.—Sources detected in and around Terzan 5. Units of right ascension are hours, minutes, and seconds, and units of declination are degrees,arcminutes, and arcseconds. Errors are centroiding errors within the (shifted to match GSC 2.2) Chandra frame and do not includesystematic errors incurred in matching to other frames (absolute errors perhaps 0>5; see text). Counts in each energy band were determined bysubtracting the average count rate in surrounding 200 annulus from the counts in a 100 circle around source position (leading to one negative entry).
3 Available at http://cxc.harvard.edu/ciao/.
No. 2, 2003 TERZAN 5 811
has no color information in the GSC 2.2 catalog. AssumingV � R � 1:5 (appropriate for M2 stars) gives a flux ratioof 1� 10�2, which is common among M stars (Hunschet al. 1999). The other two sources may be backgroundactive galactic nuclei (AGNs), or (perhaps more likely)CVs in the galactic bulge. Both show an Xcolor2:5 log½ð0:5 1:5 keV countsÞ=ð1:5 6 keV countsÞ� of �1.5,indicating strong absorption. Simple spectral fitting of thebrighter source gives NH ¼ 2:8þ2:4
�1:2 � 1022 cm�2 for a powerlaw of photon index 1.7, typical for AGNs. A 10 keVbremsstrahlung spectrum (as for a bulge CV) would haveNH ¼ 2:7þ2:5
�1:2 � 1022 cm�2. The 2–10 keV logN–logS rela-tion of Giacconi et al. (2001) suggests that 1–3 AGNs maybe expected at these observed flux levels in our ACIS-I sub-array field (although the location of detected sources nearthe aim point suggests that our sensitivity is not uniformacross the field). Recent results from galactic bulge surveys(Grindlay et al. 2003) indicate that bulge CVs or compactbinaries outnumber AGNs at these flux levels, suggestingthat these two sources may be bulge CVs.
We found the position of EXO 1745�248 by centeringthe symmetric ‘‘ hole ’’ caused by extreme pileup and thereadout streak. We estimate our error in this determinationat 2/5 of a pixel, or 0>2. We present the positions (in theGSC 2.2 frame) of EXO 1745�248, the nine additionalglobular cluster sources, and the four serendipitous sources(with relative positional errors from WAVDETECT) inTable 1, along with the background-subtracted counts inthree bands.
2.3. Identification of Plausible Infrared Counterpartto EXO 1745�248
Our refined position for EXO 1745�248 allowed us toundertake a careful search of the small Chandra error circlein the 1998 June Hubble Space Telescope NIC2 F110W andF187W data, for which the photometric analysis isdescribed in EGC01. We estimate an error of 0>1 in the shiftto the GSC 2.2 frame, based on the scatter of the two starsused in the boresighting. An additional error of 0>37 (fol-lowing EGC01) is incurred in the shift between the GSC 2.2and HST NICMOS frames. Combining these with the 0>2centering positional uncertainty gives an error for theposition in the NICMOS frame of 0>4. This error circle isfortuitously free of bright red giants. Error circles for sixother X-ray sources in the cluster lie wholly or partiallywithin the NIC2 field of view.
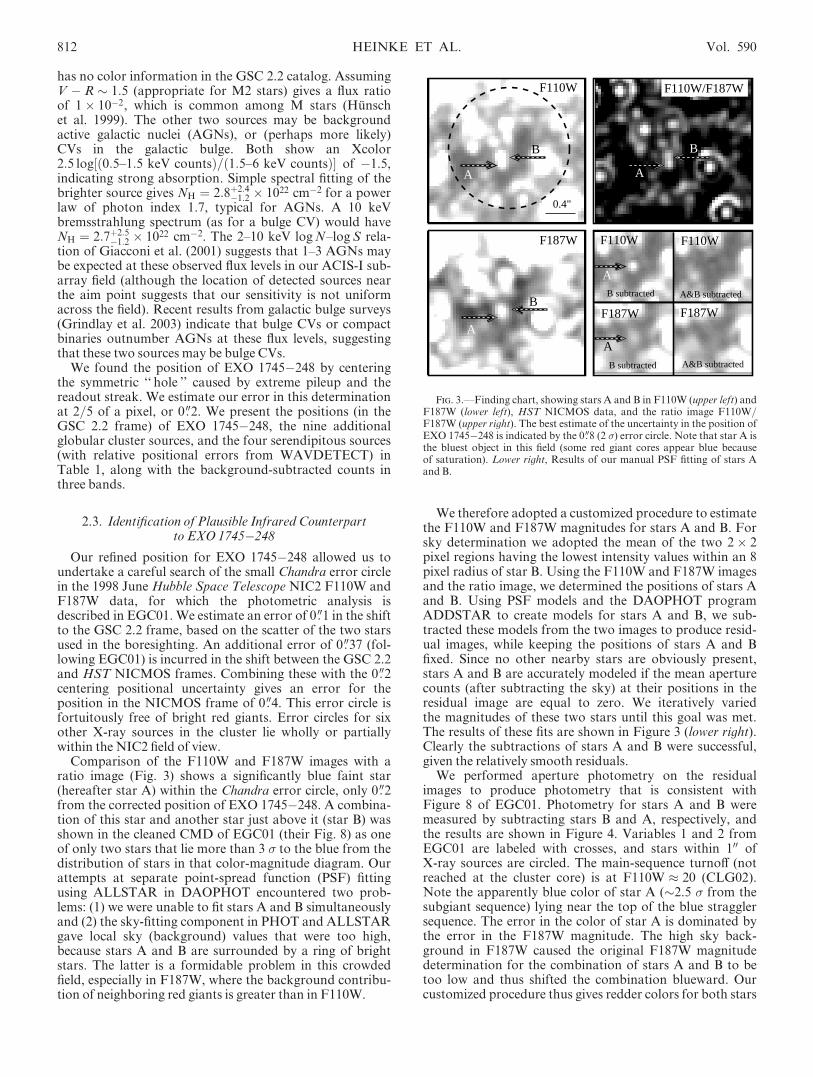
Comparison of the F110W and F187W images with aratio image (Fig. 3) shows a significantly blue faint star(hereafter star A) within the Chandra error circle, only 0>2from the corrected position of EXO 1745�248. A combina-tion of this star and another star just above it (star B) wasshown in the cleaned CMD of EGC01 (their Fig. 8) as oneof only two stars that lie more than 3 � to the blue from thedistribution of stars in that color-magnitude diagram. Ourattempts at separate point-spread function (PSF) fittingusing ALLSTAR in DAOPHOT encountered two prob-lems: (1) we were unable to fit stars A and B simultaneouslyand (2) the sky-fitting component in PHOT and ALLSTARgave local sky (background) values that were too high,because stars A and B are surrounded by a ring of brightstars. The latter is a formidable problem in this crowdedfield, especially in F187W, where the background contribu-tion of neighboring red giants is greater than in F110W.
We therefore adopted a customized procedure to estimatethe F110W and F187W magnitudes for stars A and B. Forsky determination we adopted the mean of the two 2� 2pixel regions having the lowest intensity values within an 8pixel radius of star B. Using the F110W and F187W imagesand the ratio image, we determined the positions of stars Aand B. Using PSF models and the DAOPHOT programADDSTAR to create models for stars A and B, we sub-tracted these models from the two images to produce resid-ual images, while keeping the positions of stars A and Bfixed. Since no other nearby stars are obviously present,stars A and B are accurately modeled if the mean aperturecounts (after subtracting the sky) at their positions in theresidual image are equal to zero. We iteratively variedthe magnitudes of these two stars until this goal was met.The results of these fits are shown in Figure 3 (lower right).Clearly the subtractions of stars A and B were successful,given the relatively smooth residuals.
We performed aperture photometry on the residualimages to produce photometry that is consistent withFigure 8 of EGC01. Photometry for stars A and B weremeasured by subtracting stars B and A, respectively, andthe results are shown in Figure 4. Variables 1 and 2 fromEGC01 are labeled with crosses, and stars within 100 ofX-ray sources are circled. The main-sequence turnoff (notreached at the cluster core) is at F110W � 20 (CLG02).Note the apparently blue color of star A (�2.5 � from thesubgiant sequence) lying near the top of the blue stragglersequence. The error in the color of star A is dominated bythe error in the F187W magnitude. The high sky back-ground in F187W caused the original F187W magnitudedetermination for the combination of stars A and B to betoo low and thus shifted the combination blueward. Ourcustomized procedure thus gives redder colors for both stars
F187W
F110WF187W F110W
F110W
A
F187W
BB
A
A
BB subtracted
0.4"
B subtracted
A&B subtracted
F110W/F187W
A&B subtracted
A
A
Fig. 3.—Finding chart, showing stars A and B in F110W (upper left) andF187W (lower left), HST NICMOS data, and the ratio image F110W/F187W (upper right). The best estimate of the uncertainty in the position ofEXO 1745�248 is indicated by the 0>8 (2 �) error circle. Note that star A isthe bluest object in this field (some red giant cores appear blue becauseof saturation). Lower right, Results of our manual PSF fitting of stars Aand B.
812 HEINKE ET AL. Vol. 590

A and B than the original determination for thecombination.
Given the blue appearance of star A in both the normaland residual images, the reasonable evidence for blue colorsin our photometric analysis, and its proximity to the centerof the X-ray error circle, star A is a reasonable candidate forthe IR counterpart to EXO 1745�248. No evidence is seenfor statistically significant variability of star A, but the faint-ness of star A and its strong blending with star B limits thedepth of variability searches. Only the F110W images areuseful for time series analysis, and only sparse coverage wasobtained here over 1.16 days. Images in the V and I pass-bands with the Advanced Camera (in high-resolution mode)on HST should do a much better job of separating stars Aand B and would provide much better constraints onvariability if taken at several different epochs near outburstand quiescence.
Since the F187W band does not correspond to anyground-based filter, standard calibrations for it do not exist.We apply rough transformations to estimate interestingquantities. We estimate the unreddened J magnitude fromthe F110W and F187Wmagnitudes by the equation
J0 ¼ F110Wþ 0:033� 0:178ðF110W� F187WÞ þ AJ ;
derived assuming that the spectral slope is constant over this
range. Using AJ=AV ¼ 0:282 and AV ¼ 6:75 (CLG02), wefind J0 ¼ 16:40 and MJ ¼ 1:7. We calculate the color(F110W� F187WÞ0 ¼ �0:17� 0:3. Assuming that thephotometry is accurate, three alternatives to an LMXBnature remain for this star: it could be a blue horizontal-branch star, it could be a blue straggler, or it could be a fore-ground star. We plot simple interpolated blue straggler andhorizontal-branch sequences in Figure 4. The position ofstar A may be consistent with that of a blue horizontal-branch star, although a blue horizontal branch has onlybeen hinted at in Terzan 5 (CLG02). It is also consistentwith an extremely heavy (more than twice the turnoff mass)blue straggler or a blue straggler binary (as variable 2 fromEGC01, plotted as an X next to star A in Fig. 4, may be).The other extremely blue star seen in Figure 4 is probably aforeground star, which also cannot be excluded as a possi-bility for star A. However, the chance of one of the fivebluest stars in the 19>2 square NIC2 field of view landing inthe 0>4 error circle by chance is only 7� 10�3. None of thestars in the other X-ray error circles (shown in Fig. 4) dis-play any unusual colors or variability. This is expectedbased upon the magnitudes of CVs and quiescent LMXBs,in the field and other globular clusters, which very rarelyreach the turnoff magnitude (Grindlay et al. 2001a, 2001b;Pooley et al. 2002a).
We compare this suggested counterpart with other low-mass X-ray binaries observed in the infrared by calculatingthe ratio of X-ray to infrared luminosity. Using the ASMlight curve in Figure 1, we see that the average ASM countrate for the 11 days leading up to the HST observation was1:5� 0:2 counts s�1, compared with 5:3� 0:9 counts s�1 atthe time of theChandra observation. The high source confu-sion near the galactic center for the ASM makes this datarelatively noisy, so we take 1.5 counts s�1 as an upper limiton the X-ray flux. Assuming the same spectrum as we find in2000 (see x 2.5), we derive an unabsorbed 0.5–10 keV X-rayflux of 6:1� 10�10 ergs cm�2 s�1 and an unabsorbed J-bandflux of 1:2� 10�13 ergs cm�2 s�1, thus logðLX=LJÞ � 3:7.We note that van Paradijs & McClintock (1995) findlog½LXð2 11 keVÞ=Loptð3000 7000 GÞ� � 2:7 for typicalbright LMXBs.
Rough ðJ � KÞ0 colors have been reported for thesoft X-ray transients in outburst QX Nor, orX1608�52 [0:5 < ðJ � KÞ0 < �0:4; Wachter 1997], SAXJ1808.4�3658 (0:1� 0:1; Wang et al. 2001), and the faintLMXB X1323�619 (�0:1� 1:4; Smale 1995). Our value ofðF110W� F187WÞ0 � �0:17� 0:3 for star A, implyingðJ � KÞ0 � �0:3, is consistent with this broad range. Infra-red colors observed by Wachter (1998) give an even broaderrange [�0:4 < ðJ � KÞ0 < 1:41], as some LMXBs are domi-nated by the disk light in the IR, while others are dominatedby the light of the secondary. This makes identification ofLMXBs by infrared colors very difficult and leaves ouridentification uncertain.
2.4. X-Ray Classification and Completeness
We extracted the numbers of counts within 100 radius ofthe sources (containing 90% of source flux5 at 1.5 keV) inthe 0.5–1.5, 0.5–4.5, and 1.5–6 keV bands. We then subtract1/3 (ratio of areas) of the counts from background 100–200
HB
BS seq.
Fig. 4.—Aperture photometry color-magnitude diagram of Terzan 5from the HST NIC2 camera (using highly dithered imaging via the drizzlealgorithm) on the core of Terzan 5. Stars from the photometry of EGC01within the seven 100 X-ray error circles are circled. X symbols mark the loca-tions of variable stars from EGC01 (X2 is the dimmer one). Two stars thatare more than 3 � to the blue of the distribution are indicated by < .>. Thelower is the blend of stars A and B (see text). The separately derived posi-tions of stars A and B are indicated, with errors from the photometry. Thehorizontal branch and the expected blue straggler sequence, terminating ina Kurucz model (Kurucz 1992) of a 1.6M� star (twice the turnoff mass) areindicated.
5 CXC Proposer’s Observatory Guide, http://cxc.harvard.edu/udocs/docs/docs.html.
No. 2, 2003 TERZAN 5 813

annuli around these sources for each band (except where theannuli would overlap with other sources, where we offsetthe extraction region). The results are listed in Table 1.Constructing an X-ray CMD (as in Grindlay et al. 2001a;Xcolor is defined as 2:5 log½ð0:5 1:5 keVcountsÞ=ð1:5 6 keV countsÞ�, while the vertical axis islog 0:5 4:5 keV counts½ �), we are able to identify two popu-lations of faint sources with distinct X-ray colors. UsingNH ¼ 1:2� 1022 cm�2 (derived from the estimate ofCLG02, AV ¼ 6:75, using Predehl & Schmitt’s [1995] con-version factor), we apply a uniform shift to the coordinatesof the CMD as Pooley et al. (2002b) do for the moderatelyreddened globular cluster NGC 6440. The identified dimsources (and the color of the LMXB halo, which determinesthe background) are plotted in Figure 5 (top). The upperand right axes show the raw (absorbed) Xcolor and counts,while the lower and left axes represent the corrected (unab-sorbed) Xcolor and counts. (We note that the interstellarmedium decreases soft fluxes more than hard fluxes. Thusthis simple shift of axes should be used with caution.)Another version of the same diagram, but plotting luminos-ities derived from spectral fits (x 2.5 below) against correctedXcolor as above, is shown in Figure 5 (bottom). Errors onthe vertical axis are derived from errors in the counts and donot include spectral uncertainties. This version of the dia-gram (inspired by Becker et al. 2003) is more useful for com-paring different clusters but depends on spectral andreddening assumptions. The luminosities of the two popula-tions roughly agree with the range observed for their respec-tive counterparts in 47 Tuc and NGC 6440. This suggeststhat the soft population (W2, W3, W4, and W8) should beidentified with qLMXBs containing neutron stars and thatthe harder population is composed of bright CVs.
We estimate our incompleteness, due to the X-ray haloand streak from the LMXB EXO 1745�248, by the use ofartificial-star tests. We generated uniform grids of artificialpoint sources at different luminosities by using the MARXsoftware6 and merged the simulated data with our 0.5–2.0keV master image to see whether we could detect the fakesources. We scaled the average (Poisson-distributed) countsof the artificial sources to the average detected counts of realsources for which XSPEC fitting gave the target luminosity(see x 2.5 below); e.g., for LX ¼ 1032 ergs s�1 sources, theaverage number of counts per simulated source was 20, andfor LX ¼ 3� 1032 ergs s�1 it was 45 counts. (The count-luminosity relation varied depending on the kind of sourcesprevalent at different luminosities.) We performed the testsfor artificial source 0.5–2.5 keV luminosities of 1032,1:7� 1032, 3� 1032, and 1033 ergs s�1, assuming spectrasimilar to the average of our detected sources. We separatedthe artificial sources by 500 so that each source would sufferonly the crowding that exists in the real data. We mergedgrids of point sources with theChandra image four times forthe 1032 and 1:7� 1032 tests and three times for the othertwo tests, shifting the grids by several arcseconds betweeneach trial. We then applied WAVDETECT to each image,keeping the same parameters as in x 2.2. We counted thenumber of artificial sources that landed within one opticalcore radius, between one and two core radii, and betweentwo and three core radii for each trial, and the number ofsources detected in each region, for a total of �1000 point
6 Available at http://space.mit.edu/ASC/MARX.
Fig. 5.—X-ray color-magnitude diagrams of Terzan 5. Top: Diagramproduced from the absorption-corrected counts in the 0.5–1.5, 0.5–4.5, and1.5–6 keV energy bands (lower and left axes), providing the observed colorsandmagnitudes (upper and right axes).We correct roughly for photoelectricabsorption by shifting the data +0.57 units on the left axis and +1.86 unitson the bottom axis. However, note that the effects of absorption are notuniform. The probable qLMXBs are marked by crosses, and probable CVsby filled triangles. We plot representative errors for a few points. Back-ground subtraction leavesW4 with�1 counts in the hard band; we show itsXcolor lower limit and counts range (it is clearly detected only in the softband). The Xcolor of the X-ray halo of EXO 1745�248 is indicated with adashed line and labeled ‘‘ LMXB Xcolor.’’ Bottom: Diagram producedusing the same absorption-corrected color for the x-axis, but using theunabsorbed 0.5–6 keV luminosity for the y-axis. Luminosities were derivedfrom best-fitting hydrogen atmosphere fits for W2, W3, W4, and W8 andbest-fitting thermal bremsstrahlung fits for W5, W6, W7, W9, and W10.Luminosity errors are based on 0.5–4.5 keV counting statistics and do notinclude uncertainties in spectral fitting.
814 HEINKE ET AL. Vol. 590
source trials. We note that this approach takes crowdinginto account, in that the test sources will be crowded by anyreal undetected sources. Parts of the 1–2 core radii annulusand 2–3 core radii annulus were imaged only in the 5 ksexposure and not in the 42 ks exposure. The (2–3)rc bin alsoincludes a small area that is completely unexposed (becauseof the use of the subarray). We scaled the MARX pointsource luminosities appropriately and performed separatetrials for the low-exposure regions (where sources below3� 1032 ergs s�1 were never detected) and then includedthese results in the total completeness calculations. Thisallowed an incompleteness factor to be determined for eachradial annulus for each of four luminosity bins, which wecreated by equally dividing (in a logarithmic sense) theranges between our test luminosities.
The number of real sources detected was too small toeffectively determine both a radial distribution and a lumi-nosity function (one source within rc, five within 1 to 2 timesrc, and three within 2 to 3 times rc). Therefore we assumed aluminosity function of the form dN / L��d lnL, L > Lmin,following Johnston &Verbunt (1996).We fixed � at 0.5 first,as found for sources between 1032 and 1033 ergs s�1 in NGC6440 (Pooley et al. 2002b) and the general globular clustersystem (Johnston & Verbunt 1996) and then allowed � tovary within the range 0.29–0.78 found by Pooley et al.(2002b). The uncertainty in our incompleteness due to dif-ferent possible values of � was small compared with errorsdue to small number statistics. For each annulus, we deter-mined an average incompleteness factor using the results ofour testing and the weights derived from the luminosityfunction for the luminosity bins as specified above.
To calculate how many sources were missed, we take thenumber of sources detected in each annulus and apply the1 � errors for small numbers given by Gehrels (1986). Thesenumbers and errors are multiplied by 1/f, where f is thecompleteness fraction, to obtain the average density ofsources in each annulus. Then we calculated the expectednumbers of missed sources by using the estimated densityand again applying small number errors. We ignore possiblesystematics in the method, since the random errors are solarge. Thus, above 1032 ergs s�1, we find that within rc wepredict 0:8þ2:8
�0:8 additional sources, within 1–2 times rcwe predict 1:5þ2:8
�1:3 additional sources, and within 2–3 timesrc we predict 1:1þ2:6
�1:0 sources, giving a total probable num-ber of 11:4þ4:7
�1:8 sources between 1032 and 1033 ergs s�1 inTerzan 5.We note that this source population is very similarto the 11 sources in this flux range identified in NGC 6440(Pooley et al. 2002b), as expected considering the similarcluster parameters (as derived in x 3.2 below).
The radial distribution we infer can be compared withthat predicted by a ‘‘ generalized King model ’’ (Lugger,Cohn, & Grindlay 1995) in which the surface density ofsources varies as
SxðrÞ /h1þ
� r
rc
�2i�X=2
;
where �X ¼ �ð3q� 1Þ and q ¼ mXh i= mh i, the ratio of theaverage X-ray system mass to the mass of the stars thatdominate the density profile (i.e., turnoff-mass stars forKing model clusters). The soft sources in 47 Tuc (thought tobe largely MSPs) have �X ¼ �3:6, and the CVs in 47 Tuchave �X ¼ �3:1 (Grindlay et al. 2002). Comparing the cor-rected source counts in each annulus with the predictions of
generalizedKing models with �X ¼ �2,�3, and�4, we finda best fit with �X ¼ �2, suggesting similarity in source massto the turnoff mass stars. However, the large uncertaintieson our source numbers (especially in the core) allow consis-tency with �X ¼ �3 in a �2 sense. We conclude that thesmall number of sources does not allow a sensitive test ofthe radial distribution and thus of the mass of the X-raysources. UpcomingChandra observations of Terzan 5 (prin-cipal investigator, R. Wijnands) should identify more X-raysources, allowing a better probe of the luminosity functionand radial distribution.
2.5. Spectral Fitting and Variability of Faint Sources
We extracted the spectra of the detected X-ray sources(except for EXO 1745�248; see x 2.6) from 100 radius circlesaround the WAVDETECT positions, with backgroundspectra taken from 100–200 annuli, using the PSEXTRACTCIAO script. We utilize the recently released ancillaryresponse file correction7 for the time-variable low-energyquantum efficiency degradation in all spectral fits in thispaper. This correction had a very small impact on our fits(in part because of the largeNH). We group the spectra withat least 10 counts per bin and fit models in XSPEC (Arnaud1996), all by using the near-infrared–derived value of photo-electric absorption (CLG02). The models used were thermalbremsstrahlung, a power law, and a hydrogen atmosphereappropriate for an accreting neutron star in quiescence(Lloyd 2003). Simple background subtraction is not the pre-ferred way to fit spectra from sources with high background,because of deviations from Poisson statistics in the sub-tracted counts. We verified that Sherpa spectral fitting ofsource and background simultaneously gives results withinthe errors of our XSPEC analysis for which we are able touse the same models, but we note that these low signal-to-noise spectra should be taken with caution.
A thermal bremsstrahlung spectrum of kTe5 keV seemsto describe most cataclysmic variables in the globular clus-ters 47 Tuc and NGC 6397 (Grindlay et al. 2001a, 2001b).We fixed the normalization of the hydrogen atmospheremodels to ðr=DÞ2 ¼ 132, where r in kilometers and D ismeasured in units of 10 kpc (appropriate for a 10 km neu-tron star at 8.7 kpc), and the redshift to 0.306. This tests forcompatibility with a canonical 1.4 M�, 10 km neutron star.A hard power-law component has been found to dominateqLMXB spectra above 2–3 keV in some systems but has notyet been identified in globular cluster qLMXBs that havenot displayed outbursts (see C. O. Heinke et al. 2003). Wemake no attempt to confirm or rule out such a hardcomponent in this paper because of the extremely highbackground (from EXO 1745�248) above 2 keV.
The results of our spectral fitting are shown in Table 2(errors are 90% confidence). All four sources on the rightside of the X-ray CMD (W2, W3, W4, and W8) are well fit-ted by our hydrogen atmosphere model. Alternative modelsrequire steep power-law spectra (� > 2) or bremsstrahlungtemperatures below 2 keV, not seen in bright (>1032 ergss�1) CV or millisecond pulsar systems (Grindlay et al.2001a, 2001b, 2002; Pooley et al. 2002a). Their high lumi-nosities of 3 6ð Þ � 1032 ergs s�1 and soft spectra rule outflaring coronal events from BY Dra or RS CVn binary
7 See http://cxc.harvard.edu/cal/Links/Acis/acis/Cal_prods/qeDeg/index.html.
No. 2, 2003 TERZAN 5 815

systems (see, e.g., Grindlay et al. 2001a). Therefore we con-clude that these are probably qLMXB systems. The fivesources on the left of the CMD (W5, W6, W7, W9, andW10) are well fitted by bremsstrahlung spectra with kT > 5keV, or power-law spectra with � ¼ 1:0–1.6, and are notacceptably fitted by hydrogen atmosphere models with thenormalization fixed to a 10 km radius. We conclude thatthese are most likely highly X-ray luminous cataclysmicvariables, though MSPs and RS CVn stars are (less likely)possibilities.
We test for variability by extracting the events filesbetween 0.5 and 2.5 keV within 100 of each source by usingthe IRAF PROS task VARTST. This task applies theKolmogorov-Smirnov and Cramer–VonMises tests (Daniel1990) to attempt to disprove the hypothesis that the sourceflux is constant. We choose only events below 2.5 keVbecause the events at higher energies are generally domi-nated by the background from EXO 1745�248. Only twosources are found to be significantly variable in both tests,W9 and W10 (identified as probable CVs above). Both arevariable with 99% confidence. This is consistent with thetrend for qLMXBs of LX � 1032 1033 ergs s�1 to show gen-erally constant flux, compared with globular cluster CVsthat are often highly variable (Grindlay et al. 2001b; C. O.Heinke et al. 2003, in preparation; but cf. Becker et al.2003).
2.6. Spectral Fitting of EXO 1745�248
When observed by the ROSAT All-Sky Survey at a lumi-nosity of logðLXÞ ¼ 35:3, the 0.5–2.5 keV spectrum of EXO1745�248 was well fitted by a power law of photon index� ¼ 1:2, using a hydrogen column of NH ¼ 2� 1022 cm�2
(Verbunt et al. 1995). A ROSAT HRI observation in 1991March found it at a luminosity of logðLXÞ ¼ 34:6, assumingthe same spectrum (Johnston et al. 1995). Only a broadbandX-ray spectrum can provide detailed information about thenature of the LMXB, by simultaneously constraining thephotoelectric absorption column, any iron lines or edges,and the overall spectral shape. Fortuitously, there existRXTE data simultaneous with our Chandra data, which wealso analyze.
To study theChandra spectrum of EXO 1745�248 in out-burst, we first selected an annulus from 500 to 900 from our
best-determined position and removed the portion affectedby the readout streak. This annulus is not affected by pileupand includes only one faint source (W4), which should notsignificantly affect the spectral fitting (contributing �17 of24,739 counts). We extracted the spectrum by using bins ofwidth 75 eV (oversampling the energy resolution) and usinga background region on the same chip 20 away. We alsoextract a light curve from the same region. We see a gradualrise from 0.4 to 0.5 counts s�1 during the first observation,while the second (5 ks) observation five days later shows arate of 0.9 counts s�1 (consistent with the rise in the ASMcount rate). Flickering is clearly seen, but we put off detailedstudy of temporal variability for future work. An absorbedpower law of photon index 0.24 provides a good fit to thecontinuum, with a strong broad iron line (EW 440þ190
�230 eV,� ¼ 0:5� 0:1 keV) required at 6.7 keV. However, we notethat the spectrum will be altered both by the effects of dustscattering and by the energy dependence of the Chandramirror PSF (e.g., Smith, Edgar, & Shafer 2002). Thereforewe extracted the spectrum from the readout streak, whichdoes not suffer this hardening since the counts are recordedin the image core.
We used the CIAO task ACISREADCORR to identifyand reposition events in the EXO 1745�248 readout streak.We use a strip of width 2 pixels and omit a region of 25 pixelsradius around the source location to avoid photons from theX-ray halo and regions that suffered pileup. Pileup is not anissue in the selected region, as the 8750 counts selected give0.15 counts per 0.841 s per CCD frame, spread along a78� 2 pixel column. We extracted those events by using theCIAO script PSEXTRACT and chose a background regionadjacent to the strip (adjusting the BACKSCAL parameterby hand). We ignore data above 10 keV and below 0.7 keV(which are almost entirely background photons, consideringthe high absorption to this source). We fitted this Chandrareadout streak spectrum along with the simultaneous RXTEdata to understand the full spectral shape.
From theRXTE data, only the PCA STANDARD 2 dataand the HEXTE archive data (from both HEXTE clustersseparately) are analyzed in this paper. We choose time inter-vals when three of the PCA units were on (the maximumduring the observation) and the elevation above the Earth’slimb was greater than 10. Selecting only the top xenon layer
TABLE 2
Spectral Fits to Faint Sources
HAtmosphere Bremsstrahlung Power Law
Source
kT
(eV) (�2�/dof )
kT
(eV) (�2�/dof ) � (�2
�/dof )
LX(0.5–2.5)
(ergs s�1)
W2 .................... 98þ5�6 1.19/14 0:7þ0:5
�0:3 1.16/13 3:9þ1:1�1:0 1.31/13 4.1 � 1032
W3 .................... 104þ5�5 1.36/22 1:0þ0:7
�0:3 1.05/21 3:1þ0:8�0:6 1.20/21 5.6 � 1032
W4 .................... 90þ9�17 1.37/11 0:5þ2:5
�0:5 1.49/10 4:6þ1�2:6 1.5/10 2.7 � 1032
W5 .................... 92 3.0/16 6:3þ71�3:8 1.29/15 1:7þ0:5
�0:5 1.34/15 1.9 � 1032
W6 .................... 100 4.42/33 >29 1.08/32 1:0þ0:3�0:2 1.05/32 3.5 � 1032
W7 .................... 90 2.50/16 >6 0.51/15 1:2þ0:5�0:5 0.51/15 1.5 � 1032
W8 .................... 92þ6�9 0.84/19 0.8þ1:7
�0:4 0.78/18 3:3þ1:8�1:3 0.82/18 3.1 � 1032
W9 .................... 79 2.27/13 >2 1.37/12 1.3þ0:9�0:8 1.37/12 8.6 � 1031
W10 .................. 88 2.92/15 >7 0.95/14 1.1þ0:6�0:6 0.94/14 1.3 � 1032
Note.—Spectral fits to faint cluster sources, with background subtraction, in XSPEC. All fits include pho-toelectric absorption fixed at the clusterNH, 1:2� 1022 cm�2. Hydrogen atmosphere fits are made with radiusfixed to 10 km. X-ray luminosities are unabsorbed for the range 0.5–2.5 keV, from hydrogenatmosphere neutron star fits (W2, W3, W4, and W8) or thermal bremsstrahlung fits. Errors in all the tablesare 90% confidence for a single parameter.
Power Law
816 HEINKE ET AL. Vol. 590

data from the PCA, we use PCABACKEST version 3.0(released 2002 February 1) and PCARSP version 8.0 andcorrect the PCA data manually for dead time. We used theHEXTE response matrices hexte_97mar20c_pwa.rmf andhexte_97mar20c_pwb013.rmf and corrected the HEXTEdata for background and dead time using the HXTBACKand HXTDEAD (ver. 2.0.0) scripts. We eliminate 200 saround a possible type I X-ray burst, which we do not inves-tigate in this paper (type I bursts from EXO 1745�248 arecommon; see Inoue et al. 1984). This gave total correctedexposure times of 2060, 731, and 777 s for the PCA andHEXTE clusters A and B, respectively. We analyze PCAdata from 3 to 25 keV and HEXTE data from 25 to 125keV. Following Barret et al. (2000), we add systematicerrors of 0.5% to the PCA data below 15 keV and 1% toPCA data above 15 keV by using the FTOOLS GRPPHA.We leave an overall normalization free between theChandra, PCA, and HEXTE data but link all other parame-ters between them in a joint fit. (The PCA and HEXTE rela-tive normalizations are generally not well calibrated; wefind the HEXTE normalization to be 40% lower than thePCA normalization.)
The standard models for fitting neutron star LMXB spec-tra are an absorbed multicolor blackbody, or a simpleblackbody, with an additional hard component due toComptonization of soft photons by hot electrons (generallyassuming, as here, a spherical geometry); see Barret et al.(2000) and SPO01. Fitting a simpler model, consisting ofDISKBB plus a Gaussian and power law, to theRXTE datagave a photon index of 1.5 but failed to fit the HEXTE databecause of a drop-off of flux at high energies (�2
� ¼ 8:1 for230 degrees of freedom). We begin by fitting our RXTEspectra with a model consisting of an absorbed multicolorblackbody (DISKBB; Makishima et al. 2000), a Comptoni-zation model (COMPTT; Titarchuk 1994), and the Fe lineGaussian, and with another model consisting of a black-body, COMPTT, and the Gaussian. The RXTE fits for bothmodels are significantly improved by the addition of asmeared iron edge (‘‘ smedge ’’; Ebisawa et al. 1994) near 8keV, as expected for reflection of Comptonized hard X-raysfrom a disk. (An F-test gives a probability of 10�4 that thesmeared edge is not needed.) For the rest of this analysis,the ‘‘ standard model ’’ shall refer to PHABS(DISKBB+COMPTT+GAUSSIAN)�SMEDGE�CONSTANT. Thedata/model ratio for PCA data, fitted with the standardmodel with the normalizations of the Gaussian and smearededge set to zero, is shown in Figure 6.
The extracted Chandra spectrum displays what appear tobe emission lines at �1.95 and 2.1 keV. These features arenot apparent in either the adjacent background or the annu-lus spectrum described above. Similar features are also seenin the readout streak spectrum of GX 13+1 (Smith et al.2002) and in the high count rate continuous-clocking spec-trum of RX J170930.2�263927 (Jonker et al. 2003). Thebest-fitting standard model to the RXTE data does not givean acceptable fit to the Chandra data above 5 keV, wherethey overlap, nor does any other model fit both the Chandraand RXTE data; see Figure 7. For the best-fitting standardmodel, the reduced �2 ¼ 1:41 for 225 degrees of freedom(null hypothesis probability is 5:7� 10�5). Note that theChandra spectrum appears to have been shifted in energycompared with the model predictions. We understand thiseffect as being due to a gain shift between the calibratedresponse of the timed exposure mode and the actual
response to events occurring during the readout period,when the voltages in the CCD are expected to be different.By measuring the difference between the model and dataedges near 2 keV, and the model (derived from RXTE fits)and data between 5 and 9 keV, we estimate the gain shift at7% � 1%.
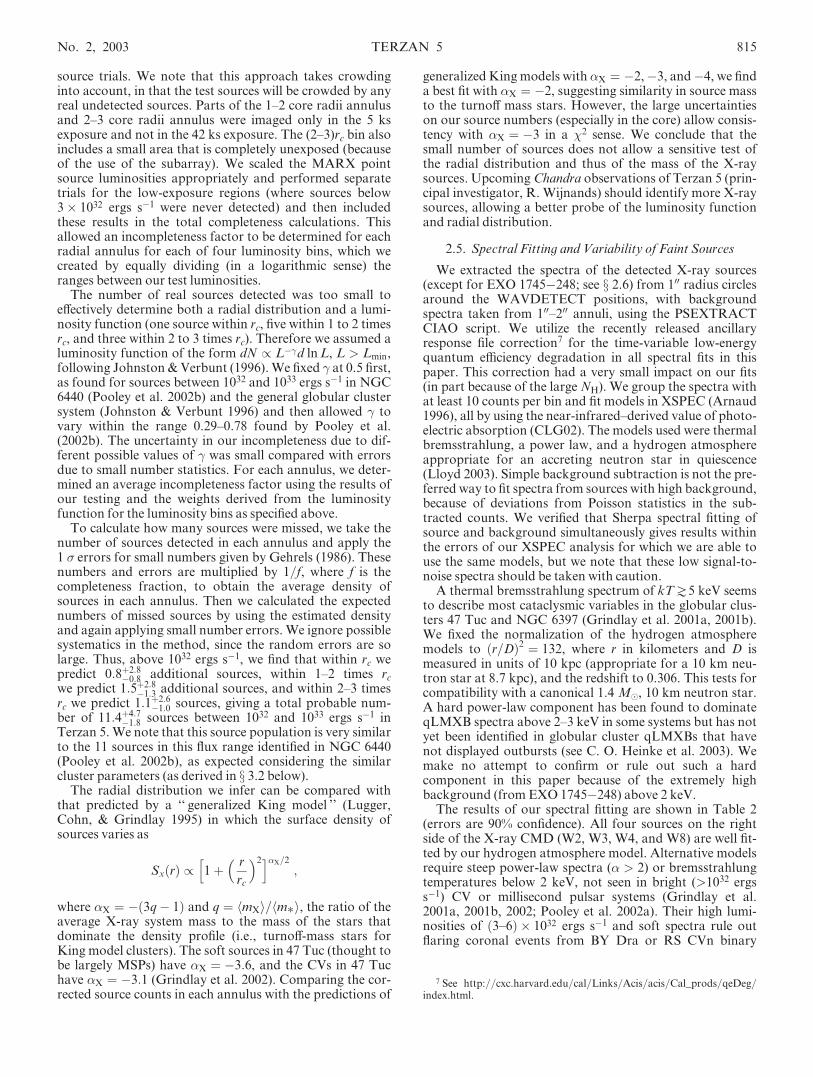
We attempt to compensate for this gain shift by increas-ing the size of the energy bins in the events file by 7%, to 15.6from 14.6 eV, while keeping the same response, ancillaryresponse, and background files, and extracting the altered-gain spectrum in the same way. Fitting this shifted-energyspectrum, along with the RXTE spectra, gives a greatlyimproved fit (see Fig. 8). The standard model fit to thesespectra gives a reduced �2 ¼ 1:06 for 225 degrees of freedom(dof; probability is 0.250). The derived parameter ranges arerobust; spectral fits to RXTE data alone give similarparameter values (with larger uncertainties for the softcomponents, and NH virtually unconstrained). Although
Fig. 6.—Ratio of EXO 1745�248 PCA data to standard model (seetext), with normalizations of the Gaussian iron line and smeared edge set tozero to show the relative contributions.
Fig. 7.—EXO 1745�248 spectrum from Chandra readout streak data,RXTE PCA, and RXTE HEXTE data, simultaneously fitted with thestandard model (see text). Note the poor fit to the Chandra data near 2 keVand the pronounced wave above 5 keV, suggesting an incorrect energycalibration.
No. 2, 2003 TERZAN 5 817
this simple calibration must be used with a great amount ofcaution, we believe that the quality of the resulting spectralfits supports our decision to utilize it for this analysis.
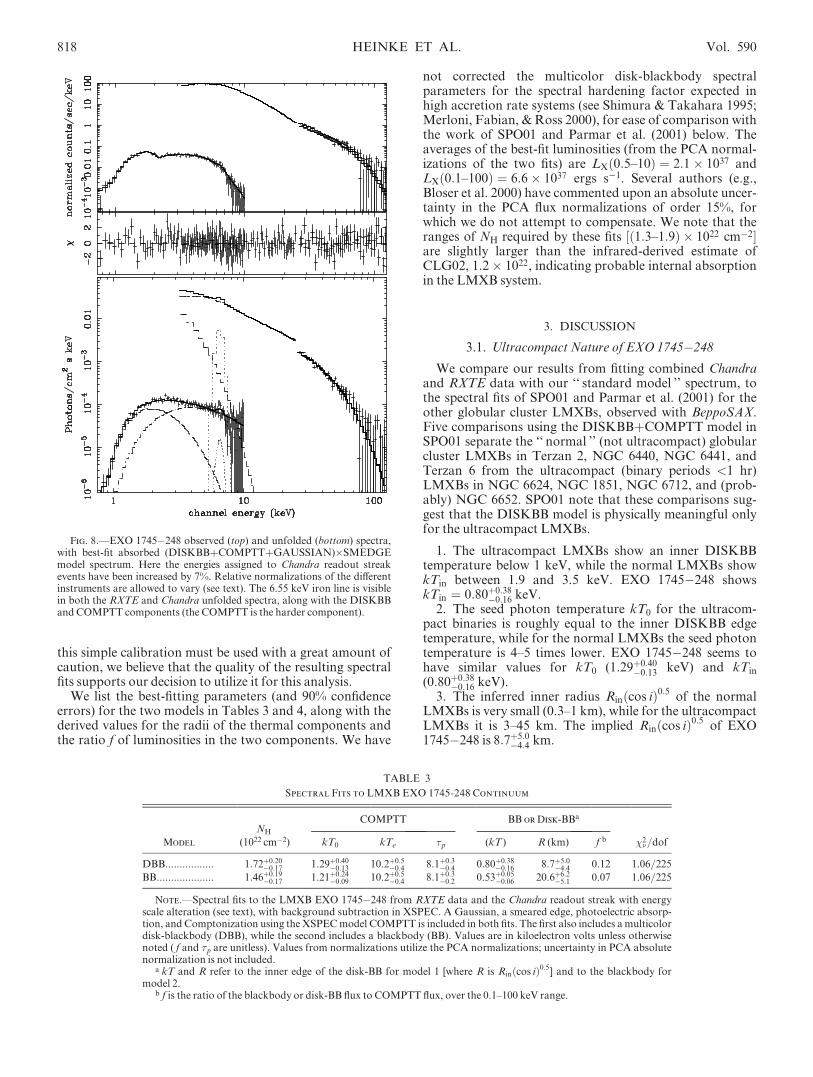
We list the best-fitting parameters (and 90% confidenceerrors) for the two models in Tables 3 and 4, along with thederived values for the radii of the thermal components andthe ratio f of luminosities in the two components. We have
not corrected the multicolor disk-blackbody spectralparameters for the spectral hardening factor expected inhigh accretion rate systems (see Shimura & Takahara 1995;Merloni, Fabian, & Ross 2000), for ease of comparison withthe work of SPO01 and Parmar et al. (2001) below. Theaverages of the best-fit luminosities (from the PCA normal-izations of the two fits) are LXð0:5 10Þ ¼ 2:1� 1037 andLXð0:1 100Þ ¼ 6:6� 1037 ergs s�1. Several authors (e.g.,Bloser et al. 2000) have commented upon an absolute uncer-tainty in the PCA flux normalizations of order 15%, forwhich we do not attempt to compensate. We note that theranges of NH required by these fits ½ð1:3 1:9Þ � 1022 cm�2�are slightly larger than the infrared-derived estimate ofCLG02, 1:2� 1022, indicating probable internal absorptionin the LMXB system.
3. DISCUSSION
3.1. Ultracompact Nature of EXO 1745�248
We compare our results from fitting combined Chandraand RXTE data with our ‘‘ standard model ’’ spectrum, tothe spectral fits of SPO01 and Parmar et al. (2001) for theother globular cluster LMXBs, observed with BeppoSAX.Five comparisons using the DISKBB+COMPTT model inSPO01 separate the ‘‘ normal ’’ (not ultracompact) globularcluster LMXBs in Terzan 2, NGC 6440, NGC 6441, andTerzan 6 from the ultracompact (binary periods <1 hr)LMXBs in NGC 6624, NGC 1851, NGC 6712, and (prob-ably) NGC 6652. SPO01 note that these comparisons sug-gest that the DISKBB model is physically meaningful onlyfor the ultracompact LMXBs.
1. The ultracompact LMXBs show an inner DISKBBtemperature below 1 keV, while the normal LMXBs showkTin between 1.9 and 3.5 keV. EXO 1745�248 showskTin ¼ 0:80þ0:38
�0:16 keV.2. The seed photon temperature kT0 for the ultracom-
pact binaries is roughly equal to the inner DISKBB edgetemperature, while for the normal LMXBs the seed photontemperature is 4–5 times lower. EXO 1745�248 seems tohave similar values for kT0 (1:29þ0:40
�0:13 keV) and kTin
(0:80þ0:38�0:16 keV).
3. The inferred inner radius Rinðcos iÞ0:5 of the normalLMXBs is very small (0.3–1 km), while for the ultracompactLMXBs it is 3–45 km. The implied Rinðcos iÞ0:5 of EXO1745�248 is 8:7þ5:0
�4:4 km.
Fig. 8.—EXO 1745�248 observed (top) and unfolded (bottom) spectra,with best-fit absorbed (DISKBB+COMPTT+GAUSSIAN)�SMEDGEmodel spectrum. Here the energies assigned to Chandra readout streakevents have been increased by 7%. Relative normalizations of the differentinstruments are allowed to vary (see text). The 6.55 keV iron line is visiblein both the RXTE and Chandra unfolded spectra, along with the DISKBBandCOMPTT components (the COMPTT is the harder component).
TABLE 3
Spectral Fits to LMXB EXO 1745-248 Continuum
COMPTT BB or Disk-BBa
Model
NH
(1022 cm�2) kT0 kTe �p (kT ) R (km) f b �2�/dof
DBB................. 1:72þ0:20�0:17 1.29þ0:40
�0:13 10.2þ0:5�0:4 8.1þ0:3
�0:4 0:80þ0:38�0:16 8:7þ5:0
�4:4 0.12 1.06/225
BB.................... 1:46þ0:19�0:17 1.21þ0:24
�0:09 10.2þ0:5�0:4 8:1þ0:3
�0:2 0.53þ0:05�0:06 20.6þ6:2
�5:1 0.07 1.06/225
Note.—Spectral fits to the LMXB EXO 1745�248 from RXTE data and the Chandra readout streak with energyscale alteration (see text), with background subtraction in XSPEC. A Gaussian, a smeared edge, photoelectric absorp-tion, and Comptonization using the XSPECmodel COMPTT is included in both fits. The first also includes amulticolordisk-blackbody (DBB), while the second includes a blackbody (BB). Values are in kiloelectron volts unless otherwisenoted ( f and �p are unitless). Values from normalizations utilize the PCA normalizations; uncertainty in PCA absolutenormalization is not included.
a kT and R refer to the inner edge of the disk-BB for model 1 [where R is Rinðcos iÞ0:5] and to the blackbody formodel 2.
b f is the ratio of the blackbody or disk-BB flux to COMPTT flux, over the 0.1–100 keV range.
818 HEINKE ET AL. Vol. 590

4. The seed photon emission radius
RW ¼ 3� 104dfcomp=ð1þ yÞ
� �1=2ðkT0Þ2
km ;
where d is the source distance in kiloparsecs, fcomp is theflux in the Comptonized component in ergs cm�2 s�1,and y is the COMPTT Comptonization parameter,y ¼ 4kTe�2=mec2. The radius RW is similar to the inner diskradius Rinðcos iÞ0:5 in the ultracompact LMXBs, while it is�10–50 times larger for the normal LMXBs. For EXO1745�248 we calculate RW ¼ 5:4þ1:3
�2:9 km, similar to itsRinðcos iÞ0:5 ¼ 8:7þ5:0
�4:4 km. (We also note that y ¼ 5:2þ0:5�0:6 for
EXO 1745�248, within the range 1–7 of most of theLMXBs studied in SPO01.)5. Finally, the implied mass of the compact object,
derived from the DISKBB extrapolated bolometricluminosity and the inner disk temperature (followingMakishima et al. 2000, including spectral hardening), isconsistent with 1–3M� for the ultracompact binaries, but itis nearer to 0.1 M� for the normal LMXBs. We derive1:6þ0:8
�0:9 M� for EXO 1745�248.
Each of these comparisons strongly indicates that EXO1745�248 is an ultracompact LMXB. Some of these spec-tral differences have been used by Parmar et al. (2001) toidentify the bright LMXB in NGC 6652 as a probable ultra-compact system, an identification that is supported by theshort optical periods proposed by Heinke, Edmonds, &Grindlay (2001). The identification of EXO 1745�248 as aprobable ultracompact LMXB makes five of 13 luminousLMXBs in globular clusters ultracompact, a far greater pro-portion than in the field. This strengthens the conclusion ofDeutsch et al. (2000) that dynamical effects are probablyresponsible for the generation of ultracompact LMXBs inglobular clusters.
Another interesting result is the strength of the ionizediron line in EXO 1745�248, with an equivalent widthEW � 190 eV. This is many times larger than the averageupper limit (25.6 eV) on the equivalent width of an iron linefor the nine globular cluster LMXBs with good statisticsreported by SPO01 and Parmar et al. (2001). Only two otherglobular cluster LMXBs have identified iron lines; 4U
1820�30 in NGC 6624 (EW ¼ 13þ12�11 eV, SPO01;
EW ¼ 31þ12�11 eV at 6.6 keV, Asai et al. 2000; EW ¼ 27–94
eV in numerous RXTE observations; Bloser et al. 2000) andTerzan 2 (EW ¼ 21þ10
�9 or 27� 10 eV, depending on contin-uum model; Barret et al. 2000). Among these LMXBs, only4U 1820�30 in NGC 6624 has a reported reflection edgefeature (at 7.7 or 8.9 keV; Bloser et al. 2000), in its low or‘‘ island ’’ state. The strength of the iron line may beincreased by the high metallicity of Terzan 5, which CLG02suggested is greater than solar, compared with the signifi-cantly subsolar metallicity for the other globulars withLMXBs except Liller 1. We note that the 6:55þ0:06
�0:07 keVenergy and � ¼ 0:31þ0:16
�0:15 keV breadth of this line are similarto those of field neutron star LMXBs reported in Asai et al.(2000), 6.56 and 0:2� 0:1 keV (0.5 keV FWHM), respec-tively, although this line is somewhat stronger than in mostfield LMXBs. The iron lines studied by Asai et al. (2000)were interpreted as radiative recombination in an accretiondisk corona, with the breadth being due primarily toCompton scattering, with possible small contributions fromDoppler shifts (due to Keplerian motion near the neutronstar) and line mixing from plasmas in different ionizationstates. The location of our line and smeared edge suggestiron that is less highly ionized than He-like Fe xxv K lines(6.68 keV line and 8.8 keV edge). Disk reflection from car-bon-like Fe xxi (6.54 and 8.3 keV lines and edge) is moreconsistent with our line and edge energies. Further analysisof the RXTE outburst spectrum and variability of EXO1745�248 is being performed by J. Homan et al. (2003, inpreparation).
Kuulkers et al. (2003) have recently presented a Beppo-SAX spectrum of EXO 1745�248, taken 15 days later dur-ing the same 2000 outburst. Kuulkers et al. (2003) find aninterstellar absorption of NH ¼ 3:8þ0:9
�0:7 � 1022 cm�2 whenusing the DISKBB+COMPTT model and NH ¼ 2:3þ0:6
�0:8�1022 using the BBODYRAD+COMPTT model. Thesevalues are inconsistent with our (more precise) values forNH, suggesting that the absorption column may havechanged during the outburst. Their NH values are inconsis-tent with the optically derived extinction value (CLG02; seeFig. 1 in Kuulkers et al. 2003), requiring an absorption col-umn within the LMXB system 10 times larger than shownin any other globular cluster LMXB. If this were the case,we would expect a high inclination and significant dips dueto variable absorption. While these are not seen in ourChandra and single-observation RXTE light curves,R. Wijnands notes (2002, private communication) that suchdips are indeed seen in the full RXTE light curves of the2000 outburst of EXO 1745�248 (J. Homan et al. 2003, inpreparation). This may imply that the system is at high incli-nation, though the observed disk reflection componentsuggests a low inclination. We also note that their spectralparameters, while not agreeing with ours in every detail,support our claim that EXO 1745�248 is ultracompact,particularly in their small value of kTin for theirDISKBB+COMPTT fit.
3.2. Terzan 5 Cluster Parameters
It has long been suspected that Terzan 5 has one of thehighest rates of close encounters between stars of anyGalac-tic globular cluster. The ‘‘ collision rate,’’ or rate of closeencounters given by � / �20r
3c=� (where �0 is the central
density, rc is the core radius, and � is the central velocity
TABLE 4
Spectral Fits to LMXB EXO 1745-248 Features
Parameter Value
Gaussian
kT ......................................................... 6.55þ0:06�0:07
EW (eV) ................................................ 188þ86�83
� ........................................................... 0.31þ0:16�0:15
Smeared Edge
kT ......................................................... 8:1� 0:8
�max....................................................... 0.25þ1:22�0:16
Width.................................................... 2.6þ5:5�2:0
Note.—Spectral fits to the Fe lineGaussian and diskreflection smeared edge in the spectrum of the LMXBEXO 1745�248. The spectral fits in this table are to the‘‘ standard model ’’ including a multicolor disk-blackbody (see text); line and edge parameter valuesfor the other model considered in the text are within theerrors in this table. Values are in kiloelectron voltsunless otherwise stated, except �max, which is unitless.
No. 2, 2003 TERZAN 5 819
dispersion), is expected to predict the relative rates of for-mation of accreting binary neutron star systems by two-body encounters (Verbunt & Hut 1987). Thus, the similarnumbers of X-ray sources in NGC 6440 and Terzan 5 mightseem a surprise, as Terzan 5 has been predicted to show 3times as many collision products as NGC 6440 and 17% ofthe total of such objects in the Galactic globular system(Verbunt 2002).
Our calculation of the central density of Terzan 5 usesthe extinction-corrected central surface brightnesslV ð0Þ ¼ 20:5, combining the star count profile of CLG02for the inner core with the surface brightness profile ofTrager, King, & Djorgovski (1995) for normalizationbeyond 1000. We use the central concentration parameterc ¼ 2:0, core radius rc ¼ 7>9, heliocentric distance 8.7 kpc,and AV ¼ 6:75 from CLG02, as well as MV ¼ �7:91 fromthe updated Harris (1996; rev. 1999) catalog. Following theprescription of Djorgovski (1993), our result is that the cen-tral density of Terzan 5 is 1:7� 105 L� pc�3, significantlyless than that given by Djorgovski (1993), Harris (1996), orCLG02. The former two studies used a larger value of AV ,which produces a larger correction of the surface brightness.CLG02 had scaled the central surface brightness value ofDjorgovski (1993) for changes in the profile, without updat-ing the value of AV . We note that this calculation is consis-tent with the lower limit of 5:0� 105 M� pc�3 derived byLyne et al. (2000) from the acceleration-induced _EE of pulsarTerzan 5 C, provided thatM=L � 3:0.
By using this central density and the distance and coreradius from CLG02, the collision rate in Terzan 5 is similarto that in NGC 6440 (5.9% of the total collision rate in theglobular system), instead of 3 times larger. This is consistentwith the results of our artificial-star tests (x 2.3), which sug-gest that Terzan 5 may contain �11 sources in the range1032–1033 ergs s�1, compared with 11 in NGC 6440. A fullanalysis of the luminosity function and density weighting ofquiescent LMXBs in globular clusters will be presented inC. O. Heinke et al. (2003, in preparation). We also revise theestimate of the central relaxation time of Terzan 5 to2� 108 yr from the value of CLG02, 4� 107 yr, followingDjorgovski’s (1993) scaling of trc / �0:50 r3c . This indicatesthat the cluster is not as close to the verge of core collapse assuggested by CLG02. The high density of compact binariesin the core seems to be due primarily to the high density ofthe cluster’s massive core. The large numbers of millisecondpulsars (60–200) in the core of Terzan 5 estimated byFruchter & Goss (2000) would require a long period of highcore density to form the millisecond pulsar progenitors.MSPs may be most efficiently formed early in the cluster his-tory by intermediate-mass X-ray binaries (e.g., Davies &Hansen 1998). Therefore it seems likely that the MSPs ofTerzan 5 were formed early in its history, as were those in 47Tuc (Grindlay et al. 2002), which has a roughly similarinferred ratio (�15–50) ofMSPs to qLMXBs.
4. CONCLUSIONS
We have presented a reasonable infrared candidate toEXO 1745�248 in Terzan 5, identified by its blue color and
positional coincidence with the boresighted Chandra posi-tion. We have assembled a broad X-ray spectrum by using asimultaneous RXTE observation and the Chandra spectrumfrom the readout streak, slightly altering the energy scale ofthe Chandra readout spectrum to account for observed gainvariation during the readout. We utilized the empirical com-parisons of SPO01 to indicate that this LMXB appears simi-lar to other ultracompact LMXBs in globular clusters,suggesting that EXO 1745�248 is the fifth ultracompactLMXB known in a globular cluster. We also identify abroad strong 6.55 keV iron line, the strongest(EW ¼ 188þ86
�83 eV) yet discovered in a globular clusterLMXB, with an accompanying smeared �8.1 keV ironedge.
The superb resolution of Chandra has allowed us to iden-tify nine faint X-ray sources within 3000 of an LMXB in out-burst in Terzan 5. Spectral fitting with bremsstrahlung andpower-law models and a neutron star hydrogen atmospheremodel (Lloyd 2003) suggests that four of these sources areqLMXBs, while five are candidate CVs. Artificial pointsource testing suggests that we are missing �30% of thesources in the range LXð0:5 2:5 keVÞ ¼ 1032–1033 ergs s�1
because of the presence of the LMXB in outburst. Thisimplies a total cluster population of 11:4þ4:7
�1:8ð1 �Þ sourceswith LX > 1032 ergs s�1 (excluding the LMXB). A recalcula-tion of the central density of Terzan 5 from updated clusterparameters gives log �0 ¼ 5:23, suggesting that Terzan 5 isnot the richest of the globular clusters in stellar encounterproducts and is not as dynamically unstable as previouslythought (CLG02). Thus we find that the numbers of X-raysources in Terzan 5 are consistent with the numbersdiscovered in other globular clusters and the currentlyfavored formation methods.
Upcoming Chandra observations of Terzan 5 and NGC6440 (principal investigator, R. Wijnands) will allow us tobetter constrain the variability and spectra of the qLMXBsin those clusters. V and I observations of Terzan 5, with theHST Advanced Camera for Surveys in HRC mode at timeswhen EXO 1745�248 is in outburst versus quiescence,could unambiguously verify the identification proposedhere.
C. O. H. thanks J. M. Miller, R. Wijnands, T. Gaetz,R. K. Smith, R. Edgar, and the anonymous referee for use-ful comments that have improved this paper. C. O. H. alsothanks S. Wachter for access to unpublished data. Thiswork was supported in part by Chandra grant GO0-1098Aand HST grant GO-7889.01-96A. RXTE data and resultsprovided by the ASM/RXTE teams at MIT and at theRXTE SOF and GOF at NASA’s GSFC. The Guide StarCatalogue–II is a joint project of the Space TelescopeScience Institute and the Osservatorio Astronomico diTorino. This research has made use of the data and resour-ces obtained through the HEASARC on-line service, pro-vided by NASA/GSFC, the VizieR catalog access tool,CDS, Strasbourg, France, and the NASA AstrophysicsData System.
820 HEINKE ET AL. Vol. 590

REFERENCES
Aldcroft, T. L., Karovska, M., Cresitello-Ditmar, M. L., Cameron, R. A.,&Markevitch,M. L. 2000, Proc. SPIE, 4012, 650
Arnaud, K. A. 1996, in ASP Conf. Ser. 101, Astronomical Data AnalysisSoftware and Systems V, ed. G. Jacoby & J. Barnes (San Francisco:ASP), 17
Asai, K., Dotani, T., Nagase, F., &Mitsuda, K. 2000, ApJS, 131, 571Barret, D., Olive, J. F., Boirin, L., Done, C., Skinner, G. K., & Grindlay,J. E. 2000, ApJ, 533, 329
Becker,W., et al. 2003, ApJ, submitted (astro-ph/0211468)Bloser, P. F., Grindlay, J. E., Kaaret, P., Zhang,W., Smale, A. P., & Barret,D. 2000, ApJ, 542, 1000
Cohn, H. N., Lugger, P. M., Grindlay, J. E., & Edmonds, P. D. 2002, ApJ,571, 818 (CLG02)
Cool, A. M., Haggard, D., & Carlin, J. L. 2002, in ASP Conf. Ser. 265, !Centauri: A Unique Window into Astrophysics, ed. F. van Leeuwen,J. D. Hughes, &G. Piotto (San Francisco: ASP), 277
D’Amico, N., Possenti, A., Fici, L., Manchester, R. N., Lyne, A. G.,Camilo, F., & Sarkissian, J. 2002, ApJ, 570, L89
Daniel, W. W. 1990, Applied Nonparametric Statistics (2d ed.; Boston:PWS-Kent)
Danner, R., Kulkarni, S. R., Saito, Y., &Kawai, N. 1997, Nature, 388, 751Davies, M. B., &Hansen, B.M. S. 1998,MNRAS, 301, 15Deutsch, E.W.,Margon, B., &Anderson, S. F. 2000, ApJ, 530, L21Djorgovski, S. 1993, in ASP Conf. Ser. 50, Structure and Dynamics ofGlobular Clusters, ed. S. Djorgovski &G.Meylan (San Francisco: ASP),373
Ebisawa, K., et al. 1994, PASJ, 46, 375Edmonds, P. D., Grindlay, J. E., Cohn, H. N., & Lugger, P. M. 2001, ApJ,547, 829 (EGC01)
Fruchter, A. S., &Goss,W.M. 2000, ApJ, 536, 865Gehrels, N. 1986, ApJ, 303, 336Giacconi, R., et al. 2001, ApJ, 551, 624Grindlay, J. E., Camilo, F., Heinke, C. O., Edmonds, P. D., Cohn, H., &Lugger, P. 2002, ApJ, 581, 470
Grindlay, J. E., Heinke, C. O., Edmonds, P. D., & Murray, S. S. 2001a,Science, 292, 2290
Grindlay, J. E., Heinke, C. O., Edmonds, P. D., Murray, S. S., & Cool,A.M. 2001b, ApJ, 563, L53
Grindlay, J. E., et al. 2003, Astron. Nachr., in pressHarris,W. E. 1996, AJ, 112, 1487Heinke, C. O., Edmonds, P. D., &Grindlay, J. E. 2001, ApJ, 562, 363Heinke, C. O., Grindlay, J. E., Lloyd, D. A., & Edmonds, P. D. 2002, ApJ,588, 457
Hunsch, M., Schmitt, J. H. M. M., Sterzik, M. F., & Voges, W. 1999,A&AS, 135, 319
Inoue, H., et al. 1984, PASJ, 36, 855Johnston, H.M., & Verbunt, F. 1996, A&A, 312, 80
Johnston, H.M., Verbunt, F., &Hasinger, G. 1995, A&A, 298, L21Jonker, P. G., Mendez, M., Nelemans, G., Wijnands, R., & van der Klis,M. 2003,MNRAS, in press
Kurucz, R. 1992, Rev.MexicanaAstron. Astrofis., 23, 181Kuulkers, E., den Hartog, P. R., in’t Zand, J. J. M., Verbunt, F. W. M.,Harris, W. E., & Cocchi, M. 2003, A&A, 399, 663
Lloyd, D. A. 2003,MNRAS, submitted (astro-ph/0303561)Lugger, P.M., Cohn, H. N., &Grindlay, J. E. 1995, ApJ, 439, 191Lyne, A. G., Mankelow, S. H., Bell, J. F., & Manchester, R. N. 2000,MNRAS, 316, 491
Makishima, K., et al. 1981, ApJ, 247, L23———. 2000, ApJ, 535, 632Markwardt, C. B., Strohmayer, T. E., Swank, J. H., & Zhang, W. 2000a,IAUCirc. 7482
Markwardt, C. B., & Swank, J. H. 2000b, IAUCirc. 7454Merloni, A., Fabian, A. C., &Ross, R. R. 2000,MNRAS, 313, 193Ortolani, S., Barbuy, B., Bica, E., Renzini, A., Zoccali, M., Rich, R. M., &Cassisi, S. 2001, A&A, 376, 878
Parmar, A. N., Oosterbroek, T., Sidoli, L., Stella, L., & Frontera, F. 2001,A&A, 380, 490
Pooley, D., et al. 2002a, ApJ, 569, 405———. 2002b, ApJ, 573, 184Predehl, P., & Schmitt, J. H.M.M. 1995, A&A, 293, 889Rutledge, R. E., Bildsten, L., Brown, E. F., Pavlov, G. G., & Zavlin, V. E.2002, ApJ, 578, 405
Shimura, T., & Takahara, F. 1995, ApJ, 445, 780Sidoli, L., Parmar, A. N., Oosterbroek, T., Stella, L., Verbunt, F., Masetti,N., &Dal Fiume, D. 2001, A&A, 368, 451
Smale, A. P. 1995, AJ, 110, 1292Smith, R. K., Edgar, R. J., & Shafer, R. A. 2002, ApJ, 581, 562Titarchuk, L. 1994, ApJ, 434, 570Trager, S. C., King, I. R., &Djorgovski, S. 1995, AJ, 109, 218van Paradijs, J., &McClintock, J. E. 1995, in X-Ray Binaries, ed. W. H. G.Lewin, J. van Paradijs, & E. P. J. van den Heuvel (Cambridge: Cam-bridge Univ. Press), 58
Verbunt, F. 2002, in ASP Conf. Ser. 265, ! Centauri: A Unique Windowinto Astrophysics, ed. F. van Leeuwen, J. D. Hughes, & G. Piotto (SanFrancisco: ASP), 289
Verbunt, F., Bunk, W., Hasinger, G., & Johnston, H. M. 1995, A&A, 300,732
Verbunt, F., & Hut, P. 1987, in IAU Symp. 125, The Origin and Evolutionof Neutron Stars, ed. D. J. Helfand & J. H. Huang (Dordrecht: Kluwer),187
Wachter, S. 1997, ApJ, 485, 839———. 1998, Ph.D. thesis, Univ.WashingtonWang, Z., et al. 2001, ApJ, 563, L61
No. 2, 2003 TERZAN 5 821