
A blueprint for data-driven insights - Elastic
25
A blueprint for data-driven insights How to use the power of search to drive insights that will transform your organization elastic.co
Transcript of A blueprint for data-driven insights - Elastic

A blueprint for data-driven insightsHow to use the power of search to drive insights that will transform your organization
elastic.co

DATA INSIGH
TS
ACTION
Make insight-to-action a team sport Minimize the gap between insights and action
Ask questions and get answers at the speed of thought
Collect and store the data you need — and search across all of it
Cut through the noise and see your data in the right way at the right time
Account for your data and align on goals
Plan for scale, performance, and security
Embrace open source and a single technology stack
III. ACTION
IV. REPEAT
I. DATA
II. INSIGHTS
Table of contentsUse the loop to help navigate through this report

Table of Contents | I.Data | II. Insights | III. Action | IV. Repeat | Final thoughts 3
You have an ocean of data — but does that data provide enough value?
IDC estimates that total worldwide spend on big data and analytics solutions revenue will exceed $225 billion by 2022.1
Whether that spend translates into value depends on one thing: your ability to derive actionable insights from your data.
An insight can be as simple as discovering something you didn’t know before — or as advanced as identifying complex patterns across petabytes of data with machine learning.
Insights are powerful because they close the gap between your current understanding of your organization and what’s actually happening on the ground. We refer to this gap as the understanding gap. Adopting a process to systematically translate data into actionable insights can minimize the understanding gap, resulting in competitive advantages for your organization.
1 IDC, Worldwide Big Data and Analytics Spending Guide, August 2020
Understanding gap InsightsData

Table of Contents | I.Data | II. Insights | III. Action | IV. Repeat | Final thoughts 4
The challenge: Your organization is a complex ecosystem that continuously consumes and creates vast amounts of data, including:
2 The State Of Insights-Driven Business Maturity, Forrester Research, Inc., January 31, 2019
Application data
(email, Google Drive, Salesforce)
IT systems data
(logs, metrics, traces)
Security data
(endpoint logs and alerts, audit trails)
At any given moment, that data has the potential to illustrate what’s actually happening in your organization. The catch is that, on their own, data sets usually contain too much or too little information to be useful. Too much data results in too much noise, and too little data spread across multiple siloed data stores results in difficulty connecting the dots — both problems that get in the way of insights.
In its report “The State Of Insights-Driven Business Maturity,” Forrester2 notes that, compared with beginners, advanced insight-driven organizations are:
• 178% more likely to grow revenues with their systems of insights
• 228% more likely to be good at leveraging insights systems to adapt to customer changes with agility
• 240% more likely to create a sustainable competitive advantage with their insights systems

Table of Contents | I.Data | II. Insights | III. Action | IV. Repeat | Final thoughts 5
Why organizations need data-driven insights now
Content is becoming harder to find
Most organizations have massive amounts of internal content scattered across multiple platforms — and customers and prospects are constantly searching websites and applications for answers, too. Data-driven insights enable business visibility by highlighting what users are searching for and what’s falling through the cracks.
Enterprise IT is becoming more complex
From container-based applications and microservice architectures to cloud-native deployments and infrastructure as code, IT departments must find and respond to issues faster than ever before. Data-driven insights are needed to optimize infrastructure and applications and identify issues and outages before they become liabilities.
Cyber threats are becoming more sophisticated
As IT infrastructure becomes more distributed across public, private, and hybrid environments, protecting against threats is more critical and complex than ever. To protect your digital ecosystem, security insights based on holistic data visibility are mandatory.

Table of Contents | I.Data | II. Insights | III. Action | IV. Repeat | Final thoughts 6
So what’s the blueprint for success? We call it the Data → Insights → Action loop:
1. Use data and the power of search to formulate a data strategy based on current and future needs
2. Apply the power of search to generate relevant insights, investing in analytics and visualization along the way
3. Empower frontline practitioners to take action by operationalizing insights and providing them with the right tools
4. Repeat the loop and optimize the process to make better decisions with better outcomes
Whether your goal is to enable business visibility, optimize infrastructure and applications, or protect your digital ecosystem, the power of search drives efficiency and maximizes value at every step of the loop.
The most effective insight-driven organizations go through the loop quickly and continuously. Let’s walk through each of these steps to find out how you can use the power of search and the Data → Insights → Action loop to drive discoveries that will transform your organization.

Table of Contents | I.Data | II. Insights | III. Action | IV. Repeat | Final thoughts 7
The power of the OODA loop
In the 1970s, John Boyd, a US Air Force pilot who later became a military strategist, knew that the key to victory was to react more quickly than your opponent. He hypothesized that individuals (and organizations) that have a plan for stressful situations are more likely to outmaneuver an adversary. Boyd developed the OODA loop, a decision-making cycle that breaks down into four connected steps: observe, orient, decide, and act. You’ve probably used the OODA loop thousands of times without realizing it. Almost 50 years later, this cycle is still relevant. In fact, it inspired our own blueprint for how to harness insights.
8 Table of Contents | I.Data | II. Insights | III. Action | IV. Repeat | Final thoughts
I. Use data strategically to lay the foundation for success
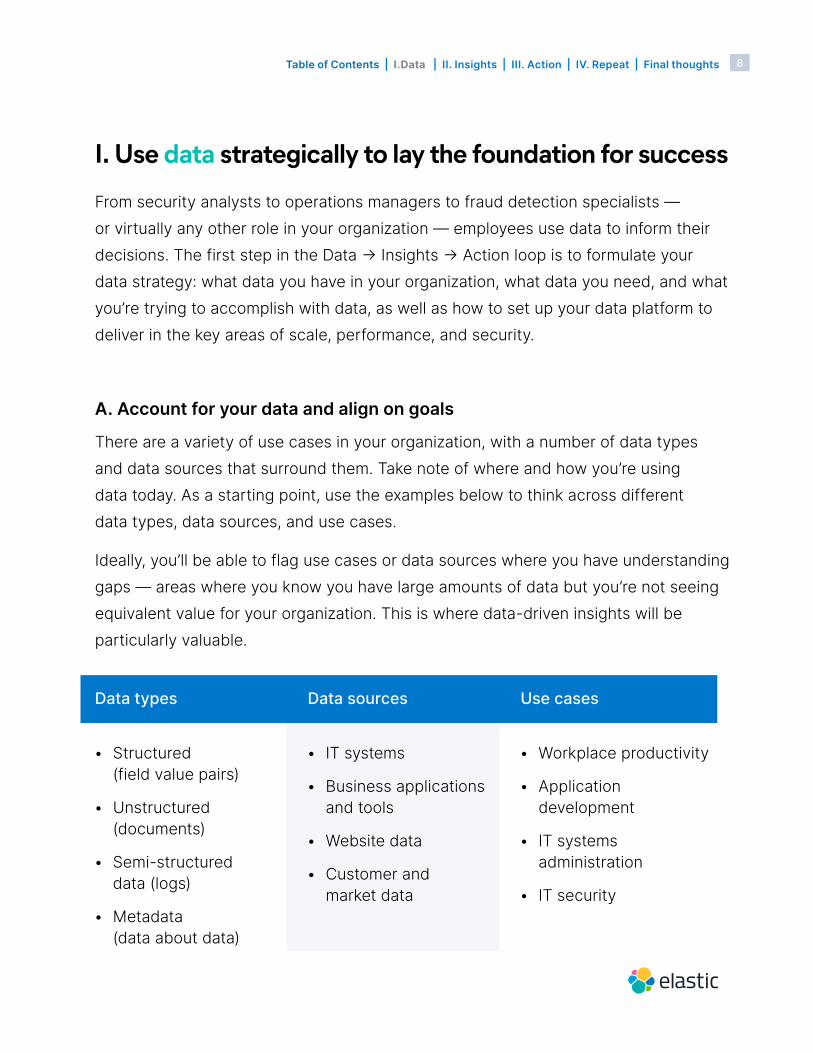
From security analysts to operations managers to fraud detection specialists — or virtually any other role in your organization — employees use data to inform their decisions. The first step in the Data → Insights → Action loop is to formulate your data strategy: what data you have in your organization, what data you need, and what you’re trying to accomplish with data, as well as how to set up your data platform to deliver in the key areas of scale, performance, and security.
A. Account for your data and align on goals
There are a variety of use cases in your organization, with a number of data types and data sources that surround them. Take note of where and how you’re using data today. As a starting point, use the examples below to think across different data types, data sources, and use cases.
Ideally, you’ll be able to flag use cases or data sources where you have understanding gaps — areas where you know you have large amounts of data but you’re not seeing equivalent value for your organization. This is where data-driven insights will be particularly valuable.
Data types
• Structured (field value pairs)
• Unstructured (documents)
• Semi-structured data (logs)
• Metadata (data about data)
Data sources
• IT systems
• Business applications and tools
• Website data
• Customer and market data
Use cases
• Workplace productivity
• Application development
• IT systems administration
• IT security

9 Table of Contents | I.Data | II. Insights | III. Action | IV. Repeat | Final thoughts
Once you’ve accounted for your data, you can start having conversations with your teams about goals and priorities. Take a step back to ensure your teams have the same end goals and begin connecting those goals to the data types, data sources, and use cases that you’ve assessed above.
For example, if reducing mean time to respond (MTTR) is an organizational priority, begin thinking about how your teams will need to use data and search to achieve that goal — they’ll likely need to eliminate data silos and have access to features that streamline incident response such as alerting, machine learning, and actionable dashboards. You can then begin to bring these elements into play in the next steps of the loop.
B. Plan for scale, performance, and security
Once you know what success looks like for your organization and what data sources you should be focusing on, you’ll need to set up your data foundation to deliver. Almost every decision you make about how you process data and derive insights relates to scale. Should you store selected portions of your data, data summarizations, or everything? Should you index and optimize data for search and analysis ahead of time or only when you need it? Planning for scale isn’t optional, and this is why we suggest you do so early in your journey.
There will always be more data tomorrow than there is today — and its growth rate will be exponential. In Gartner’s Top Strategic Technology Trends for 2021, the firm predicts: “With an increase in technologies that gather the “digital dust” of daily life — data that spans the digital and physical worlds — that information can be used to influence behaviors through feedback loops.”3
3 Smarter With Gartner, Gartner Top Strategic Technology Trends for 2021, Oct 2020
10 Table of Contents | I.Data | II. Insights | III. Action | IV. Repeat | Final thoughts
It’s also important to plan for performance. We all have high expectations of the applications we use in our daily lives. The performance your system needs to deliver will vary from use case to use case. In some instances you’ll need to optimize for speed; in other instances you’ll need accurate results but with no specific deadline. As you define your data strategy, consider how to deliver real-time performance when you need it and best effort results when you don’t.
Finally, to say that data security is important is to state the obvious, and most practitioners know this. But not all recognize the increasing importance of compliance to both user privacy and regulatory regimes. Failing to comply can result in irrevocable damage, as customers have expectations and laws have teeth. The best approach is to ensure field-level granularity of access controls.
C. Embrace open source and a single technology stack
Amidst inevitable technological change, the best approach to stay agile is to adopt open source software. It’s a model where the best solutions, and not the loudest voices, win. Not only that — building on open source means that your data will be less susceptible to vendor lock-in. As you envision your journey, consider participating in open source communities and adopting open source technologies to ensure that your solution remains in sync with wherever the future takes you.

11 Table of Contents | I.Data | II. Insights | III. Action | IV. Repeat | Final thoughts
According to Red Hat’s “The State of Enterprise Open Source” 2020 report:
95% of enterprise IT leaders believe that open source is strategically important
77% believe open source will continue to grow
If open source gives you the flexibility to build freely, embedding search and visualization with data in a single technology stack is the trick to operationalizing insights.
A platform that allows you to store, analyze, and visually explore data empowers individual curiosity, streamlines the ability for teams to respond with rapid decisiveness, and ultimately opens windows into every part of how an organization operates.
Avoid the trap of having search and visualization as a bolt-on to data — instead, find and adopt a stack that enables you to store, search, and analyze your data within a single platform.
95% 77%
MORE DATA Keep scrolling to learn how to put your data foundation to work for your use case. Or, if you’re ready to start generating insights, jump to Step II of the loop.
Jump to Step II. Insights

12
MORE DATA
Table of Contents | > More Data | II. Insights | III. Action | IV. Repeat | Final thoughts
Setting up a data foundation for your use caseENABLING BUSINESS VISIBILITY
Account for applications and platforms: Your employees are using a wide variety of applications and content platforms, and they might be spending a significant part of their workday just looking for corporate information. Ask your leadership team if they sometimes encounter problems or delays related to not being able to find what they’re looking for. Unifying disparate content platforms and connecting your people with the content they need when they need it will boost productivity by ensuring that shared knowledge remains discoverable as your organization evolves.
Plan for access controls: Your human resources department should be able to run reports on paid time off, but they might not need access to social security numbers. When selecting a system to aggregate data and operationalize insights, make sure it comes with the tooling you’ll need to protect your data — everything from restricting internal access to specific documents with role-based access control (RBAC) and attribute-based access control (ABAC) to selecting enterprise integrations with features like Security Assertion Markup Language (SAML) and single sign-on (SSO).
Think about integrations: Wouldn’t it be nice if, after you’ve accounted for all of your business systems and data, there was a magic wand when it came to integration? Good news: there might be. Modern business systems tend to use a common schema and open APIs. These characteristics allow for data to be exchanged between systems with relative ease; however, not every system can “speak” to every other system. To maximize the insights you’re getting out of your organization’s content and shared knowledge, consider a central hub for data aggregation and analysis, and seek out solutions where integrations are available out of the box.

13
MORE DATA
Table of Contents | > More Data | II. Insights | III. Action | IV. Repeat | Final thoughts
OPTIMIZING INFRASTRUCTURE & APPLICATIONS
Account for all applications and infrastructure: Reflect back upon your documented goals. These should act as guiding principles for where to apply your focus. If you’re moving a workload from an on-prem data center to the public cloud, study precisely what systems are involved before the move and identify what systems will be involved after the move. This will help you understand the scope of what can (and should) be monitored to produce insights that will ensure both uptime and performance.
Identify swivel chair integration: Swivel chair integration happens when the only way for your employees to obtain information about the state of an application or infrastructure is to manually correlate data from two or more disparate sources — often swiveling their chair to look from one monitor to another. Speak with your leadership team and determine where manual cross-correlation of data is happening today. This will help you to identify where processes can be streamlined and data silos can be combined.
Eliminate data silos: Imagine your IT department starting with metrics and then drilling into various logs and traces with just a few clicks — all without switching context. This accelerates investigations and reduces MTTR. You need a solution that can mix and match data — a system that can tear down the walls between data silos and transform disparate data into cohesive insights. The path towards eliminating data silos and improving your overall customer experience involves adopting a common datastore and a common schema.

14
MORE DATA
Table of Contents | > More Data | II. Insights | III. Action | IV. Repeat | Final thoughts
PROTECTING YOUR DIGITAL ECOSYSTEM
Identify blind spots: Security teams must be able to search, visualize, and analyze across the entire digital ecosystem — cloud, application, endpoint, network — in seconds. Speak to your teams to learn more about what data they need to be able to access more readily, and what additional security use cases would be viable for them to implement if they had access to more security-relevant data. This will help you understand what data types and use cases to focus on as you begin to translate data into insights.
Ensure privacy and compliance: You are responsible for your customers’ data, and you must also consider how your partners, supply chain, and other organizations outside your own are managing security and compliance posture. In order to meet evolving industry and geographic regulations, your organization will be best served by standardizing on a strong data foundation from which all teams can search at scale to gain a single source of visibility.
Establish holistic visibility: Cyber attacks have become more sophisticated and more challenging to identify, and with the sprawling landscape of security tools that security teams must manage, the effectiveness and efficiency of your organization’s defenses are being put to the test. Consider a security platform that comes equipped with SIEM, endpoint security, threat hunting, and cloud monitoring built into a single technology stack — this will provide the holistic visibility you need to ensure that your teams can respond in a coordinated manner with accuracy and speed.
15 Table of Contents | I.Data | II. Insights | III. Action | IV. Repeat | Final thoughts
II. Apply the speed, scale, and relevance of search to drive insights
Now that you have your data in order, how do you translate that data into actionable insights? In the second step in the Data → Insights → Action loop, you’ll use the power of search — speed, scale, and relevance — to ask your data questions, slice and dice it in different ways, and translate it into human-readable visuals that bring insights into focus.
A. Ask questions and get answers at the speed of thought
Speed is arguably the most important factor in the Data → Insights → Action loop. The more quickly you’re able to complete the loop, the better your outcomes will be. Everyone working with data in your organization needs to be able to think of a question, have a meaningful way to ask that question, and get an immediate answer — and then repeat the process when that answer triggers yet another question. In this way, insights can truly happen organically — at the speed of thought. As you begin this part of the Data → Insights → Action loop, set yourself up for success by making speed an indispensable requirement for your search and data platform.
B. Collect and store the data you need — and search across all of it
Being able to search iteratively at scale is another critical component of translating data into insights. The more data you can collect, and the longer you can store that data, the better your insights will be — and it follows that those insights will inform better, more powerful decisions and outcomes. An important part of working with data at scale is taking advantage of advanced analytics capabilities such as machine learning that can identify patterns in massive data sets that humans can’t. As you continue to refine your data platform, make sure you’re accounting not only for storing large amounts of data, but optimizing for search and analysis at scale, too.

16 Table of Contents | I.Data | II. Insights | III. Action | IV. Repeat | Final thoughts
Machine learning and artificial intelligence are growing in relevance: earlier this year Gartner stated that “By the end of 2024, 75% of enterprises will shift from piloting to operationalizing AI, driving a 5X increase in streaming data and analytics infrastructures.” 4
C. Cut through the noise and see your data in the right way at the right time
Let’s say that you’re now collecting and storing all the data you can possibly imagine. Not all data is created equal — the value of some data will be immediately apparent, while other data might just look like noise at first. This is where relevance comes in. True insights require data to be processed and presented in a way that will make sense to a human viewer. Because humans are hardwired to process information visually, visualizing your data not only gives you the ability to spot insights, but to make those insights accessible and understood to a wide audience. As you continue on your Data → Insights → Action journey, keep in mind that visualization and relevance are integral to search — they shouldn’t be treated as an afterthought or a bolt-on.
4 Smarter With Gartner, “Gartner Top 10 Trends in Data and Analytics for 2020,” Oct 2020
MORE INSIGHTS Keep scrolling to learn how to put insights to work for your use case. Or, if you’re ready to take action on the insights you’ve uncovered, jump to Step III of the loop.
Jump to Step III. Action

17 Table of Contents | I. Data | > More Insights | III. Action | IV. Repeat | Final thoughts
MORE INSIGHTS
Driving effective insights for your use caseENABLING BUSINESS VISIBILITY
Continuously optimize the visibility of your content: As your customers interact with your website or applications — and as your employees search for information — you need a system in place to monitor what people are searching for. You can then use those insights to continuously improve everyone’s experience by making sure they’re served the most accurate and relevant results. Being able to answer these questions quickly and across large search volumes is what will differentiate your business from the competition.
OPTIMIZING INFRASTRUCTURE & APPLICATIONS
Embrace automation and machine learning: In today’s competitive landscape, there’s very little room for error. When system or application performance deteriorates, your customers notice, and after enough time, this may drive them to adopt alternative solutions. Embracing automation and machine learning can help you identify anomalies, reduce MTTR and customer churn, and forecast future states — boosting your bottom line.
PROTECTING YOUR DIGITAL ECOSYSTEM
Stop threats at scale: Security is fundamentally a data and scale problem. Without the ability to search across data at scale, security insights are limited, and automating prevention and detection are critical when it comes to avoiding damage and loss. Machine learning and signatureless methods that focus on adversary behaviors and techniques, for example, can help you pre-empt advanced malware attacks. This unified approach provides the best of an environment-wide correlation methodology, as well as deep visibility and protection at the endpoint — allowing your security teams to focus on priority issues and make better-informed security decisions.

18 Table of Contents | I.Data | II. Insights | III. Action | IV. Repeat | Final thoughts
III. Equip practitioners for action to operationalize insights
Once you’ve used the power of search to extract insights from your data, it’s time to take action. The third step in the Data → Insights → Action loop is to operationalize insights by making them available to frontline practitioners and ensuring that everyone knows what action to take — and how.
A. Make insight-to-action a team sport
In the 2020 report “The New Decision Makers: Equipping Frontline Workers for Success,” Harvard Business Review concludes that there is “wide-scale agreement across industries that empowering frontline workers with information and insight is key to future success.” Data is more powerful when it’s available to everyone, not just executives and data scientists. More minds playing with data means that a wider variety of perspectives will be accounted for in the insights that result. Security practitioners, for example, know precisely how they need to visualize raw data in order to pinpoint critical metrics such as MTTR, case open duration, and open/closed ratio — and putting data and insights directly in their hands translates into a faster journey through the Data → Insights → Action loop, with more tangible, actionable outcomes for your organization.
A 2019 Deloitte survey of more than 1,000 executives of large companies found that 88% of companies that have educated all personnel on how to leverage data exceeded business goals, compared to just 61% of companies with only a few analytics-trained employees.

19 Table of Contents | I.Data | II. Insights | III. Action | IV. Repeat | Final thoughts
B. Minimize the gap between insights and action
Providing data and insights to everyone in your organization is great — but you’ll also need to arm them with tools that can connect data, insights, and action as a single seamless experience. If an analyst clicks on a dashboard and is immediately presented with a dropdown offering multiple paths to various web apps, the analyst can take action quickly and move on to the next insight. As you round out the Action phase of the Data → Insights → Action loop, be vigilant for areas where your data, analytics, and visualization platform can be integrated with other platforms to streamline the transition between data and decisive action.
MORE ACTION Keep scrolling to learn what operationalizing insights means for your use case. Or, if you’re ready to take what you’ve learned and optimize your outcomes, it’s time to repeat the loop.
Jump to Step IV. Repeat

20 Table of Contents | I. Data | II. Insights | > More Action | IV. Repeat | Final thoughts
MORE ACTION
Turning insight into action for your use caseENABLING BUSINESS VISIBILITY
Proactively identify customer pain points: Ensure your customer support organization has visibility into common customer pain points. When your customers interact with your website and applications, are they finding exactly what they need with ease? Are the results personalized to their interests? Are the results aligned with your business objectives? By empowering customer support, who works directly with customers, to answer these questions proactively, you’ll be improving your customers’ overall experience — and boosting your bottom line as well.
PROTECTING YOUR DIGITAL ECOSYSTEM
Arm every analyst and accelerate investigations with an intuitive UI: Security is an organization-wide responsibility, and all team members need to be empowered. At the same time, providing every analyst in your organization with an intuitive UI — with embedded case management, automated actions, and visualizations that clearly pinpoint the origin, extent, and timeline of an attack — will minimize context switching and shorten response times, ensuring that practitioners at all levels have the right context at the right time and can maintain high standards of operational efficiency.

21 Table of Contents | I.Data | II. Insights | III. Action | IV. Repeat | Final thoughts
IV. Repeat the Data → Insights → Action loop to drive better decisions and better outcomes
Putting your insights into action isn’t the end of the story. You’ll need to take what you’ve learned from this round and refine future cycles. Part of being an insights-driven organization is constantly experimenting and learning and using those findings to optimize the Data → Insights → Action loop. From here on, it’s about making meaningful refinements — you’ll find that small changes and continuous improvement will translate into greater efficiency each time you complete the loop.
A. Periodically re-evaluate your data foundation
On your second (or third, fourth, etc.) time through the Data → Insights → Action loop, you’ll want to refine your choices from the previous iteration. Maybe during your journey you discovered a large understanding gap with a particular type of data, so you’ll want to spend more time and effort on that data this time around. Or, perhaps you encountered a team within your organization whose goals you hadn’t quite accounted for, so you’ll need to make sure that team is aligned with the organization’s overarching data goals.
Each time you return to the Data phase of the Data → Insights → Action loop, you should have a better understanding of what data you have in your organization and what you’re trying to accomplish with data — use that knowledge to make the loop even faster and more efficient.

22 Table of Contents | I.Data | II. Insights | III. Action | IV. Repeat | Final thoughts
B. Optimize for faster, more scalable, and more relevant search
Your first time through the Data → Insights → Action loop, you began to use search to ask questions of your data and visualize it in ways that brought insights to the forefront. Now, as you continue to go through the loop, you’ll want to ask yourself how you can get even faster, more scalable, and more relevant insights. If you noticed that frontline practitioners were experiencing slow search queries for particular data sets, take that feedback to your search platform — whether you’re working with a vendor or have a homegrown solution. The Insights phase of the Data → Insights → Action loop is all about getting more actionable, powerful insights out of your data each time.
C. Know how practitioners engage with your tools
Finally, as you refine your data foundation and optimize the insights you’re getting out of it, don’t lose sight of how individuals within your organization are using your data platform to digest insights and take action. Are there teams that haven’t been fully empowered to use data and take action based on insights? Are there ways that various types of action can be more seamlessly integrated into your data platform? By asking these questions during every iteration of the Data → Insights → Action loop, you’ll ensure that the gap between insight and action gets smaller every time — and, from frontline workers to the C-suite, that translates into benefits for everyone in your organization.

23 Table of Contents | I.Data | II. Insights | III. Action | IV. Repeat | Final thoughts
Final thoughts: The power of search
As we’ve explored here, modern organizations have no shortage of data — in fact, finding ways to derive actionable insights from massive amounts of data is the key to solving many of the market, business, and technology challenges facing organizations today.
The blueprint for success here is the Data → Insights → Action loop: the process of setting up a strategic data foundation; translating that data into actionable insights; equipping practitioners to take action based on those insights; and then continuing to cycle through the loop, optimizing and refining with each iteration.
The power of search is the catalyst to finding success as you embark upon your own journey to transform data into actionable insights. Considering search as you formulate your data strategy heightens your return on investment throughout the rest of your journey. Putting search to work enables you to surface relevant insights at the speed of thought and at scale. And operationalizing search has the power to minimize the gap between insight and action for everyone in your organization.
Elastic is a search company.
Elastic makes the power of search — the ability to instantly surface relevant information and insights from large amounts of data — available for a diverse set of applications and use cases.
With more than a decade of experience helping our customers put their data to work, we’ve created this guide to show how you can use the power of search to transform data into insights — and use those insights to create real benefits for your organization.

24 Table of Contents | I.Data | II. Insights | III. Action | IV. Repeat | Final thoughts
Here are a few examples of customers who have used the power of search to transform data into actionable insights with Elastic:
Technology Finance Telco Consumer Healthcare Public Sector
Auto/ Transport
Retail/ Ecommerce
How will you use the power of search today?

Table of Contents | I.Data | II. Insights | III. Action | IV. Repeat | Final thoughts 25
© 2020 Elasticsearch B.V. All rights reserved.
Elastic makes data usable in real time and at scale for enterprise search, observability, and security. Elastic solutions are built on a single free and open technology stack that can be deployed anywhere to instantly find actionable insights from any type of data — from finding documents, to monitoring infrastructure, to hunting for threats. Thousands of organizations worldwide, including Cisco, Goldman Sachs, Microsoft, The Mayo Clinic, NASA, The New York Times, Wikipedia, and Verizon, use Elastic to power mission-critical systems. Founded in 2012, Elastic is publicly traded on the NYSE under the symbol ESTC. Learn more at elastic.co.
AMERICAS HQ800 West El Camino Real, Suite 350, Mountain View, California 94040General +1 650 458 2620, Sales +1 650 458 2625