A Blueprint for Applying Behavioral Insights to Malaria ...
48
A Blueprint for Applying Behavioral Insights to Malaria Service Delivery Methods and Frameworks for Improving Provider Behavior
Transcript of A Blueprint for Applying Behavioral Insights to Malaria ...

A Blueprint for Applying Behavioral Insights to Malaria Service Delivery Methods and Frameworks for Improving Provider Behavior

A Blueprint for Applying Behavioral Insights to Malaria Service Delivery | i
Contents
Acronyms ............................................................................................................................. iii
Acknowledgements ................................................................................................................ i
Introduction .......................................................................................................................... 1
Background ................................................................................................................................................ 1
The intersection of service delivery and social and behavior change ....................................................... 1
The blueprint ............................................................................................................................................. 2
Step 1. Define the desired behavior ....................................................................................... 4
Recognize the primacy and complexity of provider behaviors ................................................................. 4
Measure performance gaps ....................................................................................................................... 6
Clarify if it is a behavioral or access issue .................................................................................................. 6
Prioritize behaviors .................................................................................................................................... 7
Resources ................................................................................................................................................... 7
Step 2. Define priority target groups and segment them......................................................... 8
Resources ................................................................................................................................................. 10
Step 3. Diagnose the factors affecting behavior .................................................................... 11
A malaria service ecosystem.................................................................................................................... 11
Application to malaria behaviors ............................................................................................................. 14
Factors influencing providers’ adherence to test results ........................................................................ 14
Factors influencing IPTp provision ........................................................................................................... 18
Factors influencing provider reporting .................................................................................................... 21
Resources ................................................................................................................................................. 24
Step 4. Involve target groups in all stages of design .............................................................. 25
Resources ................................................................................................................................................. 27
Step 5. Match interventions to the identified levers of behavior ........................................... 28
Interactive, synergistic approaches tend to be more effective............................................................... 30
Resources ................................................................................................................................................. 32

A Blueprint for Applying Behavioral Insights to Malaria Service Delivery | ii
Step 6. Use a holistic approach to monitoring and evaluation ............................................... 33
Outcome monitoring and evaluation ...................................................................................................... 33
Process and output monitoring ............................................................................................................... 35
Strengths and limitations of selected data sources ................................................................................ 36
Resources ................................................................................................................................................. 37
Conclusion ........................................................................................................................... 38
References .......................................................................................................................... 39

A Blueprint for Applying Behavioral Insights to Malaria Service Delivery | iii
Acronyms
ACT Artemisinin-based combination
therapies
ANC Antenatal care
ANC4 Four antenatal care visits
CHW Community health worker
DHS Demographic and Health Survey
DOT Directly observed therapy
HCD Human-centered design
HMIS Health Management Information
Systems
IMCI Integrated Management of
Childhood Illness
IPTp Intermittent preventive treatment
in pregnancy
IPTp[#] Exact number of doses of IPTp
IPTp[#]+ That number or more doses of IPTp
ITN Insecticide-treated mosquito net
LMIS Logistics Management Information
Systems
MiP Malaria in pregnancy
MIS Malaria Indicators Survey
NMCP National Malaria Control Program
OTSS+ Outreach, Training and Supportive
Supervision Plus
PMI U.S. President’s Malaria Initiative
PSI Population Services International
PRISM Performance of Routine Information
System Management
RDT Rapid diagnostic test
SBC Social and behavior change
SBCC Social and behavior change
communication
SP Sulfadoxine-pyrimethamine
SPA Studies from multiple Service
Provision Assessments
SARA Service Availability and Readiness
Assessments
USAID United States Agency for
International Development
WHO World Health Organization

A Blueprint for Applying Behavioral Insights to Malaria Service Delivery | iv
Acknowledgements
This document was a joint collaboration between Breakthrough ACTION and the U.S. President’s Malaria
Initiative (PMI) Impact Malaria. We would like to acknowledge Angela Acosta for authoring this tool with
support from Heather Hancock (Breakthrough ACTION), Lynn Van Lith (Breakthrough ACTION), Gabrielle
Hunter (Breakthrough ACTION), Katherine Wolf (PMI Impact Malaria), Mary Warsh (PMI Impact
Malaria), Luis Benavente (PMI Impact Malaria), Keith Esch (PMI Impact Malaria), and Elizabeth Arlotti-
Parish (PMI Impact Malaria).
We would also like to thank PMI, specifically Avery Avrakotos, Jessica Butts, Donald Dickerson, Shelby
Cash, Bridget Higginbotham, Nene Diallo, Susan Henderson, Lia Florey, Michael Humes, Joel Kisubi,
Kevin Griffith, Anna Bowen, and Meera Venkatesan for their vision and leadership in the design and
review of this document.
Breakthrough ACTION is funded by the U.S. Agency for International Development (USAID) and U.S.
President’s Malaria Initiative under the terms of Cooperative Agreement No. AID-OAA-A-17-00017.
Suggested Citation
Breakthrough ACTION and PMI Impact Malaria. (2020). A Blueprint for Applying Behavioral Insights to
Malaria Service Delivery: Methods and Frameworks for Improving Provider Behavior. Baltimore: Johns
Hopkins Center for Communication Programs.
A Blueprint for Applying Behavioral Insights to Malaria Service Delivery | 1
Introduction
Background
Prevention and control of malaria depend, in part, on key services such as proper identification of
suspected malaria cases, parasite-based diagnosis and treatment, and intermittent preventive
treatment in pregnancy (IPTp). Much of the time, however, these services are unsought, not provided at
all, or are delivered in an incomplete or inconsistent manner. For example, provider distrust of
sulfadoxine-pyrimethamine (SP) and malaria rapid diagnostic tests (RDTs) can lead to nonadherence to
clinical guidelines, while failure to submit reports in a timely fashion contributes to stock-outs.1
Moreover, perceptions of poor service quality, social barriers, and misconceptions can cause clients to
delay care or discontinue treatment.
The intersection of service delivery and social and behavior change
Social and behavior change (SBC) programs focus on behavior. They place the client and the provider at
the center, recognizing that they are affected by their immediate surroundings, social norms, personal
beliefs and attitudes, abilities, resource constraints, and interactions with others. SBC programs test and
implement human-centered solutions. Interventions range from communication materials and activities,
procedural changes, product innovations, and minor environmental modifications, with the goal of
facilitating individual and collective change.
Service delivery programs provide access to commodities and equipment, implement quality assurance
systems to monitor effectiveness, train and supervise providers, update guidelines, and strengthen data
quality. They play an essential role in ensuring facility and provider readiness to provide services.
However, even when commodities, equipment, systems, and training are in place, these are not always
enough to ensure the desired behaviors are practiced.
When service delivery and SBC programs combine efforts, they can improve health outcomes, yet
service delivery and SBC programs often operate in silos. One reason has been a lack of understanding
of concrete ways in which SBC interventions can support and integrate with service delivery efforts. Two
areas with potential integration are provider behavior change and service communication:
• Service communication refers to the social and behavior change communication approaches
used before, during, and after service delivery. The client experience begins in the community,
as clients hear about the quality and availability of health services. It continues once clients start
services, become exposed to the reception/intake process, and interact with providers. After
their initial visit, clients’ perceptions of care are mediated by follow-up visits or by engagement
with ancillary services such as mothers’ groups as well as any counseling they may have
received. Malaria service communication encompasses activities that motivate caregivers to
seek treatment for children’s fevers, the ways providers counsel pregnant women during
antenatal care (ANC) visits, methods to encourage clients to take all artemisinin-based
combination therapies (ACT) doses after a clinic visit and after symptoms subside, and ways of
strengthening facility-community linkages.2

A Blueprint for Applying Behavioral Insights to Malaria Service Delivery | 2
• Provider behavior change understands that many factors, such as access to resources,
supervision, and skills influence the way providers deliver services. There is also growing
recognition that there are other crucial, often overlooked factors, such as the workplace
environment, norms and relationships, beliefs/attitudes, and values affect provider motivation.
Provider behavior change efforts seek to address these factors, both old and new.3 Once clients
arrive at the service delivery point, provider behavior change efforts can ensure clients have a
positive experience, one that will help them return for future services and maintain healthy
malaria behaviors.
The two overlap in some respects: both seek to improve the client experience and quality of care and
both can use communication methods to improve interpersonal communication and provider behavior.
Service communication may include advocacy, allowing for communities and facilities to discuss and
address bottlenecks. On the other hand, provider behavior change allows room for additional
approaches to motivate providers to provide quality services. From an SBC perspective, providers are
both a channel for communication targeted to clients (service communication) and a target group for
behavioral interventions (provider behavior change).
This document seeks to bridge silos by outlining some steps for approaching provider behavior change.
A shared framework will facilitate mutual understanding, coordination, innovation, and synergy in
malaria service delivery.
To keep this document focused, it does not cover community-based health workers; for the same
reason, it was drafted with facility-based public sector providers in mind, though much of the content
may also apply to community and private sector providers. The intended primary audience is in-country
implementing partners and National Malaria Control Programs (NMCPs), though donors and other
groups may find this useful as well.
The blueprint
The proposed steps are arranged in chronological order:
Step 1. Define the desired behavior.
Step 2. Defining priority provider groups.
Step 3. Identifying factors that affect behaviors.
Step 4. Involving users (providers and clients) in program design.
Step 5. Matching interventions to the factors uncovered.
Step 6. Using a holistic approach to monitoring and evaluation.
Conveniently, this process can be translated into an outline of a strategy for provider behavior change. A
malaria service ecosystem model (Step 3), which shows the different levels of factors and actors that
influence provider behavior, provides a framework for understanding behavioral determinants,
identifying key stakeholders and interventions and monitoring and evaluation.

A Blueprint for Applying Behavioral Insights to Malaria Service Delivery | 3
Users of this document might find it useful for:
• Understanding how an SBC lens can benefit efforts to change provider behavior
• Identifying powerful but rarely discussed factors that affect provider behavior
• Browsing a menu of possible interventions to gather ideas for program design
• Learning about user-centered approaches to intervention design
• Developing indicators for monitoring and evaluation
The process is illustrated using case management for uncomplicated malaria, IPTp, and reporting
behaviors in malaria control settings. Elimination settings, severe malaria, and case management in
malaria in pregnancy (MiP) are not discussed; while they will have different behavioral determinants,
the general steps for using an SBC lens may apply to them as well.

A Blueprint for Applying Behavioral Insights to Malaria Service Delivery | 4
Step 1. Define the desired behavior Which behavior(s) are we trying to change?
Recognize the primacy and complexity of provider behaviors
Making strides in case management and MiP will require a strong focus on provider behavior. As key
influencers in the client-provider interaction, providers serve as gatekeepers for the uptake of IPTp,
malaria testing, and adherence to test results. Providers’ interpersonal skills and the quality of
counseling may affect client comprehension of medication regimens, completion of referrals, and future
care-seeking. As the ones responsible for filling in registers and for submitting stock and Health
Management Information Systems (HMIS) forms, providers also control the timeliness, completeness,
and accuracy of service statistics. Improving providers’ case management, MiP, and reporting behaviors
will be crucial for reducing morbidity and mortality, improving surveillance, and measuring gaps and
progress in malaria service delivery.
However, provider behaviors are complex in and of themselves. Table 1 shows that some of the key
malaria provider behaviors involve multiple sub-behaviors. Sometimes national and global guidelines are
ambiguous (for example, they may say, “test all suspected cases,” without specifying what constitutes a
suspected case). In some cases, guidelines from different units of the Ministry of Health may conflict (for
example, reproductive health guidelines versus malaria guidelines regarding IPTp administration). The
process of developing and disseminating tools and guidelines should account for how those tools and
guidelines might be translated in practice. In situations where guidelines already exist, programs rolling
them out should clearly spell out expected sub-behaviors for providers and means of measuring them.
TABLE 1. SUB-BEHAVIORS RELATED TO CASE MANAGEMENT FOR UNCOMPLICATED MALARIA, IPTP, AND REPORTING WITHIN EACH
PROVIDER ADHERENCE TO CASE MANAGEMENT GUIDELINES FOR UNCOMPLICATED MALARIA4
PROVIDER ADHERENCE TO MIP GUIDELINES (SPECIFICALLY IPTP3+*)5
1. Identify a suspected case of malaria (usually by asking
patients about a history of fever and conducting a
physical exam).
2. Test all cases of suspected malaria using RDTs or
microscopy.
3. Provide ACTs only to test-positive cases.
4. Assess clients with negative results for other common
causes of fever (multi-step).
5. Prescribe appropriate treatment to clients with
negative results; do not give antimalarials.
6. Assess and treat for other co-morbidities/co-
infections.
7. For clients with confirmed malaria, counsel the client
about when and how to take ACTs, and to complete all
1. Identify pregnant women who are eligible for
IPTp-SP.
• Estimate gestational age (must be at
least 13–16 weeks’ gestation to receive
the first dose of IPTp).
• Check if she is taking cotrimoxazole (if
she is HIV+ and not on cotrimoxazole,
provide it; if she is on cotrimoxazole,
refrain from providing SP).
• For subsequent doses, check when her
last SP dose was given (should be at least
four weeks before).
2. Counsel client on the reasons for SP use and
give the client the opportunity to ask
questions.

A Blueprint for Applying Behavioral Insights to Malaria Service Delivery | 5
TABLE 1. SUB-BEHAVIORS RELATED TO CASE MANAGEMENT FOR UNCOMPLICATED MALARIA, IPTP, AND REPORTING WITHIN EACH
PROVIDER ADHERENCE TO CASE MANAGEMENT GUIDELINES FOR UNCOMPLICATED MALARIA4
PROVIDER ADHERENCE TO MIP GUIDELINES (SPECIFICALLY IPTP3+*)5
doses. Counsel client on signs of severe malaria and
the circumstances under which they should return to
facility. For clients with negative test results, counsel
them on the results and treatment implications
(whether antipyretic only, treatment of other disease
needed, or no medicine needed). For all clients,
provide counseling on malaria prevention measures,
and provide clients with the opportunity to ask
questions.
8. Completely and accurately fill out each step of service
provision in register(s)/patient cards.
9. Correctly tally data for reports.
10. Submit reports on time.
3. Administer SP via directly observed therapy
by the health provider.
4. Counsel the woman on how to prevent
malaria (use of insecticide-treated mosquito
nets [ITN] and when to return for her ANC
visit. Give the client an opportunity to ask
questions. Discuss potential barriers that the
client may face and work with the client to
brainstorm solutions.
5. Completely and accurately fill out each step
of service provision in register(s)/patient
cards.
6. Correctly tally data for reports.
7. Submit reports on time.
* IPTp3+ indicates three or more doses of IPTp

A Blueprint for Applying Behavioral Insights to Malaria Service Delivery | 6
Measure performance gaps
Breaking down “adherence to guidelines” into sub-
behaviors can be useful for understanding specific
performance gaps. Providers may be more likely to
comply with some steps while missing others or
perform some steps incorrectly. Mapping sub-
behaviors and measuring them can be used to
design future programs.
The data from Figure 1 was from a health facility
assessment in a province in Mozambique.6 The first
significant breakdown in the behavioral cascade
was in malaria testing (82%). The other two major
weaknesses identified were inappropriate dosing
(71%) and incorrect counseling (59%). On the other
hand, use of appropriate antimalarials was
reasonably high at 89%. Interventions, therefore,
might need to focus on offering/conducting RDT
tests, correct antimalarial dosing, and counseling.
Some of this data may be available through the
HMIS, supportive supervision checklists, and health
facility surveys. The first, however, may not be the
best source of data for identifying clients with
fevers; past studies have shown that providers do
not routinely screen clients for fever, and have
suggested adjustments to better gauge malaria
testing practices with routine data.7,8
Clarify if it is a behavioral or access issue
Access to key equipment or malaria commodities is likely to prevent adherence to guidelines, or at best,
result in workarounds that make adherence hard to measure. Stock-outs of SP, for example, may result
in public providers writing prescriptions for pregnant women to purchase SP at pharmacies and drug
shops, reducing the likelihood of women taking IPTp, as women have to purchase it separately.
Alternatively, providers may not offer any SP at all.
However, some issues that may normally be considered a structural issue, such as stock-outs, may have
a behavioral root cause. Examples of these causes include late submission of supply chain reports and
the failure to issue commodities from the storeroom to the actual point of service (e.g., lab or
consultation room).
One way to identify if the root cause is access or behavior is to triangulate access/logistics data with
performance data. If performance was close to or at desired levels during a period when the supplies
were in stock, then it was likely to be an access issue, and focusing on addressing supply chain
Figure 1: Malaria case management pathway for true malaria cases in a province in Mozambique, 2018. Percentages in boxes outlined in dashed lines represent cumulative proportion of patients managed correctly to that point. Boxes outlined in bold denote final categorization and percentages refer to final proportion of cases falling into each final categorization. Percentages reflect adjustment for cluster‑sampling design.

A Blueprint for Applying Behavioral Insights to Malaria Service Delivery | 7
bottlenecks rather than seeking to change provider behaviors will be important. If performance was low
or medium even when commodities and supplies were in stock, then the poor performance is likely to
be a behavioral issue, meaning a significant role may be available for social and behavior change
approaches. For some key commodities (such as SP, RDTs and ACTs), existing data sources such as
Logistics Management Information Systems (LMIS) and HMIS can be compared to see if it is a behavioral
or access issue. However, lack of access to drinking water for directly observed therapy (DOT) of IPTp, as
well as some behavioral root causes of supply chain issues, may only likely be assessed through facility
surveys or supervision visits.
Prioritize behaviors
While interventions can touch on multiple behaviors, they will be most effective when no more than
two to three specific sub-behaviors are emphasized at any given time. Multiple behavioral objectives
can make program design more complex, more time and resource-intensive, and providers have
difficulty retaining content. Interventions can be staggered/phased to reduce these challenges. For this
reason, program designers will ideally use data to rank which behaviors should be prioritized (see Step
6: Use a holistic approach to monitoring and evaluation for data sources). Criteria for prioritization
should include behaviors with the most room for improvement, behaviors of greatest significance for
health outcomes, or behaviors within the scope and expertise of the collaborating agencies involved.
Resources
• World Health Organization (WHO) guidelines for the Treatment of M
• WHO guidelines on Intermittent Preventive Treatment in Pregnancy (IPTp)
• Population Services International (PSI) Keystone Design Framework: Diagnose Phase Resources
• Think | BIG Guidance and Sample Behavior Profiles, Malaria
• For Outreach, Training and Supportive Supervision Plus (OTSS+) checklists, contact Keith Esch at
PMI Impact Malaria ([email protected])
A Blueprint for Applying Behavioral Insights to Malaria Service Delivery | 8
Step 2. Define priority target groups and
segment them Who do we want to practice the desired behavior?
Targeting people as a general group is not the best way to achieve behavior change. Segmentation is an
important part of designing behavior change interventions. It involves dividing target groups into smaller
groups of people with similar needs, values and/or characteristics. Segmentation recognizes that
different groups will respond differently to interventions.10 Specific interventions and messages for
specific groups will likely resonate more than generic ones and lead to more efficient use of resources.
This section lists some ways to segment providers. In addition to the methods listed below,
segmentation approaches can also be combined (e.g., grouping providers of a certain cadre based on
attitudes and biases).
Some conventional ways of segmenting providers have been by cadre, function, years in service, or
public versus private. One example of segmentation by function is targeting providers who see pregnant
women (such as ANC midwives) for MiP trainings. Segmentation by cadre involves grouping providers
who have a similar level of medical training (such as nurses). In malaria case management, particularly
adherence to RDT results, lower cadres (such as community health workers) are more likely to adhere to
guidelines than higher ones (such as doctors) and they have demonstrated excellent adherence in
managing fevers in both children and pregnant women.10 On the other hand, providers with more years
in service and higher educational training tend to rely more on their experience than on tests.11
Generally speaking, public sector providers demonstrate higher adherence to guidelines, but private
sector providers have a better reputation for customer service.12,13
Another way to segment providers has been by location, such as community versus facility-based
providers, and further, by facility type (primary health facility versus referral hospital), which have very
different environments and backgrounds; facility providers are paid employees at a public or private
clinic and have received training within the formal medical or nursing curricula, while community-based
providers receive minimal financial support (if any) and are trained outside the formal medical
education system. They are often chosen by community members and, as such, have strong
relationships with clients.3
Segmentation by cadre, function, years in service, facility type, and public versus private can usually be
done with administrative data and through consultation with district leadership or in the case of private
sector, the local professional association.
When segmenting by cadre or function, programs need to understand the segment of those who should
be doing the given behavior, versus those who have decision-making power over the given behavior, as
well as norms and power dynamics related to different cadres. For example, while nurses and midwives
may primarily engage in the desired behaviors, the presence of a once-weekly visiting (or full-time)
physician may affect their clinical autonomy within that facility. When this is the case, interventions
targeted at nurses and midwives may not be successful if other influencers are not brought into the
process.

A Blueprint for Applying Behavioral Insights to Malaria Service Delivery | 9
One approach that has been used in the private sector for family planning has been to categorize
providers as A, B, C, and D, based on client volume and the provider’s ability to use the product.
Categories range from A: providers that have the highest potential due to high volume and high ability,
through B and C to D: providers that have low client volume and low ability.14 This segmentation can be
done through proficiency tests and service statistics. For example, providers who score poorly on
Integrated Management of Childhood Illness (IMCI) skills tests who work in high-volume facilities may be
at high risk for non-adherence to negative test results and may need to be prioritized.
Another approach involves classifying providers based on their attitudes, beliefs, and biases; in family
planning for youth, sample segments or provider “archetypes” have included “Average Passives” (aware
of adolescent and youth sexual reproductive health practices, but somewhat biased and relatively
unsympathetic for youth), the “Sympathetic Guardian” (relatively young, mostly nurses sympathetic to
youth sexuality), and others. This method requires surveys and sophisticated statistical methods.14 One
less statistically intensive application is the medical detailing method, used by pharmaceutical sales
representatives, where they tailor their messages to individual providers based on their assessment of
the providers’ stage of readiness, attitudes, beliefs, or biases. However, this is an individual-level
approach, not a group or population-level one.
Similar to providers, community members have been historically targeted based on demographics
(caregivers, partners/spouses, mothers-in-law, or grandmothers) or a combination of values, interests
and attitudes (psychographics), or life stages (such as youth, newly married, expecting a baby, or raising
a family).9
One last key group to consider for malaria service delivery are policymakers/managers. A WHO review
of 70 countries found that district management teams were critical to successful implementation of the
IMCI approach, and in some countries, district leadership attitudes had a stronger effect on the quality
of implementation than socioeconomic development or donor support.16 Compared to providers,
district managers’ priorities may be shaped to a larger degree by factors such as politics and
organizational structures.17 Malaria programs can incorporate an SBC lens into district management
assessments to better understand district management attitudes, motivations, and the local political,
resource, and organizational landscape they inhabit.

A Blueprint for Applying Behavioral Insights to Malaria Service Delivery | 10
TABLE 2. WAYS TO SEGMENT PROVIDERS
SEGMENTATION APPROACHES PROS CONS
Cadre, function, years in service, public versus private, facility type or location (this is akin to the demographics or life stages approach used to segment community members)
Approach is convenient (ability to use administrative data or consultation with local leadership).
Administrative data may not be complete or accurate.
Assumes they all share the same beliefs, values, and motivation to perform, which may not be the case. May not fully account for on-site power dynamics.
Volume and ability Potential high impact on health outcomes will be due to the focus on high-volume facilities.
Additional data needed to measure facility volume and assess provider skills.
Assumes they all share the same beliefs, values, and motivation to perform, which may not be the case.
Attitudes, beliefs, and biases Intervention is more likely to address behavioral root causes.
Additional data needed to measure attitudes, beliefs, and biases. More sophisticated analytical skills may also be needed if analyzing data from a group of providers.
If the detailing method is used, hiring personnel with strong interpersonal skills who can assess and tailor approaches to individual providers/clinics is important.
Resources
• How to Do Audience Segmentation
• Provider Behavior Change Implementation Kit
• PSI Keystone Design Framework: Diagnose Phase Resources

A Blueprint for Applying Behavioral Insights to Malaria Service Delivery | 11
Step 3. Diagnose the factors affecting behavior What needs to be addressed to change the behavior?
A thorough diagnosis of the problem should begin with a list of potential contributors, using data to
identify the ones at play in a given context, and agreement on which factors can be addressed by a
social and behavior change approach. Behavioral theories are useful for providing a menu of potential
factors to consider during formative research or during a situation analysis. Provider behavior change or
service communication programs have used behavioral economics,* the stages of change model,† and
the socio-ecological model (SEM), among others.2,3,14,18–20 The Circle of Care model, which unpacks the
three stages of service delivery (before services, during service, and after services), can also be used to
identify communication needs at each stage.21 This document uses the SEM because it provides the
flexibility of considering malaria service delivery issues from the client perspective, the provider
perspective, and the health system manager perspective. Just as the SEM shows the levels of influence
in malaria service delivery, it can also illustrate the types of people who should be involved in the
design.
Data sources for behavioral diagnoses can include a review of the grey and published literature,
qualitative data collection (focus groups, key informant interviews, and observations), and quantitative
data collection (such as knowledge, attitudes, and practice questions included in health facility
assessments and supportive supervision visits or as standalone provider surveys).
Each setting may have a different set of determinants and determinants present in multiple settings can
be far more influential in some settings than others. This section explains the types of behavioral
determinants involved at each level of the SEM. It is followed by examples of factors for a few specific
malaria behaviors. This could serve as a menu of factors (or the start of one) that researchers should
consider as they design formative research activities for malaria.
A malaria service ecosystem
The SEM below shows that behavior is influenced by many factors within and beyond the individual.
They are interlinked and mutually reinforcing (as shown by the bi-directional arrows). The diagram was
mainly drafted with public sector facility-based providers in mind, but many factors apply to private
sector and community health workers as well (for a description of factors influencing community health
worker performance in malaria programs see the systematic review conducted by Chipukuma, et al.22
* Behavioral economics identifies cognitive, social, situational, or economic factors. † Stages of change model traces a person’s progress from awareness to behavioral maintenance.

A Blueprint for Applying Behavioral Insights to Malaria Service Delivery | 12
Figure 2. A malaria service ecosystem. The black text denotes influential actors at each level, while the blue text highlights determinants of provider behavior. Every level is interlinked and mutually reinforcing.

A Blueprint for Applying Behavioral Insights to Malaria Service Delivery | 13
The model recognizes that providers and clients are individuals whose malaria-related practices are
affected by their personal beliefs about risk (such as the client’s perceived susceptibility to malaria and,
for the provider, how serious the consequences could be or incorrectly managing a case (e.g.,
reputational risk or job security), the effectiveness of the behavior or intervention, their own confidence
in their ability to practice it, power dynamics determining their ability to make decisions about their own
health or, for the provider, the treatment plan, social norms, attitudes, perceptions and expectations
about quality of care, and their assumptions toward certain provider or client characteristics (such as
access to funds or transport). At the individual level, partners and family members are the main
influencers (for providers as well as clients, as they must often balance their professional and domestic
roles), with providers being additionally influenced by colleagues and supervisors.
The dyadic nature of the provider-client interaction is also reflected in the diagram, where it is mediated
by the quality of the provider’s interpersonal communication approach and the client’s ability to
advocate for him or herself, their social status in relation to each other, and the power imbalances that
result from all of these factors.
The facility/service point level reflects the influence of client load, workflow processes, workplace
(peer/hierarchical) norms and environment, peer support, and feedback and performance improvement
practices. High client volumes, complicated processes, the types of available diagnostic and treatment
services, good/poor coordination between departments, facility type (e.g., referral facilities that
routinely handle life-threatening emergencies), and inadequate feedback from management may lead
providers to take “shortcuts” during routine service provision. Similarly, these factors can deter clients
from returning. At this level, officers-in-charge and unit heads are the key actors/influencers, though
other factors like seniority, cadre, and personal connections can affect power/interpersonal dynamics.
Facility readiness (the availability of essential commodities and trained providers) is also a factor at this
level.
At the community level, the formal health sector competes with multiple options for health advice and
services. Drug shops, traditional healers, spouses, relatives/in-laws, friends, social/community groups,
and community and religious leaders can affect a client’s decision to seek services, their attitudes
toward formal sector services and providers, the source of service, the timing of service utilization, as
well as the adoption or discontinuation of a behavior. Social and gender norms around care-seeking
influence perceptions of people who may choose to seek care or require complex processes for seeking
permission or approval for care. The multiplicity of options can cause clients to present to formal health
care services late or in advanced stages of disease or pregnancy, creating stress for providers. Public
sector providers are sometimes transferred to new areas, where they face a learning curve in
understanding the local culture and power dynamics in addition to building relationships with a new
group of clients.
Finally, the national/regional/district/organizational level reflects broader social and organizational
influences on service delivery and care-seeking. The level of public discussion among opinion leaders
and the media can influence households and all players in the health system, while policies, professional
associations, and training and accreditation programs regulate professional norms and expectations.18
The degree of harmonization across different health areas, use of data for decision-making, supply chain
management procedures at regional or national level, and transmission setting (high/low), and the type
of feedback or guidance given to lower levels influence service provision. Finally, health financing

A Blueprint for Applying Behavioral Insights to Malaria Service Delivery | 14
systems—such as cost-recovery models, performance-based financing, and health insurance—affect
user fees, commodity availability, reporting requirements, and service utilization.
Although the SEM flags clients and providers, the presence of the national/regional/district/organization
and facility levels shows that the behaviors of policy-makers and managers matter as well.
Application to malaria behaviors
In the following tables, factors affecting provider adherence to negative test results, IPTp provision, and
reporting are listed. These tables are meant to illustrate the use of the model, not to provide a
comprehensive list, and can be used as a starting point when beginning to conduct formative
assessments. For the sake of efficiency, systematic reviews were the main source of information.
Which of these factors appear to be most influential across settings is not yet clear, since the settings
may not have all been considered/assessed uniformly; for now, every setting will likely have its own set
of priority factors that would be identified through formative and evaluation research?
Once the relevant factors are identified, they should be consistently revisited to ensure that the
program is being developed, implemented, and evaluated in a way that systematically addresses them.
Factors influencing providers’ adherence to test results
Most studies in a recent systematic review reported that >90% of all RDT-positive clients receive
antimalarial medicines.12 The larger behavioral gap appears to be adherence to negative results: rates
for adherence to negative results were lower overall, with a fitted temporal trend showing middling (but
improving) rates of 50–80% over time.12 For this reason, the table below focuses on the latter.

A Blueprint for Applying Behavioral Insights to Malaria Service Delivery | 15
Photo credit: Mwangi Kirubi, PMI Impact Malaria
TABLE 3. TEST RESULTS ADHERENCE FACTORS
PROVIDER-LEVEL
FACTORS
Beliefs about current malaria prevalence: Providers believe malaria prevalence should
be higher than RDT-positive rates.**23
Self-image: Clinicians feel that negative RDTs contradict their clinical expertise and
rationalize this dissonance by finding fault/distrusting negative RDT results instead.23
Community health workers (CHWs) and drug shops see the test as boosting their
legitimacy.24 This can also be interpreted as “self-efficacy,” or self-confidence.
Alignment with values and priorities: Carefully developed messages addressing existing
provider principles and practices, as well as Ministry of Health branding (an institution
known to influence the government health workers in this setting), appeared to
motivate providers. For example, where facility-based providers felt RDTs created extra
unpaid work, or where drug shop vendors felt it would hamper profit, motivation to use
RDTs or even participate in a study with free commodities declined; the intervention did
not position itself as benefiting providers in ways they valued.23
Diagnostic skills: Providers (especially at peripheral facilities) generally know they
should assess for other causes of fever, but do not know how to go about it
effectively/efficiently.24
CLIENT-LEVEL
FACTORS
Children under five or severely ill clients: Providers fear of missing malaria cases due to
the possibility of serious consequences in these groups.24,25

A Blueprint for Applying Behavioral Insights to Malaria Service Delivery | 16
TABLE 3. TEST RESULTS ADHERENCE FACTORS
DYADIC-LEVEL
FACTORS
Feedback on client outcomes: Observing that RDT-negative clients recover without
antimalarial treatment was associated with a positive effect on behavior.23 Similarly,
noting that clients recover after taking ACTs despite being RDT-negative had a negative
effect. A behavioral science lens suggests that the kinds of client outcomes providers
hear about or observe affects the types of client recovery stories that providers keep
top-of-mind.26 The ability to monitor clients was considered an effective way to build
trust in negative RDTs.23
Provider perceptions of client demand: Providers reported that clients have pressured
them to provide antimalarials in the past.24
FACILITY/SERVICE
DELIVERY POINT-
LEVEL FACTORS
Over-confidence in microscopy: Providers distrusted negative RDT results when
microscopy, “the gold standard,” showed the client had malaria.24,26
High workload, many clients: Providers default to habit because they do not have the
mental bandwidth or the time to consider alternative diagnoses.23
Task allocation and shift schedules: Although RDTs can be done by any trained
provider, RDT or microscopy results may not be available in a timely fashion in facilities
either when the staff is absent, or where these are both only performed by laboratory
staff and the laboratories are closed in the evenings and weekends.
Diagnostic equipment: Lack of supplies and equipment for diagnosing non-malarial
causes impact people with negative test results.
COMMUNITY-
LEVEL FACTORS
*[see anecdotal factor below]
NATIONAL,
REGIONAL,
DISTRICT, OR
ORGANIZATIONAL
LEVEL FACTORS
Clear, detailed, directive guidelines about management of negative diagnoses:
Clarifying providers’ role and strengthening their skills in the management of alternative
causes was associated with adherence. This was true even for CHWs and drug shops
where providers’ scope were limited to provision of just antipyretics or no medicines at
all.23 Adherence was also higher when there was no ambiguity or flexibility allowed for
certain types of clients, such as those under five or who might have trouble returning:
the types of clients where providers worry about the illness progressing.23
Feedback from authorities: The highest adherence was observed among providers who
had been closely supervised. In an evaluation of a text messaging program, providers
considered text message reminders as a form of surveillance, and they adhered even
when they felt the guidelines contradicted their clinical judgment.23
The diagnostic landscape: Countries where testing was more familiar used RDTs more
appropriately.23 There is also a lack of rapid, low-cost reliable tests for other, non-
malaria causes of fever, making it difficult for providers to make alternate diagnoses.
* Based on anecdotal data, we found providers may feel that not giving malaria drugs may result in loss of
client/community trust in the facility, particularly if clients expect to receive such drugs regardless of test
result.

A Blueprint for Applying Behavioral Insights to Malaria Service Delivery | 17
TABLE 3. TEST RESULTS ADHERENCE FACTORS
** In Senegal, rainfall, which may be a proxy for expected malaria prevalence, was associated with providers’
use of RDTs. Rainfall/seasonality has not been measured in other studies on adherence to test results but
beliefs around malaria prevalence have been identified in other countries.27
Box 1. Knowledge is not enough—the importance of norms and attitudes
Traditional approaches to provider behavior change tend to emphasize knowledge and skills-building activities
such as trainings. While these are important, more and more studies increasingly implicate the presence of
provider norms, beliefs, and attitudes that inhibit adherence to malaria case management guidelines.
Davlantes, et al. found that supervision and training were not statistically associated with proper malaria case
management in Guinea. Instead, the most strongly and consistently predictive factor was a provider norms
index, which measured the perceived adherence to malaria case management guidelines among the providers’
colleagues.8 The influence of norms is plausible since providers typically look to medical colleagues for
information about malaria28 in the context of scarce access to other sources of information, and since norms
have been implicated as behavioral determinants for provider behaviors in other health areas.29 However,
norms are typically unmeasured by assessments involving malaria providers, so it is not known how much of an
issue this is in other countries. Ideally, norms would be consistently measured as potential determinants of
behavior (see Step 6: Use a holistic approach to monitoring and evaluation).
Other researchers have found that beliefs/attitudes play a major part across multiple countries, as shown in the
table above. They have since made the following recommendations:
“Interventions to improve the treatment of uncomplicated malaria should strive to change what providers
prefer, rather than focus on what they know [emphasis added].”30
“Respond to providers’ priorities and expectations [emphasis added].”23
Seeing providers as people, not merely channels for delivering services, is vital. They are individuals and
communities/groups who have beliefs, values, preferences, expectations, and social norms that may affect their
actions. By considering factors beyond knowledge, the universe of potentially effective interventions expands.31
Many of these non-knowledge factors are explored in detail in this section and sample interventions can be
found in Step 5.
Box 2. Characterizing the gap in client-provider communication
Counseling is a standard part of clinical practice, but it is an understudied area. Studies from multiple Service
Provision Assessments (SPA) and Service Availability and Readiness Assessments (SARA) have shown that
provider counseling and communication can improve a client’s intention to return.32 Some research indicates
that malaria counseling can be far from optimal; a study in Mozambique found that only 58–62% of clients
prescribed an antimalarial correctly recited dosing instructions, casting doubt on their ability to adhere to
treatment regimens.6 Similarly, a recent study in Uganda found a communication gap between CHWs and
caregivers; caregivers did not understand that rectal artesunate was not a complete treatment for severe
malaria, so they did not understand the need to complete referrals.33
Research and supervision activities can be designed to assess the following:
1. How providers interpret clinical guidelines
2. How providers perceive certain information should be communicated to clients
A Blueprint for Applying Behavioral Insights to Malaria Service Delivery | 18
3. Whether providers know what clients consider a quality interaction
4. How, when and whether they counsel clients
5. Clients’ comprehension of the messaging
6. How the counseling or the messaging affect clients’ decision-making
Factors influencing IPTp provision
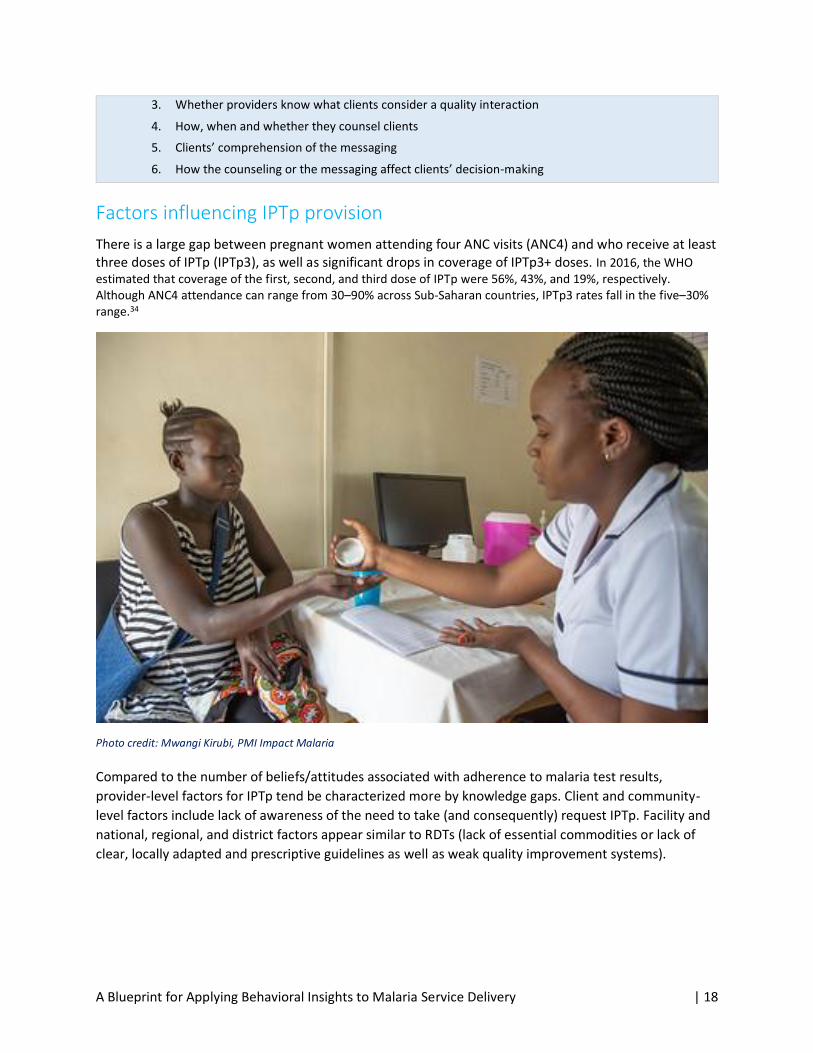
There is a large gap between pregnant women attending four ANC visits (ANC4) and who receive at least three doses of IPTp (IPTp3), as well as significant drops in coverage of IPTp3+ doses. In 2016, the WHO estimated that coverage of the first, second, and third dose of IPTp were 56%, 43%, and 19%, respectively. Although ANC4 attendance can range from 30–90% across Sub-Saharan countries, IPTp3 rates fall in the five–30% range.34
Photo credit: Mwangi Kirubi, PMI Impact Malaria
Compared to the number of beliefs/attitudes associated with adherence to malaria test results,
provider-level factors for IPTp tend be characterized more by knowledge gaps. Client and community-
level factors include lack of awareness of the need to take (and consequently) request IPTp. Facility and
national, regional, and district factors appear similar to RDTs (lack of essential commodities or lack of
clear, locally adapted and prescriptive guidelines as well as weak quality improvement systems).
A Blueprint for Applying Behavioral Insights to Malaria Service Delivery | 19
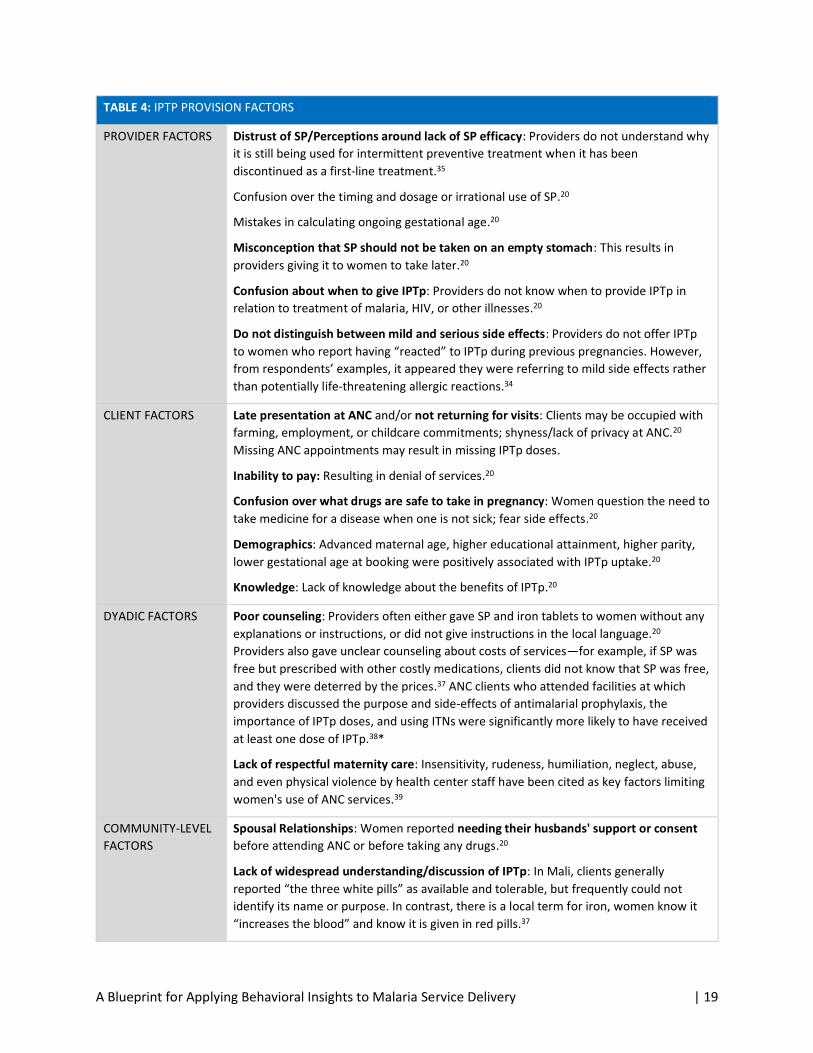
TABLE 4: IPTP PROVISION FACTORS
PROVIDER FACTORS Distrust of SP/Perceptions around lack of SP efficacy: Providers do not understand why
it is still being used for intermittent preventive treatment when it has been
discontinued as a first-line treatment.35
Confusion over the timing and dosage or irrational use of SP.20
Mistakes in calculating ongoing gestational age.20
Misconception that SP should not be taken on an empty stomach: This results in
providers giving it to women to take later.20
Confusion about when to give IPTp: Providers do not know when to provide IPTp in
relation to treatment of malaria, HIV, or other illnesses.20
Do not distinguish between mild and serious side effects: Providers do not offer IPTp
to women who report having “reacted” to IPTp during previous pregnancies. However,
from respondents’ examples, it appeared they were referring to mild side effects rather
than potentially life-threatening allergic reactions.34
CLIENT FACTORS Late presentation at ANC and/or not returning for visits: Clients may be occupied with
farming, employment, or childcare commitments; shyness/lack of privacy at ANC.20
Missing ANC appointments may result in missing IPTp doses.
Inability to pay: Resulting in denial of services.20
Confusion over what drugs are safe to take in pregnancy: Women question the need to
take medicine for a disease when one is not sick; fear side effects.20
Demographics: Advanced maternal age, higher educational attainment, higher parity,
lower gestational age at booking were positively associated with IPTp uptake.20
Knowledge: Lack of knowledge about the benefits of IPTp.20
DYADIC FACTORS Poor counseling: Providers often either gave SP and iron tablets to women without any
explanations or instructions, or did not give instructions in the local language.20
Providers also gave unclear counseling about costs of services—for example, if SP was
free but prescribed with other costly medications, clients did not know that SP was free,
and they were deterred by the prices.37 ANC clients who attended facilities at which
providers discussed the purpose and side-effects of antimalarial prophylaxis, the
importance of IPTp doses, and using ITNs were significantly more likely to have received
at least one dose of IPTp.38*
Lack of respectful maternity care: Insensitivity, rudeness, humiliation, neglect, abuse,
and even physical violence by health center staff have been cited as key factors limiting
women's use of ANC services.39
COMMUNITY-LEVEL
FACTORS
Spousal Relationships: Women reported needing their husbands' support or consent
before attending ANC or before taking any drugs.20
Lack of widespread understanding/discussion of IPTp: In Mali, clients generally
reported “the three white pills” as available and tolerable, but frequently could not
identify its name or purpose. In contrast, there is a local term for iron, women know it
“increases the blood” and know it is given in red pills.37

A Blueprint for Applying Behavioral Insights to Malaria Service Delivery | 20
TABLE 4: IPTP PROVISION FACTORS
Power dynamics: In Mali, ANC care itself can be considered inappropriate or shameful,
specifically if an older woman is expected to agree to be examined by a younger female
care provider.37
Lack of privacy/social norms around ANC: In Mali, shame associated with going to ANC
was said to make a woman and the child vulnerable to curses from jealous neighbors,
made worse because ANC is public and everyone will know (cited by husbands, not by
women).37
Cultural norms/social taboos about when to publicly recognize pregnancy: These
contribute to late presentation.
FACILITY-LEVEL
FACTORS
Stock-outs of SP: Low or no stock results in providers requiring clients to purchase them
elsewhere).20
Insufficient water and cups: If this happens, facilities may not offer SP, or they may ask
women to share cups or to purchase water, which they may refuse.20
High client-to-staff ratios: These reduce consultation times, resulting in no or poor
DOT.6
Availability of guidelines and job aids: Aids such as such as guides for determining
gestational age and IPTp timing may not be available at health facilities.20
Facility type: Private sector facilities may be less likely to adhere to IPTp guidelines.20
NATIONAL,
REGIONAL, DISTRICT-
LEVEL FACTORS
Unclear and conflicting policy and guidance: This can be tied to the degree of
integration and harmonization between national reproductive health, malaria, and HIV
programs. Without either, MiP implementation can be disjointed, conflicting,
marginalized, and lack accountability.34,40
Dosing policy: Zambia and Ghana, whose initial policies recommended at least three
doses of IPTp (IPTp 3+), have achieved some of the highest IPTp coverage rates in Sub-
Saharan Africa, which may indicate a policy promoting frequent dosing creates an
enabling environment for better coverage.34
Lack of effective training and supervision of healthcare providers
Lack of quality assurance of IPTp delivery in facilities20
Poor management of an antimalarial policy transition: In one country, poor
management led to negative media coverage about SP and loss in confidence in SP.20
* In addition, anecdotal data suggests providers may attribute clients’ late presentation at ANC or reluctance to
take IPTp to knowledge gaps, when there may be other interpersonal or social factors at play. Without strong
counseling skills, providers are unable to tease out these issues and help clients to address them.

A Blueprint for Applying Behavioral Insights to Malaria Service Delivery | 21
Factors influencing provider reporting
This list was gathered from papers covering several health areas, and usually for one country at a time
(no review papers were found). Items on the list mention the few examples of malaria. Another useful
framework is Performance of Routine Information System Management (PRISM).
Photo credit: Mwangi Kirubi, PMI Impact Malaria
TABLE 5. PROVIDER REPORTING FACTORS
PROVIDER-LEVEL
FACTORS
No immediate benefit for the provider: Reporting, not use, is perceived to be the main
purpose of data (see national level). From the health workers’ perspective, reports, and the
data they contain are solely for use by others.41–43
Poor understanding of how to use data to make decisions: Generally, providers are unable
to articulate how to do so. For example, health workers mention they decide to carry out
outreach activities but do not point at a clear set of data that would inform this decision
(there was one example where a health worker said that an increase in malaria cases would
lead her to plan a community meeting on net use). Sometimes health workers are instructed
to take certain actions by higher levels without explanations linked to data. Decisions were
mainly restricted to “community” actions (like above) and not in other managerial areas
(when to request more medicines), or clinical care (such as identifying clients who need
referral or follow-up).44-46
Confusion about indicators: Providers had different interpretations of “clinical malaria,” and
“confirmed malaria”; compounded by similar-looking (but different) indicators in forms,

A Blueprint for Applying Behavioral Insights to Malaria Service Delivery | 22
TABLE 5. PROVIDER REPORTING FACTORS
such as “IPTp2” in registers versus “IPTp2+” in monthly summary forms. There is significant
confusion over the denominator for IPTp uptake, resulting in lack of understanding of what
the indicator means and how to calculate it.47,48
Overconfidence combined with poor numeracy skills: In South Africa, average levels of
perceived confidence (69%) in data skills/tasks were not commensurate with the
competence (30%) (based on a test).49 In the same sample, age, having manager-level work,
and education level– were positively associated with data competence.49
CLIENT-LEVEL
FACTORS
Clients lack documentation: Clients lose client cards and prescriptions, making it harder for
providers to maintain continuity of care.41
Clients leave the facility mid-service: Clients often wait several times in the process of being
registered, assessed, and treated by providers. They may choose to leave the facility instead
of waiting to get the next stage of service, leading to missing data fields (this is also affected
by facilities’ client flow processes).44
Pregnant women go to different facilities during the same pregnancy: They can be double
counted as IPTp1 in different facilities, or if enough treatments are sought, IPTp2 rates can
be higher than IPTp1.
DYADIC-LEVEL
FACTORS
Non-compliance with DOT: Women might not take SP if they bring it home, while health
workers are likely to record that IPTp was performed.36
FACILITY/SERVICE
DELIVERY POINT-
LEVEL FACTORS
Time to fill out forms takes away from client care and burdens providers: Providers
estimated they spent seven hours a month filling out forms (median). Each consultation
involves several minutes of filling out forms. Some facilities reduce number of hours/rooms
open to services so providers can fill out forms. Staff also stay after hours to complete tally
sheets and dedicate entire days to completing all the required monthly reports.44–46
Lack of standardization in data quality practices: Facility staff could not consistently
describe standard procedures to deal with incompleteness, inaccuracy, missing or late
reporting of data.44–46
Stock-outs of forms: In the absence of forms, facilities photocopy or manually copy
registers. These workarounds are time-consuming and can cause more confusion (for
example, not all columns are copied from a register or the reporting focal person does not
understand parts of the form, making it difficult for them to complete the monthly summary
forms).44–46
Data quality issues (and data use) related to surveillance are prioritized over data related
to service provision: This also applies to higher levels; providers are more likely to get alerts
and guidance about outbreaks from higher levels than on quality of service provision using
HMIS data.41,42
Training: Providers may not have adequate training on the forms they have to fill out,
including ancillary forms such as those for stock-keeping records and reports. Providers
sometimes fill in for each other to provide services, but the substitutes may not know how
to fill in the forms/registers for the services that are not part of their usual day-to-day jobs.42
Poor organization of paper forms and records.44–46

A Blueprint for Applying Behavioral Insights to Malaria Service Delivery | 23
TABLE 5. PROVIDER REPORTING FACTORS
Volume of clients: Systems break down in facilities that treat large populations. Staff in
high-volume facilities spend more time completing forms/reports, and clients may be seen
in multiple areas (instead of the area where the register might be).36,44–46,47
Lack of a culture of using information (see above and below)
Data management responsibilities not clearly defined or assigned to staff.44
COMMUNITY
LEVEL FACTORS
[No community-level factors found during the literature review]
NATIONAL,
REGIONAL,
DISTRICT-LEVEL
FACTORS
Data validation exercises do not take place within the facility: These are usually only done
at the district level, and only intermittently. This may lead to providers’ also not having a
strong understanding of data quality measures. It also doubles workloads without benefiting
providers. When registers are brought to the district level for validation, staff improvise
registers using notebooks and will need to copy that information to the register later.44–46
Mismatch between level of responsibility and resources: The district level is given most of
the responsibilities for data entry, feedback, and data quality yet they often lack political
will, resources, equipment, and skilled staff.43
Leadership and management: The PRISM toolkit for HMIS strengthening examines several
dimensions of district management and governance, including the decisions and actions
taken based on performance monitoring meetings (e.g., discussing key performance
targets), comparisons of district data over time and with national targets, annual planning,
among others.50
Forms are not designed to fit the decisions that clinicians need to make, such as
assessment/treatment, counseling, and follow-up: For example, client histories are helpful
for choosing treatment if an effective analysis can be arrived at, however, the
register/treatment card is an open field offering no clinical guidance, and there may not be
a place to record follow-up visits. Without a space to record a negative result—a client not
showing up—the paper-based system, which emphasizes only recording, does not offer an
“alert” to take action to track down the client. Forms are based on the needs of higher-level
stakeholders, not clinicians.44–46
Lack of guidance or room for explanation when there is ambiguity: For example, there may
be no room to record “suspected” malaria cases or “clinical malaria” in registers; or a client
may have multiple co-morbidities, but the inpatient report only has room for a main
diagnosis. When confronted with the real-world messiness of data, staff do not have the
option to explain or to qualify their entries. Since completeness is more easily measured
than correctness, providers may make up the data to avoid being punished.41 Register
instructions were unclear on how to record why a woman was not eligible for IPTp, so
providers came up with various symbols.47
Lack of guidance around how providers can use their own data to inform their work
Stock-outs of forms: Higher levels do not/cannot resupply forms in a timely way, even when
facilities inform them of the problem.44–46
Norms: Tallying in the moment of care is more accurate but is formalized only for
immunization43; use of tally sheets was associated with improved malaria data quality in the

A Blueprint for Applying Behavioral Insights to Malaria Service Delivery | 24
TABLE 5. PROVIDER REPORTING FACTORS
Solomon Islands.48 In disease surveillance, there is an explicit practice of “zero reporting”
(by contrast, in other areas, the difference between zero and blank is not clear).41
Register designs create hassles: Registers are too bulky to move around, but clients must
move through different departments. The chronological nature of the registers makes it
hard to track clients, since the provider must flip through several pages to find past visits.44–
46
Vertical programs: These contribute to duplication and fragmentation of feedback/quality
assurance processes, creating more workload and affecting quality.42
Degree of harmonization of data collection and reporting tools: This can be tied to the
existence of coordination mechanisms and monitoring and evaluation frameworks (usually
at national level).44–46
Quality of graphic design/printing/photocopying: Fonts are small and hard to read.41
Lag in updating registers to match new guidelines: Many countries may not have updated
their registers based on adoption of IPTp3+. In places, where this has been done, printing
and training on the new forms take time.
Data use by districts encourages facility reporting: In Uganda, districts actively using data
to identify and prevent stock-outs had over 90% facility reporting rates.45
Feedback (lack of guidance and insufficient emphasis on accuracy): Lack of guidance on
how to provide feedback; feedback tends to be based on district officers’ “impressions”
[42]. Moreover, districts do not commonly provide feedback to facilities about the accuracy
of data, only promptness and completeness.36
Confusing denominators: HMIS and national surveys use different denominators, which can
lead to confusion for interpreting the findings, and many providers/supervisors may not
know that HIV+ women on cotrimoxazole should be excluded from denominators in HMIS
indicators.34
Anecdotal factors noted: (a) Perverse incentives: incentive to report fewer cases (elimination, or in the places
where facilities are required to generate income based on service utilization), incentive to report more cases
(performance-based financing, or to divert commodities for private sale or use); (b) Client cards are stored with
other important documents by the male head of household and clients may have difficulty accessing them; (c)
Lack of systems to address data quality/accuracy errors; for example, treating more people than tested should
trigger routine questions upon submission or be incorporated into forms or electronic data systems.
Resources
• Provider Behavior Change Implementation Kit
• PRISM Toolkit
• PSI Keystone Design Framework: Diagnose Phase Resources
• Think | BIG Guidance and Sample Behavior Profiles, Maternal Health
o ANC Sample Behavior Profile
• Think | BIG Guidance and Sample Behavior Profiles, Malaria

A Blueprint for Applying Behavioral Insights to Malaria Service Delivery | 25
Step 4. Involve target groups in all stages of
design
Implementing partners, government staff, donors, and researchers commonly convene to design a new
program or tool. These teams bring valuable skills and resources to the table, such as financing, public
authority, technical expertise, and the ability to implement activities or disseminate findings at scale.
Although some team members have experience or training as service providers, the group may lack
current, first-hand experience with navigating the day-to-day realities of providing or using services.
Moreover, the written evidence base, though useful, often lacks contextual detail or involves data from
other settings. Mindfully involving providers and clients throughout the design process—both in
understanding behavioral determinants and in program design—can ensure that interventions are
feasible and desirable for users and sustainable to implement in the long-term.
A group seeking to improve provider adherence to MiP guidelines, for example, may use the clinical
guidelines to develop an algorithmic job aid, but may fail to understand what problems the provider is
trying to solve in the context of seeing a woman during an antenatal visit, whether a job aid is the right
approach, what form it should take, whether providers would be willing to consult a job aid in front of a
client, whether the job aid is readable from where the provider sits in the consultation room, and/or
other priorities that may overtake the need to follow an algorithm (such as the client complaining of
other serious ailments that require immediate attention while fifteen more clients are waiting outside).
Involving ANC nurses and clients in the process of defining the challenges, translating research findings
for stakeholders who sit at the district, regional and national level, and generating and testing ideas may
help prevent some of these gaps in understanding.
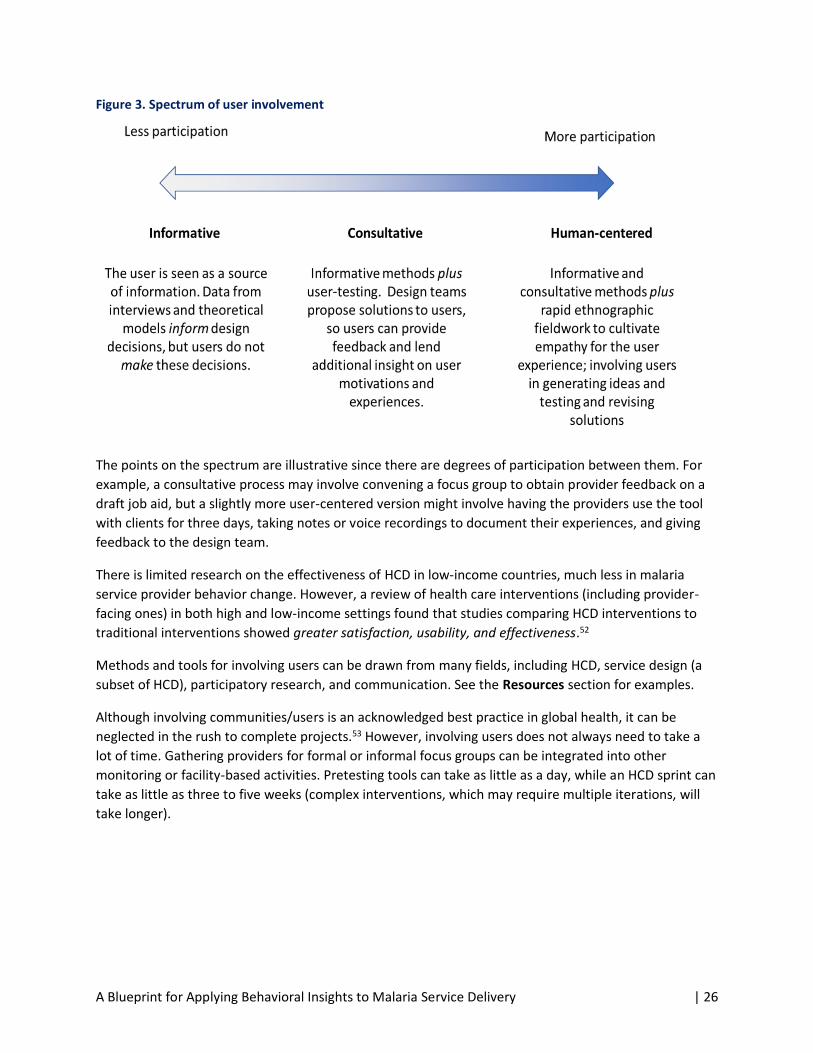
User involvement can take varying degrees (Figure 3). On the far left, it can be mainly informative,
where insights are founded on data and theories about user behavior, but the design team generates all
the ideas and makes all the decisions.46 On the far right, human-centered design (HCD) is a process
where the design teams conduct rapid immersive activities to engage directly with users to understand
their perspectives (as opposed to the research being conducted by a separate team), and users are part
of brainstorming and testing solutions.46,51
A Blueprint for Applying Behavioral Insights to Malaria Service Delivery | 26
Figure 3. Spectrum of user involvement
The points on the spectrum are illustrative since there are degrees of participation between them. For
example, a consultative process may involve convening a focus group to obtain provider feedback on a
draft job aid, but a slightly more user-centered version might involve having the providers use the tool
with clients for three days, taking notes or voice recordings to document their experiences, and giving
feedback to the design team.
There is limited research on the effectiveness of HCD in low-income countries, much less in malaria
service provider behavior change. However, a review of health care interventions (including provider-
facing ones) in both high and low-income settings found that studies comparing HCD interventions to
traditional interventions showed greater satisfaction, usability, and effectiveness.52
Methods and tools for involving users can be drawn from many fields, including HCD, service design (a
subset of HCD), participatory research, and communication. See the Resources section for examples.
Although involving communities/users is an acknowledged best practice in global health, it can be
neglected in the rush to complete projects.53 However, involving users does not always need to take a
lot of time. Gathering providers for formal or informal focus groups can be integrated into other
monitoring or facility-based activities. Pretesting tools can take as little as a day, while an HCD sprint can
take as little as three to five weeks (complex interventions, which may require multiple iterations, will
take longer).
A Blueprint for Applying Behavioral Insights to Malaria Service Delivery | 27
Resources
• How to Test Creative Concepts
• Demand for Health Services Field Guide: A Human-Centered Approach
• The Field Guide to Human Centered Design
• Service Design Tools
• PSI Keystone Design Framework: Decide Phase Resources

A Blueprint for Applying Behavioral Insights to Malaria Service Delivery | 28
Step 5. Match interventions to the identified
levers of behavior Programs will likely require a wide range of SBC approaches
No silver bullet exists that can change behavior, and a holistic package is needed to tackle the complex
nature of behaviors within the service delivery sphere. When both service delivery and communication
partners are present, programs need to coordinate to take advantage of the unique skill sets, geographic
coverage, and resources each may bring. The Service Communication toolkit’s “Operational
Considerations” page has comprehensive information on the different forms that coordinate between
service delivery and SBC partners, which may be useful throughout design, implementation, and
monitoring and evaluation.
Below a snapshot of the range of possible interventions based on the levels of socio-ecological model
(see Figure 2 and the tables in Step 3 for the corresponding behavioral factors at each level). Each
intervention can be strategically coupled with other interventions, potentially amplifying their effects.
Interventions at the client and community levels tend to have more of a service communication angle,
though some of them can also directly improve provider motivation. Interventions at the provider,
facility, and organizational level can also be used to target peer/provider norms directly. This list is for
illustrative purposes only; it should not replace the process of co-generating intervention ideas with
users and stakeholders.
TABLE 6. INTERVENTIONS FOR PROVIDER BEHAVIOR CHANGE AND SERVICE COMMUNICATION,
CLUSTERED BY LEVEL OF THE SOCIOECOLOGICAL MODEL*
LEVELS AND AUDIENCES INTERVENTIONS
CLIENTS
clients and caregivers
• Client-facing SMS
• Phone hotlines/integrated voice response
• Home visits
• Mass media
• Print materials (such as posters, leaflets, point-of-care materials,
messages on drug packaging, and health cards)
PROVIDERS
Clinical and non-clinical staff
(e.g., doctors, nurses,
environmental health
technicians, lab technicians,
pharmacists, medical records).
• Peer-to-peer or peer group discussions (e.g., clinical meetings or
grand rounds)
• Distance learning or access to educational and professional
development opportunities or resources
• Provider-facing SMS
• Self-reflection exercises, values clarification and attitudinal
transformation exercises
• Medical detailing visits/total office call (in-person sales visits used
by pharmaceutical representatives; can be similar to supportive
supervisory approaches)
• Job aids/clinical decision support tools (to reduce cognitive burden,
change defaults, and nudge providers toward certain diagnoses or
treatment plans)

A Blueprint for Applying Behavioral Insights to Malaria Service Delivery | 29
TABLE 6. INTERVENTIONS FOR PROVIDER BEHAVIOR CHANGE AND SERVICE COMMUNICATION,
CLUSTERED BY LEVEL OF THE SOCIOECOLOGICAL MODEL*
LEVELS AND AUDIENCES INTERVENTIONS
• Vignettes (such as case studies or videos that models the desired
thought processes and behaviors)
CLIENT-PROVIDER DYAD
• Job aids to improve provider counseling
• Job aids to improve history-taking (e.g., help clients communicate
level of pain, or help providers calculate gestational age)
• Client-provider pledges
• Client monitoring/follow-up by provider or community-based agent
• Fishbowl-style discussions for clients and providers to discuss
perceptions of quality of care, provider attitudes toward clients
• Community-provider dialogues
FACILITY
Officers-in-charge and unit
heads
• Recognition (by colleagues, supervisor, community)
• Collaborative improvement initiatives
• Performance feedback (performance review, clinical audits,
performance tracking charts; peer review, self-assessment)
• Performance-based financing
• Management meetings
• Changes to facility processes, equipment, or forms to simplify client
and provider experience (e.g., facilities without water supplies sell
plastic sachets of water at cost so women can take medicine for
ANC)
• Adjusting staff responsibilities and schedules, adding staff
• On-the-job training
COMMUNITY
Spouses, relatives, friends,
workplaces, community groups,
traditional healers, drug shops,
and local traditional and
religious leaders
• Health fairs
• Community groups providing health education and referrals to their
members (Community Health Systems Strengthening model)
• Care Groups
• Group ANC
• Community monitoring (alone or jointly with facility)
• Community dialogues
• Mass media
• Open houses/facility tours for clients
• Wellness days for hard-to-reach groups, like adolescent boys and
men
• In-reaches (mobilize selected clients/groups to attend facilities on
select service days along with providing additional providers to
mentor or support service provision)
• Outreaches (providers go to communities to provide services,
common in vaccinations)
• Facility makeover (improving the physical environment based on
assessed community and provider needs, while involving
community artisans in the process)
• Facility reviews/ratings/feedback systems
• Branding/accrediting facilities for quality services

A Blueprint for Applying Behavioral Insights to Malaria Service Delivery | 30
TABLE 6. INTERVENTIONS FOR PROVIDER BEHAVIOR CHANGE AND SERVICE COMMUNICATION,
CLUSTERED BY LEVEL OF THE SOCIOECOLOGICAL MODEL*
LEVELS AND AUDIENCES INTERVENTIONS
• Health committee meetings to broker community-facility issues,
address bottlenecks
NATIONAL, REGIONAL,
DISTRICT, OR ORGANIZATIONAL
District and regional supervisors,
NMCPs and other Ministry of
Health departments in
reproductive, maternal,
newborn, and child health;
supply chains; implementing
partners; professional
associations; and other training
and accreditation institutions
• Advocacy to remove bottlenecks, provide public legitimacy to
related interventions.
• Provide opportunities for providers to meet license renewal
requirements
• Influence the agenda/discussions at professional association
meetings
• Strengthening the management skills of facility in-charges and unit
heads
• Performance feedback to facilities/districts; using scorecards;
conducting supervision/mentoring/coaching visits;
training/oversight of supervisors to ensure they do not propagate
misconceptions during visits
• Updating pre-service curricula
• Making national tools (like HMIS forms and standing orders) user-
friendly and user-centric
• Guidelines and templates for data quality and data use for service-
point level
• Human resource management (e.g., minimizing staff transfers)
* See Figure 2 and Tables 3–5 (in Step 3) for the corresponding behavioral factors at each level.
Interactive, synergistic approaches tend to be more effective
The choice, effectiveness, and sustainability of the intervention package will likely depend on the
behavior of interest, the target group, the behavioral determinant(s) being targeted, the level of user
input into the selection of approach, and how well it was tested and refined based on actual service
contexts. A recent systematic review on provider performance provided insights on what types of
interventions work but does not explain why they worked.54 Also, many of the interventions listed above
are new and/or unpublished and may not have been included in the review.
TABLE 7. SUMMARY OF FINDINGS FROM THE HEALTH CARE PROVIDER PERFORMANCE REVIEW
STUDY53
EFFECT SIZE INTERVENTION AND FINDINGS
Providing printed information or job aids to healthcare providers as a sole strategy is unlikely to
substantially change performance.
Information and communication technology might lead to moderately large improvements or
no improvement, but it typically has small-to-modest effects.

A Blueprint for Applying Behavioral Insights to Malaria Service Delivery | 31
TABLE 7. SUMMARY OF FINDINGS FROM THE HEALTH CARE PROVIDER PERFORMANCE REVIEW
STUDY53
EFFECT SIZE INTERVENTION AND FINDINGS
Training only or supervision only might produce large improvements or no improvement, but
both strategies generally tend to have moderate effects. It might be more effective to combine
training with other strategies, such as supervision or group problem solving.
Group problem solving only might bring about large or small improvements, but moderate
effects are typical.
Financial incentives for health-care providers, health system financing strategies, and other
incentives might lead to large or small improvements, but these incentives typically have
modest to moderate effects.
Multifaceted strategies targeting infrastructure, supervision, other management techniques,
and training (with and without financing), and the strategy of group problem-solving plus
training might result in very large or only modest improvements, but such strategies tend to
have large effects.
The review found substantial variation in effect sizes among similar interventions, suggesting that the
quality of implementation and context matter. When it comes to trainings, for example, other studies
have found that a low-dose, high-frequency approach to training, using simulations or actual work
environments, frequent practice, problem-based learning, and interactive discussion of case studies
leads to improved learning outcomes.55,56 This type of approach can also facilitate the participation of
providers whose household and caregiver responsibilities make them less likely to be able to participate
in more traditional off-site or residential trainings. When it comes to SMS, two-way approaches seem to
be more effective in low and middle-income countries.57 However, only one-way SMS malaria
interventions with providers have been published; these interventions have had mixed results.58,59
Although multifaceted strategies are capable of producing large effects, the number of elements did not
correlate with effect size, so programs should be careful to avoid overly complicated and ultimately,
time and resource-intensive design packages.54 However, judiciously combining methods – such as
training to introduce new processes or clear misconceptions, or group problem-solving to address
emergent challenges may be sufficient.54
Expectations must be tempered. The authors of the above review said, “even after implementing
improvement strategies, important performance gaps will probably remain. Assuming typical baseline
performance of 40% and a [very] optimistic strategy effect of 30 percentage points, post-intervention
performance would be 70% [. . .] or about a third of clients not receiving recommended care.”54
Moreover, the effect may be diluted over time; the authors recommend longer follow-up periods.
Importantly, effect sizes were higher in public sector settings compared to private and community
settings, but it is not clear why this might be the case.54
Overall, the evidence shows that interactive and multi-level approaches are more likely to be effective
than the passive dissemination of materials. However, how long the effects last is unclear as is what
type of follow-up intervention is needed to sustain them.

A Blueprint for Applying Behavioral Insights to Malaria Service Delivery | 32
Resources
• Service Communication Toolkit
• Health Care Provider Performance Review Database
• The Challenge Initiative University Resource Collection
• Malaria Social and Behavior Change Communication (SBCC) Evidence Database
• SBCC for Malaria in Pregnancy Toolkit
• PSI Keystone Design Framework: Deliver Phase Resources
• Think | BIG Guidance and Sample Behavior Profiles, Malaria

A Blueprint for Applying Behavioral Insights to Malaria Service Delivery | 33
Step 6. Use a holistic approach to monitoring
and evaluation
Suggestions for data collection, primarily for formative research or situational analyses, have been
proposed at nearly every stage in this document. Below are some key areas to assess during the design,
monitoring and evaluation stages, along with data sources, indicators, and questions. In addition to
tracking changes in behaviors/services/data quality, assessing changes to the determinants of provider
behaviors and the context in which the intervention unfolded are important.
Outcome monitoring and evaluation
TABLE 8. OUTCOME MONITORING AND EVALUATION
AREAS TO ASSESS POTENTIAL DATA SOURCES RESOURCES FOR INDICATORS
AND QUESTIONS
Changes to behaviors and sub-
behaviors: Provider behaviors to
monitor include adherence to case
management and MiP guidelines,
and measures of data quality, such
as concordance (accuracy),
timeliness and completeness.
Register reviews and observations
as part of health facility
assessments and supportive
supervision
Client exit interviews and pharmacy
consumption data as means of
validation; pharmacy data can also
help with accounting for stock-outs
HMIS data
Reporting and data quality:
• PRISM assessment tools
(performance diagnosis
section: see malaria-
specific indicators)
• Routine Data Quality
Assessment tools
(countries sometimes have
a malaria-version of this)
Case management and MiP:
• Surveillance, Monitoring,
and Evaluation Task Force
recommendations
• Correction factor for
testing rates from HMIS
• Framework and Checklists
for Supportive
Supervision/OTSS+ (PMI
Impact Malaria; contact
Keith Esch at
• Monitor antibiotic overuse
(negative effect of
increased adherence to
negative test results)60
Changes in behavioral
determinants: It is not easy to get
reliable data on provider behavior.
Service statistics frequently suffer
Provider interviews as part of
health facility assessments and
supportive supervision
Reporting and data quality:
• PRISM assessment tools
(self-confidence,

A Blueprint for Applying Behavioral Insights to Malaria Service Delivery | 34
TABLE 8. OUTCOME MONITORING AND EVALUATION
AREAS TO ASSESS POTENTIAL DATA SOURCES RESOURCES FOR INDICATORS
AND QUESTIONS
from data quality issues, and other
means of collecting data (such as
health facility assessment and
supervision visits) can be resource
intensive. Measuring changes in
behavioral factors (such as
attitudes and norms) among both
clients and providers provide early
indications that the intervention is
having an effect.
Pre and post-tests when conducting
activities
SMS/mobile surveys
competency, and
information culture;
feedback and training).
General questions about behavioral
determinants that can be adapted
to malaria service providers:
• Malaria SBCC Indicator
Reference Guide
• Social and Behavior
Change Indicator Bank for
Family Planning and
Service Delivery
• Sample case management
Health Facility Assessment
questions from Guinea8
• Malaria Behavior Survey
User (provider and client)
satisfaction and estimates of time
burden also provide information on
how suited the intervention is to
the context and the possibility of
sustainability and scale-up. For
evaluations, changes to behavioral
determinants provide evidence of
how the intervention worked, not
just if it worked.
Provider interviews
Client exit interviews
Pre-posttests when conducting
activities.
These are from family planning and
could be adapted to malaria:
• Social and Behavior
Change Indicator Bank for
Family Planning and
Service Delivery
• Family planning client
satisfaction survey
questions
Document the context, the
implementation details, and
lessons learned. Context has been
shown to be a significant
determinant of the effect of any
strategy. Documenting how
strategies were tailored to the
context,54 what aspects of the
context enabled or hampered the
intervention, and the workarounds
used will greatly improve our
understanding of what
interventions can be replicated, and
where.
Activity reports
Focus group/after-action
reviews/lessons learned meetings
• Checklist for reporting on
malaria social and
behavior change program
evaluations
• USAID guidance on after-
action reviews

A Blueprint for Applying Behavioral Insights to Malaria Service Delivery | 35
Ideally, longer-term follow-up (the review above suggested 12 months) should be conducted to
understand the rate at which effects unfold.54 For example, evidence shows collaborative improvement
approaches have been successful in Sub-Saharan Africa, but it can take 9.2 months for facilities to reach
80% performance targets and 14 months to reach 90% performance targets.61 Moreover, follow-up may
show that providers need reinforcement with new or different interventions to further boost practice or
address new gaps. Last but not least, long-term follow-up is useful for knowing whether short-term
gains following trainings were sustained.
Process and output monitoring
TABLE 9. PROCESS AND OUTPUT MONITORING
AREAS TO ASSESS POTENTIAL DATA
SOURCES
TYPES OF INDICATORS AND QUESTIONS
Quality of user involvement
during the design process
Design and testing reports Number and range of users involved (easy-to-
find users versus users from both ends of the
extremes, in terms of performance or setting)62
Quality of learning during
the design process
Design and testing reports Whether the team learned anything surprising
about the context in which some users might
interact with/use the services/tools62
Number of different solutions proposed62
Number of solutions tested by users; for how
long
How many of the potential solutions underwent
major iterations as a result of input from
stakeholders and users62
Costs
Financial data Differentiate between design costs and
implementation costs
Fidelity of implementation Activity reports
Supervision checklists
(tailored to activity)
Audit facility documents
(e.g., meeting minutes)
For what percent of eligible client consultations
providers used the tools
For procedural changes, what proportion of the
eligible days/weeks was it done as planned
Outputs
Activity reports
Number of interventions introduced Number of
group discussions held
Number of tools developed
Reach and coverage
Activity reports
Number of users who participated or who were
reached by the intervention

A Blueprint for Applying Behavioral Insights to Malaria Service Delivery | 36
Strengths and limitations of selected data sources
Service statistics are best for assessing reporting behavior (level of concordance, completeness,
timeliness). Because the data may be of poor quality, caution needs to be taken when using them to
assess adherence to case management and MiP guidelines. Comparing data sources within a facility
would be ideal—cross-checking HMIS forms with laboratory and pharmacy records can provide an
estimation of how much over- and under-reporting may be present. Many of the alternate data sources
will likely have problems too, and the process will take more time. However, it can raise confidence in
the quality of the behavioral data reported.
Household surveys, like the Malaria Indicators Survey (MIS), Demographic and Health Survey (DHS), and
the Malaria Behavior Survey are imperfect measures of provider performance because they collect data
among community members. For example, IPTp questions involve women who were pregnant in the
past two years. The women may not recall what medicines they took during their antenatal visits,
especially if the pregnancy was not recent, and if the provider did not explain what was being given.
Similarly, caregivers of children under five years of age who sought care for fever in the past two weeks
many not accurately recall if the child received a finger or heel prick (for malaria tests) or what
medicines were prescribed (particularly if multiple medicines were given). On the other hand, household
surveys better capture care-seeking and ANC behaviors because they take place in the community and
may reach those who use and do not use services.
Client exit interviews, because they are done immediately after service provision, may be a better way
of validating provider performance or quality of service while providing an opportunity to collect data on
client satisfaction, comprehension of counseling given, and intention to complete referrals or other
follow-up services. However, there may be a risk of providers changing their behaviors if they know such
surveys are taking place (Hawthorne effect).
SPA or SARA are cross-sectional facility surveys that provide important information on the proportion of
facilities that are equipped to provide MiP and case management services. They examine the availability
of trained staff, equipment, and commodities. However, there is little other information that might be
used to help explain provider behavior, and it is not clear how much these surveys can be tailored.
Health facility assessments, with their ability to collect data through provider interviews, observations,
registers, and client exit interviews may serve as a gold standard for measuring facility readiness and
performance. At this time, these assessments are not as standardized as the MIS and DHS, which can
make it hard to compare findings, but this may pose opportunities for developing better questions to
measure determinants of provider behavior.63
Supportive supervision visits present an opportunity to collect information from providers and the
facility. These visits are long and costly, and supervisors will need training on how to collect data. There
is also a significant risk of bias if supervisors are the ones asking providers about their beliefs and
attitudes. Lastly, data collection can detract from time spent coaching and troubleshooting and may not
be a good use of government supervisors’ time.
Finally, qualitative feedback on the interventions being tested in the form of in-depth interviews and
focus groups will be useful for understanding how and why certain outcomes were observed.

A Blueprint for Applying Behavioral Insights to Malaria Service Delivery | 37
TABLE 10. PROS AND CONS OF DIFFERENT DATA SOURCES
DATA SOURCE PROS CONS
Service statistics Best for assessing quality of reporting Poor quality of reporting may mean it is not a
reliable source for data on adherence to clinical
guidelines
Household
surveys
Can reach people who access and do
not access services
Recall bias since data is from community
members, not providers
Client exit
interviews
Less likelihood of recall bias Hawthorne effect (providers change their behavior
if they know they are being observed)
SPA or SARA
surveys
Can indicate if there is a problem in
terms of equipment, training, or
supervision
Cannot lend insight on attitudes/beliefs/norms
affecting provider behavior, nor quality
improvement practices; not clear how much these
surveys can be tailored; infrequent
Health facility
assessments
Can be comprehensive and flexible;
can assess multiple aspects
influencing behavior and
performance (the “why”)
Not standardized; infrequent
Supportive
supervision
Part of routine programming; can be
comprehensive and flexible; can
assess multiple aspects influencing
behavior and performance (the
“why”) and provide both qualitative
and quantitative info.
Can be expensive; data collection can distract from
mentorship and coaching; skilled supervisors are
needed to use information appropriately
Qualitative
methods (focus
groups, in-depth
interviews)
Provide information on the “why”
(motivators/barriers)
Cannot provide information on how widespread
these motivators/barriers are
Resources
• Developing Monitoring and Evaluation Plans for Malaria SBC Programs: A Step-by-Step Guide
• See resources listed in Table 8 above

A Blueprint for Applying Behavioral Insights to Malaria Service Delivery | 38
Conclusion
Making strides in case management and MiP will require a strong focus on provider behavior. Providers
serve as gatekeepers for the uptake of IPTp, malaria testing and adherence to test results, and quality of
malaria surveillance data.
A behavioral lens can be useful for understanding how to improve provider performance, nourish
community-facility linkages and, consequently, strengthen service delivery and the health system
overall. Best practices include defining and prioritizing behaviors, identifying the target groups and their
influencers, diagnosing behavioral determinants, involving users (providers and clients) in intervention
design, choosing appropriate interventions, and, finally, collecting the types of monitoring and
evaluation data that can tell the story of how the program fits the context and its effect on providers’
motivation, behavior, and, ultimately, quality of care.
A Blueprint for Applying Behavioral Insights to Malaria Service Delivery | 39
References
1. Koenker, H., Keating, J., Alilio, M., et al. (2014). Strategic roles for behaviour change communication
in a changing malaria landscape. Malaria Journal, 13(1), 1. https://dx.doi.org/10.1186/1475-2875-
13-1
2. Health Communication Capacity Collaborative Project (HC3). (2017). Service communication
implementation kit. https://sbccimplementationkits.org/servicecommunication/
3. Health Communication Capacity Collaborative Project (HC3). (2017). Provider behavior change
implementation kit. https://sbccimplementationkits.org/provider-behavior-change/
4. World Health Organization. (2015). Guidelines for the treatment of malaria, 3rd ed.
https://www.who.int/malaria/publications/atoz/9789241549127/en/
5. World Health Organization. (2015). Implementing malaria in pregnancy programs in the context of
World Health Organization recommendations on antenatal care for a positive pregnancy experience.
https://www.who.int/reproductivehealth/publications/implementing-malaria-pregnancy-
programmes-brief/en/
6. Candrinho, B., Plucinski, M.M., Colborn, J.M., et al. (2019). Quality of malaria services offered in
public health facilities in three provinces of Mozambique: a cross-sectional study. Malaria Journal,
18(1), 162. https://doi.org/10.1186/s12936-019-2796-9
7. Plucinski, M.M., Guilavogui, T., Camara, A., et al. (2018.) How far are we from reaching universal
malaria testing of all fever cases? The American Journal of Tropical Medicine and Hygiene, 99(3),
670–679. https://doi.org/10.4269/ajtmh.18-0312
8. Davlantes, E., Camara, A., Guilavogui, T., et al. (2019). Quality of malaria case management and
reporting at public health facilities in six health districts in Guinea. The American Journal of Tropical
Medicine and Hygiene, 101(1), 148–156. https://doi.org/10.4269/ajtmh.19-0150
9. Breakthrough ACTION. (2019). How to do audience segmentation. The Compass.
https://www.thecompassforsbc.org/how-to-guides/how-do-audience-segmentation
10. Ruizendaal, E., Schallig, H.D.F.H., Scott, S., et al. (2017.) Evaluation of malaria screening during
pregnancy with rapid diagnostic tests performed by community health workers in Burkina Faso. The
American Journal of Tropical Medicine and Hygiene, 97(4), 1190–1197.
https://doi.org/10.4269/ajtmh.17-0138
11. Kabaghe, A.N., Visser, B.J., Spijker, R., et al. (2016). Health workers’ compliance to rapid diagnostic
tests (RDTs) to guide malaria treatment: a systematic review and meta-analysis. Malaria Journal,
15(1), 163. https://dx.doi.org/10.1186%2Fs12936-016-1218-5
12. Boyce, M.R. and O’Meara, W.P. (2017). Use of malaria RDTs in various health contexts across sub-
Saharan Africa: a systematic review. BMC Public Health, 17(1), 470. https://doi.org/10.1186/s12889-
017-4398-1
13. Colvin, C.J., Smith, H.J., Swartz, A., et al. (2013). Understanding careseeking for child illness in sub-
Saharan Africa: a systematic review and conceptual framework based on qualitative research of
household recognition and response to child diarrhoea, pneumonia and malaria. Social Science &
Medicine, 86, 66–78. https://doi.org/10.1016/j.socscimed.2013.02.031
14. Grable, N. and Lint, S. (2016). Strategies for Changing the Behavior of Private Provider. Bethesda,
MD: Strengthening Health Outcomes through the Private Sector Project, Abt Associates.

A Blueprint for Applying Behavioral Insights to Malaria Service Delivery | 40
https://www.shopsplusproject.org/sites/default/files/resources/Global_Strategies%20for%20Chang
ing%20the%20Behavior%20of%20Priv%20Providers.pdf
15. Camber Collective. (2018). Beyond bias: provider survey and segmentation findings. The Compass.
https://www.thecompassforsbc.org/sites/default/files/project_examples/BB%20Report%20Draft_0
41118_vf%20with%20appendix.pdf
16. World Health Organization. (2016). Towards a grand convergence for child survival and health: a
strategic review of options for the future building on lessons learnt from IMNCI.
http://www.who.int/iris/bitstream/10665/251855/1/WHO-MCA-16.04-eng.pdf?ua=1
17. Heiby, J. (2014). The use of modern quality improvement approaches to strengthen African health
systems: a 5-year agenda. International Journal for Quality in Health Care, 26(2), 117–23.
https://doi.org/10.1093/intqhc/mzt093
18. Franco, L.M., S. Bennett, and R. Kanfer. (2002). Health sector reform and public sector health worker
motivation: a conceptual framework. Social Science & Medicine, 54(8), 1255–1266.
https://doi.org/10.1016/s0277-9536(01)00094-6
19. Population Services International. (2016). Provider behavior change toolkit.
https://www.psi.org/publication/provider-behavior-change-toolkit
20. Hill, J., Hoyt, J., van Eijk, A.M., et al. (2013). Factors affecting the delivery, access, and use of
interventions to prevent malaria in pregnancy in sub-Saharan Africa: a systematic review and meta-
analysis. PLoS Medicine, 10(7), e1001488. https://doi.org/10.1371/journal.pmed.1001488
21. Health Communication Capacity Collaborative Project (HC3). (2019). The Circle of Care Model.
https://healthcommcapacity.org/wp-content/uploads/2017/06/Circle-of-Care-Model.pdf
22. Chipukuma, H.M., Zulu, J.M., Jacobs, C., et al. (2018). Towards a framework for analyzing
determinants of performance of community health workers in malaria prevention and control: a
systematic review. Human Resources for Health, 16(1), 22. https://doi.org/10.1186/s12960-018-
0284-x
23. Burchett, H.E.D., Leurent, B., Baiden, F., et al. (2017). Improving prescribing practices with rapid
diagnostic tests (RDTs): synthesis of 10 studies to explore reasons for variation in malaria RDT
uptake and adherence. BMJ Open, 7(3), e012973. https://doi.org/10.1136/bmjopen-2016-012973
24. Altaras, R., Nuwa, A., Agabaet, B., et al. (2016). Why do health workers give anti-malarials to
patients with negative rapid test results? A qualitative study at rural health facilities in western
Uganda. Malaria Journal, 15(1), 23. https://doi.org/10.1186/s12936-015-1020-9
25. Chandler, C.I., Jones, C., Boniface, G., et al. (2008). Guidelines and mindlines: why do clinical staff
over-diagnose malaria in Tanzania? A qualitative study. Malaria Journal, 7(1), 53.
https://doi.org/10.1186/1475-2875-7-53
26. Breakthrough ACTION-Nigeria. (2018). Provider Behavior Change Activity Formative Assessment
Report: Behavioral Diagnosis. Baltimore, MD: Breakthrough ACTION.
27. Faust, C., Zelner, J., Brasseur, P., et al. (2015). Assessing drivers of full adoption of test and treat
policy for malaria in Senegal. The American Journal of Tropical Medicine and Hygiene, 93(1), 159–
167. https://doi.org/10.4269/ajtmh.14-0595
28. Umeano-Enemuoh, J.C., Uzochukwu, B., Ezumahet, N, et al. (2015). A qualitative study on health
workers’ and community members’ perceived sources, role of information and communication on
malaria treatment, prevention and control in southeast Nigeria. BMC Infectious Diseases, 15(1), 437.
https://doi.org/10.1186/s12879-015-1187-2

A Blueprint for Applying Behavioral Insights to Malaria Service Delivery | 41
29. Ndwiga, C., Warren, C.E., Ritter, J., et al. (2017). Exploring provider perspectives on respectful
maternity care in Kenya: “work with what you have.” Reproductive Health, 14(1), 99.
https://doi.org/10.1186/s12978-017-0364-8
30. Mangham-Jefferies, L., Hanson, K., Mbacham, W., et al. (2014). Mind the gap: knowledge and
practice of providers treating uncomplicated malaria at public and mission health facilities,
pharmacies and drug stores in Cameroon and Nigeria. Health Policy and Planning, 30(9), 1129–1141.
https://doi.org/10.1093/heapol/czu118
31. UNICEF (2018). Demand for health services field guide.
https://www.unicef.org/innovation/reports/demand-health-services
32. Larson, E., H.H. Leslie, and M.E. Kruk. (2017). The determinants and outcomes of good provider
communication: a cross-sectional study in seven African countries. BMJ Open, 7(6), e014888.
https://doi.org/10.1136/bmjopen-2016-014888
33. Strachan, C., Nuwa, A., Muhangi, D., et al. (2018.) Community understanding of the concept of pre-
referral treatment and how this impacts on referral related decision-making following the provision
of rectal artesunate: a qualitative study in western Uganda. BMC Health Services Research, 18(1),
470. https://doi.org/10.1186/s12913-018-3209-4
34. Roman, E., Andrejko, K., Wolf, K. et al. (2019). Determinants of uptake of intermittent preventive
treatment during pregnancy: a review. Malaria Journal, 18:372. https://doi.org/10.1186/s12936-
019-3004-7
35. Anders, K., Marchant, T., Chambo, P., et al. (2008). Timing of intermittent preventive treatment for
malaria during pregnancy and the implications of current policy on early uptake in north-east
Tanzania. Malaria Journal, 7(1), 79. https://doi.org/10.1186/1475-2875-7-79
36. Rassi, C., Graham, K., Mufubenga, P., et al. (2016). Assessing supply-side barriers to uptake of
intermittent preventive treatment for malaria in pregnancy: a qualitative study and document and
record review in two regions of Uganda. Malaria Journal, 15(1), 341.
https://doi.org/10.1186/s12936-016-1405-4
37. Hurley, E.A., Harvey, S.A., Rao, N., et al. (2016). Underreporting and missed opportunities for uptake
of intermittent preventative treatment of malaria in pregnancy (IPTp) in Mali. PLoS One, 11(8),
e0160008. https://doi.org/10.1371/journal.pone.0160008
38. Bajaria, S., Festo, C., Mrema, S., et al. (2019). Assessment of the impact of availability and readiness
of malaria services on uptake of intermittent preventive treatment in pregnancy (IPTp) provided
during ANC visits in Tanzania. Malaria Journal, 18(1), 229. https://doi.org/10.1186/s12936-019-
2862-3
39. Finlayson, K., and Downe, S. (2013). Why do women not use antenatal services in low-and middle-
income countries? A meta-synthesis of qualitative studies. PLoS Medicine, 10(1): e1001373.
https://doi.org/10.1371/journal.pmed.1001373
40. Maternal and Child Survival Program. (2018 September 27). Country profiles illuminate successes—
and challenges—in the fight against malaria. USAID. https://www.mcsprogram.org/country-
profiles-illuminate-successes-and-challenges-in-the-fight-against-malaria/
41. Bosch‐Capblanch, X., Auer, C., Mandjate, S., et al. (2017). Characterisation of the Health Information
System in Mozambique. PHISICC. http://paperbased.info/wp-
content/uploads/2017/11/PHISICC3_MOZ_Report_v5.pdf

A Blueprint for Applying Behavioral Insights to Malaria Service Delivery | 42
42. Bosch‐Capblanch, X., Zuske, M., Auer, C. et al. (2017). Characterisation of the Health Information
System in Côte d’Ivoire. PHISICC. http://paperbased.info/wp-
content/uploads/2017/08/PHISICC3_CIV_Report_exec-sum_English.pdf
43. Bosch‐Capblanch, X., Auer, C., Njepuome, N., et al. (2017). Characterisation of the Health
Information System in Nigeria. PHISICC. http://paperbased.info/wp-
content/uploads/2017/08/PHISICC_WS3_NGA_Report_v08_ESummary.pdf
44. Ledikwe, J.H., Grignon, J., Lebelonyane, R., et al. (2014). Improving the quality of health information:
a qualitative assessment of data management and reporting systems in Botswana. Health Research
Policy and Systems, 12(1), 7. https://doi.org/10.1186/1478-4505-12-7
45. Huang, F., Blaschke, S., and Lucas, H. (2017). Beyond pilotitis: taking digital health interventions to
the national level in China and Uganda. Globalization and Health, 13(1), 49.
https://doi.org/10.1186/s12992-017-0275-z
46. Rousseau, N., Turner, K.M., Edward Duncan, E., et al. (2019). Attending to design when developing
complex health interventions: A qualitative interview study with intervention developers and
associated stakeholders. PloS One, 14(10), e0223615.
https://doi.org/10.1371/journal.pone.0223615
47. Okello, G., Gerrets, R., Zakay, S., et al. (2018). “Every day they keep adding new tools but they don’t
take any away”: Producing indicators for intermittent preventive treatment for malaria in pregnancy
(IPTp) from routine data in Kenya. PloS One, 13(1), e0189699.
https://doi.org/10.1371/journal.pone.0189699
48. Kunimitsu, A. (2019. The accuracy of clinical malaria case reporting at primary health care facilities in
Honiara, Solomon Islands. Malaria Journal, 8(1), 80. https://doi.org/10.1186/1475-2875-8-80
49. Nicol, E., Bradshaw, D., Phillips, T., Dudley, L. (2013). Human factors affecting the quality of routinely
collected data in South Africa. Studies in Health Technology and Informatics, 192,788–92.
50. MEASURE Evaluation. (2019). Performance of Routine Information System Management Toolkit
(PRSIM) [toolkit]. https://www.measureevaluation.org/resources/publications/tl-18-12/.
51. Tolley, E.E. (2017). Traditional socio-behavioral research and human-centered design: similarities,
unique contributions and synergies. CAMI Health/IMPT Secretariat/Public Health Institute/FHI360.
http://www.theimpt.org/documents/reports/Report-HCD-BSS-Research.pdf
52. Altman, M., Huang, T.T.K., Breland, J.Y. (2018). Design thinking in health care. Preventing Chronic
Disease, 15:E117. https://doi.org/10.5888/pcd15.180128
53. Cheney, C. (2018 June 25). Gates Foundation and USAID team up to bring design to health. Devex.
https://www.devex.com/news/gates-foundation-and-usaid-team-up-to-bring-design-to-health-
92084
54. Rowe, A.K., Rowe, S.Y., Peters, D.H., et al. (2018). Effectiveness of strategies to improve health-care
provider practices in low-income and middle-income countries: a systematic review. The Lancet
Global Health, 6(11), e1163-e1175. https://doi.org/10.1016/s2214-109x(18)30398-x
55. Gomez, P.P., Nelson, A.R., Asiedu, A., et al. (2018). Accelerating newborn survival in Ghana through
a low-dose, high-frequency health worker training approach: a cluster randomized trial. BMC
Pregnancy and Childbirth, 18(1), 72. https://doi.org/10.1186/s12884-018-1705-5
56. Asiedu, A., Nelson, A.R., Gomez, P.P., et al. (2019). “It builds your confidence… you’ve done well”:
Healthcare workers’ experiences of participating in a low-dose, high-frequency training to improve
newborn survival on the day of birth in Ghana [version 1; peer review: 2 approved]. Gates Open
Research, 3:1470. https://doi.org/10.12688/gatesopenres.12936.1

A Blueprint for Applying Behavioral Insights to Malaria Service Delivery | 43
57. Linde, D.S., Korsholm, M., Katanga, J., et al. (2019). One-way SMS and healthcare outcomes in Africa:
Systematic review of randomised trials with meta-analysis. PloS ONE, 14(6), e0217485.
https://dx.doi.org/10.1371%2Fjournal.pone.0217485
58. Zurovac, D., Raymond, K.S., Akhwale, W.S., et al. (2011). The effect of mobile phone text-message
reminders on Kenyan health workers' adherence to malaria treatment guidelines: a cluster
randomised trial. The Lancet. 378(9793), 795–803. https://doi.org/10.1016/s0140-6736(11)60783-6
59. Steinhardt, L.C., Mathanga, D.P., Mwandama, D., et al. (2019). The effect of text message reminders
to health workers on quality of care for malaria, pneumonia, and diarrhea in Malawi: a cluster-
randomized, controlled trial. American Journal of Tropical Medicine and Hygiene, 100(2):460–469.
https://doi.org/10.4269/ajtmh.18-0529
60. Hopkins, H., Bruxvoort, K.J., Cairns, M.E., Chandler, C.I.R., et al. (2017). Impact of introduction of
rapid diagnostic tests for malaria on antibiotic prescribing: analysis of observational and randomised
studies in public and private healthcare settings. British Medical Journal, 356: j1054.
https://doi.org/10.1136/bmj.j1054
61. Franco, L.M. and Marquez, L. (2011). Effectiveness of collaborative improvement: evidence from 27
applications in 12 less-developed and middle-income countries. BMJ Quality & Safety, 20(8): 658–
665. https://doi.org/10.1136/bmjqs.2010.044388
62. Tyler, N., Johnson, T., Tolley, B., et al. (2019 Oct 29). Designing for scale: From human-centered
design to a scalable, sustainable social and behavior change intervention [Springboard discussion].
Baltimore, MD: Breakthrough ACTION. https://breakthroughactionandresearch.org/wp-
content/uploads/2020/10/Designing-for-Scale-Springboard-Summary.pdf
63. WHO. (2013). Report on WHO informal consultation on monitoring malaria case management
through health facility surveys. Malaria Policy Advisory Committee Meeting, September 11–13, 2013.
https://www.who.int/malaria/mpac/mpac_sep13_monitoring_case_management_report.pdf?ua=1