TAI CHI CHIH Donna Jungbluth, PTA Accredited Tai Chi Chih Teacher.

A before-and-after service evaluation of Tai Chi
Movements for Wellbeing (TMW) on physical and
psychological wellbeing in a mixed health population
Full report
August 2016
An independent report by
Andrea Finney
Social Research and Statistics
On behalf of
TMW Training Ltd PO Box 149 Hereford HR1 9EU Tel: 01989 740590 Email: [email protected] Web: www.tmwtraining.com
i
Credits and acknowledgements
The analysis described in this working paper was funded by TMW Training Ltd (‘TMW Training’), the
founding, training and professional body for TMW trainers in the UK and Europe.
Tai Chi Movements for Wellbeing (TMW) was developed and established jointly by Mr Richard
Farmer (founder of the nationwide Rising Dragon Tai Chi School (RDTC) and Honorary President of
the Tai Chi Union for Great Britain) and Dr David Quinn (former Head of Profession and Head of the
Department of Health Psychology with the National Health Service in Herefordshire). The service
evaluation, including the data collection tools, was designed by Richard and David in collaboration
with colleagues at the University of Worcester.
The analysis of the data and the preparation of this report was undertaken by Andrea Finney, an
independent social researcher (www.socialresearchandstatistics.wordpress.com) and Honorary
Senior Research Fellow of the University of Bristol’s Personal Finance Research Centre
(www.pfrc.bris.ac.uk). Andrea has 16 years’ experience undertaking and managing research in and
for central Government and academia. Andrea was also a qualified TMW practitioner at the time this
report was produced (but not when the study was designed or the data were collected). TMW
trainer at the time this report was produced, but not when the service evaluation was designed or
the data were collected.
The author and TMW Training are grateful to the TMW practitioners and students who took part in
the service evaluation and to Dr David Quinn for commenting on an earlier draft of this paper. The
author takes full responsibility for the content of this report, and is grateful to TMW Training for
granting her complete intellectual control over the analysis and reporting of the data.
This working paper is accompanied by a summary, available on request from TMW Training
(www.tmwtraining.com) or the author (www.socialresearchandstatistics.wordpress.com).

ii
Contents
Credits and acknowledgements ............................................................................................................... i
Contents .................................................................................................................................................. ii
Summary ................................................................................................................................................ iii
Introduction ............................................................................................................................................ 1
Methods .................................................................................................................................................. 2
Data collection .................................................................................................................................... 2
Measures ............................................................................................................................................. 3
Student characteristics ....................................................................................................................... 4
Treatment of item non-response ........................................................................................................ 5
Preliminary analysis to derive overall and sub-scales of wellbeing ........................................................ 6
Results ..................................................................................................................................................... 7
Extent of change in wellbeing following TMW ................................................................................... 8
Drivers of change in wellbeing following TMW ................................................................................ 12
Summary ........................................................................................................................................... 14
Conclusions and discussion ................................................................................................................... 14
References ............................................................................................................................................ 16
iii
Summary
With origins in tai chi and qi gong, Tai Chi Movements for Wellbeing (TMW) is a specially-developed
sequence of movements for promoting physical and emotional wellbeing. A comparatively new
discipline, first piloted in 2009, TMW has so far lacked a robust evidence base of its impacts on
physical and psychological wellbeing in mixed-health populations. A before-and-after service
evaluation was undertaken to try to address this evidence gap.
Data were collected via 13 TMW practitioners from mostly self-referring students participating in
open, short courses. These typically comprised three to eight students in community settings. A total
of 195 students completed both baseline and follow up evaluation forms which included rating 14
items relating to physically and emotional wellbeing on a scale of 1 to 10. Participants were aged
between 19 and 88 and were mostly older adults (68 per cent were aged 60 or over), female (84 per
cent) and without a health condition recorded by the practitioner (77 per cent).
The evaluation has found that undertaking a course of TMW was associated with an average
increase in self-reported personal wellbeing equivalent to 12.3 points on a scale from 14 to 140;
equivalent to a 10 per cent increase in wellbeing. The apparent effect of TMW on wellbeing was
particularly strong in relation to improving self-reported flexibility and fatigue. Three reliable sub-
domains of overall wellbeing were identified, relating to psychological wellbeing, wellbeing in
movement and fatigue and pain, all of which improved significantly if modestly following TMW
compared with the baseline. Any improvements were felt equally by men and women. A lower
baseline wellbeing score drove greater change (and, therefore, improvement) following a course of
TMW. While improvements were seen for all age groups, these improvements were also influenced
independently by the student’s age with younger students experiencing greater improvement.
These improvements were associated with TMW, and appear to be consistent with a benefit of
TMW, making TMW a potentially valuable non-invasive and accessible tool as part of wider toolkit
for public health and wellbeing. However, the limitations of the evaluation design mean that the
improvements associated with TMW may not be attributable (solely or in part) to TMW.

1
A before-and-after service evaluation of Tai Chi Movements for
Wellbeing (TMW) on physical and psychological wellbeing in a
mixed health population
A full report by Andrea Finney, on behalf of TMW Training Ltd, August 2016
Introduction
Tai Chi Movements for Wellbeing (TMW) is a specially-developed sequence of movements for
promoting physical and emotional wellbeing. With origins in tai chi and qi gong, the TMW sequence
was developed as a collaboration between a tai chi practitioner and a clinical health psychologist to
distil elements of these arts into a simplified form.1 TMW is characterised by ‘mindfulness through
movement’ and, being possible to be practised standing or seated, is accessible to a potentially wide
range of students with and without clinically-relevant health conditions.
Despite being a comparatively new discipline, first piloted in 2009, TMW Training is endorsed by
SkillsActive, is an approved Register of Exercise Professionals Training Provider, and is provided as
part of the GP Referral Scheme in Wales. It can be used to aid treatment in areas including mental
health, brain injury, cardiac care, stroke rehabilitation, long term health conditions such as MS,
Parkinson’s, Obesity, Diabetes, ME and pre- and post-operative cancer care, but also has much wider
applications for wellbeing, for example in educational, employment and community settings.
A considerable body of literature exists describing the benefits of tai chi, qi gong and mindfulness
meditation on health and wellbeing. In clinical trials, qualitative research and other studies,
significant evidence exists of the applicability and benefits of traditional Chinese exercise (tai chi and
qi gong) for clinical populations including those with cardiovascular disease (Wang et al., 2016),
rheumatoid arthritis (Uhlig et al, 2010), acquired brain injury (e.g. Blake and Batson, 2009; Gemmall
and Leathem, 2006), cancer patients (e.g. Blake et al 2010) and elderly populations at risk of falls
(e.g. Hong et al., 2001; Leung et al., 2011). It has also shown to be beneficial in healthy populations,
eastern and western (Wang et al., 2010). Across these studies, demonstrated benefits encompass
improvements to physiological, biochemical and psychological outcomes including, variously,
cardiorespiratory function, immune capacity, flexibility, muscle strength, balance control, stress,
anxiety, depression, mood disturbance and self-esteem in community-dwelling healthy participants
and patients with chronic conditions. It has also been found to be safe, transferable, and easily
adapted to specific populations, such as injured military service people (Reb et al., 2016).
Similarly, a strong evidence base exists for the benefits of mindfulness meditation on factors such as
physical health, pain reduction and high blood pressure as well as intellectual and emotional and
social skills. The latter includes the ability to feel in control, make and maintain meaningful
relationships, manage difficult feelings, and to manage stress, anxiety, be calm, resilient, show
compassion and be empathic (Weare, 2012). Research has evidenced benefits among healthy adults
and school-aged children (Weare, 2012) and in specialist populations such as young people with
learning disabilities (Beauchemin et al., 2008) and patients with psychiatric (e.g. Biegel et al 2009),
substance abuse (Tang et al, 2015), sleep (Bogelset al, 2008) and other long-term conditions such as
1 Mr Richard Farmer, founder of the nationwide Rising Dragon Tai Chi School (RDTC) and Honorary President of the Tai Chi Union for Great Britain and Dr David Quinn, former Head of Profession and Head of the Department of Health Psychology with the National Health Service in Herefordshire.
2
fibromyalgia and psoriasis (Weare, 2012). Long-term mindfulness training is associated with a
reduction in resting respiration rates, itself a correlate of psychological wellbeing (Wielgosz et al.,
2016).
These benefits of traditional Chinese exercise and mindfulness meditation together provided a
platform for the development of a new tai chi movement protocol, characterised by ‘embodied
mindfulness’ (Quinn, 2014), which would provide an exercise-based therapy suitable for those living
with a long-term health condition (Blake et al., 2010). TMW was developed to meet that need and
also to be applicable to much further-reaching clinical and healthy populations than traditional
Chinese exercise alone might currently extend to.
Pilot research of the effects of TMW identified significant improvements in balance,2 in times taken
to ‘get up and go’,3 overall psychological wellbeing,4 and independence and participation in patients
with acquired brain injury (Quinn, 2014). In an extended study of 214 people with long term health
conditions, patients reported significant improvements in participation, emotional stability, fatigue,
flexibility and sleep (Quinn, 2014). There is also qualitative evidence of TMW’s benefits to individuals
and the extent to which those self-managing long-term conditions value it as a ‘helpful, supportive
and effective intervention’ (Quinn, 2014; 13) and substantial undocumented anecdotal evidence of
its benefits in the wider population of service users. However, there has yet to be any robust
evaluation to measure the effects of TMW on physical and psychological wellbeing, particularly
within a mixed-health, largely self-referring population. This study therefore builds on the
encouraging early evidence to provide the first step towards a more robust evidence base.
The results discussed here relate to a service evaluation of TMW, delivered to a mixed population of
predominantly older people (68 per cent were aged 60 or over), most of whom self-referred to open
classes offered in community settings. The evaluation incorporated a simple single group, before-
and-after measurement design.
Methods
As part of its service monitoring and evaluation, TMW Training collected a large bank of data from
students of TMW courses. The data were collected in 2012 and 2013 by TMW practitioners holding
‘light protocol’ TMW courses for adults. The courses typically comprised small group classes of
between three and eight students, and lasted 6 to 8 weeks at an hour per week. The classes were
taught in each case in accordance with TMW Training’s guidelines for the light protocol course.
In most cases, the TMW students self-referred to open-group classes. In some instances, relating to
approximately one-fifth of students who provided data, classes were organised by or on behalf of a
special interest group, for example in the case of a self-management group for fibromyalgia and a
physiotherapy clinic in an NHS setting. In each case, however, participation in the TMW course was
voluntary.
Data collection
Students were asked to self-complete a short, paper-based one-page evaluation form before they
commenced a TMW course. They were invited to complete a similar form after they completed their
2 Measured on the Berg Balance Scale: see e.g. Berg et al (1995). 3 Measured on the Timed Get Up and Go Test: see e.g. Podsiadlo and Richardson S (1991). 4 Measured on Core-10: see e.g. Connell and Barkham (2007).

3
course. Forms were distributed and collected by a TMW practitioner and contributed to their
Continued Professional Development. As part of their instructions for data collection, practitioners
explained to students that they were under no obligation to complete the forms and, although they
were encouraged on the form to complete all the items, they could miss any they did not feel they
could answer.
A total of 212 students from 13 practitioners completed evaluation forms, comprising 210 students
at the baseline data collection and 197 at the follow-up. A total of 195 students completed both
evaluation forms, representing a 92 per cent ‘fully responding’ completion rate. It is unknown how
many students refused to complete both forms, although this number is expected to be low.
Measures
The evaluation form primarily comprised a battery of 14 items (statements) relating to different
aspects of physical and psychological wellbeing. These are shown in Table 1, along with a shorthand
used to refer to them throughout this report. The items were constructed to reflect the benefits
TMW was developed to offer, and this was based on experiential evidence and prior literature
underpinning of the benefits of related protocols (tai chi, qi gong, mindfulness and meditation).
Table 1: Items making up the wellbeing measurement scale, and abbreviated names
Item detail Shorthand A. Balance: How steady on my feet I feel
Balance
B. Energy: The amount of energy I have to complete everyday tasks
Energy
C. Confidence: The degree to which I believe I am able to cope with the demands of daily life
Confidence
D. Worry: How well I cope with worrying thoughts, either about the future or the past
Worry
E. Co‐Ordination: The degree to which I feel I can perform a task with precision
Coordination
F. Participation: My ability to participate in life and undertake routine tasks in daily life
Participation
G. Emotional stability: To what extent I feel able to remain in my ‘emotional’ centre if I am knocked off balance. How quickly can I recover my ‘emotional’ poise
Emotional Stability
H. Fatigue: How tired I feel
Fatigue
I. Flexibility: The amount of range of movement I feel I have
Flexibility
J. Problems sleeping/waking early: The degree to which lack of sleep affects my ability to carry out my daily tasks
Sleep
K. Breathing: How at ease I am with my breath/ breathing
Breathing
L. Pain: How intrusive my pain is on a daily basis
Pain
M. Mobility: How confident I feel that I am able to get around independently
Mobility
N. Focus & Concentration: My ability to focus and concentrate to see tasks through to completion
Focus

4
Participants were asked to self-rate their current status against each item on a scale of 1 and 10
provided on the form, where 1 indicated ‘Not good/poor’ and 10 indicated ‘Very good/no problem’.
An emoji (picture character) was placed at each end of the response scale to reinforce the direction
of the scale (sad face at a score of 1; smiley face at a score of 10).
Additional information captured on the evaluation form included gender and date of birth
(recalculated as age in years based on the date of a student’s first class, and re-categorised as age
group for analysis), and client ID (initials) to enable matching before and after the TMW.
Practitioners were also asked to record any prevailing health conditions of the student on the form;
this largely reflects the context in which courses were run (as described above, whether for open-
group or a special-interest group classes) and may not have been completed systematically or
comprehensively.
Student characteristics
Table 2 below shows the characteristics of the service users at baseline (210 students) and at both
baseline and follow up (a base of 195 fully responding students). In relation to both, it is apparent
that students were disproportionately comprised of women (84 per cent of baseline and 84 per cent
of fully responding students). The largest proportions were aged in their 60s (36 per cent and 37 per
cent respectively, with the average (mean) age at baseline being 63 (increasing nominally to 64 at
baseline and follow up), median age 65, and a minimum and maximum age of 19 and 88
respectively. Only a minority had potentially relevant health conditions recorded (22 and 23 per
cent). It is also clear from these figures that the demographic profile of the service users remains the
same despite the attrition (loss) of 15 students between baseline and follow up.
Table 2 Characteristics of the students
Notes. '-' indicates no cases
Across 13 practitioners, the mean (arithmetic) average student per practitioner was 16 at the
baseline measurement, and 15 overall.

5
Treatment of item non-response
Item response among those completing forms was generally very high, although not complete for
any item, except item balance at follow up (Table 3; column 2). Therefore, and in order to maintain
our base size of 195 across the baseline and follow up measurements, it was necessary to impute
item-missing data for each item based on the mean average of the non-missing data for that item.
This is parsimonious, and has the effect of retaining the mean albeit artificially reducing the
variability of scores around the mean (indicated by the standard deviation; and marginally increasing
the chance of returning a statistically significant result).
Table 3 shows the means and standard deviations for each item (before and after imputation) at
baseline and follow up based on the numbers responding at each stage. It also shows the
corresponding means and standard deviations for the fully responding base of 195 students. These
descriptive statistics are not affected unduly by item imputation or attrition.
Table 3 Mean and standard deviation of items before and after treatment of missing
6
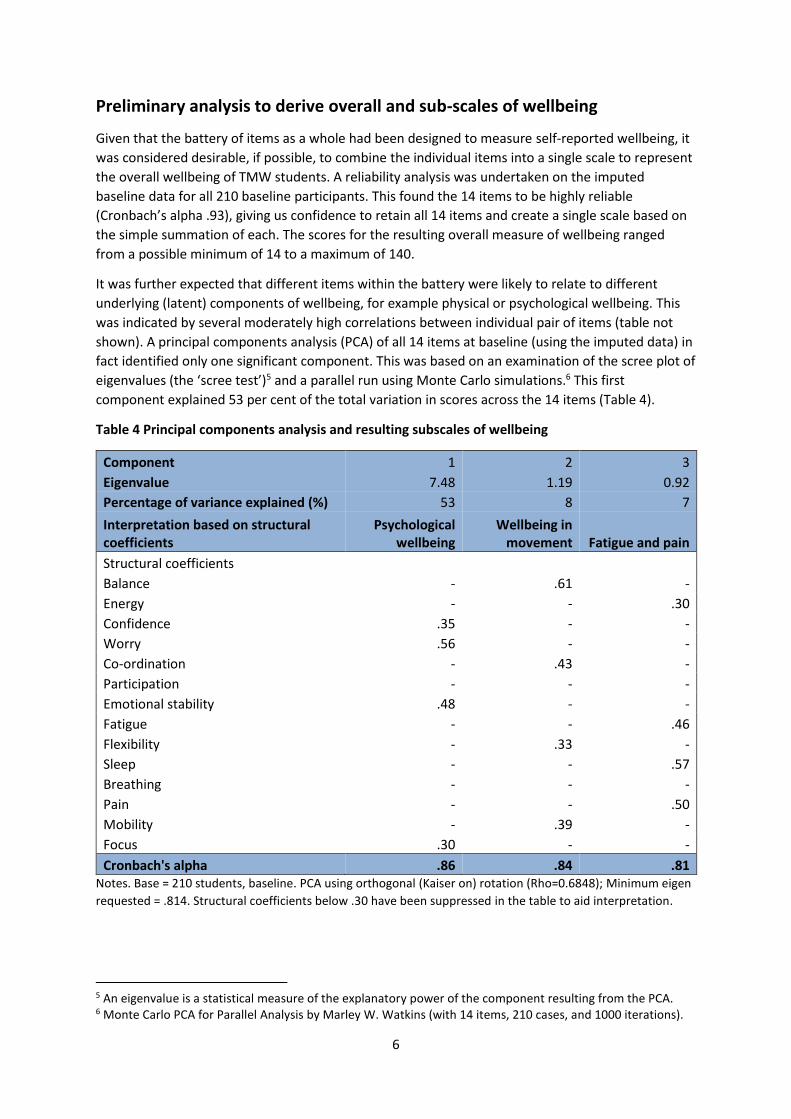
Preliminary analysis to derive overall and sub-scales of wellbeing
Given that the battery of items as a whole had been designed to measure self-reported wellbeing, it
was considered desirable, if possible, to combine the individual items into a single scale to represent
the overall wellbeing of TMW students. A reliability analysis was undertaken on the imputed
baseline data for all 210 baseline participants. This found the 14 items to be highly reliable
(Cronbach’s alpha .93), giving us confidence to retain all 14 items and create a single scale based on
the simple summation of each. The scores for the resulting overall measure of wellbeing ranged
from a possible minimum of 14 to a maximum of 140.
It was further expected that different items within the battery were likely to relate to different
underlying (latent) components of wellbeing, for example physical or psychological wellbeing. This
was indicated by several moderately high correlations between individual pair of items (table not
shown). A principal components analysis (PCA) of all 14 items at baseline (using the imputed data) in
fact identified only one significant component. This was based on an examination of the scree plot of
eigenvalues (the ‘scree test’)5 and a parallel run using Monte Carlo simulations.6 This first
component explained 53 per cent of the total variation in scores across the 14 items (Table 4).
Table 4 Principal components analysis and resulting subscales of wellbeing
Component 1 2 3
Eigenvalue 7.48 1.19 0.92
Percentage of variance explained (%) 53 8 7
Interpretation based on structural coefficients
Psychological wellbeing
Wellbeing in movement Fatigue and pain
Structural coefficients
Balance - .61 -
Energy - - .30
Confidence .35 - -
Worry .56 - -
Co-ordination - .43 -
Participation - - -
Emotional stability .48 - -
Fatigue - - .46
Flexibility - .33 -
Sleep - - .57
Breathing - - -
Pain - - .50
Mobility - .39 -
Focus .30 - -
Cronbach's alpha .86 .84 .81 Notes. Base = 210 students, baseline. PCA using orthogonal (Kaiser on) rotation (Rho=0.6848); Minimum eigen
requested = .814. Structural coefficients below .30 have been suppressed in the table to aid interpretation.
5 An eigenvalue is a statistical measure of the explanatory power of the component resulting from the PCA. 6 Monte Carlo PCA for Parallel Analysis by Marley W. Watkins (with 14 items, 210 cases, and 1000 iterations).

7
Nonetheless, the first three components all had eigenvalues of more than 0.814.7 Orthogonal
rotation of the first three components identified the first one as relating to psychological wellbeing
based on four moderately loading variables (defined as having a structural coefficient of .30 or
higher): worry, emotional stability, confidence and focus. The second and third components, though
each explaining only a small proportion of the variance (eight and seven per cent respectively), were
highly interpretable. They related to wellbeing in movement (represented by: balance, coordination,
mobility and flexibility) and fatigue and pain (represented by: sleep, pain, fatigue and energy). The
latter is interesting because its experience and effects have the potential to transcend physical and
psychological domains. Table 4 provides more details. Two individual items (participation and
breathing) are excluded from these subscales, but are retained as individual measures and in overall
wellbeing.
A reliability analysis of the three resulting subscales (constructed by summing the four items most
relevant to each) found each one to be adequately reliable (Cronbach alphas of .86, .84 and .81
respectively; Table 4). We therefore took a pragmatic decision to retain all three components for
further analysis as subscales of wellbeing, each with possible scores ranging from 4 to 40.
Table 5 shows the average and variation in scores for overall wellbeing and each of the constructed
subscales calculated for the 195 fully responding base. This shows that, out of a possible 140, TMW
students scored an average of 93.5 on their overall wellbeing before TMW and 105.7 afterwards. It
also shows, for example, that TMW students scored 24.6 out of a possible 40 before TMW and 28.2
afterwards on the fatigue and pain subscale. The next sections consider whether or not the apparent
differences before and after TMW are of statistical and practical significance.
Table 5 Mean and standard deviation of overall and sub-scales for fully responding base before
and after TMW
Baseline Follow up
Mean Std Dev. Mean Std Dev.
Psychological wellbeing 26.5 6.92 30.1 5.83
Wellbeing in movement 28.0 7.16 31.6 5.92
Fatigue and pain 24.6 7.49 28.2 6.58
Overall wellbeing 93.5 21.98 105.7 18.95 Notes. Base = 195 students at baseline and follow up.
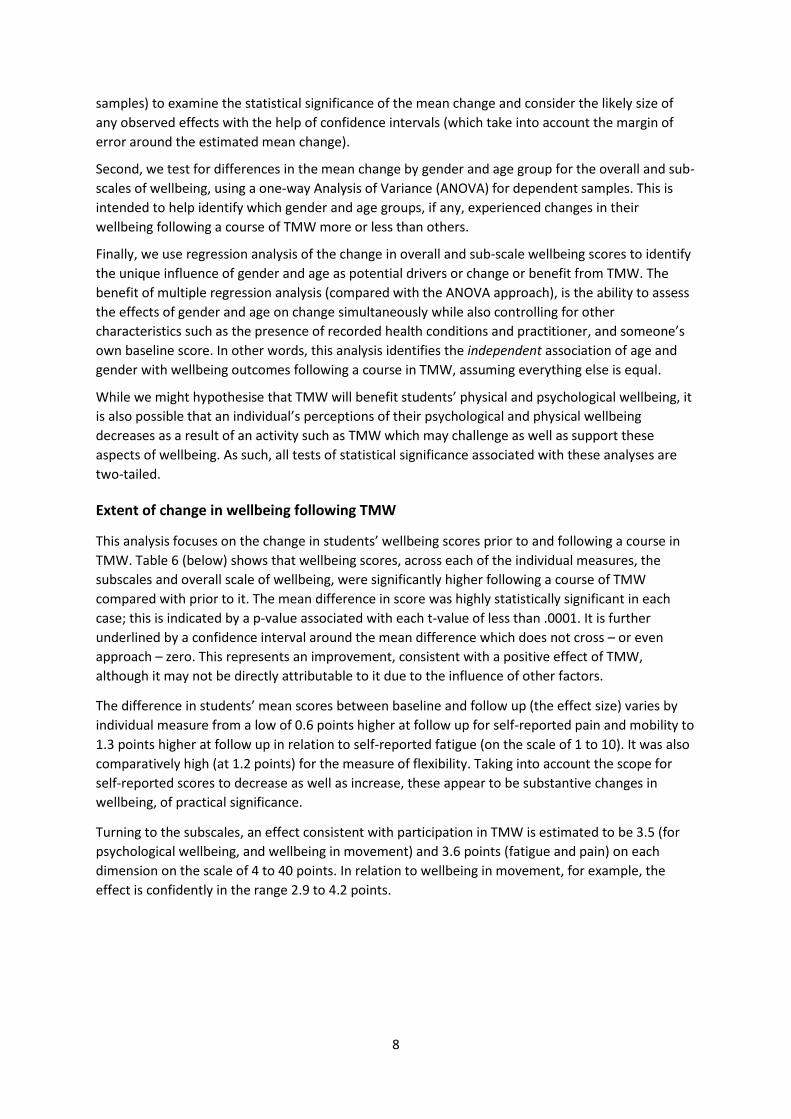
Results
The findings from the evaluation are examined in three stages. In each case, the analysis is limited to
the 195 students who completed baseline and follow up evaluation forms.
First, we compare students’ mean average wellbeing scores before and after they completed their
course of TMW for each individual measure of wellbeing captured in the evaluation tool, and the
overall and sub-scales of wellbeing. In doing so, we use the related t-test (t-test for dependent
7 This takes into account an adjustment of the Kaiser criterion of a minimum eigenvalue of 1.0 for sampling variation The model as a whole had good sampling adequacy, as indicated by a Kaiser-Meyer-Olkin (KMO) statistic of 0.92. The KMO statistic is the ratio of the squared correlation between variables to the squared partial correlation between variables. A KMO value of 0.50 or greater indicates adequate base sizes for PCA and adequately compact patterns of correlations leading to distinct and reliable components (Field, 2009). Additionally, a highly significant Bartlett’s test of sphericity (p=0.000) indicates that the correlation matrix differed significantly from an identity matrix and that it was appropriate to include all 14 items in the PCA.
8
samples) to examine the statistical significance of the mean change and consider the likely size of
any observed effects with the help of confidence intervals (which take into account the margin of
error around the estimated mean change).
Second, we test for differences in the mean change by gender and age group for the overall and sub-
scales of wellbeing, using a one-way Analysis of Variance (ANOVA) for dependent samples. This is
intended to help identify which gender and age groups, if any, experienced changes in their
wellbeing following a course of TMW more or less than others.
Finally, we use regression analysis of the change in overall and sub-scale wellbeing scores to identify
the unique influence of gender and age as potential drivers or change or benefit from TMW. The
benefit of multiple regression analysis (compared with the ANOVA approach), is the ability to assess
the effects of gender and age on change simultaneously while also controlling for other
characteristics such as the presence of recorded health conditions and practitioner, and someone’s
own baseline score. In other words, this analysis identifies the independent association of age and
gender with wellbeing outcomes following a course in TMW, assuming everything else is equal.
While we might hypothesise that TMW will benefit students’ physical and psychological wellbeing, it
is also possible that an individual’s perceptions of their psychological and physical wellbeing
decreases as a result of an activity such as TMW which may challenge as well as support these
aspects of wellbeing. As such, all tests of statistical significance associated with these analyses are
two-tailed.
Extent of change in wellbeing following TMW
This analysis focuses on the change in students’ wellbeing scores prior to and following a course in
TMW. Table 6 (below) shows that wellbeing scores, across each of the individual measures, the
subscales and overall scale of wellbeing, were significantly higher following a course of TMW
compared with prior to it. The mean difference in score was highly statistically significant in each
case; this is indicated by a p-value associated with each t-value of less than .0001. It is further
underlined by a confidence interval around the mean difference which does not cross – or even
approach – zero. This represents an improvement, consistent with a positive effect of TMW,
although it may not be directly attributable to it due to the influence of other factors.
The difference in students’ mean scores between baseline and follow up (the effect size) varies by
individual measure from a low of 0.6 points higher at follow up for self-reported pain and mobility to
1.3 points higher at follow up in relation to self-reported fatigue (on the scale of 1 to 10). It was also
comparatively high (at 1.2 points) for the measure of flexibility. Taking into account the scope for
self-reported scores to decrease as well as increase, these appear to be substantive changes in
wellbeing, of practical significance.
Turning to the subscales, an effect consistent with participation in TMW is estimated to be 3.5 (for
psychological wellbeing, and wellbeing in movement) and 3.6 points (fatigue and pain) on each
dimension on the scale of 4 to 40 points. In relation to wellbeing in movement, for example, the
effect is confidently in the range 2.9 to 4.2 points.
9
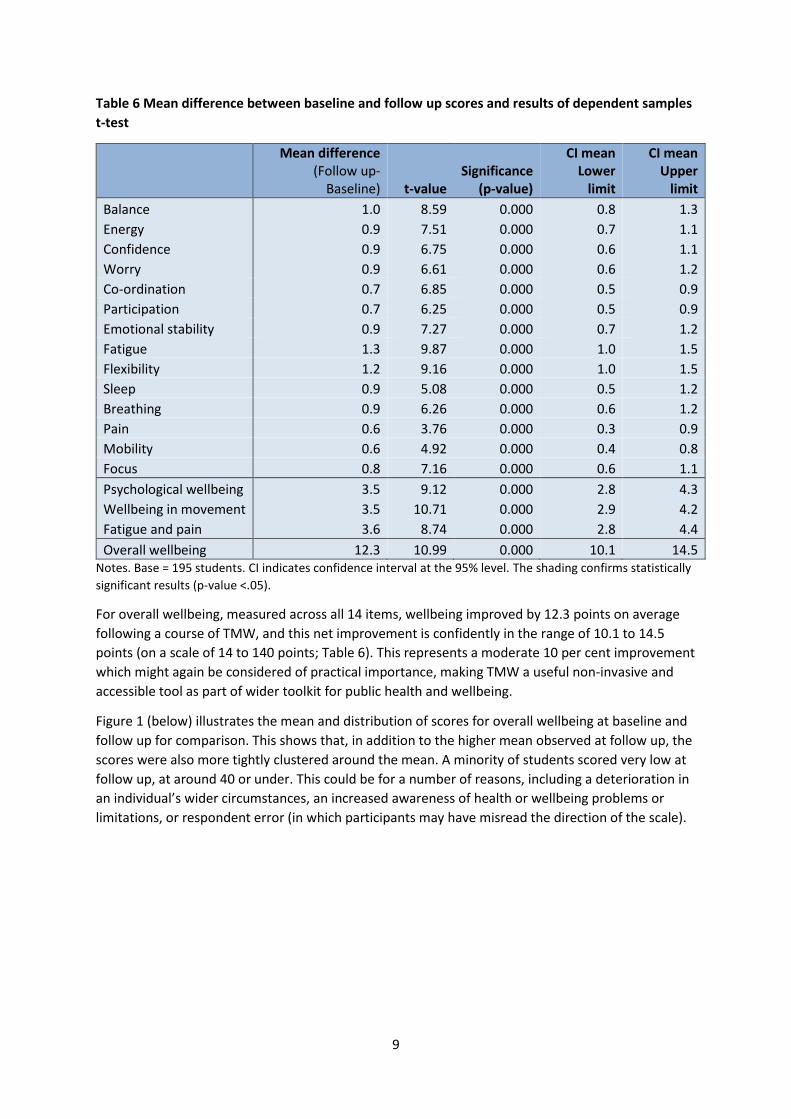
Table 6 Mean difference between baseline and follow up scores and results of dependent samples
t-test
Mean difference (Follow up-
Baseline) t-value Significance
(p-value)
CI mean Lower
limit
CI mean Upper
limit
Balance 1.0 8.59 0.000 0.8 1.3
Energy 0.9 7.51 0.000 0.7 1.1
Confidence 0.9 6.75 0.000 0.6 1.1
Worry 0.9 6.61 0.000 0.6 1.2
Co-ordination 0.7 6.85 0.000 0.5 0.9
Participation 0.7 6.25 0.000 0.5 0.9
Emotional stability 0.9 7.27 0.000 0.7 1.2
Fatigue 1.3 9.87 0.000 1.0 1.5
Flexibility 1.2 9.16 0.000 1.0 1.5
Sleep 0.9 5.08 0.000 0.5 1.2
Breathing 0.9 6.26 0.000 0.6 1.2
Pain 0.6 3.76 0.000 0.3 0.9
Mobility 0.6 4.92 0.000 0.4 0.8
Focus 0.8 7.16 0.000 0.6 1.1
Psychological wellbeing 3.5 9.12 0.000 2.8 4.3
Wellbeing in movement 3.5 10.71 0.000 2.9 4.2
Fatigue and pain 3.6 8.74 0.000 2.8 4.4
Overall wellbeing 12.3 10.99 0.000 10.1 14.5 Notes. Base = 195 students. CI indicates confidence interval at the 95% level. The shading confirms statistically
significant results (p-value <.05).
For overall wellbeing, measured across all 14 items, wellbeing improved by 12.3 points on average
following a course of TMW, and this net improvement is confidently in the range of 10.1 to 14.5
points (on a scale of 14 to 140 points; Table 6). This represents a moderate 10 per cent improvement
which might again be considered of practical importance, making TMW a useful non-invasive and
accessible tool as part of wider toolkit for public health and wellbeing.
Figure 1 (below) illustrates the mean and distribution of scores for overall wellbeing at baseline and
follow up for comparison. This shows that, in addition to the higher mean observed at follow up, the
scores were also more tightly clustered around the mean. A minority of students scored very low at
follow up, at around 40 or under. This could be for a number of reasons, including a deterioration in
an individual’s wider circumstances, an increased awareness of health or wellbeing problems or
limitations, or respondent error (in which participants may have misread the direction of the scale).

10
Figure 1 Distribution of scores for overall wellbeing at baseline and follow up
Notes. Base = 195 students. Standard deviation is 21.98 at baseline and 18.95 at follow up.
Mean (93.5)
05
10
15
Perc
ent
0 20 40 60 80 100 120 140
Overall wellbeing at baseline
Mean (107.5)
05
10
15
20
Perc
ent
0 20 40 60 80 100 120 140
Overall wellbeing at follow up

11
Changes in wellbeing following TMW by socio-demographic characteristics
Focussing on overall self-reported wellbeing and the sub-scales only, there is little difference in
mean change following TMW by gender or age group, the two socio-demographic variables captured
by the service evaluation. Table 7 shows that none of the apparent differences in scores between
men and women were statistically significant (at any accepted level of significance), and that the
confidence intervals around the mean differences overlapped greatly. As such, we can conclude that
men and women benefitted equally from TMW in relation to their personal wellbeing.
Table 7 Mean difference between baseline and follow up scores and results of dependent samples
one-way ANOVA by gender
Difference (Followup-Baseline)
Sample Mean CI lower
limit CI upper
limit F-ratio (1,193)
Sig. (p-value)
Psychological wellbeing
Men 31 3.9 1.9 5.8 0.12 0.725
Women 164 3.5 2.6 4.3
Wellbeing in movement
Men 31 2.9 1.5 4.3 0.77 0.382
Women 164 3.6 2.9 4.4
Fatigue and pain
Men 31 3.7 1.5 5.8 0.00 0.951
Women 164 3.6 2.7 4.5
Overall wellbeing
Men 31 11.7 6.3 17.1 0.05 0.828
Women 164 12.4 9.9 14.8 Notes. Base = 195 students. The confidence interval (CI) is shown at the 95% level.
Table 8 Mean difference between baseline and follow up scores and results of dependent samples
one-way ANOVA by age group
Difference (Followup-Baseline)
Sample Mean CI lower
limit CI upper
limit F-ratio (1,193)
Sig. (p-value)
Psychological wellbeing
Under 50 25 4.9 1.1 7.2 3.78 0.012
50 to 59 37 4.8 0.9 6.7 60 to 69 73 4.0 0.7 5.3
70 & over 60 1.7 0.6 2.8
Wellbeing in movement
Under 50 25 3.8 0.8 5.4 1.12 0.344
50 to 59 37 4.1 0.7 5.6 60 to 69 73 3.9 0.6 5.1
70 & over 60 2.6 0.5 3.7
Fatigue and pain
Under 50 25 4.8 1.3 7.5 2.33 0.076
50 to 59 37 5.1 1.0 7.2 60 to 69 73 3.5 0.7 4.8
70 & over 60 2.3 0.6 3.5
Overall wellbeing
Under 50 25 15.5 3.0 21.7 2.77 0.043
50 to 59 37 15.8 2.6 21.1 60 to 69 73 13.0 2.0 17.1
70 & over 60 7.8 1.6 10.9 Notes. Base = 195 students. 1 missing age group coded into 60 to 69 (modal group). The confidence interval
(CI) is shown at the 95% level. The light shading confirms statistically significant results.
12
Table 8, above, shows that the apparent variations in wellbeing by age group were mostly not large
enough to be statistically significant. There is one exception among the subscales, however, in
relation to psychological wellbeing. There is some indication that the improvement in psychological
wellbeing associated with TMW was larger among younger age groups compared with older age
groups (indicated by a p-value by age group of less than .05). However, the differences between
individual pairs of age groups were not significant (confirmed by observing the overlaps between the
confidence intervals and in post-hoc pairwise comparisons tested using the Sidák method).8
It is likely that the significant variation for psychological wellbeing by age group drives a large part of
the statistically significant variation observed by age in the measure of overall wellbeing (Table 8).
Again, the greater benefits appear to be skewed towards younger participants, although none of the
individual pairwise comparisons were statistically significant.
Drivers of change in wellbeing following TMW
Regression analysis offers an extension to the ANOVA approach in which we can consider the role of
gender and age group after controlling for other factors (such as reported health conditions and
practioner) as well as testing for the influence of these other factors. When other factors are
controlled in regression analysis, we can move our interpretation of any differences from differences
associated with age, for example, to the independent influence of age, all other things considered
equal. In other words, we can start to consider characteristics as predictive of wellbeing outcomes.
For this analysis, the outcome measure is again defined as the difference in wellbeing scores
between baseline and follow up (score at follow up less the score at baseline). This analysis is
focussed exclusively on the measure of overall wellbeing. In addition to gender and age group, the
following factors were included in the analysis:9
Wellbeing score at baseline
Recorded health conditions
o Joint problems (e.g. arthritis) or pain (e.g. lower back pain)
o Conditions associated with extreme fatigue (e.g. chronic fatigue syndrome (CFS/ME),
Fibromyalgia)
o Neurological conditions (e.g. Parkinson’s disease, cerebrovascular accident (CVA),
multiple sclerosis (MS))
o Other conditions (e.g. asthma, stress, cancer recovery)
Practitioner ID, which is likely to act as a proxy for factors associated with the class or types
of students attending which are not otherwise controlled for in the regression. This is used
as a control factor only in the analysis, and the findings are not reported in the tables or text.
Of immediate note is the finding that someone’s baseline wellbeing score was highly predictive of
their difference in score at follow up (Table 9, below). A coefficient of -0.4 indicates that with every 1
point increase in the score at the baseline, the difference in score between baseline and follow up
8 Post hoc tests are used to adjust for familywise error when testing for statistical significance across multiple pairwise comparisons. The adjustment reduces the potential for Type I errors (or false positives), which otherwise increases every time comparisons are undertaken. The method used to make this correction here is the Sidák method, which is a modification of the Bonferroni method often considered to be too conservative. At its simplest, adjustment for familywise error enables us to examine all the comparisons of interest while maintaining the Type I error rate of 5%. 9 We additionally tested for interaction effects between age and gender in an earlier model and have excluded them from the final model as they did not add significantly to the overall explanatory power of the model.

13
decreased by just under half a point. This is intuitive because people who scored more highly at the
baseline had less scope (and, potentially, need) to improve at follow up. For example, this means
that someone scoring 93.5 points on the overall wellbeing scale at the baseline (the mean at the
baseline) should expect to see an improvement at follow up of 3.3 points, all things being equal.10
Someone scoring 50.0 points at the baseline should expect to see a difference at follow up of 22.3
points, all other things being equal.
Table 9 Regression predicting difference in overall wellbeing between baseline and follow up
Notes. Base = 195 students. F(21, 173) = 5.72. Prob > F = 0.0000. R Squared = .41. Adj R-squared = 0.3382. 1
missing age group coded into 60 to 69 (modal group). In addition to the measures shown in the table,
practitioner ID was also included as a control variable, to help adjust for class type, location and other related
influences on outcomes. Base (reference) categories are Male, age 70 and over, and no recorded health
condition. The confidence interval (CI) is shown at the 95% level. The light shading confirms statistically
significant results.
Gender and recorded health conditions were not statistically significant in the analysis indicating
that these factors were not important in their own right for determining the relative benefit of TMW
among students. We do, however, see significant effects in relation to age (Table 9).
The reference category for age is set to the group aged 70 and over, as the earlier analysis suggested
this age group saw the least improvement between baseline and follow up. Compared with being 70
or over, there were significantly greater improvements in scores for each of the younger age groups.
Being aged under 50 was associated with 10.8 point higher difference in overall wellbeing score
compared with their counterparts aged 70 and over. Being aged in their 50s was associated with
10.9 point and being aged in their 60s with a 7.1 point higher difference than if aged 70 and over, all
other things being equal. These differences are confirmed by the confidence intervals, which do not
cross zero. However, the overlap evident between the confidence intervals for each age group
confirms that there are no significant differences in improvement between the younger age groups.
This does not mean that people aged 70 and over did not improve following a course of TMW, just
that their improvement was lower relative to other age groups. This may reflect greater general
10 This is based on the reference characteristics of someone being male, aged 70 and over, taught by practitioner no 1 and recording no health problems. It is calculated as the constant (43.8) plus baseline score (93.5) multiplied by the coefficient (-0.4).

14
health problems concomitant with ageing, and is likely to still be of individual clinical and practical
significance to older students.
Taking into account the role of age, we can reassess the mean difference in score at follow up for a
(hypothetical) student with no recorded health conditions who scored 93.5 at the baseline. The
equivalent person who was aged in his 60s could expect to see their wellbeing score improve by
some 25.3 points. If this same person scored only 50 points at the baseline, they could expect to see
their wellbeing improve by 44.0 points. These are substantial improvements.
Summary
The analysis has found that undertaking a course of TMW was associated with an average increase in
self-reported personal wellbeing equivalent to 12.3 points on a scale from 14 to 140; or a 10 per
cent increase in wellbeing. The positive effect of TMW on wellbeing was particularly strong in
relation to flexibility and fatigue. Any improvements were felt equally by men and women, and
across all age groups but more strongly among younger age groups among the service users. There is
evidence that changes in overall wellbeing following a course of TMW are influenced independently
by the student’s age, with a lower baseline wellbeing additionally driving greater change (and with
that, greater improvement).
Conclusions and discussion
In a before-and-after service evaluation of TMW, we have observed significant net improvements in
personal wellbeing among mostly self-referring older adults participating in a short course of TMW.
In relation to overall wellbeing, this represents an improvement in the order of 10 per cent, or 14.4
points on a scale ranging from 14 to 140.
Significant improvement was observed for each of the 14 individual measures of physical and
emotional wellbeing, with flexibility and fatigue improving by around 14 per cent on average, or 1.3
points on a scale from 1 to 10. Three latent components, relating to psychological wellbeing,
wellbeing in movement, and fatigue and pain were identified from the individual items. An observed
improvement of 3.5 points in wellbeing (and 3.6 for fatigue and pain; on a scale ranging from 4 to
40) for each resulting scale was statistically significant and of practical significance. These
improvements are associated with TMW, and appear to be consistent with a benefit of TMW,
making TMW a potentially valuable non-invasive and accessible tool as part of wider toolkit for
public health and wellbeing.
There is also evidence that the size of improvement in overall wellbeing following TMW is influenced
independently by the student’s age (with younger age groups experiencing greater improvement).
The strongest factor, however, relates to an individual’s baseline score; with those with low
wellbeing experiencing the greatest benefits.
The design of the evaluation means it is not possible to directly attribute this benefit to TMW, or
estimate the likely contribution of TMW to improved wellbeing. Other factors which could not be
controlled in this design, such as other treatment interventions or a change in wider health or
personal circumstances, may account for the differences. Similarly, the absence of a control group of
students who did not receive TMW means we cannot rule out the possibility that a similar net
improvement would have been observed without undertaking a course of TMW. The inclusion of a
comparison or randomised control group was not possible within the constraints of this service
evaluation.

15
We also cannot rule out the potential for social desirability effects, in which participants
(deliberately or unconsciously) provide data they expect to please the practitioner or the evaluation,
to have overstated the results. However, it is of note that not all participants’ wellbeing improved at
follow up, and not consistently so across the items, helping to emphasise the variability in
experiences. Added to this, errors in the completion of the data collection tool would be more likely
at the baseline measurement. A qualitative assessment of the evaluation form completion suggests
some participants may have confused the direction of the scale when completing their response. All
other things being equal, this error should be reduced at a second data collection exercise.
Item non-response was comparatively low, therefore the effects of imputation are small. Unit
(student) non-response at baseline and follow up was also comparatively low. Only 13 students (six
per cent) from the initial 210 completing a baseline form baseline had to be excluded from the
analysis because they did not complete the follow up form. However, it is possible that students who
attritted were less likely to have benefited from TMW, either because their health situation
deteriorated sufficiently to preclude them from completing the TMW course, or because they
withdrew in the absence of any perceived benefits. We also do not know how many students did not
complete either form, whether or not they completed the course, and whether the characteristics of
these students differ systematically from those counted in the evaluation.

16
References
Barkham, M., Evans, C, Margison, F, et al (1998) The rationale for developing and implementing core
outcome batteries for routine use in service settings and psychotherapy outcome
research. Journal of Mental Health, 7: 35-47
Beauchemin, J, Hutchins, TL & Patterson, F (2008) Mindfulness meditation may lessen anxiety,
promote social skills and improve academic performance amongst adolescents with learning
difficulties. Complementary Health Practise Review, 13, 34-45.
Berg K, Wood-Dauphinee S and Williams JI. (1995) The Balance Scale: reliability assessment for
elderly residents and patients with an acute stroke Scandinavian. Journal of Rehabilitation
Medicine 27, 27-36
Biegel, GM, Brown, KW Shapiro, SL, and Schubert, CM (2009) Mindfulness-based Stress Reduction
for the treatment of adolescent psychiatric outpatients: a randomized clinical trial. Journal of
Consulting and Clinical Psychology, 77(5)
Blake, H and Batson, M (2009) Exercise intervention in brain injury: a pilot randomized study of Tai
Chi Qigong. Clinical Rehabilitation, 23: 589-598.
Blake, C, Quinn, D, and Farmer, R (2010) Tai Chi Movements for Wellbeing in Long Term Health
Conditions: Focus Group Report. http://www.tmwtraining.com/wp-
content/uploads/2011/01/Executive-Summary-October-2014.pdf. Accessed 11/07/2016
Bogels, S, Hoogstaf, B, Van Dun, L, De Schutter, S & Restifo, K (2008) Mindfulness training for
adolescents with externalizing disorders and their parents. Behavioural and Cognitive
Psychotherapy 36(2), 193-209.
Connell, J and Barkham, M (2007). CORE-10 User Manual, Version 1.1. CORE System Trust & CORE
Information Management Systems Ltd.
Gemmall, C and Leathem, JM (2006) A study investigating the effects of Tai Chi Chaun: Individuals
with traumatic brain injury compared to controls. Brain Injury, 20: 151-156.
Hong, JXL and Chan, KM (2001) Tai chi: physiological characteristics and beneficial effects on health.
Br J Sports Med, 35: 148-156
Leung DP, Chan CK, Tsang HW, Tsang WW, Jones AY (2011) Tai chi as an intervention to improve
balance and reduce falls in older adults: A systematic and meta-analytical review. Altern Ther
Health Med.,17(1):40-8.
Podsiadlo, D and Richardson, S (1991) "The timed 'Up & Go': A test of basic functional mobility for
frail elderly persons". Journal of the American Geriatrics Society 39 (2): 142–8
Quinn, D (2014) Embodied Mindfulness in Mental and Physical Health: Executive Summary.
http://www.tmwtraining.com/wp-content/uploads/2011/01/Executive-Summary-October-
2014.pdf. Accessed 11/07/2016
Reb, AM, Seaby Saum, N, Murphy, DA, Todd Breckenridge-Sproat S, Su, X and Bormann, JE (2016)
Qigong in Injured Military Service Members: A Feasibility Study. J Holist Nurs March 27, 2016
0898010116638159

17
Tang YY, Tang R, Posner MI (2015) Mindfulness meditation improves emotion regulation and
reduces drug abuse. Drug Alcohol Depend. 1;163
Tennant R, Hiller L, Fishwick R, Platt P, Joseph S, Weich S, Parkinson J, Secker J, Stewart-Brown S
(2007) The Warwick-Edinburgh Mental Well-being Scale (WEMWBS): development and UK
validation, Health and Quality of Life Outcome, 5: 63
Uhlig T, Fongen C, Steen E, Christie A, Ødegård S (2010) Exploring Tai Chi in rheumatoid arthritis: a
quantitative and qualitative study. BMC Musculoskelet Disord. 11:43
Wang, C, Bannuru, R, Ramel, J, Kupelnick, B, Scott, T and Schmid, CH (2010) Tai Chi on psychological
wellbeing: Systematic review and meta-analysis. BMC Complementary and Alternative
Medicine, 10: 23-39
Wang, C, Collet, JP and Lau, J (2004). The effect of Tai Chi on health outcomes in patients with
chronic conditions: A systematic review. Archives of International Medicine, 164: 493-501
Wang, XQ, Pi, YL, Chen, PJ, Liu, Y, Wang, R, Li, J, Chen, BL, Zhu, Y, Yang, YJ and Niu, ZB (2016)
Traditional Chinese Exercise for Cardiovascular Diseases: Systematic Review and Meta‐
Analysis of Randomized Controlled Trials. J Am Heart Assoc; 5
Weare, K (2012) Evidence for the Impact of Mindfulness on Children and Young People. Exeter:
University of Exeter. https://mindfulnessinschools.org/wp-content/uploads/2013/02/MiSP-
Research-Summary-2012.pdf. Accessed 11/07/2016
Wielgosz J, Schuyler B, Lutz A, Davidson RJ (2016) Long-term mindfulness training is associated with
reliable differences in resting respiration rate. Sci Rep, 7;6
World Health Organization (1995) Field trial, QHOQOL-100: the 100 questions with response scales.
Geneva Division of Mental Health: World Health Organization