
A Bayesian Approach to Assessing Lab Proficiency With ... A Bayesian Approach to Assessing Lab...
23
1 A Bayesian Approach to Assessing Lab Proficiency With Qualitative PCR Assays Used to Detect Biotech Traits in Crop Seed 7 th Seminar on Statistics in Seed Testing ISTA August 2005 Kirk Remund
Transcript of A Bayesian Approach to Assessing Lab Proficiency With ... A Bayesian Approach to Assessing Lab...
1
A Bayesian Approach to Assessing Lab Proficiency With Qualitative PCR Assays
Used to Detect Biotech Traits in Crop Seed
7th Seminar on Statistics in Seed Testing ISTA
August 2005
Kirk Remund

2
Overview
• Establish seed purity testing need• Establish lab proficency need• Lab proficency setup & challenges• Bayesian approach to overcome
challenges• Examples• Final comments/references

3
Testing Objectives• Test conventional crop seed for biotech trait
seed impurities (test seeds in pools)• Test biotech trait crop seed for purity (test
individual seeds)Assay Types• Detect gene event in seed or tissue (PCR)• Detect protein in seed or tissue (ELISA)• Focus of this talk is on qualitative assays
– Positive (+) = one or more seeds in pool are positive for trait
– Negative (-) = all seeds in pool are negative for trait
4
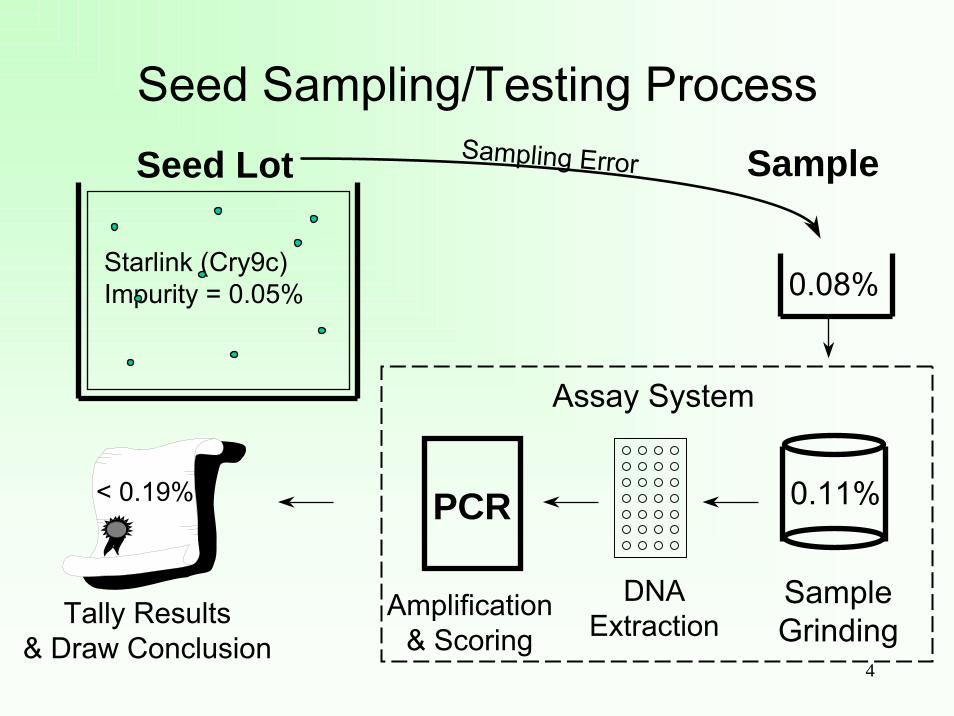
Seed Sampling/Testing Process
0.08%Starlink (Cry9c)Impurity = 0.05%
Seed Lot SampleSampling Error
< 0.19% 0.11%
SampleGrinding
PCR
DNAExtraction
Amplification& Scoring
Assay System
Tally Results& Draw Conclusion

5
Lab Proficency with “Assay System”
• Qualitative assay error metric– False positive rate (Fp): score a (-) sample as (+) – False negative rate (Fn): score a (+) sample as (-)– Do not confuse with Type I and Type II Errors!
• Properties– sensitivity, specificity, robustness– repeatability/reproducibility
• Lab must demonstrate error rates are low enough to achieve confidence in test results
6
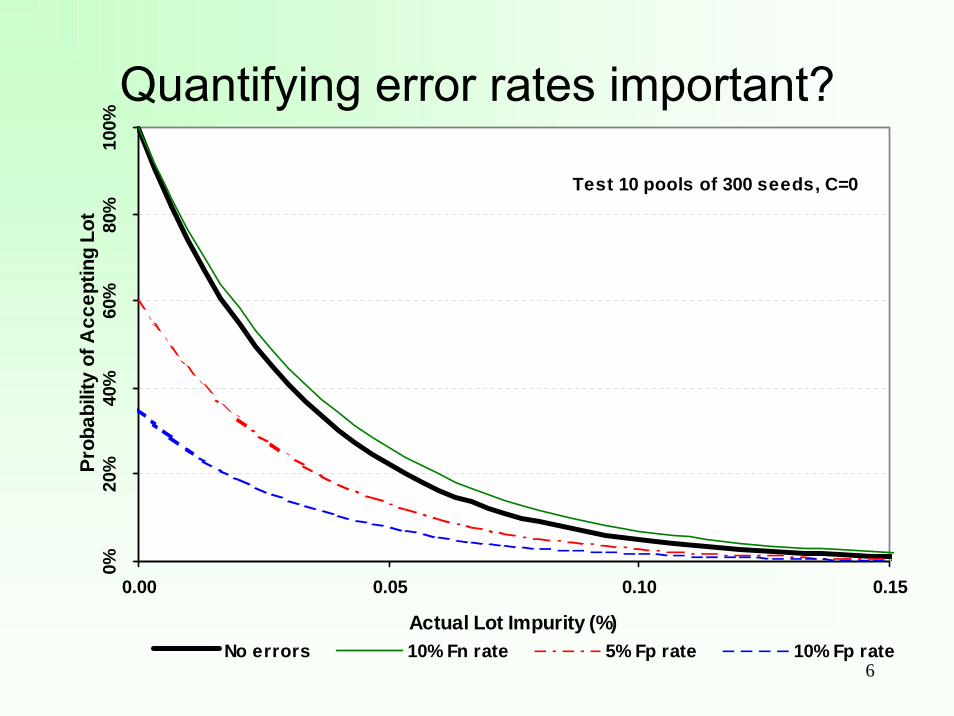
Quantifying error rates important?0%
20%
40%
60%
80%
100%
0.00 0.05 0.10 0.15
Actual Lot Impurity (%)
Prob
abili
ty o
f Acc
eptin
g Lo
t
No errors 10% Fn rate 5% Fp rate 10% Fp rate
Test 10 pools of 300 seeds, C=0

7
Quantifying error rates important?0%
20%
40%
60%
80%
100%
0.00 0.20 0.40 0.60 0.80 1.00 1.20 1.40
Actual Lot Impurity (%)
Prob
abili
ty o
f Acc
eptin
g Lo
t
No errors 5% Fp rate 5% Fn rate 10% Fn rate
Test 10 pools of 150, C=5
8
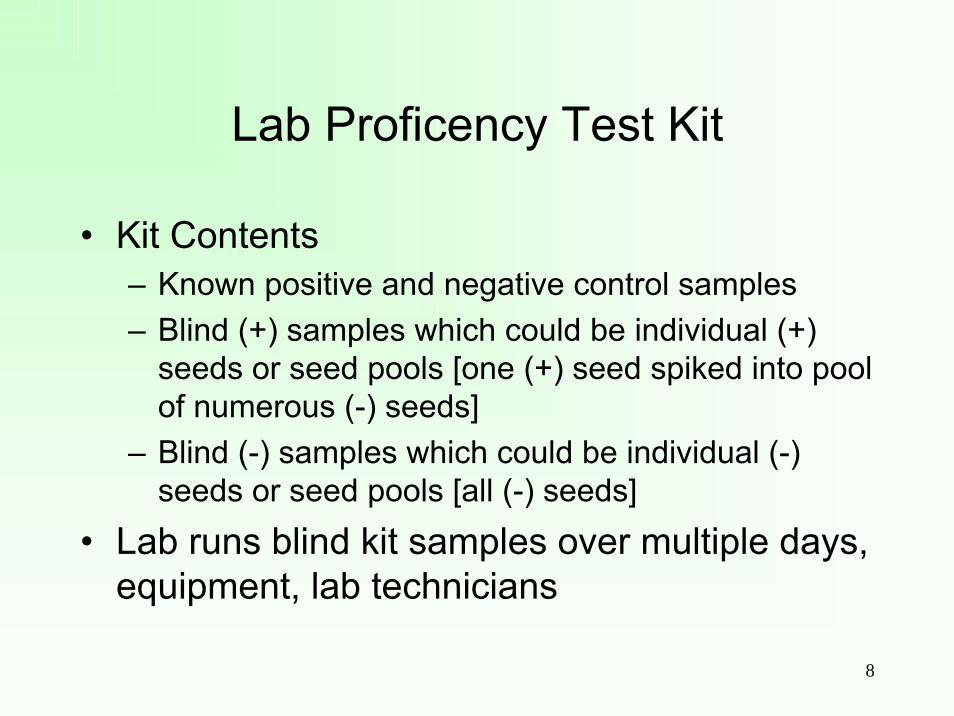
Lab Proficency Test Kit
• Kit Contents– Known positive and negative control samples– Blind (+) samples which could be individual (+)
seeds or seed pools [one (+) seed spiked into pool of numerous (-) seeds]
– Blind (-) samples which could be individual (-) seeds or seed pools [all (-) seeds]
• Lab runs blind kit samples over multiple days, equipment, lab technicians
9
Lab Proficency Testing Challenges
• PCR methods lack robustness to follow traditional method validation/handoff approach
• Qualitative assay = hundreds of samples required rather than tens to get reasonable estimates of errors
• Many assays (e.g., 100+) for lab to demonstrate proficency
• Difficult to find reference material with required purity• Much resources required to make test kits for all labs
doing testing (samples stability, accurate kit prep.)

10
• Error rates similar across assays in lab for same– Crop, tissue, pool size, method of detection
• Use historical or prior proficency data to help calculate error rates for present assay
Basis for a Bayesian Approach
0.37%
SampleGrinding
PCR
DNAExtraction
Amplification& Scoring
Assay System

11
Bayesian Approach Checks
• Process checklist: to ensure that lab process for present data is “same” used to generate historical data
• Test for differences between kit data to determine if a pooled or unpooled Bayesian approach is used (Fisher’s Exact Test, α = 0.1)

12
Flowchart of Approach
Present (P) Assay Data
H1 Data H2 Data Hk Data. . .
Each Hi from same process as P?
Can all Hi be pooled?
Can P be pooled with all Hi?
Unpooled Bayesianapproach to get errorrates and upper bounds
Pooled Bayesianapproach to get errorrates and upper bounds(noninformative prior)
noyes Disregard
Hi
noyes
noyes
Historical Data (Prior)Likelihood

13
Notation
x number of miscalls in present dataset
n number of samples in present dataset
yi number of miscalls in ith historical dataset
mi number of samples in ith historical dataset
misclassification rateθ

14
)σ,yg(β ),σ,yf(α
posteriorx)nβx,Beta(α~xθ
prior) β , α Beta( ~ θ
likelihoodθ)Bin(n,~θx
2y
2y ˆˆˆˆ
==
−++
Unpooled Bayesian Calculations
Method of Moments

15
Pooled Bayesian Calculations
posterior1)sN1,Beta(s~sθ priorUni(0,1)Beta(1,1)~θ
likelihoodθ)Bin(N,~θs
mnN yx sk
1ii
k
1ii
+−+
=
+=+= ∑∑==
(non-informative)

16
theta
prio
r den
sity
0.0 0.05 0.10 0.15 0.20
01
23
4
Pooled Bayesian ExampleDataset N* False
Neg.Error rate
P 50 2 4.0%
H1 30 2 6.7%
H2 50 0 0.0%
H3 100 2 2.0%
H4 90 5 5.6%
prior
posterior
theta hat 95% upper limit
Present data only (P) 4.0% 12.1%
P and all Hi 3.4% 5.6%
* N is number of blind positive samples

17
Unpooled Bayesian Example #1Dataset N False
Neg.Error rate
P 50 2 4.0%
H1 30 2 6.7%
H2 50 0 0.0%
H3 100 2 2.0%
H4 90 9 10.0%
prior
posterior
theta hat 95% upper limit
Present data only (P) 4.0% 12.1%
P and all Hi 4.2% 8.7%
H4 significantly different than other Hi (Fisher’s Exact Test, alpha=0.1)theta
prio
r den
sity
0.0 0.05 0.10 0.15 0.20
05
1015
20

18theta
post
erio
r den
sity
0.0 0.05 0.10 0.15 0.20
010
2030
40
Pooled PosteriorUnpooled Posterior
Compare Posterior Densities

19
theta
dens
ity
0.0 0.2 0.4 0.6 0.8 1.0
05
1015
Unpooled Bayesian Example #2Dataset N False
Neg.Error rate
P 50 2 4.0%
H1 30 2 6.7%
H2 50 0 0.0%
H3 100 2 2.0%
H4 90 60 66.7%
prior
posterior
theta hat 95% upper limit
Present data only (P) 4.0% 12.1%
P and all Hi 4.1% 9.5%
Estimate and upper limit seem to low given H4 result?

20
Unpooled Bayesian Example #2
theta
dens
ity
0.0 0.2 0.4 0.6 0.8 1.0
05
1015
PosteriorPrior - Beta(0.1,0.40)Jefferys Prior - Beta(0.5,0.5)

21
theta
dens
ity
0.0 0.2 0.4 0.6 0.8 1.0
01
23
45
6
Unpooled Bayesian Example #3Dataset N False
Neg.Error rate
P 50 15 30.0%
H1 30 2 6.7%
H2 50 0 0.0%
H3 100 2 2.0%
H4 90 60 66.7%
prior
posterior
theta hat 95% upper limit
Present data only (P) 30.0% 42.4%
P and all Hi 29.9% 40.1%
Estimates and upper limits close (prior has little weight)

22
Final Comments
• At present, lab proficency testing for PCR takes a very large amount of time and $$$
• Implementing this approach will likely yield significant cost savings
• Even Frequentists might agree: “this is a legitimate Bayesian application?”
• I welcome any comments/criticisms to help us determine if this is a reasonable approach

23
References
1. Carlin, B. P., Louis, T. A., Bayes & empirical Bayesmethods for data analysis, 2nd ed. Chapman & hall/CRC, New York, 2000
2. Lindley, D.V., Introduction to probability and statistics from a Bayesian viewpoint, part 2. Inference, 1st ed. Cambridge Press, Cambridge University.
3. Remund, K. M., Dixon, D. A., Wright, D. L., Holden, L. R., “Statistical considerations in seed purity testing for transgenic traits”, Seed Science Research, June 2001, pages 101-119. (e-mail [email protected] to receive copy)


