9780071621823 Chapter 7 Leveraging OLAP in Your Organization
39
Oracle Essbase & Oracle OLAP: The Guide to Oracle's Multidimensional Solution by Michael Schrader et al. Oracle Press. (c) 2010. Copying Prohibited. Reprinted for N Kodanda Ramudu, Cognizant Technology Solutions [email protected] Reprinted with permission as a subscription benefit of Skillport, http://skillport.books24x7.com/ All rights reserved. Reproduction and/or distribution in whole or in part in electronic,paper or other forms without written permission is prohibited.
description
orale
Transcript of 9780071621823 Chapter 7 Leveraging OLAP in Your Organization
Oracle Essbase & Oracle OLAP: The Guide to Oracle's Multidimensional Solution
by Michael Schrader et al. Oracle Press. (c) 2010. Copying Prohibited.
Reprinted for N Kodanda Ramudu, Cognizant Technology Solutions
Reprinted with permission as a subscription benefit of Skillport, http://skillport.books24x7.com/
All rights reserved. Reproduction and/or distribution in whole or in part in electronic,paper or other forms without written permission is prohibited.

Chapter 7: Leveraging OLAP in Your Organization
The reporting and spreadsheet tools discussed in Chapter 6 are powerful ways to interact with OLAP data and share results, but they are not the only ways. Many packaged applications can use Essbase or Oracle OLAP as a source of data and/or as a calculation engine. For example, you can find applications for planning, forecasting, and cost management. These packaged applications interact with Essbase or Oracle OLAP via Java APIs. The APIs are public, which means that anyone can develop a custom application to work with one of Oracle’s OLAP engines.
In this chapter, we present some Oracle products that can be used with Essbase and Oracle OLAP. For Essbase, we showcase two enterprise performance management (EPM) products—Oracle Hyperion Planning and Oracle Hyperion Profitability and Cost Management—as well as Oracle Crystal Ball and Oracle Smart Space. For Oracle OLAP, we cover Oracle Application Express. We conclude with an introduction to the Java APIs for those who may be interested in developing a custom front-end application.
Performance Management Applications Leveraging Essbase
As described earlier in this book, you can create planning, budgeting, forecasting, and profitability and cost management systems using Essbase features embedded within custom Microsoft Excel or web applications. Custom applications come with challenges, including template creation (often by budget administrators), ease of use, end-user support, documentation, custom programming, a path for upgrades, and ongoing maintenance. For example, on one job, we had a situation where one employee created and owned the Excel-based planning models. The system was not documented, and it contained a lot of Visual Basic code leveraging the Essbase APIs. No one else in the organization had the knowledge necessary to maintain the application, and because the application was created by the finance department, it was not supported by the IT organization. Therefore, while this custom application did the job in the short term, the risks to the organization were high over the longer term.
Start-from-scratch solutions are obviously not for everyone. Fortunately, other options are available. As a result of the high demand for packaged applications, Oracle assembled the Oracle Enterprise Performance Management System. Two applications within that Oracle system leverage Essbase as their database and calculation engine: Planning and Profitability and Cost Management. Planning focuses on planning, budgeting, and forecasting. Profitability and Cost Management helps you to determine profitability and manage costs. With these Essbase-based applications, you gain all the advantages of a packaged application, without sacrificing the speed and power of an OLAP system.
In this section, we review the features and functionality of the Planning application and the Profitability and Cost Management application. We then look at the administration component called Oracle Hyperion Enterprise Performance Management Architect, which an administrator can use to create, manage, and deploy Planning and Profitability and Cost Management applications, as well as Essbase cubes. We end with a brief look at the architecture for all three applications.
Oracle Hyperion Planning
Planning is a centralized, OLAP-based application for planning, budgeting, and forecasting. Essbase is the underlying calculation engine and data repository.
Planning offers data-entry forms, custom context menus for ease of navigation, a graphical interface for creating rules and calculations, and built-in workflows. The workflow component helps drive collaboration throughout the planning, budgeting, and forecasting processes. For example, in the budget process, budget owners can submit their budgets for approval with commentary, and approvers can respond in a variety of ways, including sending comments back to the owner.
To satisfy the diverse needs of user communities within an organization, Planning provides a web-based interface and an Excel-based interface. A centralized server provides a single point of administration for both interfaces. For example, an administrator can create one data-entry template that is available from either a web browser or Excel.
Planning includes the following features:
n Support for top-down and bottom-up planning Senior management can set high-level targets at upper levels and allocate the targets down to lower levels (top-down). Planners can also start building budgets from the lowest level (bottom-up) and have comparisons to the targets.
n Multiple versions for iterative planning cycles Planners can set up multiple versions of the plan to create what-if scenarios. They can also capture plan iterations and create comparisons between the iterations.
Oracle Essbase & Oracle OLAP: The Guide to Oracle's Multidimensional Solution
Reprinted for CTS/215337, Cognizant Technology Solutions Oracle Press, The McGraw Hill Companies, Inc. (c) 2010, Copying Prohibited
Page 2 / 39

n Support for driver-based plans Planners can set up assumptions for drivers that may affect their financial plan, such as market share, inflation factors, interest rates, midpoint salaries, and FICA limits.
n Graphical Calculation Manager Planners can create easy and complex business rules and allocations without having to write script.
n Web-based and Excel-based data-entry forms and annotations Planners can create data forms to collect key plan information. A single data form definition is valid for both interfaces.
n Process management of the planning cycle Planners have a hierarchical or matrix review and sign-off with collaboration.
n Integration with other systems Planning ships with Oracle Data Integrator Enterprise Edition (ODI). ODI can be used to load metadata (such as charts of accounts, departments, and products) and related data from a relational data source.
n Currency conversion for multicurrency applications Currency conversion is built into Planning.
n Workforce Planning module This module provides predefined and supported content for the planning, budgeting, and forecasting of headcount and salary expenses.
n Capital Expense Planning module This module provides predefined and supported content for the planning, budgeting, and forecasting of capital expenditures and related profit and loss, balance sheet, and cash flow statements.
n Common administration Planning ships with Performance Management Architect, which is a common tool for managing shared hierarchies and creating applications for Planning and Profitability and Cost Management.
In a packaged solution, administrators expect the supporting components of the system to adapt to changes made to the system. For example, if an administrator adds a new cost center to an application, then the business rules, data-entry forms, custom navigation menus, process management, and related reports should automatically become aware that the new cost center exists. The administrator should not need to make any manual changes. Planning makes use of Essbase features to meet the demand for adaptive software. For example, when designing a business rule or data-entry form, the user will use family-related functions like IDescendants (Total Company). With family-related functions, the business rule and data form can adapt automatically to the addition of a new cost center. The following sections describe the adaptive components of Planning: Calculation Manager, data-entry forms, custom menus, process management, and task lists.
Calculation Manager
Business rules and the related calculations are the backbone of a planning application. Oracle developed a common interface, called Calculation Manager, where users can design, validate, and administer business rules in a graphical environment. Calculation Manager leverages the power of the Essbase calculation engine without the need to write Essbase calculation scripts. For example, you can graphically create a rule to aggregate the IT departmental expenses and allocate the total to all other cost centers (excluding the IT department) based on the number of PCs they have in place.
Calculation Manager has four main components: business rules, templates, variables and run-time prompts, and rule sets.
Business Rules
A business rule consists of components that are dragged and dropped into a rule flowchart. Figure 7-1 shows a sample flowchart and points out the components of a business rule.
Oracle Essbase & Oracle OLAP: The Guide to Oracle's Multidimensional Solution
Reprinted for CTS/215337, Cognizant Technology Solutions Oracle Press, The McGraw Hill Companies, Inc. (c) 2010, Copying Prohibited
Page 3 / 39

Figure 7-1: Business rule flowchart
As summarized in the New Objects area of Figure 7-1, a rule has five possible components:
n Formula This is the primary component of a business rule. Formulas contain calculation statements that assign values to accounts. For example, operating cost of sales (COS) can be assigned the value of 50 percent of operating revenue (Operating COS = Operating Revenue / 2). You can embed Essbase functions within formulas. Figure 7-2 shows two sample formulas within the Formula component.
Figure 7-2: Formula component of a business rule
n Script With the Script component, those who are familiar with Essbase Script can add calculation statements to their rules using Essbase syntax instead of formulas. You can embed Essbase functions within scripts. Figure 7-3 shows the calculations from Figure 7-2 recast in Essbase Script.
Figure 7-3: Script component of a business rule
n Condition You insert other rule components within the scope of the Condition component. A condition is an if-then statement. When the if part of the statement is true, Calculation Manager executes the statements within the Condition component. When it is false, the statements of the Condition component are skipped. You can specify conditions based on metadata or on the data itself. You can use Condition components to test which calculation should be executed. For example, the condition shown in Figure 7-4 states that if gross margin percent (Gross Profit / Net Revenue) is greater than 25 percent, execute the rule for medium COS.
Oracle Essbase & Oracle OLAP: The Guide to Oracle's Multidimensional Solution
Reprinted for CTS/215337, Cognizant Technology Solutions Oracle Press, The McGraw Hill Companies, Inc. (c) 2010, Copying Prohibited
Page 4 / 39

Figure 7-4: Condition component of a business rule
n Member Range This component creates a focus on a member or members where you would like the calculation to execute. For example, the range in Figure 7-5 specifies that this portion of the calculation will execute for all products under the Electronic category for the year FY10 for the Plan scenario and the Working version.
Figure 7-5: Member Range component of a business rule
n Fixed Loop This component indicates that a block of code is to repeat for a specified number of iterations. For example, you could specify that a loop execute the components within its scope ten times.
Templates
The rule designer provides predefined business rules called templates. Templates can be used for clearing a portion of the database, copying a portion of the database, creating allocations, and aggregating a portion of the database. A Units/Rate/Amount template solves for any of the three variables, as long as two of the three variables are defined. Figure 7-6 shows a template specifying a revenue calculation based on units and price. Using this template, if a planner enters values for units and price, the template solves for operating revenue. If another planner enters values for price and operating revenue, the template will solve for the number of units.
Oracle Essbase & Oracle OLAP: The Guide to Oracle's Multidimensional Solution
Reprinted for CTS/215337, Cognizant Technology Solutions Oracle Press, The McGraw Hill Companies, Inc. (c) 2010, Copying Prohibited
Page 5 / 39

Figure 7-6: Template rule designer
Variables and Run-Time Prompts
Variables are user-defined values that are set at the global, application, rule, or Essbase level. For example, you can create a variable called CURRYEAR and set it to 2009. Rules containing this variable will use the year 2009 in all calculations. In subsequent years, you can reset CURRYEAR to the new current year, and all rules that contain the variable automatically use the new value. Using variables eliminates the need to update each rule manually when the value of a global variable changes.
Run-time prompts (RTPs) can be used to ask the user to enter required information during the execution of a calculation. For example, if you had a business rule to increase an account by a given percentage, the RTP would ask the user to enter the percentage value.
An advanced feature of RTPs uses members that are on the data-entry form. The form enters the tokens into the business rule, and executes when the form is saved without prompting the user. For example, consider a data-entry form where the point of view reflects these settings: Scenario=Plan, Year=2009, Version=Working, and Entity=Dallas. If the end user changes the point of view to show Houston instead of Dallas and saves the change, the rule is updated to specify Houston.
Rule Sets
Rule sets contain two or more rules that are calculated simultaneously or sequentially. For example, if you are allocating the IT department’s expenses to all other cost centers, you first want to aggregate the expenses, and then run a series of allocations. You can create a rule set to automate the calculation and allocations.
Data-Entry Forms
Data-entry forms are spreadsheet-like grids with rows and columns for entering and modeling data. Figure 7-7 shows a sample Planning data-entry form displayed in a web browser.
Oracle Essbase & Oracle OLAP: The Guide to Oracle's Multidimensional Solution
Reprinted for CTS/215337, Cognizant Technology Solutions Oracle Press, The McGraw Hill Companies, Inc. (c) 2010, Copying Prohibited
Page 6 / 39

Figure 7-7: Data-entry form in a web browser
Figure 7-8 shows the same data-entry form displayed in Microsoft Excel. In Excel, a companion line graph aids understanding of the relative differences among expenses.
Figure 7-8: Data-entry form in Microsoft Excel with line graph below
Creating Forms
You design data-entry forms in a wizard by selecting the columns, rows, and page headers. Data-entry forms are designed using family-related functions (like IDescendants) and variables (like CURRYEAR) to minimize the number of forms required, and for monthly and annual maintenance during the monthly forecasting and annual planning processes. For example, if you set the variable CURRYEAR to FY10 for this year, all annual planning data-entry forms for the current annual operating plan will reference the year FY10. Next year, you can set the CURRYEAR variable to FY11, and these same forms will now reference FY11 as the current planning year. This use of variables and functions minimizes the amount of maintenance required for the system. Figure 7-9 shows an example of the column and row options for a data-entry form.
Oracle Essbase & Oracle OLAP: The Guide to Oracle's Multidimensional Solution
Reprinted for CTS/215337, Cognizant Technology Solutions Oracle Press, The McGraw Hill Companies, Inc. (c) 2010, Copying Prohibited
Page 7 / 39

Figure 7-9: Data-entry form wizard
Using Forms
Planning includes various out-of-the-box data-entry features for entering and modeling data. End users can do the following with the data in a form:
n Enter data You can enter data directly into cells on a data-entry form. There are visual clues when data changes. When a cell has changed, the data-entry form marks the cell by changing the background of the cell to a darker yellow. After the data is committed to the application, the cell reverts to the original color. Figure 7-10 shows two data cells with changed values.
Figure 7-10: Data cells with changed values are indicated with a yellow fill.
n Spread data changes You can spread data from summary to base time periods automatically. For example, in Figure 7-11 a planner changes the year total of Office Supplies from 45,000 to 50,000. The difference is spread down to the month proportionately based on the values that were previously there.
Oracle Essbase & Oracle OLAP: The Guide to Oracle's Multidimensional Solution
Reprinted for CTS/215337, Cognizant Technology Solutions Oracle Press, The McGraw Hill Companies, Inc. (c) 2010, Copying Prohibited
Page 8 / 39

Figure 7-11: A change to a total value is reflected proportionally across its members.
n Increase and decrease values for members You can use the Adjust Data tool to increase or decrease data by a value or percentage. In Figure 7-12, a planner specifies a 5 percent decrease to Office Supplies Expenses.
Figure 7-12: Data for a member can be adjusted by user-defined values.
n Increase and decrease values for dimensions You also have the ability to adjust data for dimensions. A planner can adjust the data by various spread methods, such as proportional spreads based on prior year actual values. In Figure 7-13, a planner decreases overall sales units by 5 percent for the DVD product line. She specifies a relational spread for the FY10 Working Plan based on the proportional values found in the Final version of the Actual scenario for FY09.
Oracle Essbase & Oracle OLAP: The Guide to Oracle's Multidimensional Solution
Reprinted for CTS/215337, Cognizant Technology Solutions Oracle Press, The McGraw Hill Companies, Inc. (c) 2010, Copying Prohibited
Page 9 / 39

Figure 7-13: Data for a dimension can be adjusted and spread according to user-defined values.
n Execute predefined calculations You can execute business rules to perform predefined calculations on data. For example, planners can enter key revenue drivers, and when the data is saved, execute a business rule to derive revenue and cost of sales based on the driver inputs. Figure 7-14 shows the drivers (Units through Sales Allowance %) followed by the business rule calculated accounts (Operating Revenue to Gross Profit).
Figure 7-14: Drivers and calculated accounts in a business form
n Add comments and dates You can add text comments directly into a data form. For example, a planner may need to enter a description or justification for the addition of a capital expenditure. You can also add dates directly into a data form, such as when a capital item was acquired for the purposes of depreciation. In Figure 7-15, a planner has added comments about a company car, its purchase date, and the date that it went into service. He likely has (or will create) a business rule to depreciate the value of the car automatically based on the In Service date.
Oracle Essbase & Oracle OLAP: The Guide to Oracle's Multidimensional Solution
Reprinted for CTS/215337, Cognizant Technology Solutions Oracle Press, The McGraw Hill Companies, Inc. (c) 2010, Copying Prohibited
Page 10 / 39

Figure 7-15: Comments and important dates can be added to data.
n Add detail to line items You have the ability to add line-item detail for base accounts. For example, your application may have an account for Travel Expense, but the planner wants to enter each trip. By using the line-item detail feature, the planner can build up the detail to derive the total Travel amount. In Figure 7-16, a planner has decided to record the number of trips and the average cost per trip.
Figure 7-16: Planners can add detail to line items.
n Attach documents You can attach documents directly into a data form. For example, a planner may want to attach a copy of the funding document in PDF format for justification of the new capital expenditure, as shown in Figure 7-17.
Oracle Essbase & Oracle OLAP: The Guide to Oracle's Multidimensional Solution
Reprinted for CTS/215337, Cognizant Technology Solutions Oracle Press, The McGraw Hill Companies, Inc. (c) 2010, Copying Prohibited
Page 11 / 39
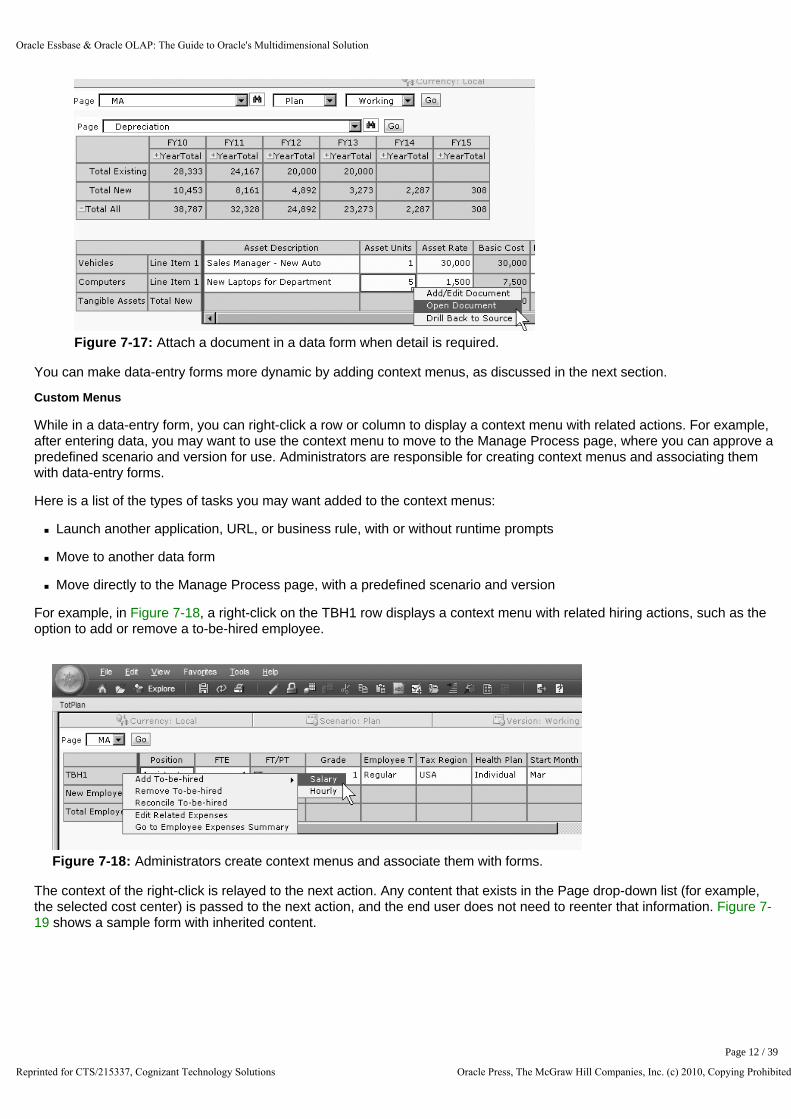
Figure 7-17: Attach a document in a data form when detail is required.
You can make data-entry forms more dynamic by adding context menus, as discussed in the next section.
Custom Menus
While in a data-entry form, you can right-click a row or column to display a context menu with related actions. For example, after entering data, you may want to use the context menu to move to the Manage Process page, where you can approve a predefined scenario and version for use. Administrators are responsible for creating context menus and associating them with data-entry forms.
Here is a list of the types of tasks you may want added to the context menus:
n Launch another application, URL, or business rule, with or without runtime prompts
n Move to another data form
n Move directly to the Manage Process page, with a predefined scenario and version
For example, in Figure 7-18, a right-click on the TBH1 row displays a context menu with related hiring actions, such as the option to add or remove a to-be-hired employee.
Figure 7-18: Administrators create context menus and associate them with forms.
The context of the right-click is relayed to the next action. Any content that exists in the Page drop-down list (for example, the selected cost center) is passed to the next action, and the end user does not need to reenter that information. Figure 7-19 shows a sample form with inherited content.
Oracle Essbase & Oracle OLAP: The Guide to Oracle's Multidimensional Solution
Reprinted for CTS/215337, Cognizant Technology Solutions Oracle Press, The McGraw Hill Companies, Inc. (c) 2010, Copying Prohibited
Page 12 / 39

Figure 7-19: Content is inherited from the page where the context menu action was initiated.
Process Management
Process management enables you track the progress of your budget, view status information, identify ownership, and change the budget status at any level within the organization. Process management reduces budget cycle time through these key characteristics:
n Approval process Preparers submit plans for approval and reviewers approve or decline submitted plans.
n Audit trail Includes built-in audit information through annotations and process status. For example, preparers and reviews collaborate by including comments, and the system maintains an audit trail of the status of the plan.
n E-mail notification E-mail notifications are sent when a status changes. For example, when a plan preparer submits a budget for approval, the reviewer receives an e-mail message stating that the plan is ready for review.
Task Lists
Task lists are a method of guiding users though the planning process. They provide a list of specific activities to complete within and outside the Oracle Enterprise Performance Management System. When an organization’s plan or forecast requires end users to perform multiple activities, some of which may be performed infrequently, task lists provide guidance in completing these activities. For example, Figure 7-20 shows a task list that includes five tasks: allocating top-down strategic targets, compiling and reviewing the revenue plan, preparing and reviewing financial statements, and submitting the plan for approval.
Oracle Essbase & Oracle OLAP: The Guide to Oracle's Multidimensional Solution
Reprinted for CTS/215337, Cognizant Technology Solutions Oracle Press, The McGraw Hill Companies, Inc. (c) 2010, Copying Prohibited
Page 13 / 39

Figure 7-20: Sample task list
Oracle Hyperion Profitability and Cost Management
Profitability and Cost Management is a packaged application that manages the cost and revenue allocations required to compute profitability for a business segment, such as a product, service, customer, region, or branch. The application provides a process that allows a business user to define allocation rules in business terms. The application translates these rules into underlying calculation scripts. By having a packaged application to create allocation definitions in business terms, business users are able to quickly create, deploy and maintain profitability and cost management solutions.
Before Profitability and Cost Management, it was common for business users to create complex Excel modules that linked a bunch of spreadsheets, and were difficult for other business users to decipher. Business users with access to Essbase would extend these Excel models by using the calculation functions within Essbase, but this usually required the assistance of an Essbase administrator to help write the complex calculations scripts required. While the combined Essbase/Excel solution was an improvement over Excel on its own, it did not provide business users with the flexibility to easily revise the allocation definitions to reflect changes in the business operations. Neither custom solution provided a user-friendly interface to define the profitability module or traceability of what was allocated and how it was allocated. Having a packaged solution for these tasks offers many benefits.
Building a Profitability and Cost Management Model
Profitability and Cost Management applications are referred to as models. A model represents part or all of an organization, and starts with costs and revenue values, often in a form similar to the organization’s chart of accounts. These initial financial values are transformed through one or more allocations to assign reasonable and defensible cost values to ultimate cost (or profitability) objects—products, services, customers, and so on.
Building a Profitability and Cost Management model follows these steps:
n Define stages Define the number of cost or revenue transformations within an allocation process.
n Create drivers Define the methods used to calculate how source values are allocated to their destinations within a stage.
n Select drivers Choose which driver methods will be used by which source costs or revenues.
n Make assignments Map source cost and revenues to destinations.
n Collect data Use any number of existing utilities to load cost, revenue and driver data into the application’s database (Essbase) or manually enter data through the Profitability and Cost Management data-entry forms.
The following sections detail each of these steps.
Defining Stages
Stages represent the network of allocations within your organization. They enable you to create allocations that require multiple steps by defining a calculation sequence. The allocation result calculated and stored in a prior stage becomes the source value to be allocated in the following stages. You can define up to nine stages in your model. For example, total labor costs for the department collected in stage 1 are allocated to the activities performed by each department in stage 2. The total for each activity, in turn, can act as a source value to be allocated in a subsequent stage. Stages can be skipped when certain costs do need to reflect that stage’s specific transformation. For example, raw material costs collected in stage 1 can be allocated directly to the products in stage 3. Figure 7-21 shows five stages.
Oracle Essbase & Oracle OLAP: The Guide to Oracle's Multidimensional Solution
Reprinted for CTS/215337, Cognizant Technology Solutions Oracle Press, The McGraw Hill Companies, Inc. (c) 2010, Copying Prohibited
Page 14 / 39

Figure 7-21: Defining stages
The overall process for transforming costs from stage to stage is that source costs from one stage will be assigned to destination costs in subsequent stages, using a mathematical method (a driver). The resulting model is a series of “source to destination using a driver” relationships. After the stages are defined, the business user will define the required drivers, identify which sources will use which drivers, and define the source-to-destination assignments.
Defining and Selecting Drivers
Drivers provide formulas for allocating the source intersections values to the destination intersections. For example, the wages for the manufacturing department could be split among the different activities based on the number of hours consumed by each activity. Profitability and Cost Management enables you to create an unlimited number of drivers. When you create a driver, you can select from predefined formulas, such as even split, or you can create custom formulas. In Figure 7-22, drivers have been created for even split, headcount, number of application users, and so on.
Figure 7-22: Defining drivers
After drivers have been defined, the business users assign the drivers to applicable source members for each stage. For example, in Figure 7-23, the activity of invoicing by the finance department is to be assigned based on the number of invoices created.
Oracle Essbase & Oracle OLAP: The Guide to Oracle's Multidimensional Solution
Reprinted for CTS/215337, Cognizant Technology Solutions Oracle Press, The McGraw Hill Companies, Inc. (c) 2010, Copying Prohibited
Page 15 / 39

Figure 7-23: Selecting drivers
Making Assignments
Assignments represent the links between data in stages. For each intersection of dimension members within a stage that contains source data, you assign downstream destinations. The destinations can be within the same stage as the source intersections. This assignment is called an intrastage assignment. Intrastage assignments can be reciprocal. For example, the HR department could have the IT department as an assignment, and the IT department could have HR as an assignment. Dimension intersections in later stages cannot have assignments in earlier stages. Figure 7-24 shows an assignment example that shows that corporate rent will be distributed to 45 department-activities based on a square footage driver.
Figure 7-24: Making assignments
After all assignments are made, it is time to collect data.
Collecting Data
You can import cost, revenue, and driver data into the underlying Essbase database by using Essbase load rules, Smart View, or ODI. After loading data into your model, you use the Data Entry window to verify the data, as shown in Figure 7-
Oracle Essbase & Oracle OLAP: The Guide to Oracle's Multidimensional Solution
Reprinted for CTS/215337, Cognizant Technology Solutions Oracle Press, The McGraw Hill Companies, Inc. (c) 2010, Copying Prohibited
Page 16 / 39

25. You can edit data or add missing data in this window, if necessary. The Data Entry window has separate tabs for Stage Data and Driver Data. On the Stage Data tab, you can view cost, revenue, or driver data for a selected stage and selected measures. You can save your measure selections as a view that you can reuse.
Figure 7-25: Manually collecting data
After all data has been collected, you can validate the model.
Validating Model
The model is verified against model validation rules to ensure the structure is sound before adding data. The structure validation checks to help ensure these criteria are correct:
n You assigned a driver to each dimension intersection that is assigned destination members.
n You assigned destination members to all dimension intersections to which a driver is assigned.
n Intrastage assignments are correct.
n Reciprocal assignments are correctly defined.
After the model is calculated, you can use built-in features to help validate the correctness of these calculations. Figure 7-26 shows the Stage Balancing report, which illustrates the high-level flow of costs across the stages. It will provide the user with a quick recap of the flow of costs and highlight where the allocations may need further work.
Oracle Essbase & Oracle OLAP: The Guide to Oracle's Multidimensional Solution
Reprinted for CTS/215337, Cognizant Technology Solutions Oracle Press, The McGraw Hill Companies, Inc. (c) 2010, Copying Prohibited
Page 17 / 39

Figure 7-26: Validating the model
Tracing Allocations
A trace allocation report, such as the one shown in Figure 7-27, provides a graphical representation that enables you to trace allocations throughout the model. For a selected member intersection in a stage, the report lets you move backward or forward through the model. You can move backward from the intersection to view the source members that contributed to the value for the intersection and the amount that each contributed. You can move forward to view the destination members to which the value for the intersection was allocated and how much was allocated to each member.
Figure 7-27: Tracing an allocation
Oracle Hyperion Enterprise Performance Management Architect
Performance Management Architect offers a centralized interface where administrators can manage, create, and deploy
Oracle Essbase & Oracle OLAP: The Guide to Oracle's Multidimensional Solution
Reprinted for CTS/215337, Cognizant Technology Solutions Oracle Press, The McGraw Hill Companies, Inc. (c) 2010, Copying Prohibited
Page 18 / 39

Oracle Hyperion applications. Eligible products include applications for the Fusion Editions of Planning, Profitability and Cost Management, as well as Oracle Hyperion Financial Management and custom Essbase cubes.
Performance Management Architect enables administrators to perform the following tasks:
n Visually link and manage applications.
n Use dimensions and attributes across multiple applications. (For example, you can create one account dimension and use it in multiple applications.) Performance Management Architect leverages existing applications and dimensionality to spin off other applications with previously constructed dimensions.
n Graphically manage data flows.
n Perform impact analysis—graphically view and model relationships across applications.
n Handle and evaluate the impact of exceptions and changes to all models.
n Eliminate manual dimensional and data reconciliation between applications.
Performance Management Architect has four main components for performing these tasks: a dimension library, dimension mapping, data synchronizer, and the application library. Figure 7-28 shows the interfaces for each of the components.
Figure 7-28: Interfaces for the components of Performance Management Architect
Architecture of Performance Management Applications
Planning and Profitability and Cost Management are multitiered, web-based applications. Figure 7-29 breaks down the products into their required components.
Oracle Essbase & Oracle OLAP: The Guide to Oracle's Multidimensional Solution
Reprinted for CTS/215337, Cognizant Technology Solutions Oracle Press, The McGraw Hill Companies, Inc. (c) 2010, Copying Prohibited
Page 19 / 39
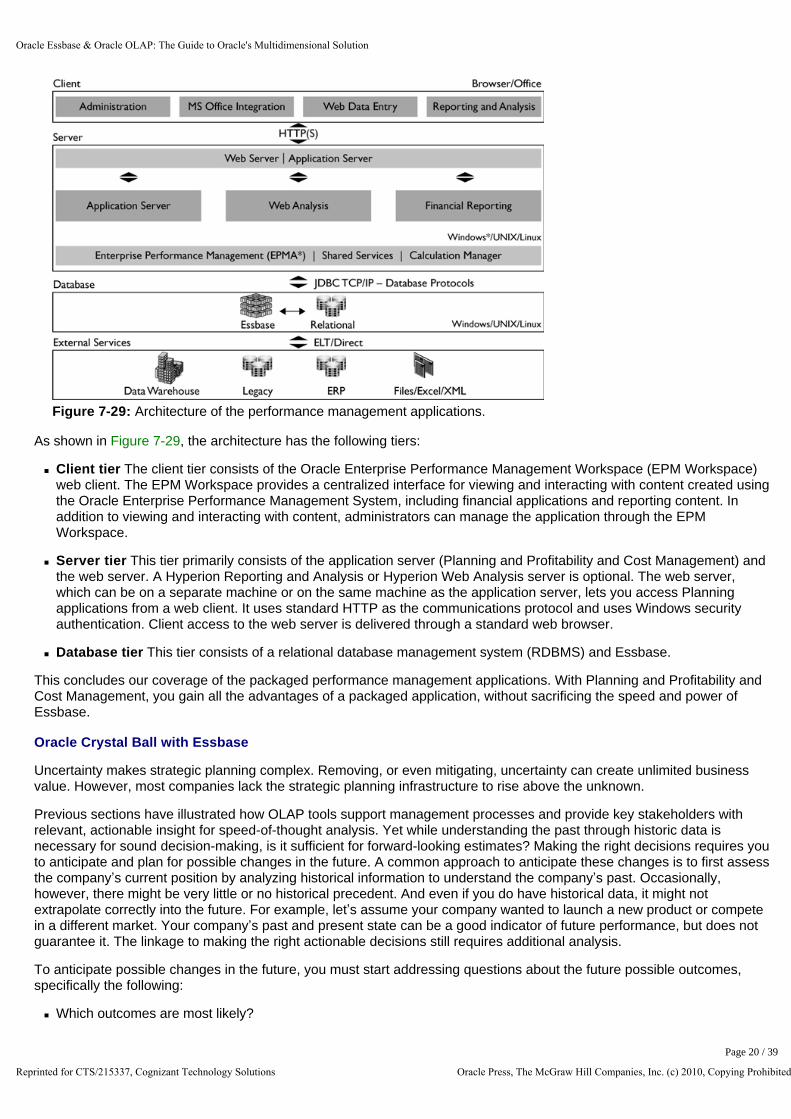
Figure 7-29: Architecture of the performance management applications.
As shown in Figure 7-29, the architecture has the following tiers:
n Client tier The client tier consists of the Oracle Enterprise Performance Management Workspace (EPM Workspace) web client. The EPM Workspace provides a centralized interface for viewing and interacting with content created using the Oracle Enterprise Performance Management System, including financial applications and reporting content. In addition to viewing and interacting with content, administrators can manage the application through the EPM Workspace.
n Server tier This tier primarily consists of the application server (Planning and Profitability and Cost Management) and the web server. A Hyperion Reporting and Analysis or Hyperion Web Analysis server is optional. The web server, which can be on a separate machine or on the same machine as the application server, lets you access Planning applications from a web client. It uses standard HTTP as the communications protocol and uses Windows security authentication. Client access to the web server is delivered through a standard web browser.
n Database tier This tier consists of a relational database management system (RDBMS) and Essbase.
This concludes our coverage of the packaged performance management applications. With Planning and Profitability and Cost Management, you gain all the advantages of a packaged application, without sacrificing the speed and power of Essbase.
Oracle Crystal Ball with Essbase
Uncertainty makes strategic planning complex. Removing, or even mitigating, uncertainty can create unlimited business value. However, most companies lack the strategic planning infrastructure to rise above the unknown.
Previous sections have illustrated how OLAP tools support management processes and provide key stakeholders with relevant, actionable insight for speed-of-thought analysis. Yet while understanding the past through historic data is necessary for sound decision-making, is it sufficient for forward-looking estimates? Making the right decisions requires you to anticipate and plan for possible changes in the future. A common approach to anticipate these changes is to first assess the company’s current position by analyzing historical information to understand the company’s past. Occasionally, however, there might be very little or no historical precedent. And even if you do have historical data, it might not extrapolate correctly into the future. For example, let’s assume your company wanted to launch a new product or compete in a different market. Your company’s past and present state can be a good indicator of future performance, but does not guarantee it. The linkage to making the right actionable decisions still requires additional analysis.
To anticipate possible changes in the future, you must start addressing questions about the future possible outcomes, specifically the following:
n Which outcomes are most likely?
Oracle Essbase & Oracle OLAP: The Guide to Oracle's Multidimensional Solution
Reprinted for CTS/215337, Cognizant Technology Solutions Oracle Press, The McGraw Hill Companies, Inc. (c) 2010, Copying Prohibited
Page 20 / 39

n What are the key risk drivers for those outcomes?
To answer these questions and plan for the right decisions, you must first ascertain the potential range of future results and the probability of different outcomes actually occurring. This type of analysis generally tends to be a limited exercise, concentrating on three common scenarios: best case, worst case, and something in between. Typically worked up in a spreadsheet, these scenarios tend to flex one or two inputs (assumptions) at a time and provide little insight into probable outcomes or drivers, which in the real world; reflect the collective influence of many variables (good and bad) coming together at the same time. Powerful applications such as Planning can use OLAP data to generate and store multiple scenarios, but the process remains slow and manual.
Fortunately, solutions such as Crystal Ball extend traditional OLAP capabilities to help organizations overcome uncertainty and achieve results. Excel-based, Crystal Ball can be used as a stand-alone desktop tool or integrated with Oracle’s OLAP technology. Using the tools of predictive modeling, simulation, and optimization, Crystal Ball gives you insight into the critical factors affecting risk, and calculates the likelihood that you will reach your objectives under even the most uncertain conditions.
Crystal Ball and Monte Carlo Simulation Methods
Monte Carlo simulation, founded upon stochastic analysis, offers the ability to quickly create thousands of what-if scenarios. The ability of Monte Carlo modeling to reflect all outcomes—particularly those dismissed as too unlikely to consider—makes it an objective and vital resource for assessing risk and the effects of uncertainty. These results give the user not only a comprehensive, realistic picture of future possibilities, but also their associated probabilities.
As an example, a company attempting to calculate a certain metric, such as earnings per share for the upcoming quarter, would first input data for various parameters. It would then run an algorithm that uses these inputs to generate outputs of interest, including earnings per share. Monte Carlo simulation is crucial when the exact values for input parameters are unknown or uncertain.
Crystal Ball, using Monte Carlo methods, accommodates uncertainty by allowing the user to define ranges of values (probability distributions) for variable inputs. The program then chooses a value for each assumption according to the given range, and repeats this process as many times as needed—even into the thousands. The result is a rank-ordered list of outcomes from which statistics are calculated. Because values are chosen randomly and the process is repeated many times, the output is statistically significant—a major improvement over a handful of subjective scenarios. Figure 7-30 shows how the output of the simulation would be thousands of values (scenarios) for earnings per share, from which the user could understand the likelihood of, for instance, meeting or exceeding some target value.
Figure 7-30: Crystal Ball generates a full range of outcomes with associated probabilities.
Crystal Ball, using Monte Carlo simulation, calculates the probability of achieving any given strategic goal and offers the ability to develop plans that reflect realistic risk and reward. Monte Carlo simulation helps decision makers think about investment and long-term planning, for instance, as a continuum of probabilities rather than a certainty. Therefore, they grow accustomed to responding to change, rather than hoping it will not happen.
Crystal Ball Analysis
Oracle Essbase & Oracle OLAP: The Guide to Oracle's Multidimensional Solution
Reprinted for CTS/215337, Cognizant Technology Solutions Oracle Press, The McGraw Hill Companies, Inc. (c) 2010, Copying Prohibited
Page 21 / 39

Four steps are involved in a Crystal Ball analysis:
n Develop a model of the problem.
n Assign ranges of values to the inputs.
n Calculate the ranges/probabilities of the outputs.
n Analyze and share results.
This section uses the example of a healthcare provider estimating patient revenues to illustrate the workflow of building a Crystal Ball analysis.
Developing a Model of the Problem
Essbase and Excel are both excellent general-purpose, model-building platforms. In the context of integrating Crystal Ball with OLAP technology, we will use an example that takes advantage of the strengths of each tool. Sharing traditional spreadsheet models in an enterprise environment is difficult at best. Broken links, cryptic formulas, and inconsistent application of business rules are just a few of the problems. In Figure 7-31, an Essbase application has been created that defines the relationships (business rules) between inputs in order to calculate reimbursement revenue. Throughout our analysis, our model will remain consistent and secure.
Figure 7-31: Essbase cube calculating net patient revenue based on a variety of inputs
Assigning Ranges of Values to the Inputs
The next step in the modeling process is to assign ranges of values to uncertain inputs. With Smart View, you can access data from a variety of Oracle products for OLAP, such as Essbase and Planning, and bring that data into Excel for further analysis. This OLAP data can be examined either independently using the forecasting tools of Crystal Ball or linked into existing Crystal Ball simulation and optimization models.
In Figure 7-32, we have opened an ad hoc query of our Essbase application using Smart View.
Oracle Essbase & Oracle OLAP: The Guide to Oracle's Multidimensional Solution
Reprinted for CTS/215337, Cognizant Technology Solutions Oracle Press, The McGraw Hill Companies, Inc. (c) 2010, Copying Prohibited
Page 22 / 39

Figure 7-32: Crystal Ball assumption created on top of a Smart View ad hoc query
We are now ready to apply Crystal Ball. We select a cell containing one of the uncertain inputs (Crystal Ball assumptions). For example, Figure 7-33 shows a selected cell representing the Occupancy % Input for January in the Forecast scenario. Clicking the Define Assumption button on the Crystal Ball ribbon opens a gallery of distributions from which to choose, as shown in Figure 7-34. From the gallery, you can select a distribution type and open a dialog box in which you can specify the parameters, as shown in Figure 7-35.
Figure 7-33: Select a cell where uncertainty or variability exists.
Figure 7-34: Choose Define Assumption from the Crystal Ball ribbon.
Figure 7-35: Crystal Ball distribution gallery (left) and associated parameters dialog box (right)
Crystal Ball offers a great deal of flexibility in assigning distributions, or ranges, to inputs. If there is sufficient historic data,
Oracle Essbase & Oracle OLAP: The Guide to Oracle's Multidimensional Solution
Reprinted for CTS/215337, Cognizant Technology Solutions Oracle Press, The McGraw Hill Companies, Inc. (c) 2010, Copying Prohibited
Page 23 / 39

the user can fit a probability distribution to those values. Range definitions are also available for cases where limited data exist, or where expert opinion might be more appropriate.
In our example, the planner estimates a minimum (0.4), most likely (0.65), and maximum (0.75) value for Occupancy based on expert opinion, and enters these estimates as parameters for the Triangular distribution. Ranges are assigned for the rest of the uncertain inputs in the forecast scenario, and the outputs (Crystal Ball forecasts)—or values targeted for analysis—are identified. By default, assumptions are assigned a green background, and forecasts are assigned a blue background. In this case, we are interested in the Net Patient Revenue for each month as well as Qtr1. The model is now ready to run. Figure 7-36 shows the output.
Figure 7-36: Crystal Ball model with outputs and uncertain variables defined.
Calculating the Ranges/Probabilities of the Outputs
Running the model generates 500 what-if scenarios (the number of scenarios can be defined by the user). For each trial, a new value within the defined range is selected for each assumption. These values are submitted back to Essbase, where the Essbase database is recalculated according to the business rules. New results for the outputs are then refreshed in Excel and stored by Crystal Ball for analysis. The histograms in Figures 7-37 and 7-38 represent the range and likelihood of the outcomes for net patient revenue. The higher the bar, the more outcomes were observed in the given range. The boxes at the bottom of the forecast chart can be used to evaluate the certainty of any range of values.
Oracle Essbase & Oracle OLAP: The Guide to Oracle's Multidimensional Solution
Reprinted for CTS/215337, Cognizant Technology Solutions Oracle Press, The McGraw Hill Companies, Inc. (c) 2010, Copying Prohibited
Page 24 / 39

Figure 7-37: The likelihood of exceeding the baseline estimate for net revenue is only about 30%.
Figure 7-38: A value of $6.65 M provides 80% certainty—a more confident forecast!
Analyzing and Sharing Results
The chart in Figure 7-37 shows the likelihood of exceeding the baseline estimate of $7.28 million, which is only about 30 percent. We would like to be more confident in our forecast. The chart in Figure 7-38 shows the same forecast, but now identifies that a value of $6.65 million gives 80 percent certainty, which is a more realistic estimate. Note that key metrics such as mean, 80 percent, and 20 percent confidence levels are members of the Essbase application. Once the simulation is complete, these values are extracted by Crystal Ball and stored in Essbase, giving more meaningful insight to the outcomes used in the Forecast scenario.
The forecast charts answered the question about which outcomes are most likely. A Crystal Ball sensitivity chart identifies which inputs are most significant. It is much more realistic than a tornado chart, because it varies all of the assumptions simultaneously, and each assumption varies according to its own distribution. Figure 7-39 illustrates that the uncertainty around occupancy contributes most to the variability in net revenue. Any “where to focus” discussions for reducing uncertainty and improving forecast accuracy should begin with the sensitivity chart.
Oracle Essbase & Oracle OLAP: The Guide to Oracle's Multidimensional Solution
Reprinted for CTS/215337, Cognizant Technology Solutions Oracle Press, The McGraw Hill Companies, Inc. (c) 2010, Copying Prohibited
Page 25 / 39

Figure 7-39: Uncertainty around occupancy has the highest impact on net revenue.
In addition to integrating Crystal Ball results directly into OLAP applications, as illustrated in this example, EPM Workspace enables secure sharing of Crystal Ball workbooks and analysis across the enterprise.
Crystal Ball with Planning Models
Crystal Ball is also a great extension for Planning models. For example, you can apply Crystal Ball to historic sales data and create future sales predictions by analyzing the levels, trends, and cycles within your data through time-series forecasting and regression methods. These predictions can act as inputs to financial models, which can be simulated and optimized to increase the probability of making your forecasts and reduce the potentials risks in planning assumptions.
Postanalysis of the forecast results can be saved back into your Planning model as scenarios and forecasts. The result is a more accurate forecast with increased confidence.
Crystal Ball Decision Optimizer
Crystal Ball Decision Optimizer adds optimization and substantial processing speed to the power of Monte Carlo simulation. With Decision Optimizer, you can automatically search for your optimal solution to business, finance, and operational spreadsheet models.
Decision Optimizer is easy to use. A wizard guides you through the process of specifying your objectives and defining your constraints and requirements. After you define the optimization parameters, Decision Optimizer quickly pinpoints the set of inputs that best meet your goals, and transfers this to your spreadsheet model. Examples of optimization include finding the asset allocation that maximizes return for a given level of risk, or choosing staffing levels that minimize cost while maintaining required service levels.
This concludes our discussion of Crystal Ball. With this flexible, integrated tool, you can solve problems in which uncertainty and variability have traditionally distorted forecasts and make better decisions to impact the bottom line.
Oracle Smart Space with Essbase
Smart Space, Fusion Edition is a way for people to connect to the whole of the Oracle Business Intelligence Suite Enterprise Edition (OBIEE) stack. It provides direct connectivity to the EPM Workspace (and so to Web Analysis and Financial Reporting documents), OBIEE, and Oracle BI Publisher. Smart Space also provides Essbase developers and administrators easy access to calculations, load rules, and even the status of cubes.
Rather than needing to go to each of the documents of interest, users of Smart Space have the documents come to them! Smart Space uses gadget technology to serve appropriate content directly to the user.
Smart Space is always on, so when you log in to your Windows-based computer, Smart Space automatically connects and
Oracle Essbase & Oracle OLAP: The Guide to Oracle's Multidimensional Solution
Reprinted for CTS/215337, Cognizant Technology Solutions Oracle Press, The McGraw Hill Companies, Inc. (c) 2010, Copying Prohibited
Page 26 / 39

shows you what is most interesting to you. Figure 7-40 shows a sample Smart Space desktop.
Figure 7-40: Smart Space gadgets on a desktop
Smart Space Desktops
The core of the user interface is the Smart Space desktop. The desktop allows you to personalize your installation by installing only those gadgets that are relevant to you. In addition, you can have many different desktops, to represent different functions or working practices. For example, the set of gadgets and the list of favorite reports that you use may differ during the month—during the close cycle, you may want access to all your statutory reports, but then during a budget reforecast cycle, you may need access to information from your Planning system. By having multiple desktops, you can avoid information overload during key cycles.
You can create, edit, and select desktops using the Smart Space Palette. In Figure 7-41, the current desktop is highlighted, and the default desktop is marked with an asterisk (*). You can add gadgets to the current desktop simply by dragging them from the palette.
Note A common misconception is that Smart Space requires Microsoft Windows Vista. This probably came about because Smart Space was used by Microsoft to show off its gadget technology on the original Vista road show in North America. However, Smart Space also works on Windows XP and Windows 2003.
Oracle Essbase & Oracle OLAP: The Guide to Oracle's Multidimensional Solution
Reprinted for CTS/215337, Cognizant Technology Solutions Oracle Press, The McGraw Hill Companies, Inc. (c) 2010, Copying Prohibited
Page 27 / 39

Figure 7-41: Managing desktops with the Smart Space Palette
Smart Space Gadgets
Oracle supplies a set of standard gadgets with Smart Space. Any number of these gadgets may be flagged as Recommended by the administrator, which means that they will be installed by default. The following are the standard gadgets:
n Collaboration The Collaboration gadget allows secure, audited discussions to take place around Oracle Enterprise Performance Management System and OBIEE Plus content using instant messaging technology. Any Smart Space content can be shared within a Collaboration discussion (one to one) or meeting (many users), to ensure that everyone has the same information. For example, let’s say that you initiate a conversation with a colleague, Frank, about the Net Revenue Details report. As you can see from Figure 7-42, Frank can open the report directly from the discussion window, ensuring that you are both looking at the same version of the numbers.
Figure 7-42: Open documents directly from the Collaboration gadget.
n Key Contacts The Key Contacts gadget allows easy communication with your most common contacts. You can see the instant messaging status of your contacts and use the gadget to start a Collaboration discussion or meeting. Figure 7-43 shows how the contacts and their status are displayed.
Oracle Essbase & Oracle OLAP: The Guide to Oracle's Multidimensional Solution
Reprinted for CTS/215337, Cognizant Technology Solutions Oracle Press, The McGraw Hill Companies, Inc. (c) 2010, Copying Prohibited
Page 28 / 39

Figure 7-43: Keep your contacts list handy using the Key Contacts gadget.
n Notification The Notification gadget records a history of alerts that have been received. When an alert is triggered, a message is displayed immediately, and the alert is logged in the Notification gadget, as shown in Figure 7-44.
Figure 7-44: An alert message is displayed and logged in the Notification gadget.
n Smart Book The Smart Book gadget allows for a selection of Oracle reporting and analysis documents or URLs to be available directly on a user’s desktop. Figure 7-45 shows how any reporting documents you add can be (optionally) displayed as a live preview in a preview panel. A selected document can be viewed fully within the Smart Book gadget. Additionally, you can open the item in the EPM Workspace or use it to initiate a discussion through the Collaboration gadget.
Figure 7-45: A report displayed in the Smart Book gadget
n Favorites The Favorites gadget contains a user-defined list of shortcuts to any web-based tool (via a URL) or Smart Space content. Figure 7-46 shows a sample Favorites gadget. The shortcuts can be organized into a folder structure to ease navigation. You can have a different set of favorites within each of your desktops.
Oracle Essbase & Oracle OLAP: The Guide to Oracle's Multidimensional Solution
Reprinted for CTS/215337, Cognizant Technology Solutions Oracle Press, The McGraw Hill Companies, Inc. (c) 2010, Copying Prohibited
Page 29 / 39
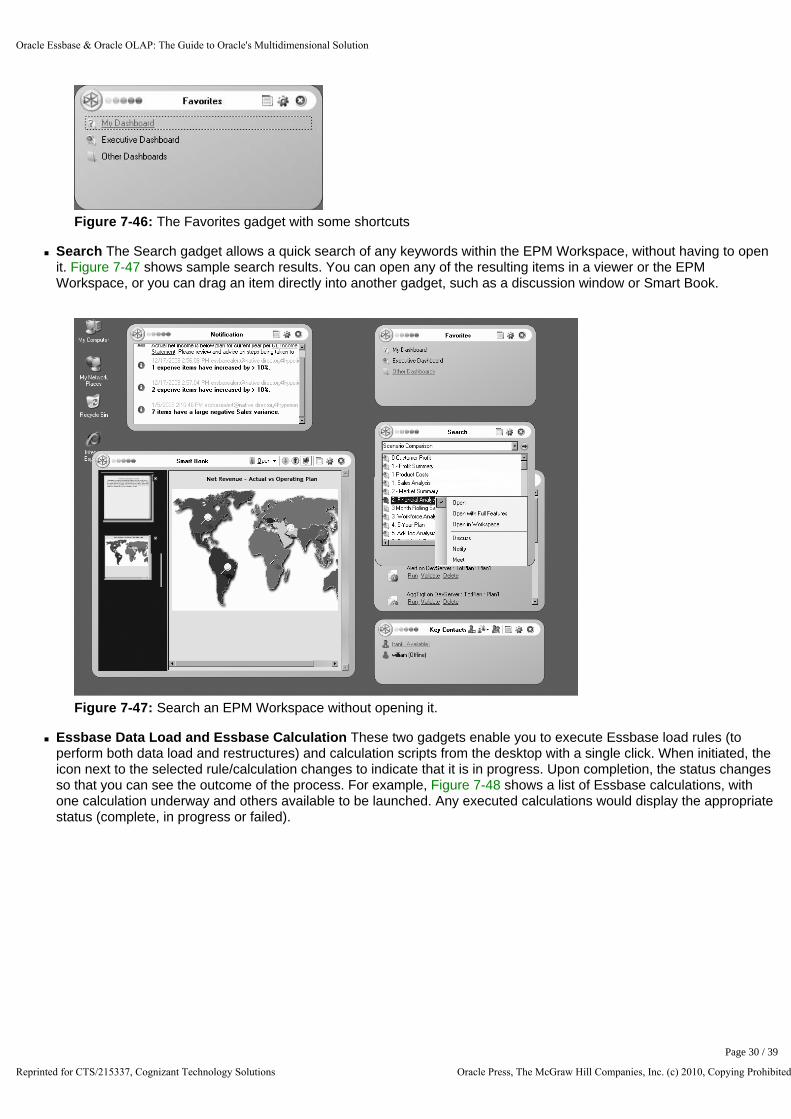
Figure 7-46: The Favorites gadget with some shortcuts
n Search The Search gadget allows a quick search of any keywords within the EPM Workspace, without having to open it. Figure 7-47 shows sample search results. You can open any of the resulting items in a viewer or the EPM Workspace, or you can drag an item directly into another gadget, such as a discussion window or Smart Book.
Figure 7-47: Search an EPM Workspace without opening it.
n Essbase Data Load and Essbase Calculation These two gadgets enable you to execute Essbase load rules (to perform both data load and restructures) and calculation scripts from the desktop with a single click. When initiated, the icon next to the selected rule/calculation changes to indicate that it is in progress. Upon completion, the status changes so that you can see the outcome of the process. For example, Figure 7-48 shows a list of Essbase calculations, with one calculation underway and others available to be launched. Any executed calculations would display the appropriate status (complete, in progress or failed).
Oracle Essbase & Oracle OLAP: The Guide to Oracle's Multidimensional Solution
Reprinted for CTS/215337, Cognizant Technology Solutions Oracle Press, The McGraw Hill Companies, Inc. (c) 2010, Copying Prohibited
Page 30 / 39

Figure 7-48: Run Essbase calculations with the Essbase Calculation gadget.
In addition to the standard gadgets, Smart Space also makes content available directly from Windows Explorer. Similar to the Search gadget, you can navigate all of the EPM Workspace, OBIEE Plus, and BI Interactive Dashboards content, to view locally, discuss, add to other gadgets, or launch into the EPM Workspace. Figure 7-49 shows how a new folder, called Smart Space Content, is added to Windows Explorer to allow access to the different sources.
Figure 7-49: Windows Explorer with the Smart Space Content folder displayed
Software Development Kit
Smart Space is designed to be an open, extendable solution to enable partners and customers to create and publish their own gadgets. The Smart Space Development Kit provides a software development toolkit (SDK) designed for use with Microsoft Visual Studio 2005.
The SDK offers a full range of functionality, including the following features:
n Gadget user interface for modifying a gadget’s user interface
n Security Services for using the user’s single sign-on token to launch content
n Catalog and repository access for listing, administering, and launching documents from OBIEE Plus catalogs and
Oracle Essbase & Oracle OLAP: The Guide to Oracle's Multidimensional Solution
Reprinted for CTS/215337, Cognizant Technology Solutions Oracle Press, The McGraw Hill Companies, Inc. (c) 2010, Copying Prohibited
Page 31 / 39

repositories
n Collaboration Services for using the Collaboration gadget, including the ability to programmatically send notifications to users from external applications via .NET or Java, and through a web service
The SDK enables you to implement the standard gadgets in ways that suit your business needs. For example, the Notification section in Figure 7-43 (shown earlier) shows an alert message about negative sales variance coming from Essbase. To communicate this information to the appropriate people, a developer created a Java function that calls the SDK’s Collaboration Services. The Essbase script that calculates the sales variance was then modified to call the Java function whenever certain conditions were met—in this case, a negative variance.
Developers can also create custom gadgets. The developer of the gadget deploys it using the Smart Space Administration Utility, and your users can then include the custom gadget on their Smart Space desktops. Various Oracle partners have created custom gadgets and deployed them at customer sites. Examples of custom gadgets are the Outline Browser gadget from Applied OLAP and the Cube Freshness gadget from Kerdock.
As you have seen, Smart Space gadgets serve appropriate content directly to the users on their desktop. The Essbase gadgets make it easy to run and monitor calculations scripts and load data, and custom gadgets can be created to manage other Essbase tasks.
Oracle Application Express for Oracle OLAP
Oracle Application Express (APEX) is a web-based application development and deployment tool that comes with the Oracle Database. Developers can use it to create reliable, secure, and easy-to-maintain web applications. The built-in wizards and functionality make it possible to build applications rapidly using relational and Oracle OLAP data. Since the Oracle OLAP data can be represented as SQL views, it is now easier than ever to report on the Oracle OLAP data. By using conditions on the SQL queries, it is possible to return data without the need to use aggregation functions. This greatly increases the performance of querying and retrieving data.
How is this all done? The Oracle OLAP views represent a traditional star schema, where the fact table is represented by the cube view, and the dimension views represent the dimension tables. The data in the cube view represents the data at all levels for all dimensions. So by adding conditions to the WHERE clause to include the level name of the required data, you can retrieve summary data without the time-consuming GROUP BY clause.
APEX allows you to specify these WHERE conditions as drill parameters, so that as you drill down the dimensions, the correct summary data is retrieved from the cube view. This is all done by constructing a parameterized SQL statement. Figure 7-50 shows a query from the Oracle OLAP views that will be used in APEX.
Oracle Essbase & Oracle OLAP: The Guide to Oracle's Multidimensional Solution
Reprinted for CTS/215337, Cognizant Technology Solutions Oracle Press, The McGraw Hill Companies, Inc. (c) 2010, Copying Prohibited
Page 32 / 39

Figure 7-50: SQL query to be used in APEX
This query is pasted into APEX and used as the primary query for a sales report. Figure 7-51 shows the main query entry window in APEX.
Figure 7-51: APEX report query definition window
Now you can set up the parameters and construct the report based on the query. You can even define stoplight and alert formatting to enhance the report outputs. An example report using this data is shown in Figure 7-52.
Oracle Essbase & Oracle OLAP: The Guide to Oracle's Multidimensional Solution
Reprinted for CTS/215337, Cognizant Technology Solutions Oracle Press, The McGraw Hill Companies, Inc. (c) 2010, Copying Prohibited
Page 33 / 39

Figure 7-52: Sample APEX report
Drilling up and down the dimensions is fully supported. APEX also supports graphing of the data. Each task requires little more than creating a simple SQL statement and following an APEX wizard to create a very usable Oracle OLAP-based report.
The types of reports and dashboards that can be created from APEX are not as diverse as those produced by OBIEE, but they are still very comprehensive and plentiful. In addition, the skill level requirement is relatively low, and the price is considerably less.
Java Development
Oracle offers Java APIs for both Oracle OLAP and Oracle Essbase. These APIs are public, which means that anyone can develop a custom application to work with one of Oracle’s OLAP engines.
Using Oracle BI Beans with Oracle OLAP
Oracle Business Intelligence Beans (BI Beans) is a set of standards-based JavaBeans that provides analysis-aware application building blocks designed for Oracle OLAP. Using Oracle JDeveloper 10g and BI Beans, you can build Internet applications quickly and easily. These applications can expose the advanced analytic features of the Oracle Database to both casual information viewers and high-end users who require complete ad hoc query and analysis functionality. The BI Beans components are included in the current 10g version of JDeveloper, but they can also be downloaded separately. BI Beans fall into three categories: presentation, OLAP, and catalog services.
By using BI Beans, application developers can leverage the Oracle technology stack and exploit the advanced analytic features of Oracle OLAP. Using JDeveloper as the integrated development environment (IDE) for BI applications increases application developer productivity.
With Oracle BI Beans, you can do the following:
n Create boardroom-quality presentations.
n Leverage advanced analytics of Oracle OLAP.
n Support collaboration across the enterprise.
Note Oracle is no longer supporting BI Beans in JDeveloper 11g. While it is possible to use the version 11g OLAP API libraries to access the Oracle OLAP 11g data, the process is not currently certified. This does not prevent the continued use of BI Beans to develop Java applications. In the future, it is anticipated that solutions will be provided to use the JDeveloper ADF components to access Oracle OLAP.
Oracle Essbase & Oracle OLAP: The Guide to Oracle's Multidimensional Solution
Reprinted for CTS/215337, Cognizant Technology Solutions Oracle Press, The McGraw Hill Companies, Inc. (c) 2010, Copying Prohibited
Page 34 / 39

n Rapidly develop BI applications for the Web.
Presentation Beans
When building BI applications, the key piece is the data. The data needs to be presented in such a way that it is easy to identify positive or negative trends. In addition, data presentations are typically created for review by senior management. Presentations need to be easy to build, so any level user within an organization can produce the high-quality reports that senior management expects.
The presentation beans have been through extensive usability testing and are used by other Oracle development groups for products like Oracle Discoverer, Oracle Reports, BI Publisher, and BI Spreadsheet Add-in. For the end user, this provides a consistent look and feel across Oracle products, thus lowering the learning curve as new applications are introduced.
BI Beans provides three flexible data-aware presentation components: graph, crosstab, and table. There is a graph for every occasion, and more than 70 graph types are included with BI Beans. Each graph has hundreds of properties for customizing the graph to give the exact look that you require. User-interface components are provided to make formatting graphs easy. For example, a Graph Type panel, shown in Figure 7-53, is available for end users to change the type of graph they are currently viewing. The graph has full analytic support as well, which includes drilling, changing the layout, and providing data tips.
Figure 7-53: The Graph Type panel allows users to change the graph type.
The BI Beans table provides a row-oriented view of data, typically used by those who are familiar with relational databases. The crosstab component offers a multidimensional view of data and provides services such as drilling and pivoting. Both table and crosstab components provide page-item-filtering capabilities.
Tables and crosstabs have rich formatting capabilities, down to the cell level. For example, data-driven formatting allows users to highlight data by setting foreground and background colors based on data values within cells. Presentations are completely customizable, down to the details of hiding or showing gridlines, showing titles, and formatting labels.
Not only do application developers have complete control of the look and feel of crosstabs and tables programmatically though the APIs, but BI Beans also present user-interface components for customizing a presentation. Easy-to-use interfaces are available for defining data-driven formatting, and a toolbar gives quick access to commonly used formatting options.
Java and HTML Clients
Oracle Essbase & Oracle OLAP: The Guide to Oracle's Multidimensional Solution
Reprinted for CTS/215337, Cognizant Technology Solutions Oracle Press, The McGraw Hill Companies, Inc. (c) 2010, Copying Prohibited
Page 35 / 39

Depending on the nature and requirements of the application, BI Beans data presentations may be Java-based or HTML-based. This gives developers the option of providing intranet-based users, who have high-bandwidth connections, with full-featured Java applications. If a user population has slower connections, such as a remote sales force using dial-up connections, an HTML application can be deployed for their use.
High-end analytical users who spend a large percentage of their business day analyzing past business performance or developing forecasts of future performance need a highly interactive environment. The Java versions of the presentation beans enable a rich, interactive experience. This includes rotating dimensions in a presentation using drag and drop, formatting through direct manipulation (a formatting toolbar is offered to enhance the interaction), and frozen row and column headers to aid in the navigation of large reports.
The HTML versions of the presentation beans can display custom formats that have been defined and saved using a Java client application, as shown in Figure 7-54. However, they do not require Java to be downloaded to the client. HTML-based tools provide the ability to change among presentation types, change the layout of a presentation, sort the data, and apply queries that have been previously created and saved. The graph bean generates image files on the middle tier, which you can insert into an HTML page just as you would any other image. The thin graph creates image maps that support drilling and tooltips in an HTML application.
Figure 7-54: Java crosstab with formatting and toolbar (left) and the same crosstab in HTML (right)
BI Beans Catalog
The BI Beans Catalog is used to save, retrieve, and manage all developer-defined and user-defined analytical objects, such as reports, graphs, favorite queries, and custom measures. The BI Beans Catalog is designed to support large, distributed user communities who share analytical objects in collaborative environments. Developers take advantage of the catalog at design time and hook application logic to the catalog, so users can access catalog functionality from the application at run time.
The BI Beans Catalog can be stored in an Oracle Database or in a local file system. From a development standpoint, it may be convenient to store all your objects within your local file system. However, when the time comes to deploy applications, you should export your objects to a database implementation of the catalog. Since the BI Beans Catalog is then in the Oracle Database, it is scalable and secure.
Object definitions are stored in the catalog as XML. This allows developers to store application objects once, and then use the same objects in Java and HTML applications (or, for that matter, in a PDA or WAP application).
Oracle Essbase & Oracle OLAP: The Guide to Oracle's Multidimensional Solution
Reprinted for CTS/215337, Cognizant Technology Solutions Oracle Press, The McGraw Hill Companies, Inc. (c) 2010, Copying Prohibited
Page 36 / 39

Application Development
Increasing developer productivity is the mission of the BI Beans. This has been accomplished by making JDeveloper the premier environment for developing BI applications. Although BI Beans are standard Java components that can be used with any IDE, using JDeveloper significantly enhances and simplifies the developer experience. Using BI Beans and JDeveloper provides the flexibility to develop applets, applications, servlets, and JSPs.
To speed the process of developing applications and application objects, BI Beans provide a number of wizards in JDeveloper. These wizards allow you quickly to create presentation objects (crosstabs, tables, and graphs), calculations, complete Java applications, and complete HTML applications as servlets. Developers can edit these objects and applications visually in JDeveloper, or they can edit the generated Java code directly.
BI Beans also includes a custom JavaServer Pages (JSP) tag library for embedding BI Beans objects directly into JSPs. For example, a developer could embed a graph in a page by simply inserting a tag referencing a graph that was previously created.
BI Beans provides a live connection to Oracle OLAP during the JDeveloper application design session, as shown in Figure 7-55. This allows the application developer to see data at design time. This is particularly important with BI applications, because the data content often affects how the analytical objects are designed. For example, being able to see the data at design time allows the developer to make decisions about data selections and formatting in a report.
Figure 7-55: Creating a crosstab in JDeveloper with live access to data and formatting
JDeveloper understands the BI Beans Catalog. This makes it very easy to share analytical objects among many different applications. For example, several different applications could all share the same report. When the report needs to be altered, JDeveloper can be used to make the changes. All the applications that use that report then automatically see the updated report. Other IDEs can be used to do this, but JDeveloper makes the task almost trivial.
In summary, BI Beans provides an application architecture to support any enterprise BI needs. Because BI Bean applications are built using Java, they can be deployed anywhere on the Internet. Java applications can be deployed on any device that can run Java. Servlets can service any device that supports a browser. The application logic is written by the developer on the middle-tier and may be reused by any client application: Java applications, servlets, JSPs, and so on. This provides support for a variety of devices, such as PCs, browsers, PDAs, and even web-enabled phones like the Apple iPhone and BlackBerry.
Connecting Java Applications to Essbase
Oracle Essbase & Oracle OLAP: The Guide to Oracle's Multidimensional Solution
Reprinted for CTS/215337, Cognizant Technology Solutions Oracle Press, The McGraw Hill Companies, Inc. (c) 2010, Copying Prohibited
Page 37 / 39

Essbase includes a Java API bundled with its Oracle Hyperion Provider Services component. Oracle development teams and partners use the Java API to create distributed, server-side applications that interact with Essbase databases. For example, some of the Oracle products discussed earlier in this chapter, such as Planning and Profitability and Cost Management, incorporate the Java API, as does Applied OLAP’s Dodeca, which was introduced in the preceding chapter.
Because the Java API is public, you can have your own development team use the Java API to connect a custom Java application to an instance of an Essbase Server. Programmers can do basic things like sign on to an Essbase Server domain, establish a connection to a database, build dimensions, load data, query data, run calculation scripts, modify a database outline, sign out, and close the connection. They can also perform some advanced tasks, such as create a grid interface.
The API is 100% Java. The ess_japi.jar file is located in the lib directory of your Provider Services installation. The packages in the JAR file reflect the kinds of tasks that you usually do with Essbase.
Architectural Considerations
When designing or modifying an application to work with Essbase, you can follow one of two architectural paths:
n Embed the Java API in your application, as shown in Figure 7-56.
Figure 7-56: Embedded architecture
n Implement Provider Services to service calls from the Java API. as shown in Figure 7-57.
Figure 7-57: Provider Services middle-tier architecture
As discussed in Chapter 2, Provider Services can also be a data source provider for Smart View, XMLA clients, OBIEE Plus, and Planning (via the Smart View provider). If you are already using one or more of these products, this may be the preferred option for your environment.
Each implementation option offers benefits and drawbacks in terms of supported features. Table 7-1 lists some features and indicates whether they are supported by each option.
Table 7-1: Supported Features by Implementation Method
Feature Supported by Embedded API
Supported by Provider Services
High availability No Yes
Clustering No Yes
Support Java API client requests from other applications or Oracle Hyperion products
No Yes
Oracle Essbase & Oracle OLAP: The Guide to Oracle's Multidimensional Solution
Reprinted for CTS/215337, Cognizant Technology Solutions Oracle Press, The McGraw Hill Companies, Inc. (c) 2010, Copying Prohibited
Page 38 / 39

You are not bound by your initial architecture decision. Because the reference to the type of implementation is contained within the signOn() method, it is easy to direct your program to use a different architecture should the need arise.
Java API Resources
This section provided only a broad overview of the Java API. Essbase ships with a set of sample applications that do a good job of showcasing key methods available to you in the Java API. You can find information about the sample applications, including where to locate them and how to run them, in the Oracle Hyperion Provider Services Administration Guide.
You may also find the following resources helpful during your development process:
n Java API for Oracle Essbase Javadoc Get details on interfaces, classes, methods, and fields. The Javadoc is installed with Provider Services.
n Oracle Technology Network: Java Developer Center Discover Oracle’s tools for Java—including JDeveloper and Oracle WebLogic Server—and connect with other Java developers at http://www.oracle.com/technology/tech/java/index.html.
n Blogs Benefit from real-world experience as told by industry experts. Find blog postings and presentations on the Internet by using the search term combination “essbase java api.”
Conclusion
You may not need to create your own cubes, spreadsheets, and reports to reap the benefits of online analytical processing. In some cases, it may be more appropriate to implement a packaged application to address a particular need, rather than creating your own set of spreadsheets and reports. One or more of the products discussed in this chapter may be exactly what you need to get your OLAP solution up and running quickly. In addition, if a packaged solution does not suit your needs, the public Java APIs for Essbase and Oracle OLAP mean that you can have a custom front-end application built.
In the next chapter, we look at how to make Essbase and Oracle OLAP run more efficiently. As all environments are different, we cannot offer specific solutions. But we can give you some ideas about how to optimize and maintain Oracle OLAP analytic workspaces and Essbase servers and databases.
References
EPM Information Development Team. Oracle Hyperion Provider Services Administration Guide, Release 11.1.1. Oracle Corporation, 2008.
Oracle Corporation. Creating Interactive APEX Reports Over OLAP 11g Cubes. Oracle Technology Network (http://www.oracle.com/technology/obe/olap-apex/usingapex4olap. htm).
Middle-tier server No Yes
Direct TCP/IP connection from application to an Essbase Server Yes No
API installed on client machine Yes No
Oracle Essbase & Oracle OLAP: The Guide to Oracle's Multidimensional Solution
Reprinted for CTS/215337, Cognizant Technology Solutions Oracle Press, The McGraw Hill Companies, Inc. (c) 2010, Copying Prohibited
Page 39 / 39