9 February 2018 Q4 Presentation 2017 - Duni · •This presentation has been prepared by Duni A...
21
9 February 2018 Q4 Presentation 2017
Transcript of 9 February 2018 Q4 Presentation 2017 - Duni · •This presentation has been prepared by Duni A...

Eng US
9 February 2018
Q4 Presentation 2017

Eng US
• This presentation has been prepared by Duni AB (the “Company”) solely for use at this investor presentation and is furnished to you solely for your information and may not be reproduced or redistributed, in whole or in part, to any other person. By attending the meeting where this presentation is made, or by reading the presentation slides, you agree to be bound by the following limitations.
• This presentation is not for presentation or transmission into the United States or to any U.S. person, as that term is defined under Regulation S promulgated under the Securities Act of 1933, as amended.
• This presentation contains various forward-looking statements that reflect management’s current views with respect to future events and financial and operational performance. The words “believe,” “expect,” “anticipate,” “intend,” “may,” “plan,” “estimate,” “should,” “could,” “aim,” “target,” “might,” or, in each case, their negative, or similar expressions identify certain of these forward-looking statements. Others can be identified from the context in which the statements are made. These forward-looking statements involve known and unknown risks, uncertainties and other factors, which are in some cases beyond the Company’s control and may cause actual results or performance to differ materially from those expressed or implied from such forward-looking statements. These risks include but are not limited to the Company’s ability to operate profitably, maintain its competitive position, to promote and improve its reputation and the awareness of the brands in its portfolio, to successfully operate its growth strategy and the impact of changes in pricing policies, political and regulatory developments in the markets in which the Company operates, and other risks.
• The information and opinions contained in this document are provided as at the date of this presentation and are subject to change without notice.
• No representation or warranty (expressed or implied) is made as to, and no reliance should be placed on, the fairness, accuracy or completeness of the information contained herein. Accordingly, none of the Company, or any of its principal shareholders or subsidiary undertakings or any of such person’s officers or employees accepts any liability whatsoever arising directly or indirectly from the use of this document.
10/22/20142
Disclaimer

• Operating income on par with previous year despite record high pulp prices.
• Financial position continues to be strong, though net debt higher than previous year driven by acquisitions and capacity investments.
• We have initiated price compensationactivities that will gradually have effect during second quarter 2018.
• After a weak third quarter, Meal Service is now back to growth levels seen in the beginning of the year.
• Consumer strengthens the operating income explained by cost reductions and efficiency improvements in production.
• New Markets experienced solid growth, but profit burdened by market investments and strengthening of the organization.
3
• Net sales SEK 1 254 m(1 234)
• Operating income SEK 169 m (171)
• Operating margin 13.5% (13.9%)
2017 Q4 Highlights

• HoReCa market long-term growing in line with or slightly above GDP.
• Consumer confidence continue to increase and reach all time high levels, driven by strong improvement in unemployment expectations.
• Improvement in FX rates from previous quarters, but CHF and GBP still burdens.
• Raw material increase. Some key materials like pulp and bagasse (environmentally conscious material) have increased sharply during fourth quarter.
Market Outlook

Eng US
Business Areas

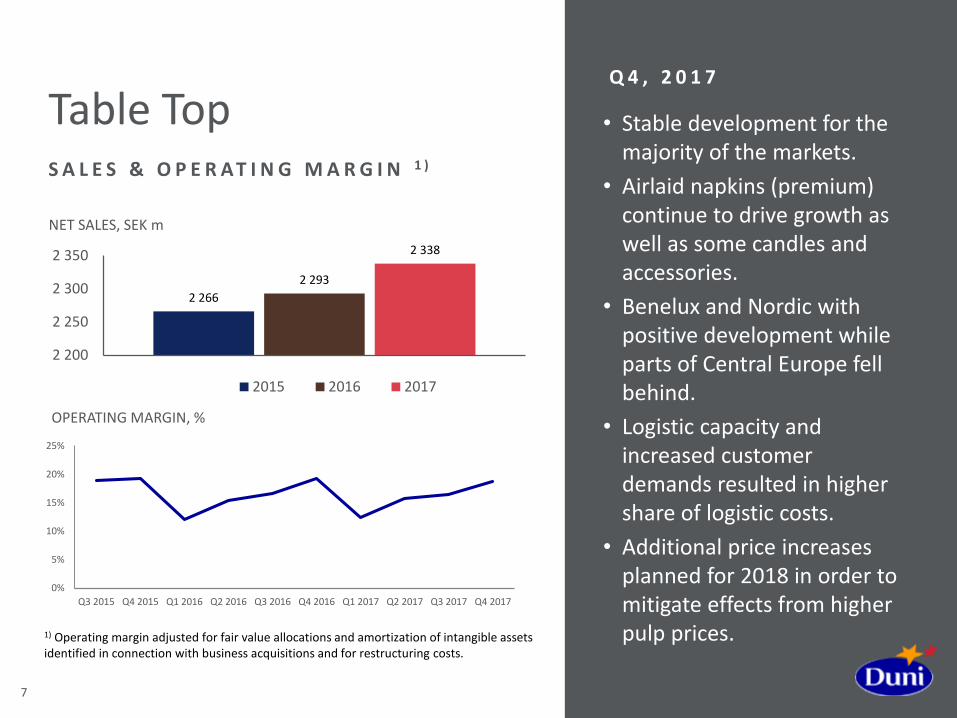
Table TopGross margin affected by record high pulp prices.
2 266
2 293
2 338
2 200
2 250
2 300
2 350
NET SALES, SEK m
2015 2016 2017
7
• Stable development for the majority of the markets.
• Airlaid napkins (premium) continue to drive growth as well as some candles and accessories.
• Benelux and Nordic with positive development while parts of Central Europe fell behind.
• Logistic capacity and increased customer demands resulted in higher share of logistic costs.
• Additional price increases planned for 2018 in order to mitigate effects from higher pulp prices.
Table TopS A L E S & O P E R A T I N G M A R G I N 1 )
Q 4 , 2 0 1 7
1) Operating margin adjusted for fair value allocations and amortization of intangible assets identified in connection with business acquisitions and for restructuring costs.
0%
5%
10%
15%
20%
25%
Q3 2015 Q4 2015 Q1 2016 Q2 2016 Q3 2016 Q4 2016 Q1 2017 Q2 2017 Q3 2017 Q4 2017
OPERATING MARGIN, %

Meal ServiceRegained momentum after weak quarter 3.
8

616666
704
500
600
700
800
NET SALES, SEK m
2015 2016 2017
9
• Meal Service with growth levels seen in the beginning of the year (~5%).
• Gross margin recovered from previous quarter.
• Plastic prices remains on high levels although down from peak levels in the first half year.
• Prices for bagasse, which is a key sustainable material, have increased by 30% in fourth quarter due to capacity constraints in Asia.
Meal ServiceS A L E S & O P E R A T I N G M A R G I N 1 )
Q 4 , 2 0 1 7
1) Operating margin adjusted for fair value allocations and amortization of intangible assets identified in connection with business acquisitions and for restructuring costs.
-4%
-2%
0%
2%
4%
6%
8%
10%
12%
Q3 2015 Q4 2015 Q1 2016 Q2 2016 Q3 2016 Q4 2016 Q1 2017 Q2 2017 Q3 2017 Q4 2017
OPERATING MARGIN, %
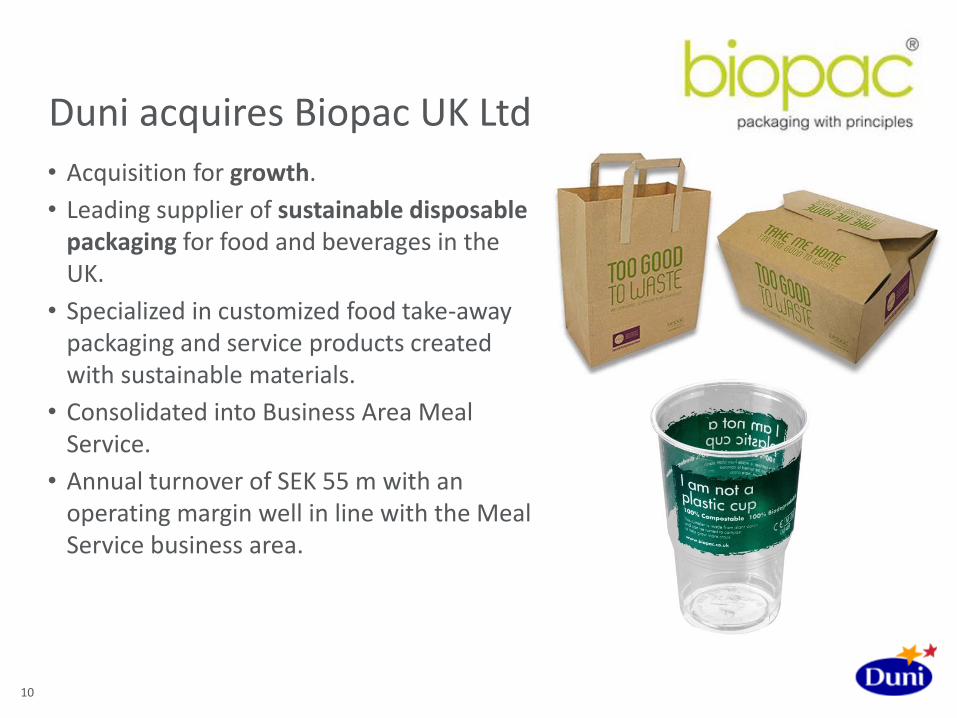
Duni acquires Biopac UK Ltd
• Acquisition for growth.
• Leading supplier of sustainable disposable packaging for food and beverages in the UK.
• Specialized in customized food take-away packaging and service products created with sustainable materials.
• Consolidated into Business Area Meal Service.
• Annual turnover of SEK 55 m with an operating margin well in line with the Meal Service business area.
10

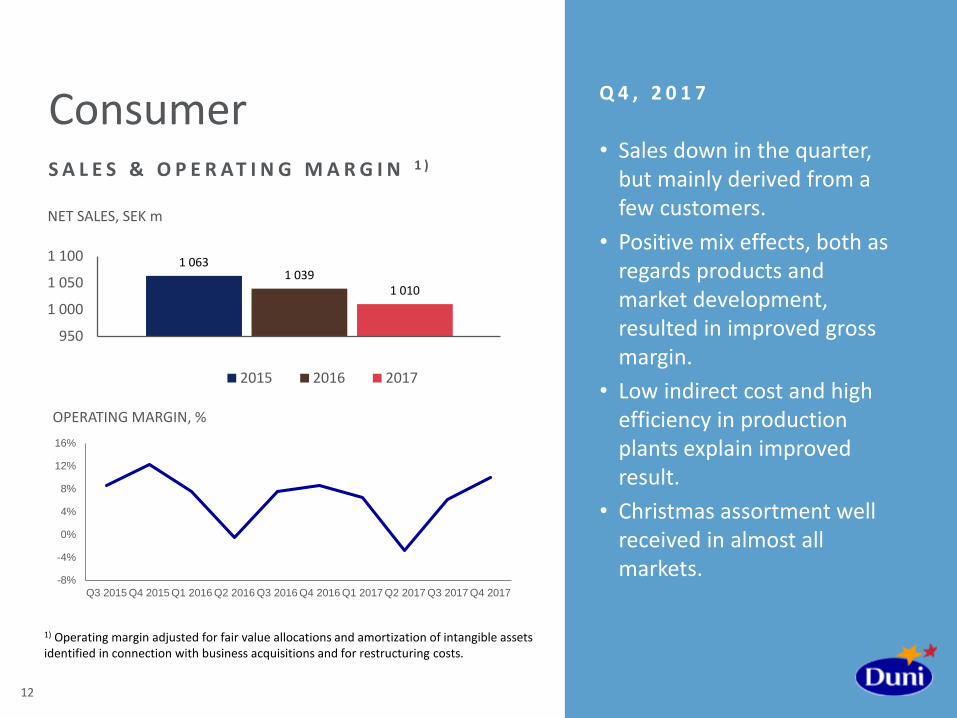
ConsumerStrengthened result although sales decline.
12
• Sales down in the quarter, but mainly derived from a few customers.
• Positive mix effects, both as regards products and market development, resulted in improved gross margin.
• Low indirect cost and high efficiency in production plants explain improved result.
• Christmas assortment well received in almost all markets.
ConsumerS A L E S & O P E R A T I N G M A R G I N 1 )
Q 4 , 2 0 1 7
1 0631 039
1 010
950
1 000
1 050
1 100
NET SALES, SEK m
2015 2016 2017
1) Operating margin adjusted for fair value allocations and amortization of intangible assets identified in connection with business acquisitions and for restructuring costs.
-8%
-4%
0%
4%
8%
12%
16%
Q3 2015 Q4 2015 Q1 2016 Q2 2016 Q3 2016 Q4 2016 Q1 2017 Q2 2017 Q3 2017 Q4 2017
OPERATING MARGIN, %

New MarketsAsia and Oceania region increases its share.
13

• In general positive development in all regions outside Europe, but Asia/Pacific and South America main explanation for growth.
• Continuous market investment and focus on strengthening organization in order to accelerate growth of Duni premium products and consolidate customer offering.
14
New Markets S A L E S & O P E R A T I N G M A R G I N 1 )
1) Operating margin adjusted for fair value allocations and amortization of intangible assets identified in connection with business acquisitions and for restructuring costs.
8%
8%
7%
71%
6% Russia
Middle East & North Africa
North, South & Latin America
Asia & Oceania
Other
Net sales, geographical split
0%
2%
4%
6%
8%
10%
12%
14%
16%
OPERATING MARGIN, %
207 220
322
050
100150200250300350
2015 2016 2017
NET SALES, SEK m

Eng US
Financials

Eng US
16
Record Q4 Net income
1) Operating income adjusted for fair value allocations and amortization of intangible assets identified in connection with business acquisitions and for restructuring costs.
SEK m Q4 2017
Q4 2016
FY 2017
FY 2016
Net sales 1 254 1 234 4 441 4 271
Gross profit 373 360 1 264 1 231
Gross margin 29.8% 29.2% 28.5% 28.8%
Selling expenses -129 -129 -505 -483
Administrative expenses -72 -67 -261 -245
R & D expenses -2 -2 -8 -8
Other operating net -10 -9 -35 -33
EBIT 159 153 456 463
Adjustments -10 -18 -35 -38
Operating income 1) 169 171 491 502
Operating margin 13.5% 13.9% 11.1% 11.8%
Financial net -5 -5 -17 -22
Taxes -33 -34 -106 -107
Net income 121 113 334 334
Earnings per share 2.55 2.41 6.99 7.06

Eng US
17
Strong improvement in Consumer
1) Operating income adjusted for fair value allocations and amortization of intangible assets identified in connection with business acquisitions and for restructuring costs.
SEK m Q4 2017
Q4 2016
FY2017
FY2016
Table Top Net SalesOperating income 1)
Operating margin
641121
18.8%
645125
19.4%
2 338375
16.0%
2 293369
16.1%
Meal Service Net SalesOperating income 1)
Operating margin
1797
4.1%
171 6
3.6%
70431
4.4%
66641
6.1%
Consumer Net SalesOperating income 1)
Operating margin
31732
10.0%
33128
8.6%
1 01057
5.6%
1 03965
6.2%
New Markets Net SalesOperating income 1)
Operating margin
967
7.7%
73 10
13.7%
32224
7.4%
22023
10.4%
Other Net SalesOperating income 1)
212
14 1
675
524
Duni total Net SalesOperating income 1)
Operating margin
1 254169
13.5%
1 234 171
13.9%
4 441491
11.1%
4 271502
11.8%

Eng US
18
High capex
1) Operating income adjusted for fair value allocations and amortization of intangible assets identified in connection with business acquisitions and for restructuring costs.
SEK m Q4 2017
Q4 2016
FY2017
FY2016
EBITDA1) 205 206 630 632
Capital expenditure -66 -63 -234 -176
Change in;Inventory 37 51 -57 -18
Accounts receivable -8 -11 -49 -42
Accounts payable 81 49 56 9
Other operating working capital -21 -16 2 20
Change in working capital 89 73 -48 -32
Operating cash flow 228 216 348 424

Eng US
19
Financial position
1) Deferred tax assets and liabilities + Income tax receivables and payables.2) Operating income adjusted for fair value allocations and amortization of intangible assets identified in connection with business acquisitions and for restructuring costs. Calculated based on the last twelve months.3) Including restructuring provision and derivatives.
SEK m December 2017 December 2016
Goodwill 1 617 1 577
Tangible and intangible fixed assets 1 374 1 255
Net financial assets 1) -107 -72
Inventories 627 548
Accounts receivable 798 730
Accounts payable -428 -373
Other operating assets and liabilities 3) -433 -422
Net assets 3 449 3 243
Net debt 855 757
Equity 2 294 2 486
Equity and net debt 3 449 3 243
ROCE 2) 14% 16%
ROCE 2) w/o Goodwill 28% 31%
Net debt / Equity 33% 31%
Net debt / EBITDA 2)1.36 1.20

Eng US
20
Organic growth of 5% over a business cycle
Consider acquisitions to reach new markets or to strengthen current market positions
Top line growth – premium focus
Improvements in manufacturing, sourcing and logistics
Target at least 40% of net profit
> 5%
> 10%
40+%
Sales growth
Operating margin
Dividend payout ratio
2017
0.9%at fixed exchange rates,
excluding hygiene business
2017
11.1%
2017
5.00 SEKper share
Proposal AGM 2018

Thank you!