
Q2 Presentation 2015 - We supply goodfoodmood | Duni US • This presentation has been prepared by...
23
10 July, 2015 Q2 Presentation 2015
-
Upload
duongtuong -
Category
Documents
-
view
216 -
download
1
Transcript of Q2 Presentation 2015 - We supply goodfoodmood | Duni US • This presentation has been prepared by...

Eng US
10 July, 2015
Q2 Presentation 2015

Eng US
• This presentation has been prepared by Duni AB (the “Company”) solely for use at this investor presentation and is furnished to you solely for your information and may not be reproduced or redistributed, in whole or in part, to any other person. By attending the meeting where this presentation is made, or by reading the presentation slides, you agree to be bound by the following limitations.
• This presentation is not for presentation or transmission into the United States or to any U.S. person, as that term is defined under Regulation S promulgated under the Securities Act of 1933, as amended.
• This presentation contains various forward-looking statements that reflect management’s current views with respect to future events and financial and operational performance. The words “believe,” “expect,” “anticipate,” “intend,” “may,” “plan,” “estimate,” “should,” “could,” “aim,” “target,” “might,” or, in each case, their negative, or similar expressions identify certain of these forward-looking statements. Others can be identified from the context in which the statements are made. These forward-looking statements involve known and unknown risks, uncertainties and other factors, which are in some cases beyond the Company’s control and may cause actual results or performance to differ materially from those expressed or implied from such forward-looking statements. These risks include but are not limited to the Company’s ability to operate profitably, maintain its competitive position, to promote and improve its reputation and the awareness of the brands in its portfolio, to successfully operate its growth strategy and the impact of changes in pricing policies, political and regulatory developments in the markets in which the Company operates, and other risks.
• The information and opinions contained in this document are provided as at the date of this presentation and are subject to change without notice.
• No representation or warranty (expressed or implied) is made as to, and no reliance should be placed on, the fairness, accuracy or completeness of the information contained herein. Accordingly, none of the Company, or any of its principal shareholders or subsidiary undertakings or any of such person’s officers or employees accepts any liability whatsoever arising directly or indirectly from the use of this document.
10/22/2014 2
Disclaimer

• Small organic growth in line with soft market in general.
• Decision to invest 110 MSEK in additional capacity for tissue.
• Organic growth mainly derived from Meal Service and New Markets.
• Seasonal increase in net debt, but decrease with 248 MSEK compared to Q2 2014.
• Hygiene as from Q2 reported as discontinued operations.
3
• Net sales SEK 1 002 m (922)
• Operating income SEK 104 m (93)
• Operating margin 10.3% (10.1%)
2015 Q2 Highlights
4
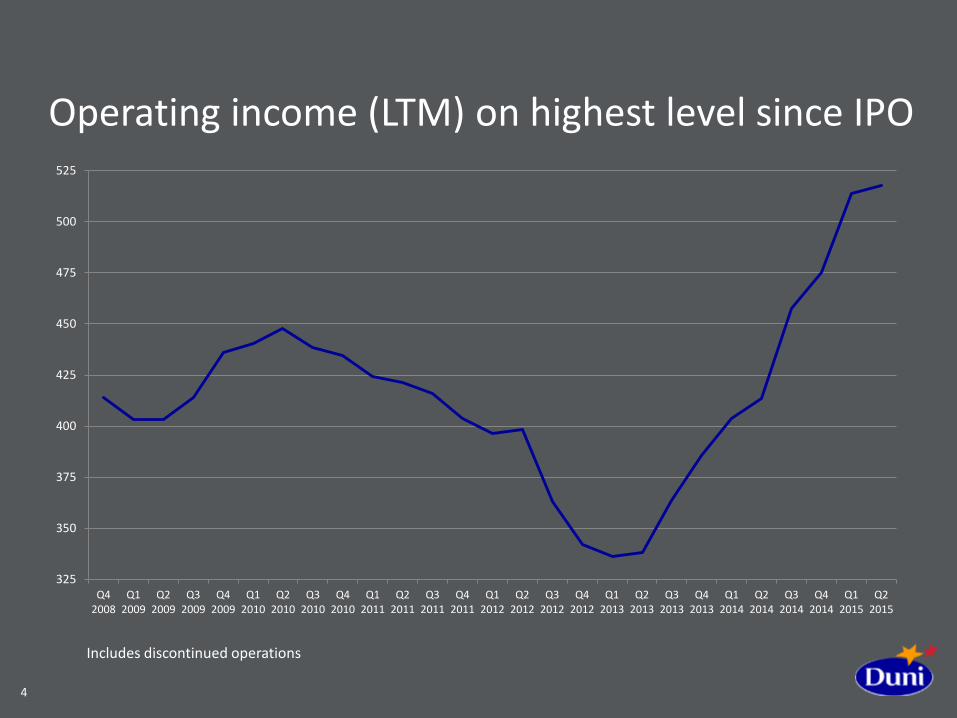
Operating income (LTM) on highest level since IPO
325
350
375
400
425
450
475
500
525
Q42008
Q12009
Q22009
Q32009
Q42009
Q12010
Q22010
Q32010
Q42010
Q12011
Q22011
Q32011
Q42011
Q12012
Q22012
Q32012
Q42012
Q12013
Q22013
Q32013
Q42013
Q12014
Q22014
Q32014
Q42014
Q12015
Q22015
Includes discontinued operations

Market Outlook

Eng US
• HoReCa market long-term growing in line or slightly above GDP. − Higher growth in take-away, catering and fast food restaurants. − Zero growth in volume from recent German HoReCa, mixed signals in Europe.
Sweden strong, but weak in parts of West and South Europe. • Improved estimation on real GDP, but Greek crisis could hamper expectations. − Uplift of German GDP prediction for 2015 indicating 1.5-2.0% improvement vs. 2014. − Greek crisis might have negative influence on consumer confidence which is still on
healthy levels. − High volatility, partly due to exchange rates, on raw materials. Continuous strong
USD puts pressure on prices in EUR. • Pulp remains on high levels in EUR correlated to the strong USD. • Sharp competitive pressure in several markets, also in premium segment.
6
Market Outlook

Eng US Business Areas

Table Top Slightly lower growth trend noticeable in Central Europe.

2 040
2 179 2 224
1 9002 0002 1002 2002 300
NET SALES, SEK m
2013 2014 LTM 2015
9
• Softer development compared to previous quarters, which could partly be explained by a cold spring and consequently low activity in outdoor seating.
• Benelux and UK continue to improve, but Germany experienced a weak quarter.
• Cash & Carry, the dominating distribution channel in Germany, had a weaker trend.
• Sweden still a challenging market, albeit underlying increase in demand.
• Higher share of Premium assortment, but less favorable development in commodities.
Table Top S A L E S & O P E R A T I N G M A R G I N 1 )
Q 2 , 2 0 1 5
1) Operating margin adjusted for fair value allocations and amortization of intangible assets identified in connection with business acquisitions and for restructuring costs and market valuation of derivatives.
0%5%
10%15%20%25%
Q22013
Q32013
Q42013
Q12014
Q22014
Q32014
Q42014
Q12015
Q22015
OPERATING MARGIN, %
Meal Service Volume increase and improved profit continues.
10
509
555 583
450
500
550
600
NET SALES, SEK m
2013 2014 LTM 2015
11
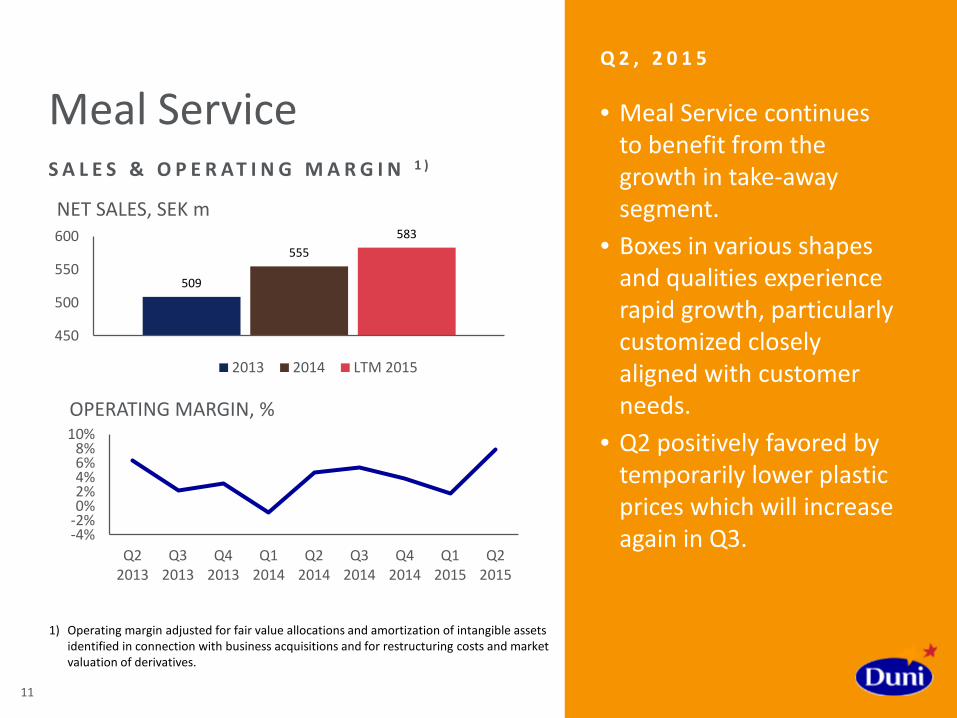
• Meal Service continues to benefit from the growth in take-away segment.
• Boxes in various shapes and qualities experience rapid growth, particularly customized closely aligned with customer needs.
• Q2 positively favored by temporarily lower plastic prices which will increase again in Q3.
Meal Service S A L E S & O P E R A T I N G M A R G I N 1 )
Q 2 , 2 0 1 5
1) Operating margin adjusted for fair value allocations and amortization of intangible assets identified in connection with business acquisitions and for restructuring costs and market valuation of derivatives.
-4%-2%0%2%4%6%8%
10%
Q22013
Q32013
Q42013
Q12014
Q22014
Q32014
Q42014
Q12015
Q22015
OPERATING MARGIN, %

Consumer Last quarter with structural effects from Paper+Design acquisition.

13
• Second quarter the seasonally least important.
• Lower number of campaigns compared to 2014 which benefitted from occasions like FIFA World Cup and a warm spring.
• Strong development in UK.
• Diminished year on year effect from business secured in 2014.
Consumer S A L E S & O P E R A T I N G M A R G I N 1 )
Q 2 , 2 0 1 5
603 889
1 059
0
500
1 000
1 500
NET SALES, SEK m
2013 2014 LTM 2015
1) Operating margin adjusted for fair value allocations and amortization of intangible assets identified in connection with business acquisitions and for restructuring costs and market valuation of derivatives.
-8%-4%0%4%8%
12%16%
Q22013
Q32013
Q42013
Q12014
Q22014
Q32014
Q42014
Q12015
Q22015
OPERATING MARGIN, %

New Markets Improvement albeit continuous challenging situation in Russia.
14

• Stabilization of Russian ruble, implementation of price increase and cost reduction plan in Russia contributed to satisfying development.
• Duni Singapore benefits from sales of Duni assortment.
• Middle East and South America with double digit growth.
15
New Markets
150 195 206
0
50
100
150
200
250
2013
2014
LTM 2015
S A L E S & O P E R AT I N G M A R G I N 1 )
1) Operating margin adjusted for fair value allocations and amortization of intangible assets identified in connection with business acquisitions and for restructuring costs and market valuation of derivatives.
51%
11%
17%
6%
8% 7% Singapore
Russia
Middle East & North Africa
South & Latin America
Asia & Oceania
Other
Net sales, geographical split
-8%
-4%
0%
4%
8%
Q22013
Q32013
Q42013
Q12014
Q22014
Q32014
Q42014
Q12015
Q22015
OPERATING MARGIN, %

Materials & Services
• Hygiene is no longer included in M&S, instead reported as discontinued operations below net profit.
• Remaining business are mainly external sales of raw materials of tissue and airlaid plus external services.
16

Eng US Financials
Eng US
SEK m Continuing operations
Q2 2015 Q2 2014 YTD 2015 YTD 2014 LTM 2014/2015
FY 2014
Net sales 1 002 922 1 987 1 739 4 118 3 870
Gross profit 284 253 571 487 1 219 1 134
Gross margin 28.4% 27.4% 28.8% 28.0% 29.6% 29.3%
Selling expenses -116 -112 -241 -225 -472 -456
Administrative expenses -60 -50 -117 -96 -232 -211
R & D expenses -3 -2 -5 -5 -11 -11
Other operating net -9 4 -10 -2 -31 -23
EBIT 97 92 198 158 473 433
Adjustments -7 -1 -13 -1 -30 -18
Operating income 1) 104 93 211 159 504 452
Operating margin 10.3% 10.1% 10.6% 9.2% 12.2% 11.7%
Financial net -7 -1 -12 -4 -27 -19
Taxes -22 -24 -47 -41 -119 -113
Net income 68 66 138 112 327 302
Earnings per share 1.44 1.40 2.94 2.39 6.97 6.42
18
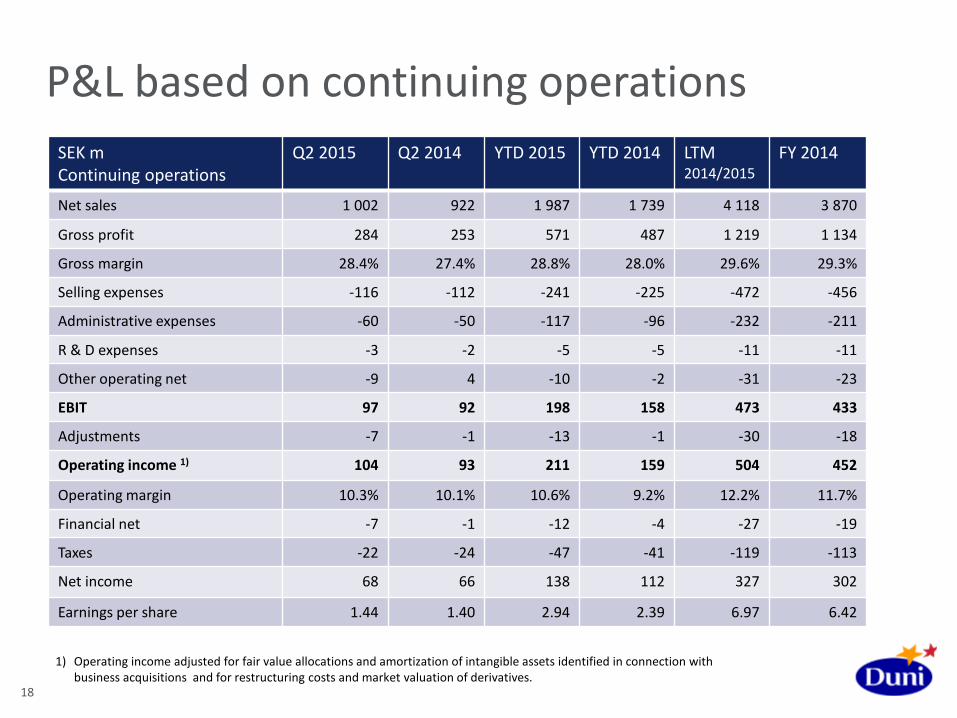
P&L based on continuing operations
1) Operating income adjusted for fair value allocations and amortization of intangible assets identified in connection with business acquisitions and for restructuring costs and market valuation of derivatives.
Eng US
SEK m Q2 2015 Q2 2014 YTD 2015 YTD 2014 LTM 2014/2015
FY 2014
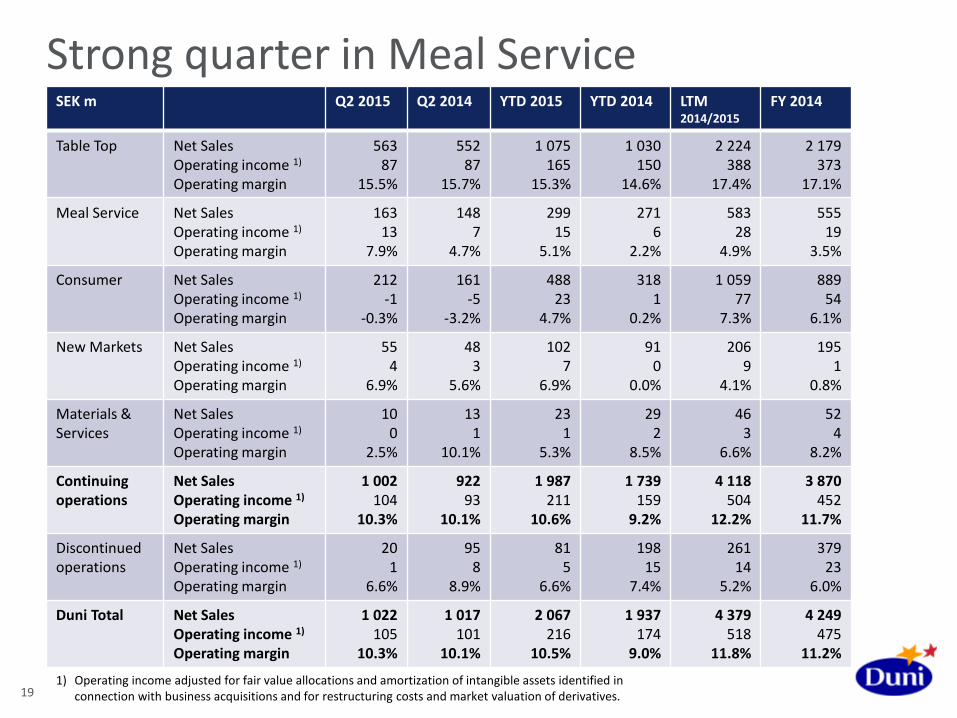
Table Top Net Sales Operating income 1)
Operating margin
563 87
15.5%
552 87
15.7%
1 075 165
15.3%
1 030 150
14.6%
2 224 388
17.4%
2 179 373
17.1%
Meal Service Net Sales Operating income 1) Operating margin
163 13
7.9%
148 7
4.7%
299 15
5.1%
271 6
2.2%
583 28
4.9%
555 19
3.5%
Consumer Net Sales Operating income 1) Operating margin
212 -1
-0.3%
161 -5
-3.2%
488 23
4.7%
318 1
0.2%
1 059 77
7.3%
889 54
6.1%
New Markets Net Sales Operating income 1) Operating margin
55 4
6.9%
48 3
5.6%
102 7
6.9%
91 0
0.0%
206 9
4.1%
195 1
0.8%
Materials & Services
Net Sales Operating income 1) Operating margin
10 0
2.5%
13 1
10.1%
23 1
5.3%
29 2
8.5%
46 3
6.6%
52 4
8.2%
Continuing operations
Net Sales Operating income 1) Operating margin
1 002 104
10.3%
922 93
10.1%
1 987 211
10.6%
1 739 159
9.2%
4 118 504
12.2%
3 870 452
11.7%
Discontinued operations
Net Sales Operating income 1) Operating margin
20 1
6.6%
95 8
8.9%
81 5
6.6%
198 15
7.4%
261 14
5.2%
379 23
6.0%
Duni Total Net Sales Operating income 1) Operating margin
1 022 105
10.3%
1 017 101
10.1%
2 067 216
10.5%
1 937 174
9.0%
4 379 518
11.8%
4 249 475
11.2%
19
Strong quarter in Meal Service
1) Operating income adjusted for fair value allocations and amortization of intangible assets identified in connection with business acquisitions and for restructuring costs and market valuation of derivatives.
Eng US
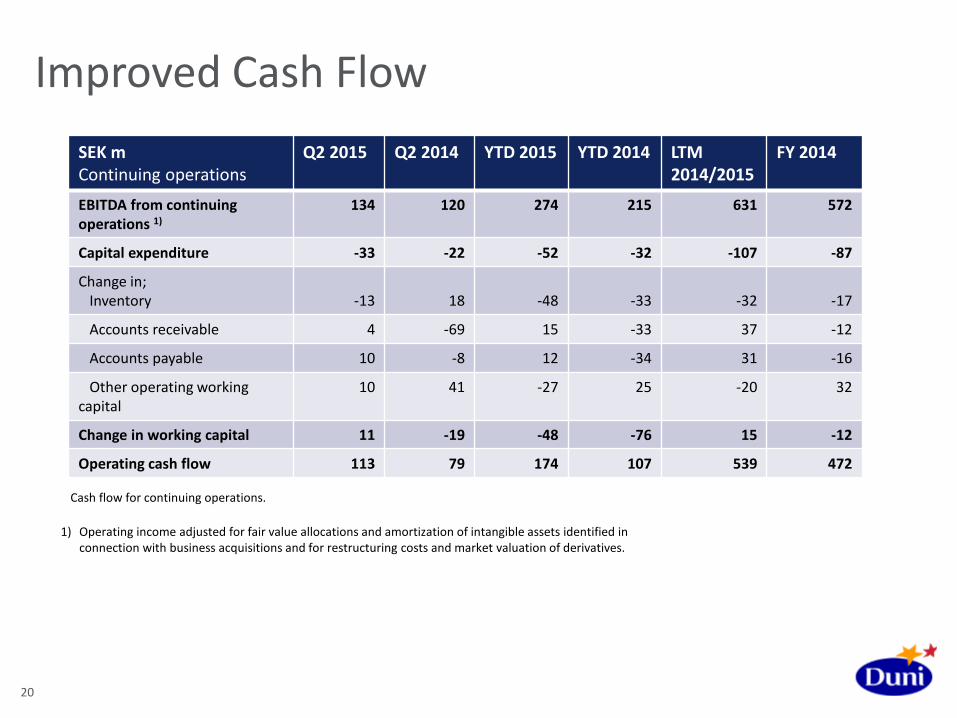
SEK m Continuing operations
Q2 2015 Q2 2014 YTD 2015 YTD 2014 LTM 2014/2015
FY 2014
EBITDA from continuing operations 1)
134 120 274 215 631 572
Capital expenditure -33 -22 -52 -32 -107 -87
Change in; Inventory -13 18 -48 -33 -32 -17
Accounts receivable 4 -69 15 -33 37 -12
Accounts payable 10 -8 12 -34 31 -16
Other operating working capital
10 41 -27 25 -20 32
Change in working capital 11 -19 -48 -76 15 -12
Operating cash flow 113 79 174 107 539 472
20
Improved Cash Flow
1) Operating income adjusted for fair value allocations and amortization of intangible assets identified in connection with business acquisitions and for restructuring costs and market valuation of derivatives.
Cash flow for continuing operations.

Eng US
SEK m June 2015 December 2014 June 2014 Goodwill 1 459 1 463 1 493
Tangible and intangible fixed assets
1 113 1 162 1 107
Net financial assets 1) -24 -1 64
Inventories 531 503 531
Accounts receivable 686 743 748
Accounts payable -325 -341 -330
Other operating assets and liabilities 3)
-395 -448 -429
Net assets 3 045 3 081 3 184
Net debt 916 888 1 164
Equity 2 130 2 193 2 021
Equity and net debt 3 045 3 081 3 184
ROCE 2) 17% 15% 13%
ROCE 2) w/o Goodwill 34% 31% 32%
Net debt / Equity 43% 41% 58%
Net debt / EBITDA 2) 1.45 1.55 2.36
21
Financial position considerably improved vs. June 2014
1) Deferred tax assets and liabilities + Income tax receivables and payables. 2) Operating income adjusted for fair value allocations and amortization of intangible assets identified in connection with business
acquisitions and for restructuring costs and market valuation of derivatives. Calculated based on the last twelve months, continuing operations.
3) Including restructuring provision and derivatives.

Eng US
22
Organic growth of 5% over a business cycle Consider acquisitions to reach new markets or to strengthen current market positions
Top line growth – premium focus Improvements in manufacturing, sourcing and logistics
Target at least 40% of net profit
> 5%
> 10%
40+%
Sales growth
Operating margin
Dividend payout ratio
LTM
2.2% at fixed exchange rates,
excluding hygiene business1)
LTM
12.2%
2014
4.50 SEK per share

Thank you!