8D-3 Andrew Vitale
5
12/07/2017 1 A continuous simulation approach A continuous simulation approach A continuous simulation approach A continuous simulation approach to assessing flood closures for to assessing flood closures for to assessing flood closures for to assessing flood closures for major transport corridors major transport corridors major transport corridors major transport corridors Andrew Vitale Engeny Water Management Waterway Crossing Upgrades for Transport Waterway Crossing Upgrades for Transport Waterway Crossing Upgrades for Transport Waterway Crossing Upgrades for Transport Corridors Corridors Corridors Corridors • Upgrade crossings to achieve consistent flood immunity standard (e.g. 10 year ARI immunity) – May not be economical for low immunity corridor – May be better to spend money on crossings that result in longer road closures – Need to prioritise upgrades • Upgrade crossings with largest AAToC – Does not consider dependency between crossing closures – Upgrading a crossing does not necessarily reduce AAToC of entire corridor if other crossings are closed at same time • How to prioritise upgrades? Prioritisation of Waterway Prioritisation of Waterway Prioritisation of Waterway Prioritisation of Waterway Crossing Upgrades Crossing Upgrades Crossing Upgrades Crossing Upgrades • Depends on many factors: – Spatial variation in rainfall along road corridor – Variation in immunity and AAToC of individual crossings – Closure dependency along road corridor – Cost of crossing upgrades – Types of road users (LV, HV) – Availability and characteristics of alternative access routes • Continuous simulation approach required to estimate AAToC for entire road corridor Continuous Simulation Approach Continuous Simulation Approach Continuous Simulation Approach Continuous Simulation Approach • Model coincidental closures of individual crossings along whole road corridor • Can then simulate benefit of individual crossing upgrades on overall road closure characteristics • Economic assessment can be used to prioritise or provide business case for crossing upgrades
Transcript of 8D-3 Andrew Vitale
12/07/2017
1
A continuous simulation approach A continuous simulation approach A continuous simulation approach A continuous simulation approach
to assessing flood closures for to assessing flood closures for to assessing flood closures for to assessing flood closures for
major transport corridorsmajor transport corridorsmajor transport corridorsmajor transport corridors
Andrew Vitale
Engeny Water Management
Waterway Crossing Upgrades for Transport Waterway Crossing Upgrades for Transport Waterway Crossing Upgrades for Transport Waterway Crossing Upgrades for Transport
CorridorsCorridorsCorridorsCorridors
• Upgrade crossings to achieve consistent flood immunity standard (e.g. 10 year ARI immunity)– May not be economical for low immunity corridor
– May be better to spend money on crossings that result in longer road closures
– Need to prioritise upgrades
• Upgrade crossings with largest AAToC– Does not consider dependency between crossing closures
– Upgrading a crossing does not necessarily reduce AAToCof entire corridor if other crossings are closed at same time
• How to prioritise upgrades?
Prioritisation of Waterway Prioritisation of Waterway Prioritisation of Waterway Prioritisation of Waterway Crossing UpgradesCrossing UpgradesCrossing UpgradesCrossing Upgrades
• Depends on many factors:
– Spatial variation in rainfall along road corridor
– Variation in immunity and AAToC of individual crossings
– Closure dependency along road corridor
– Cost of crossing upgrades
– Types of road users (LV, HV)
– Availability and characteristics of alternative access routes
• Continuous simulation approach required to estimate AAToC for entire road corridor
Continuous Simulation ApproachContinuous Simulation ApproachContinuous Simulation ApproachContinuous Simulation Approach
• Model coincidental closures of individual
crossings along whole road corridor
• Can then simulate benefit of individual crossing
upgrades on overall road closure characteristics
• Economic assessment can be used to prioritise
or provide business case for crossing upgrades

12/07/2017
2
Case Study: Gore Highway Flood StudyCase Study: Gore Highway Flood StudyCase Study: Gore Highway Flood StudyCase Study: Gore Highway Flood Study
• Gore Highway connects Toowoomba and Goondiwindi
• Part of main road transport link between Brisbane and Melbourne
• Road corridor 200 km long
• Divided into 3 links for purpose of study based on alternative access routes
• Road corridor has low flood immunity (< 2 year ARI)
• Main objective of study was to develop prioritised list of waterway crossing upgrades
Gore Highway Gore Highway Gore Highway Gore Highway –––– Alternative Access RoutesAlternative Access RoutesAlternative Access RoutesAlternative Access Routes
Gore Highway Gore Highway Gore Highway Gore Highway –––– Flooding ContextFlooding ContextFlooding ContextFlooding Context Study ApproachStudy ApproachStudy ApproachStudy Approach

12/07/2017
3
Continuous Hydrology Continuous Hydrology Continuous Hydrology Continuous Hydrology –––– Catchment Catchment Catchment Catchment
DelineationDelineationDelineationDelineation
• Minimum catchment size 2 km2 (small
catchments have negligible influence on AAToC)
• Not all catchments are cross drainage (flow
parallel to road corridor can cause closures)
• Condamine River assessed through gauging
data (no hydrology modelling required)
Continuous Hydrology Continuous Hydrology Continuous Hydrology Continuous Hydrology –––– Rainfall SequencesRainfall SequencesRainfall SequencesRainfall Sequences
• Pluviometer data used to generate gridded
spatial/temporal data set of 30 min interval
rainfall totals
• Gridded data used 1 km x 1 km grid size
• Continuous rainfall data set: 1973 – 2011 (39
years)
• Sufficient period of record to assess closure
statistics for low flood immunity road corridor
Continuous Hydrology Continuous Hydrology Continuous Hydrology Continuous Hydrology –––– Rainfall SequencesRainfall SequencesRainfall SequencesRainfall Sequences Continuous Hydrology Continuous Hydrology Continuous Hydrology Continuous Hydrology –––– Flow Flow Flow Flow SequencesSequencesSequencesSequences
• Continuous flow sequences developed using
AWBM rainfall runoff routing model
• Used catchment average rainfall data set
(average of gridded data over catchment)
• AWBM parameters determined by calibration
against stream gauging data
• Catchment area based AWBM parameters used
to derive flow sequences for closure assessment
12/07/2017
4
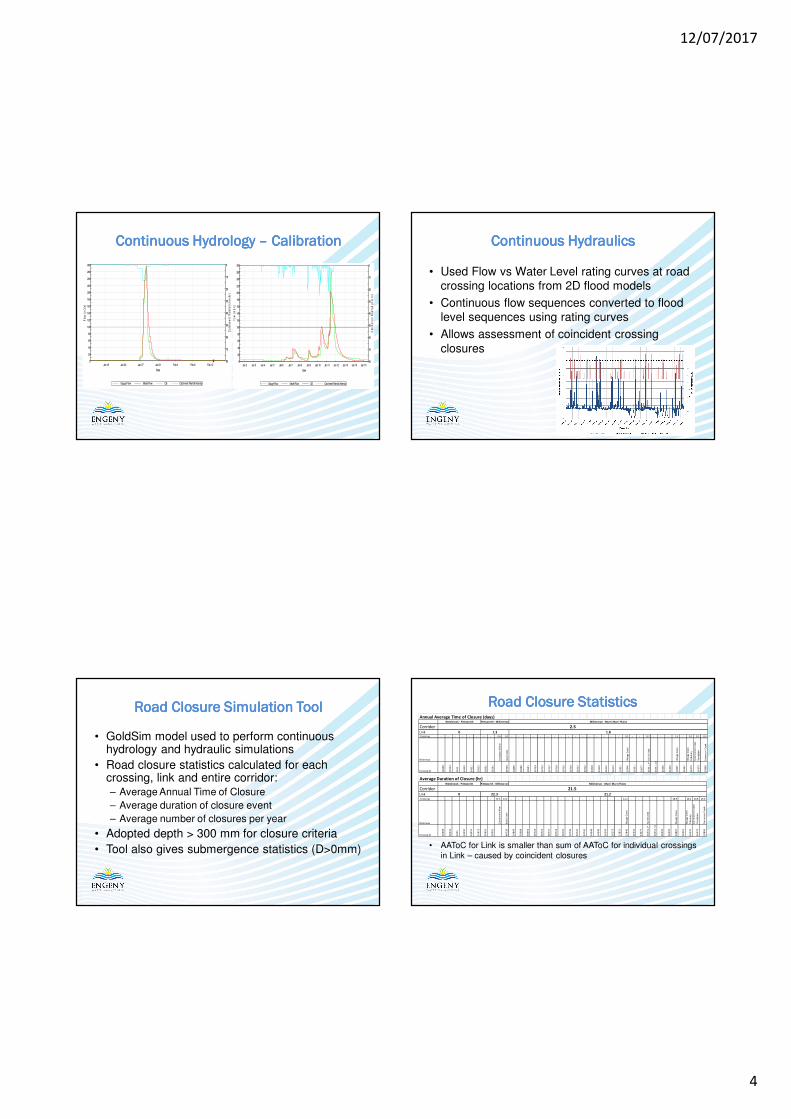
Continuous Hydrology Continuous Hydrology Continuous Hydrology Continuous Hydrology –––– CalibrationCalibrationCalibrationCalibration
0
20
40
60
80
100
120
140
160
180
200
220
240
260
280
Jan 2 Jan 3 Jan 4 Jan 5 Jan 6 Jan 7 Jan 8 Jan 9 Jan 10 Jan 11 Jan 12 Jan 13 Jan 14 Jan 15
Flo
w (
m3
/s)
Date
0
10
20
30
40
50
60
70
80
Ca
tch
me
nt
Ra
infa
ll (m
m/h
r)
Gauge Flow Model Flow Q5 Catchment Rainfall Intensity
0
20
40
60
80
100
120
140
160
180
200
220
240
260
280
Jan 19 Jan 23 Jan 27 Jan 31 Feb 4 Feb 8 Feb 12
Flo
w (
m3
/s)
Date
0
10
20
30
40
50
60
70
80
Ca
tch
me
nt
Ra
infa
ll (m
m/h
r)
Gauge Flow Model Flow Q5 Catchment Rainfall Intensity
Continuous Continuous Continuous Continuous HydraulicsHydraulicsHydraulicsHydraulics
• Used Flow vs Water Level rating curves at road
crossing locations from 2D flood models
• Continuous flow sequences converted to flood
level sequences using rating curves
• Allows assessment of coincident crossing
closures
Road Closure Simulation ToolRoad Closure Simulation ToolRoad Closure Simulation ToolRoad Closure Simulation Tool
• GoldSim model used to perform continuous hydrology and hydraulic simulations
• Road closure statistics calculated for each crossing, link and entire corridor:– Average Annual Time of Closure
– Average duration of closure event
– Average number of closures per year
• Adopted depth > 300 mm for closure criteria
• Tool also gives submergence statistics (D>0mm)
Road Closure StatisticsRoad Closure StatisticsRoad Closure StatisticsRoad Closure Statistics
• AAToC for Link is smaller than sum of AAToC for individual crossings
in Link – caused by coincident closures
Annual Average Time of Closure (days)
CorridorLinkCrossing - - - - - - - - 0.6 1.0 - - - - - - - - - - - - - - - - 0.1 - - 0.7 - - - 1.5 - 0.1 0.1 0.5
Waterway Co
nd
am
ine
Riv
er
Ba
ck C
reek
Wya
ga C
reek
Yarr
ill C
ree
k
Wya
ga C
reek
Wya
ga C
reek
Trib
uta
ry
Co
mm
orr
on
Cre
ek
Flo
od
pla
in
Co
mo
rro
n C
reek
Crossing ID 16
69
8
50
53
3
16
51
34
35
0
34
35
1
25
61
2
50
60
1
50
59
1
49
73
9
24
89
9
50
68
8
50
69
1
50
72
4
50
75
3
50
75
7
50
71
4
50
75
0
50
74
9
50
74
7
50
74
2
34
34
8
34
34
9
26
24
2
26
27
3
12
85
1
22
84
6
26
33
1
23
07
7
26
35
1_
P
26
35
1_
CD
26
35
6
26
35
0
10
80
7
26
36
1
26
37
0
26
37
3
10
80
6
Westbrook - Pittsworth Pittsworth - Millmerran Millmerran - Murri Murri Plains
2.5
0 1.3 1.8
Average Duration of Closure (hr)
CorridorLink
Crossing - - - - - - - - 37.4 17.2 - - - - - - - - - - - - - - - - 11.1 - - - - - - 18.9 - 10.2 10.8 15.6
Waterway Co
nd
am
ine
Riv
er
Ba
ck C
ree
k
Wy
ag
a C
ree
k
Ya
rrill
Cre
ek
Wy
ag
a C
ree
k
Wy
ag
a C
ree
k
Tri
bu
tary
Co
mm
orr
on
Cre
ek
Flo
od
pla
in
Co
mo
rro
n C
ree
k
Crossing ID 16
69
8
50
53
3
16
51
34
35
0
34
35
1
25
61
2
50
60
1
50
59
1
49
73
9
24
89
9
50
68
8
50
69
1
50
72
4
50
75
3
50
75
7
50
71
4
50
75
0
50
74
9
50
74
7
50
74
2
34
34
8
34
34
9
26
24
2
26
27
3
12
85
1
22
84
6
26
33
1
23
07
7
26
35
1_
P
26
35
1_
CD
26
35
6
26
35
0
10
80
7
26
36
1
26
37
0
26
37
3
10
80
6
Westbrook - Pittsworth
21.50 22.3 21.2
Millmerran - Murri Murri PlainsPittsworth - Millmerran

12/07/2017
5
Crossing Upgrade AssessmentCrossing Upgrade AssessmentCrossing Upgrade AssessmentCrossing Upgrade Assessment
• Road Closure Simulation Tool used to determine the Link AAToCthat remains if a particular crossing is upgraded to mitigate closure
Significant reduction in Link AAToC
Only minor reduction in Link AAToC
Rapid Economic AppraisalRapid Economic AppraisalRapid Economic AppraisalRapid Economic Appraisal
Crossing Upgrade PrioritisationCrossing Upgrade PrioritisationCrossing Upgrade PrioritisationCrossing Upgrade Prioritisation
Positive NPV
Other upgrades are
marginal when
considered in isolation
ConclusionsConclusionsConclusionsConclusions
• Benefits of approach:– Fast and low cost (derivation of rating curves using
hydraulic models is most time consuming component)
– Takes into account coincident road closures along corridor
– Allows rapid prioritisation of crossing upgrades
• Drawbacks in approach:– Generally limited to 30-40 years of pluviograph data
– Accuracy of closure statistics may be affected for high flood immunity road corridors
– Does not consider likelihood of coincident road closures along alternative routes or adjacent sections of corridor