8912 East Pinnacle Peak Road Scottsdale, AZ 85255 Phone (480) 513-0547 Fax (480) 513-0548 E-Mail:...
47
8912 East Pinnacle Peak Road • Scottsdale, AZ 85255 Phone (480) 513-0547 • Fax (480) 513-0548 • E-Mail: [email protected] • [email protected] www.hoytnet.com U.S. Supermarket Trends U.S. Supermarket Trends
-
Upload
emil-dickerson -
Category
Documents
-
view
215 -
download
0
Transcript of 8912 East Pinnacle Peak Road Scottsdale, AZ 85255 Phone (480) 513-0547 Fax (480) 513-0548 E-Mail:...
8912 East Pinnacle Peak Road • Scottsdale, AZ 85255 Phone (480) 513-0547 • Fax (480) 513-0548 • E-Mail: [email protected] • [email protected]
www.hoytnet.com
U.S. Supermarket TrendsU.S. Supermarket TrendsU.S. Supermarket TrendsU.S. Supermarket Trends

2AmericanLogistics.ppt
TodayToday
Consumer TrendsConsumer Trends
Trade TrendsTrade Trends
Winning Business Models & Success PrinciplesWinning Business Models & Success Principles
3AmericanLogistics.ppt
Consumer Trends – Consumer Trends – Population & Lifestyle Changes Population & Lifestyle Changes
That Affect CPG Food Purchasing DecisionsThat Affect CPG Food Purchasing Decisions
Consumer Trends – Consumer Trends – Population & Lifestyle Changes Population & Lifestyle Changes
That Affect CPG Food Purchasing DecisionsThat Affect CPG Food Purchasing Decisions
4AmericanLogistics.ppt
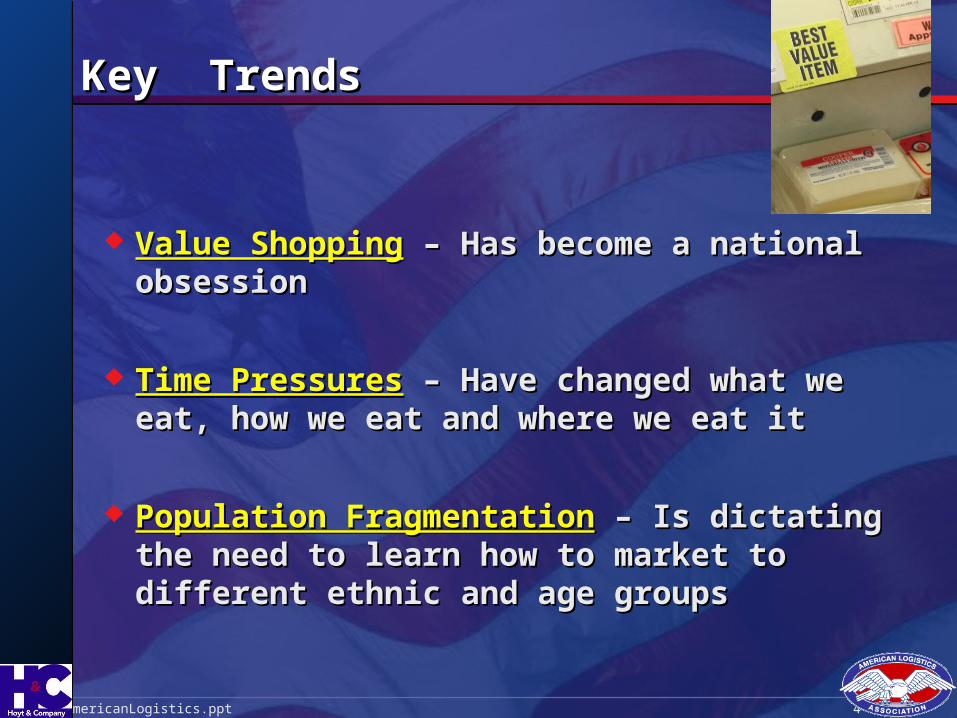
Key TrendsKey Trends
Value ShoppingValue Shopping – Has become a national obsession – Has become a national obsession
Time PressuresTime Pressures – Have changed what we eat, how we eat – Have changed what we eat, how we eat and where we eat itand where we eat it
Population FragmentationPopulation Fragmentation – Is dictating the need to learn – Is dictating the need to learn how to market to different ethnic and age groupshow to market to different ethnic and age groups

5AmericanLogistics.ppt
Value ShoppingValue Shopping – Root Causes – Root Causes
QuintileQuintile % Distribution of Income% Distribution of Income Mean IncomeMean Income
II
IIII
IIIIII
IVIV
VV
20%20%
20%20%
20%20%
20%20%
20%20%
40%40%
40%40%
50.2%50.2%
23.0%23.0%
14.6%14.6%
8.7%8.7%
3.5%3.5%
73.2%73.2%
12.2%12.2%
Middle Middle ClassClass
$146.0$146.0
$66.8$66.8
$42.6$42.6
$25.5$25.5
$10.1$10.1
Source: U.S. Census Bureau, 2003; Dept of CommerceSource: U.S. Census Bureau, 2003; Dept of Commerce
2001 Distribution of Total U.S. Income By Population Fifths2001 Distribution of Total U.S. Income By Population Fifths
Total U.S. MeanTotal U.S. Mean $58.2$58.2
6AmericanLogistics.ppt
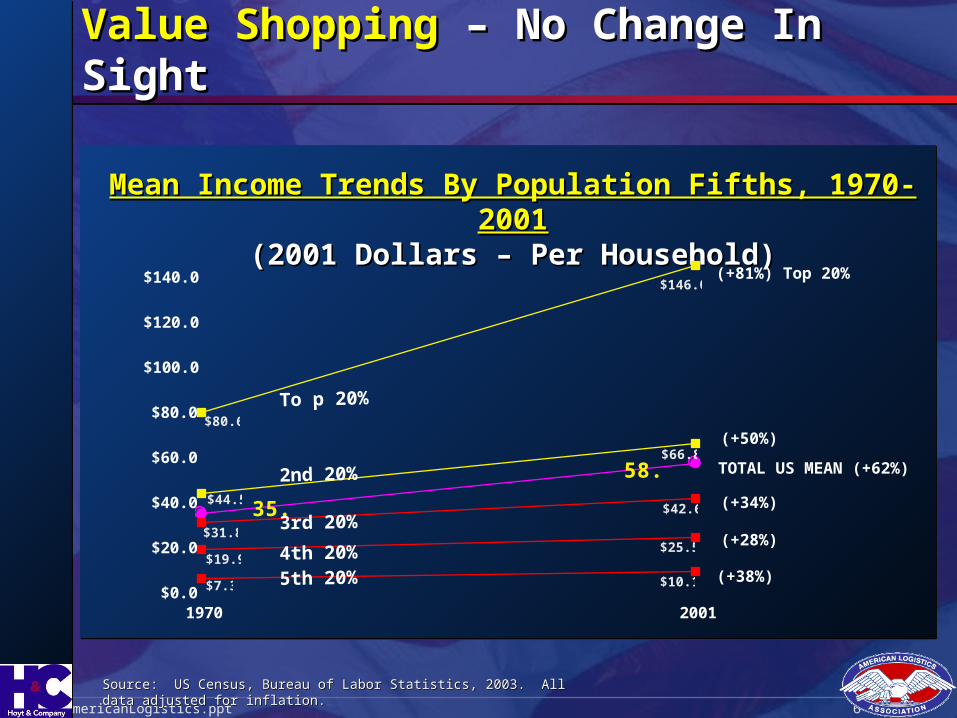
Value ShoppingValue Shopping – No Change In Sight – No Change In Sight
Mean Income Trends By Population Fifths, 1970-2001Mean Income Trends By Population Fifths, 1970-2001(2001 Dollars – Per Household)(2001 Dollars – Per Household)
$10.1$7.3
$25.5$19.9
35.9
58.2
$42.6
$31.8
$66.8
$44.5
$146.0
$80.6
$0.0
$20.0
$40.0
$60.0
$80.0
$100.0
$120.0
$140.0
1970 2001
(+81%) Top 20%
(+50%)
(+34%)
(+28%)
(+38%)
TOTAL US MEAN (+62%)2nd 20%
3rd 20%
4th 20%
5th 20%
Source: US Census, Bureau of Labor Statistics, 2003. All data adjusted for inflation.Source: US Census, Bureau of Labor Statistics, 2003. All data adjusted for inflation.
To p 20%

7AmericanLogistics.ppt
Time PressuresTime Pressures – Root Causes – Root Causes
75% of families now have two wage-earner incomes.75% of families now have two wage-earner incomes.
65% of married women with children under six are in the 65% of married women with children under six are in the workforce.workforce.
70% of working women say that the number of things 70% of working women say that the number of things they have to do in a day is a big cause of stress.they have to do in a day is a big cause of stress.
58% of consumers say convenience is a key determinant 58% of consumers say convenience is a key determinant of what they eat and where they eat it.of what they eat and where they eat it.
40% of the population say they have no idea of what they 40% of the population say they have no idea of what they are having for dinner at 4:00 pm.are having for dinner at 4:00 pm.

8AmericanLogistics.ppt
Source: National Eating Trends DataSource: National Eating Trends Data
Time PressuresTime Pressures – Impact On Family Meal – Impact On Family Meal Preparation and Eating Habits:Preparation and Eating Habits:
The average time spent in meal preparation these days is less The average time spent in meal preparation these days is less than 20 minutes per day – down from 2.5 hours in 1960.than 20 minutes per day – down from 2.5 hours in 1960.
0.0
0.5
1.0
1.5
2.0
2.5
3.0
1960 1980 2000
Time Spent Preparing MealsTime Spent Preparing Meals
2.5 Hours2.5 Hours
1 Hour1 Hour
20 Minutes20 Minutes
9AmericanLogistics.ppt
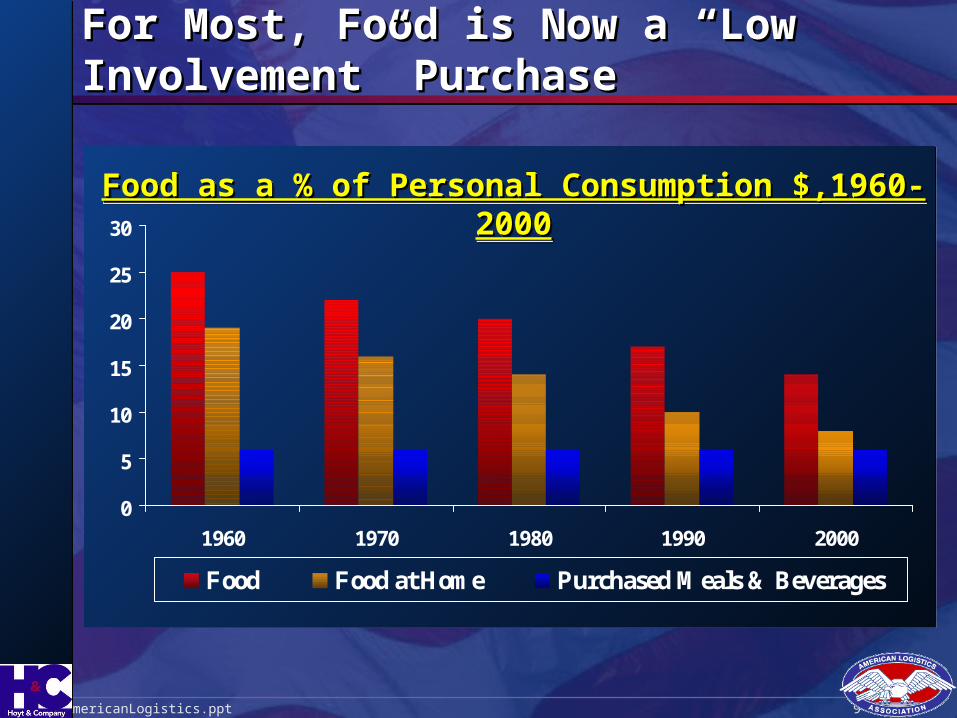
For Most, Food is Now a “Low Involvement” For Most, Food is Now a “Low Involvement” PurchasePurchase
Food as a % of Personal Consumption $,1960-2000Food as a % of Personal Consumption $,1960-2000Food as a % of Personal Consumption $,1960-2000Food as a % of Personal Consumption $,1960-2000
0
5
10
15
20
25
30
1960 1970 1980 1990 2000
Food Food at Home Purchased Meals & Beverages

10AmericanLogistics.ppt
Net On Time PressuresNet On Time Pressures
“ “Quick, easy and convenient” now drives the Quick, easy and convenient” now drives the strategystrategy
Must not only include “with it” product Must not only include “with it” product assortments but store operations – how fast the assortments but store operations – how fast the customer can get out the doorcustomer can get out the door
Retailers must think of themselves as facilitators, Retailers must think of themselves as facilitators, not just conduits for productsnot just conduits for products

11AmericanLogistics.ppt
Population FragmentationPopulation Fragmentation Will Dictate The Need To Will Dictate The Need To Market Discreetly To Very Different Population SegmentsMarket Discreetly To Very Different Population Segments
Chief among these are:Chief among these are:
Young SinglesYoung Singles
HispanicsHispanics
SeniorsSeniors

12AmericanLogistics.ppt
Source: US Census, Bureau of Labor Statistics, 2003. All data adjusted for Source: US Census, Bureau of Labor Statistics, 2003. All data adjusted for inflation.inflation.
Young SinglesYoung Singles Have Emerged As A Force In Their Own Right : Have Emerged As A Force In Their Own Right :
Between 1970 and 2000:Between 1970 and 2000:
The average size of U.S. households shrank from 3.14 to 2.62 personsThe average size of U.S. households shrank from 3.14 to 2.62 persons
Households with 5 or more persons disintegrated from 21% to 10% (52% drop)Households with 5 or more persons disintegrated from 21% to 10% (52% drop)
At the same time, one person households (singles/divorced/widowed) catapulted At the same time, one person households (singles/divorced/widowed) catapulted from 17% to 31% (82% increase)from 17% to 31% (82% increase)
19702000
Total HHTotal HH(Millions)(Millions)
Family HHFamily HH(% of total HH)(% of total HH)
Married HH Married HH w/childw/child
(% of total HH)(% of total HH)
6363
105105
69%69%81%81%
24%24%
40%40%
2000 vs. 1970 Changing Household Size in the U.S.2000 vs. 1970 Changing Household Size in the U.S.

13AmericanLogistics.ppt
The Hispanic PopulationThe Hispanic Population Is Currently The Fastest Growing Is Currently The Fastest Growing Segment of the American Public and Is Expected To Double By 2050Segment of the American Public and Is Expected To Double By 2050
Projected Population Growth by Segment, 2000 - 2050Projected Population Growth by Segment, 2000 - 2050
MMMMPop. SegmentPop. Segment %% MMMM %% Index vs. 2000Index vs. 200020002000 20502050
194194
32
3535
1111
33
257257
White non-HispanicWhite non-Hispanic
Hispanic
BlackBlack
Asian/So. PacificAsian/So. Pacific
OtherOther
TotalsTotals
70.570.5
11.6
12.712.7
4.04.0
1.21.2
100.0100.0
213213
98
5959
3838
1212
420420
50.750.7
23.3
14.014.0
9.09.0
2.82.8
100.0100.0
110110
306
168168
345345
400400
152152

14AmericanLogistics.ppt
SeniorsSeniors Will Comprise the Largest Single Will Comprise the Largest Single Segment Of The U.S. Population By 2020Segment Of The U.S. Population By 2020
Growth of 55+ Population Between 2000 and 2020Growth of 55+ Population Between 2000 and 2020(As a % of total pop.)(As a % of total pop.)
0
20
40
60
80
100
120
2000 (275M Base) 2020 (325MM Base)
Source: U.S. Census Bureau
22% of 22% of total pop.total pop.
60.5MM60.5MM
30% of 30% of total pop.total pop.
97.5MM97.5MM
+61% vs. 2000+61% vs. 2000
+18% vs. 2000+18% vs. 2000
15AmericanLogistics.ppt
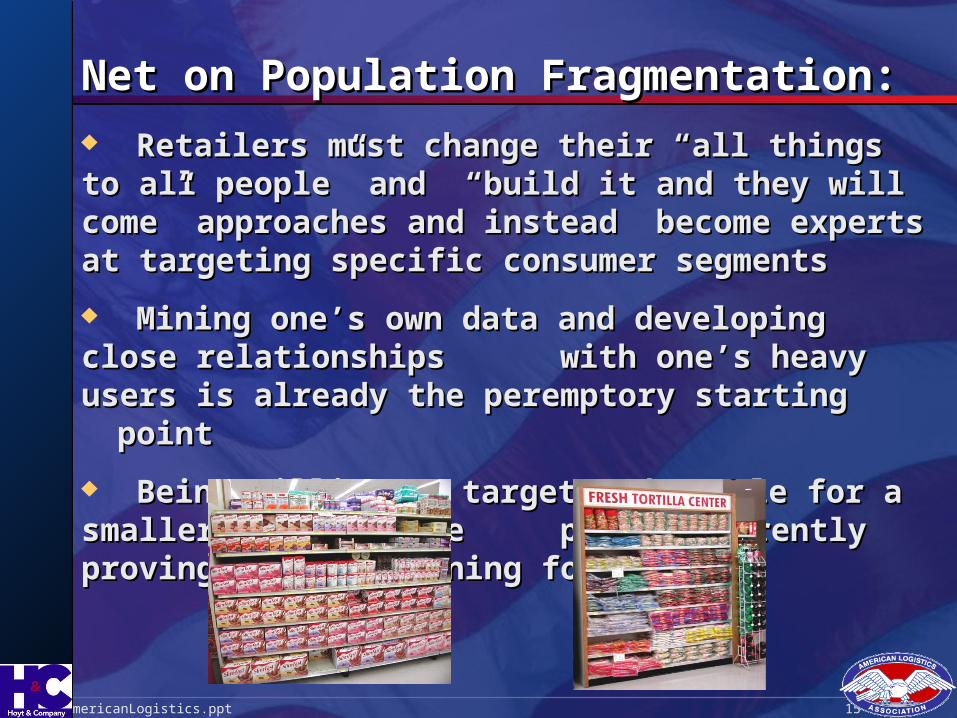
Net on Population Fragmentation:Net on Population Fragmentation:
Retailers must change their “all things to all people” and Retailers must change their “all things to all people” and “build it and they will come” approaches and instead “build it and they will come” approaches and instead become experts at targeting specific consumer segmentsbecome experts at targeting specific consumer segments
Mining one’s own data and developing close relationships Mining one’s own data and developing close relationships with one’s heavy users is already the peremptory starting with one’s heavy users is already the peremptory starting pointpoint
Being willing to target and settle for a smaller piece of the Being willing to target and settle for a smaller piece of the pie is currently proving to be a winning formulapie is currently proving to be a winning formula
16AmericanLogistics.ppt
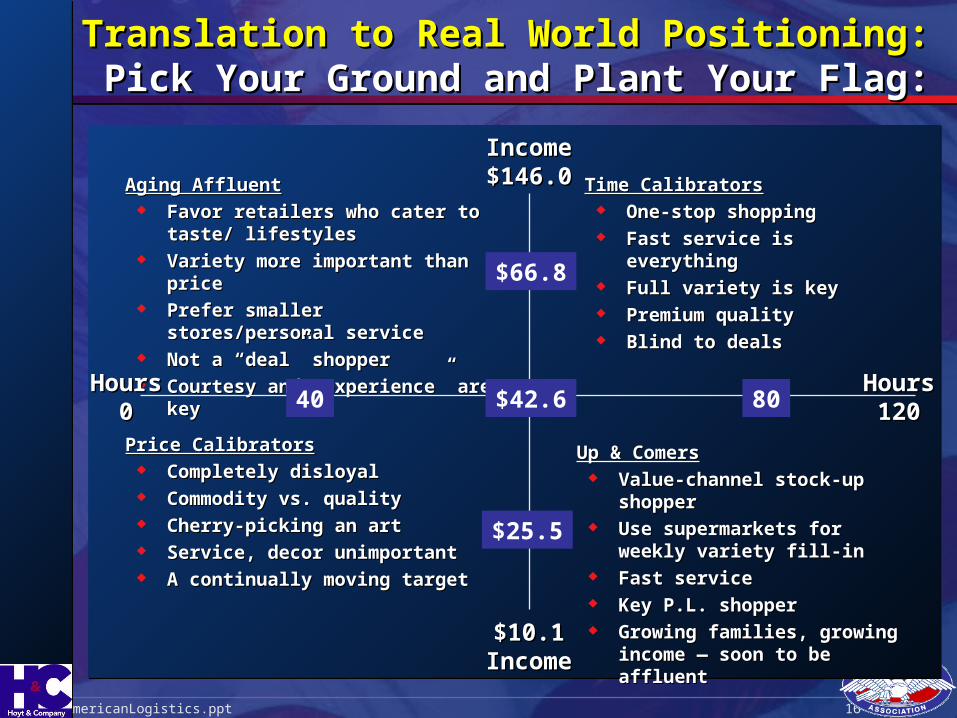
Translation to Real World Positioning:Translation to Real World Positioning: Pick Your Ground and Plant Your Flag: Pick Your Ground and Plant Your Flag:
Aging AffluentAging Affluent Favor retailers who cater to taste/ Favor retailers who cater to taste/
lifestyleslifestyles Variety more important than priceVariety more important than price Prefer smaller stores/personal servicePrefer smaller stores/personal service Not a “deal” shopperNot a “deal” shopper Courtesy and “experience” are keyCourtesy and “experience” are key
IncomeIncome$146.0$146.0
$10.1$10.1IncomeIncome
HoursHours00
HoursHours12012040 $42.6 80
$66.8
$25.5
Price CalibratorsPrice Calibrators Completely disloyalCompletely disloyal Commodity vs. qualityCommodity vs. quality Cherry-picking an artCherry-picking an art Service, decor unimportantService, decor unimportant A continually moving targetA continually moving target
Time CalibratorsTime Calibrators One-stop shoppingOne-stop shopping Fast service is everythingFast service is everything Full variety is keyFull variety is key Premium qualityPremium quality Blind to dealsBlind to deals
Up & ComersUp & Comers Value-channel stock-up shopperValue-channel stock-up shopper Use supermarkets for weekly variety Use supermarkets for weekly variety
fill-infill-in Fast serviceFast service Key P.L. shopperKey P.L. shopper Growing families, growing income — Growing families, growing income —
soon to be affluentsoon to be affluent

17AmericanLogistics.ppt
These Trends Are Easy To Spot Just By These Trends Are Easy To Spot Just By Looking At The Current Fastest GrowersLooking At The Current Fastest Growers
Bottled WaterBottled Water
Deli-Self ServeDeli-Self Serve
ButterButter
YogurtYogurt
Frozen NoveltiesFrozen Novelties
Refrigerated EntreesRefrigerated Entrees
Unbreaded Frozen ShrimpUnbreaded Frozen Shrimp
Refrigerated shakes/drinksRefrigerated shakes/drinks
Health bars and sticksHealth bars and sticks
Diet Carb Beverages-RemDiet Carb Beverages-Rem
19.8%19.8%
10.7%10.7%
23.9%23.9%
11.0%11.0%
10.5%10.5%
22.7%22.7%
36.9%36.9%
91.9%91.9%
40.5%40.5%
10.1%10.1%
$2,282.2$2,282.2
$3,446.1$3,446.1
$1,276.5$1,276.5
$2,289.3$2,289.3
$1,941.2$1,941.2
$865.0$865.0
$489.2$489.2
$188.2$188.2
$285.9$285.9
$881.6$881.6
2001 Dollar 2001 Dollar Sales ($MM)Sales ($MM)
2001 % Dollar 2001 % Dollar GrowthGrowth
Source: AC Nielsen Strategic Planner: Food, Drug & Mass excluding Wal-Mart. 52 Weeks ending 12/29/2001
Top 10 Fastest Growing CPG Categories In 2001Top 10 Fastest Growing CPG Categories In 2001
20012001 Dollar Dollar GrowthGrowth
$377.2$377.2
$333.1$333.1
$246.2$246.2
$226.0$226.0
$184.5$184.5
$160.0$160.0
$129.2$129.2
$90.1$90.1
$82.4$82.4
$80.9$80.9
18AmericanLogistics.ppt
Trade TrendsTrade Trends
The Sea Change in U.S. Retailing and the The Sea Change in U.S. Retailing and the Key Trade Factors that are Driving ItKey Trade Factors that are Driving It
Trade TrendsTrade Trends
The Sea Change in U.S. Retailing and the The Sea Change in U.S. Retailing and the Key Trade Factors that are Driving ItKey Trade Factors that are Driving It

19AmericanLogistics.ppt
The U.S. Food Retailing Landscape in 2003The U.S. Food Retailing Landscape in 2003The U.S. Food Retailing Landscape in 2003The U.S. Food Retailing Landscape in 2003
20AmericanLogistics.ppt
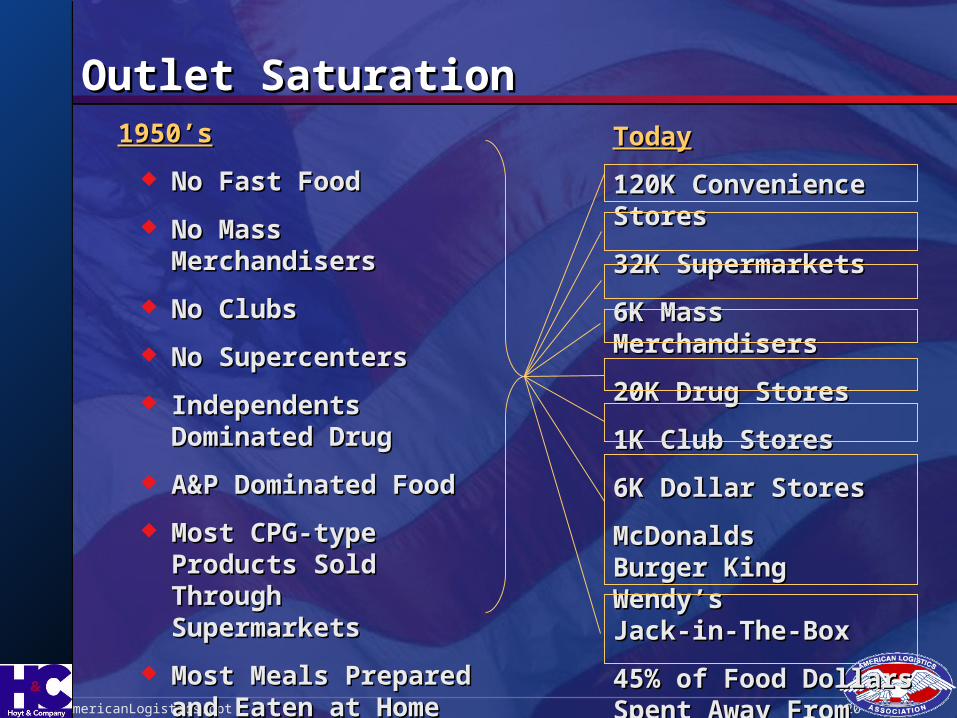
TodayToday
120K Convenience Stores120K Convenience Stores
32K Supermarkets32K Supermarkets
6K Mass Merchandisers6K Mass Merchandisers
20K Drug Stores20K Drug Stores
1K Club Stores1K Club Stores
6K Dollar Stores6K Dollar Stores
McDonaldsMcDonaldsBurger KingBurger KingWendy’sWendy’sJack-in-The-BoxJack-in-The-Box
45% of Food Dollars45% of Food DollarsSpent Away From HomeSpent Away From Home
Outlet SaturationOutlet Saturation1950’s1950’s
No Fast FoodNo Fast Food
No Mass MerchandisersNo Mass Merchandisers
No ClubsNo Clubs
No SupercentersNo Supercenters
Independents Dominated Independents Dominated DrugDrug
A&P Dominated FoodA&P Dominated Food
Most CPG-type Products Most CPG-type Products Sold Through Sold Through SupermarketsSupermarkets
Most Meals Prepared and Most Meals Prepared and Eaten at HomeEaten at Home

21AmericanLogistics.ppt
SKU Growth: 1945 - 2000SKU Growth: 1945 - 2000
0
10,000
20,000
30,000
40,000
50,000
60,000
1945-1964 1965-1980 1981-1995 2000
Source: Insight Out of Chaos, 2001
SKU ProliferationSKU Proliferation
New Food Items: 1980 = 2,6892000 = 16,390
22AmericanLogistics.ppt
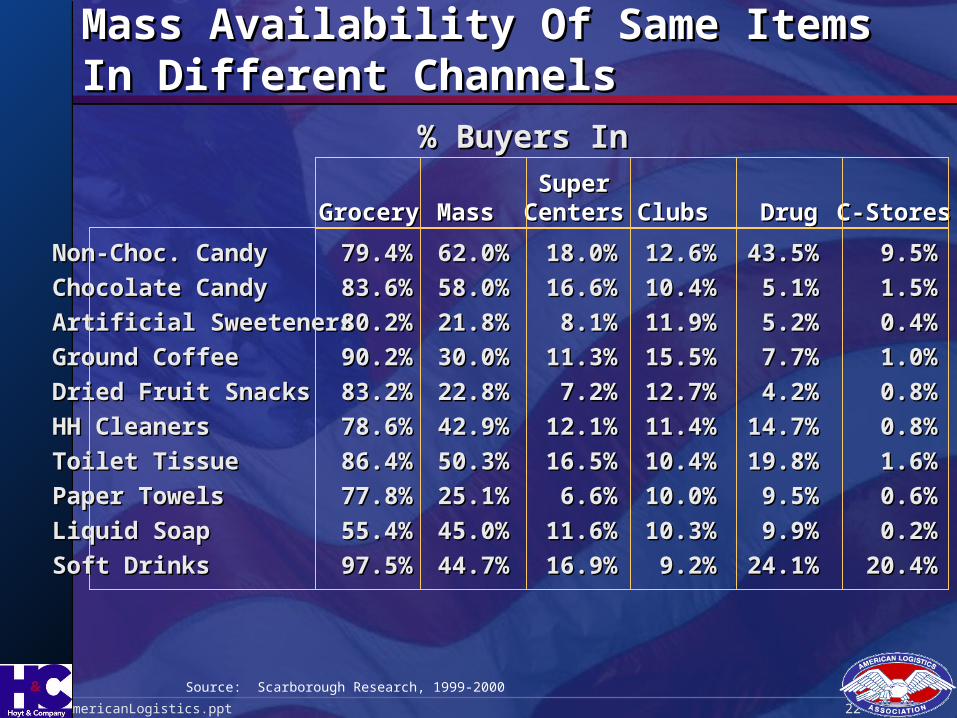
Non-Choc. CandyNon-Choc. Candy
Chocolate CandyChocolate Candy
Artificial SweetenersArtificial Sweeteners
Ground CoffeeGround Coffee
Dried Fruit SnacksDried Fruit Snacks
HH CleanersHH Cleaners
Toilet TissueToilet Tissue
Paper TowelsPaper Towels
Liquid SoapLiquid Soap
Soft DrinksSoft Drinks
79.4%79.4%
83.6%83.6%
80.2%80.2%
90.2%90.2%
83.2%83.2%
78.6%78.6%
86.4%86.4%
77.8%77.8%
55.4%55.4%
97.5%97.5%
GroceryGrocery
62.0%62.0%
58.0%58.0%
21.8%21.8%
30.0%30.0%
22.8%22.8%
42.9%42.9%
50.3%50.3%
25.1%25.1%
45.0%45.0%
44.7%44.7%
MassMass
18.0%18.0%
16.6%16.6%
8.1%8.1%
11.3%11.3%
7.2%7.2%
12.1%12.1%
16.5%16.5%
6.6%6.6%
11.6%11.6%
16.9%16.9%
SuperSuperCentersCenters
12.6%12.6%
10.4%10.4%
11.9%11.9%
15.5%15.5%
12.7%12.7%
11.4%11.4%
10.4%10.4%
10.0%10.0%
10.3%10.3%
9.2%9.2%
ClubsClubs
43.5%43.5%
5.1%5.1%
5.2%5.2%
7.7%7.7%
4.2%4.2%
14.7%14.7%
19.8%19.8%
9.5%9.5%
9.9%9.9%
24.1%24.1%
DrugDrug
9.5%9.5%
1.5%1.5%
0.4%0.4%
1.0%1.0%
0.8%0.8%
0.8%0.8%
1.6%1.6%
0.6%0.6%
0.2%0.2%
20.4%20.4%
C-StoresC-Stores
Source: Scarborough Research, 1999-2000
% Buyers In% Buyers In
Mass Availability Of Same Items In Different Mass Availability Of Same Items In Different ChannelsChannels
23AmericanLogistics.ppt
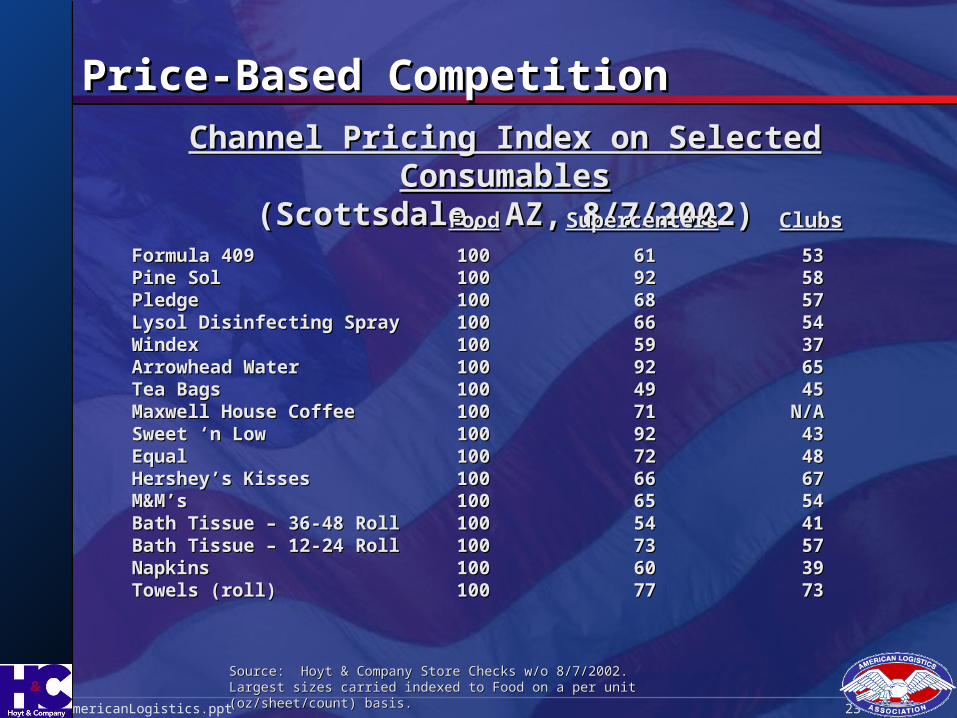
Channel Pricing Index on Selected ConsumablesChannel Pricing Index on Selected Consumables(Scottsdale, AZ, 8/7/2002)(Scottsdale, AZ, 8/7/2002)
Source: Hoyt & Company Store Checks w/o 8/7/2002. Source: Hoyt & Company Store Checks w/o 8/7/2002. Largest sizes carried indexed to Food on a per unit (oz/sheet/count) basis. Largest sizes carried indexed to Food on a per unit (oz/sheet/count) basis.
Formula 409Formula 409Pine SolPine SolPledgePledgeLysol Disinfecting SprayLysol Disinfecting SprayWindexWindexArrowhead WaterArrowhead WaterTea BagsTea BagsMaxwell House CoffeeMaxwell House CoffeeSweet ‘n LowSweet ‘n LowEqualEqualHershey’s KissesHershey’s KissesM&M’sM&M’sBath Tissue – 36-48 RollBath Tissue – 36-48 RollBath Tissue – 12-24 RollBath Tissue – 12-24 RollNapkinsNapkinsTowels (roll)Towels (roll)
100100100100100100100100100100100100100100100100100100100100100100100100100100100100100100100100
FoodFood
6161929268686666595992924949717192927272666665655454737360607777
SupercentersSupercenters
5353585857575454373765654545
N/AN/A43434848676754544141575739397373
ClubsClubs
Price-Based CompetitionPrice-Based Competition

24AmericanLogistics.ppt
Other Trade Trend Tidbits:Other Trade Trend Tidbits:
The most successful new product introductions are those The most successful new product introductions are those that save time or improve appearance or healththat save time or improve appearance or health
RFID – radio frequency identification tags – on the RFID – radio frequency identification tags – on the launching pad and inevitablelaunching pad and inevitable
Irradiated Meats – starting slowly but also inevitableIrradiated Meats – starting slowly but also inevitable
Consolidation has slowed as supermarkets struggle to Consolidation has slowed as supermarkets struggle to defend against the Wal-Mart juggernaut and try to absorb defend against the Wal-Mart juggernaut and try to absorb what they have already boughtwhat they have already bought
Everyone installing on-premise eat-in facilitiesEveryone installing on-premise eat-in facilities
• HEB with “Good to Go” HEB with “Good to Go”
• Walgreen’s “Welcome Home Café”Walgreen’s “Welcome Home Café”

25AmericanLogistics.ppt
Value RetailersValue RetailersValue RetailersValue Retailers
Supercenters, Clubs and Dollar StoresSupercenters, Clubs and Dollar Stores

26AmericanLogistics.ppt
Wal-Mart’s Expansion into FoodWal-Mart’s Expansion into Food
The most significant factor in food retailing since the The most significant factor in food retailing since the advent of self service in 1916:advent of self service in 1916:
• Invents nothing but perfects everythingInvents nothing but perfects everything
• Does nothing different but tries to do everything betterDoes nothing different but tries to do everything better
• Disdains emotion but rewards pragmatism, commitment and Disdains emotion but rewards pragmatism, commitment and disciplinediscipline
Between 1980 and 2001 Wal-Mart grew 35x’s faster than Between 1980 and 2001 Wal-Mart grew 35x’s faster than the market:the market:
19801980 20012001 Multiple vs. 1980Multiple vs. 1980
Total US Retail SalesTotal US Retail Sales $957B$957B $3,500B$3,500B 3.6 X3.6 X
Wal-Mart (US only)Wal-Mart (US only) $1.2B$1.2B $150B$150B 125 X125 X
Walmart vs. Total USWalmart vs. Total US 35 X35 X

27AmericanLogistics.ppt
Wal-Mart’s Expansion into FoodWal-Mart’s Expansion into Food
Wal-Mart is now the nation’s #1 food provider with 2002 Wal-Mart is now the nation’s #1 food provider with 2002 food sales of approximately $80B (vs. $50B for #2)food sales of approximately $80B (vs. $50B for #2)
Objective is 30% share of every business it entersObjective is 30% share of every business it enters
This week, This week, USA TodayUSA Today reported one analyst’s forecast that reported one analyst’s forecast that supermarkets’ share of the grocery business will drop to supermarkets’ share of the grocery business will drop to 34% by 2010 from its current 53% with the bulk lost to 34% by 2010 from its current 53% with the bulk lost to Wal-MartWal-Mart

28AmericanLogistics.ppt
The Heart of the Wal-Mart Competitive The Heart of the Wal-Mart Competitive Advantage – Low Operating CostsAdvantage – Low Operating Costs
Wal-Mart vs. Leading Supermarket Financials: 2002Wal-Mart vs. Leading Supermarket Financials: 2002
Wal-MartWal-Mart KrogerKroger Albertson’sAlbertson’s SafewaySafeway
SalesSales $81B$81B $53B$53B $36B$36B $32B$32B
Gross MarginGross Margin 22.2%22.2% 27.0%27.0% 29.2%29.2% 31.1%31.1%
Operating CostsOperating Costs 16.6%16.6% 22.1%22.1% 24.1%24.1% 25.9%25.9%
Operating ProfitsOperating Profits 5.2%5.2% 4.9%4.9% 5.1%5.1% 5.2%5.2%
Net IncomeNet Income 3.3%3.3% 2.2%2.2% 1.4%1.4% (2.5%)(2.5%)
Source: Company SEC filings, Kroger & Albertson’s through 3 quarters, Wal-Mart & Safeway reflect full FY2002

29AmericanLogistics.ppt
What Wal-Mart Has Done to Achieve its What Wal-Mart Has Done to Achieve its Growth . . . Beyond PriceGrowth . . . Beyond Price
Multi-format: Discount, Supercenters, Club, Neighborhood Multi-format: Discount, Supercenters, Club, Neighborhood Stores and on-line to address consumer purchase occasionsStores and on-line to address consumer purchase occasions
Maintains and USES a massive database to understand its Maintains and USES a massive database to understand its consumers and their shopping behaviorconsumers and their shopping behavior
• Assorts stores based on demographicsAssorts stores based on demographics
• Allows regional variances in products offeredAllows regional variances in products offered
Retail-tainment – “Fun place to Shop”Retail-tainment – “Fun place to Shop”
Bonds with suppliers to improve efficiency/lower pricesBonds with suppliers to improve efficiency/lower prices
Works to become part of the local communityWorks to become part of the local community
• Offers parking lots for local fundraisers (HS car washes, etc)Offers parking lots for local fundraisers (HS car washes, etc)
• Charitable donations to local causesCharitable donations to local causes

30AmericanLogistics.ppt
Other Winning Formats – Club StoresOther Winning Formats – Club Stores 2001 combined food sales of approximately $38.5B2001 combined food sales of approximately $38.5B
$B$B # Stores# Stores
SAM’sSAM’s $18.4$18.4 498498CostcoCostco $17.7$17.7 363363BJ’sBJ’s $2.4$2.4 130130
Business Model: Membership fees contribute as much as 80% of Business Model: Membership fees contribute as much as 80% of operating profits enabling cost + 10% retailsoperating profits enabling cost + 10% retails
Demographic Target: Small businesses and affluent consumersDemographic Target: Small businesses and affluent consumers
Positioning: High quality national brands and private labels at 10-Positioning: High quality national brands and private labels at 10-30% discounts to average market prices30% discounts to average market prices
Average Transaction Size: $80 - $85Average Transaction Size: $80 - $85
Penetration grew from 49 to 55% between 1996 and 2001; trip Penetration grew from 49 to 55% between 1996 and 2001; trip frequency grew from 8 to 10frequency grew from 8 to 10
31AmericanLogistics.ppt
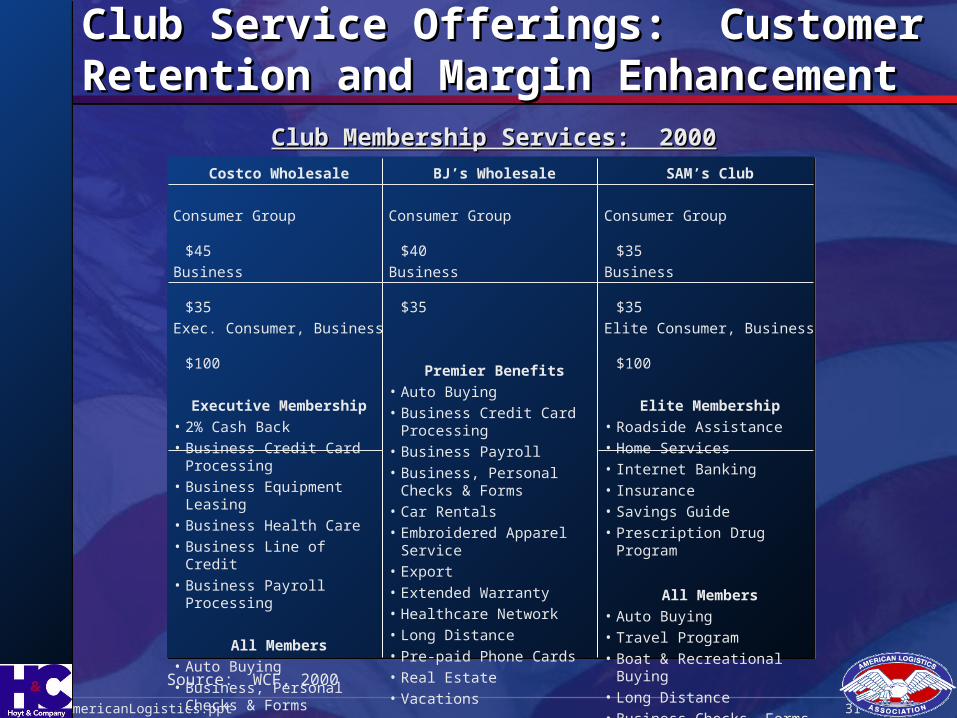
Club Service Offerings: Customer Retention Club Service Offerings: Customer Retention and Margin Enhancementand Margin Enhancement
Club Membership Services: 2000Club Membership Services: 2000
Source: WCF, 2000
Costco Wholesale
Consumer Group
$45
Business
$35
Exec. Consumer, Business
$100
Executive Membership
• 2% Cash Back
• Business Credit Card Processing
• Business Equipment Leasing
• Business Health Care
• Business Line of Credit
• Business Payroll Processing
All Members
• Auto Buying
• Business, Personal Checks & Forms
• Long Distance
• Mortgage
• Real Estate
• Smart Office
BJ’s Wholesale
Consumer Group
$40
Business
$35
Premier Benefits
• Auto Buying
• Business Credit Card Processing
• Business Payroll
• Business, Personal Checks & Forms
• Car Rentals
• Embroidered Apparel Service
• Export
• Extended Warranty
• Healthcare Network
• Long Distance
• Pre-paid Phone Cards
• Real Estate
• Vacations
SAM’s Club
Consumer Group
$35
Business
$35
Elite Consumer, Business
$100
Elite Membership
• Roadside Assistance
• Home Services
• Internet Banking
• Insurance
• Savings Guide
• Prescription Drug Program
All Members
• Auto Buying
• Travel Program
• Boat & Recreational Buying
• Long Distance
• Business Checks, Forms
• Mail Order pharmacy
• Internet
• Time Management

32AmericanLogistics.ppt
Other Winning Formats – Dollar StoresOther Winning Formats – Dollar Stores $15B channel dominated by Dollar General, Family Dollar and Dollar $15B channel dominated by Dollar General, Family Dollar and Dollar
TreeTree
TopTop100 Rank100 Rank SalesSales % Prev Year% Prev Year # Stores# Stores % Per % Per
YearYear
Dollar GeneralDollar General 3939 $5.3B$5.3B +17.0+17.0 5,5405,540+10.8+10.8Family DollarFamily Dollar 5353 $3.7B$3.7B +17.0+17.0 4,1414,141+12.3+12.3Dollar TreeDollar Tree 9090 $2.0B$2.0B +17.0+17.0 1,9751,975+14.2+14.2
Business Model: Quality closeouts, liquidation merchandise priced at Business Model: Quality closeouts, liquidation merchandise priced at 30-40% below market averages30-40% below market averages
Demographic Target: $30 - $50K, retirees and those on fixed incomesDemographic Target: $30 - $50K, retirees and those on fixed incomes
Positioning: “A new market beneath the standard discount market”Positioning: “A new market beneath the standard discount market”
Average transaction size: $9.00 (with most items priced around an Average transaction size: $9.00 (with most items priced around an even $1.00)even $1.00)

33AmericanLogistics.ppt
Dollar Stores (cont’d)Dollar Stores (cont’d) Big sellers:Big sellers:
• Greeting cards for $1.00 (vs. $2.00 - $2.95 elsewhere)Greeting cards for $1.00 (vs. $2.00 - $2.95 elsewhere)
• Soaps and detergentsSoaps and detergents
• Gift bagsGift bags
• WrapsWraps
• Hair careHair care
• VideosVideos
• Wine (in states where legal)Wine (in states where legal)
Now beginning to focus on food: Dollar General just added coolers in Now beginning to focus on food: Dollar General just added coolers in 1,400 stores to stock refrigerated and frozen.1,400 stores to stock refrigerated and frozen.
While targeted at the economically disadvantaged, Dollar Stores are While targeted at the economically disadvantaged, Dollar Stores are now starting to attract the affluent as everyone is looking for a now starting to attract the affluent as everyone is looking for a bargain these days.bargain these days.

34AmericanLogistics.ppt
Impact on U.S. SupermarketsImpact on U.S. SupermarketsImpact on U.S. SupermarketsImpact on U.S. Supermarkets
35AmericanLogistics.ppt
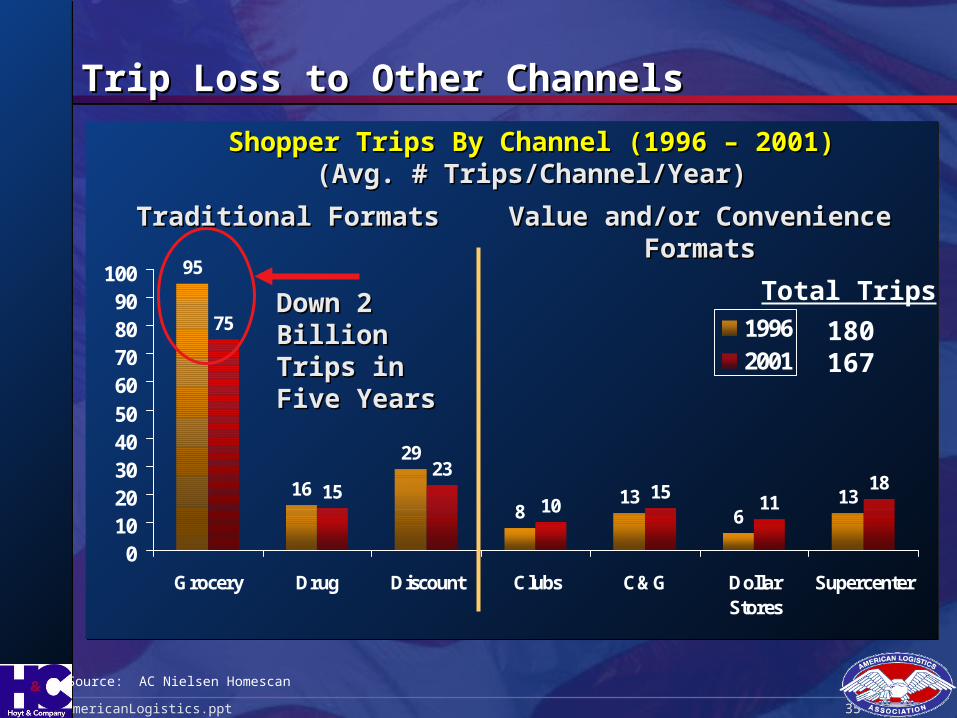
Trip Loss to Other ChannelsTrip Loss to Other Channels
Source: AC Nielsen Homescan
Shopper Trips By Channel (1996 – 2001)Shopper Trips By Channel (1996 – 2001)(Avg. # Trips/Channel/Year)(Avg. # Trips/Channel/Year)
95
16
29
813
613
75
1523
1015
1118
01020304050
60708090
100
Grocery Drug Discount Clubs C&G DollarStores
Supercenter
19962001
180167
Total TripsDown 2 Billion Down 2 Billion Trips in Five Trips in Five YearsYears
Traditional FormatsTraditional Formats Value and/or Convenience FormatsValue and/or Convenience Formats

36AmericanLogistics.ppt
Daily Conversions to SupercentersDaily Conversions to Supercenters
Source: ACNielsen Cross Outlet*Facts 2000; Total US
DRUG STORES3.4%
SUPERCENTERS13.4%
A/O30.9%
MASS MERCH W/O SUPERS
13.7%
DOLLAR STORES1.2%
GROCERY $2MM+30.5%
WAREHOUSE CLUBS
5.9%
CONV/GAS1.0%
-1.2
-0.2
-0.5
+2.1
-0.6
+0.3
+0.0
+0.1
Share/Share Chg of Supercenter Shopper $ by ChannelShare/Share Chg of Supercenter Shopper $ by Channel

37AmericanLogistics.ppt
Huge Share Losses in Traditional CategoriesHuge Share Losses in Traditional Categories
* 52 weeks ending in fiscal year* 52 weeks ending in fiscal year
Source: Procter & Gamble and “Growing The Center Store” AC NielsenSource: Procter & Gamble and “Growing The Center Store” AC Nielsen
GroceryGrocery
Mass MerchantsMass Merchants
Warehouse/ClubsWarehouse/Clubs
All Other OutletsAll Other Outlets
75.6%75.6%
13.1%13.1%
3.5%3.5%
7.8%7.8%
1989/19901989/1990
54.5%54.5%
26.9%26.9%
9.7%9.7%
9.0%9.0%
1998/19991998/1999
Channel Share Trends, 1999 vs. 1989*Channel Share Trends, 1999 vs. 1989*
Sales Lost Over 9 Year PeriodSales Lost Over 9 Year PeriodTotal of 9 Categories: Detergents, Hair Care, Paper Towels,Total of 9 Categories: Detergents, Hair Care, Paper Towels,
Dentifrice, Diapers, Coffee, Bath Tissue, Fabric Softener, Peanut ButterDentifrice, Diapers, Coffee, Bath Tissue, Fabric Softener, Peanut Butter

38AmericanLogistics.ppt
Success PrinciplesSuccess PrinciplesSuccess PrinciplesSuccess Principles

39AmericanLogistics.ppt
Value Retailers’ Success Ingredients – Value Retailers’ Success Ingredients – Common CharacteristicsCommon Characteristics
Business models that automatically differentiate Business models that automatically differentiate
No deviation from original business modelNo deviation from original business model
Focus on a specific consumer groupFocus on a specific consumer group
Fluid merchandising that maximizes quick rotation & Fluid merchandising that maximizes quick rotation & change – quick in-and-out, frequent “surprises” change – quick in-and-out, frequent “surprises”
Below-market acquisition costs, low operating expenses & Below-market acquisition costs, low operating expenses & below-market pricing consistencybelow-market pricing consistency
Leverage supplier dollars to keep prices low vs. enhance Leverage supplier dollars to keep prices low vs. enhance profitabilityprofitability
Willingness to settle for part of the pie – none attempt to Willingness to settle for part of the pie – none attempt to be all things to all people all of the timebe all things to all people all of the time
40AmericanLogistics.ppt
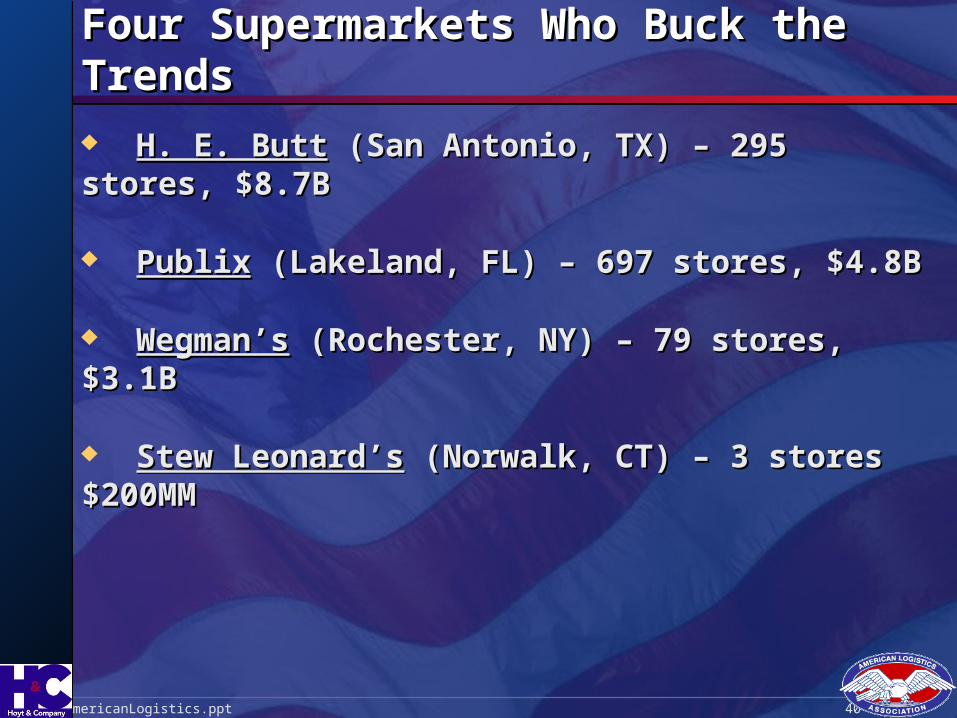
Four Supermarkets Who Buck the TrendsFour Supermarkets Who Buck the Trends
H. E. ButtH. E. Butt (San Antonio, TX) – 295 stores, $8.7B (San Antonio, TX) – 295 stores, $8.7B
PublixPublix (Lakeland, FL) – 697 stores, $4.8B (Lakeland, FL) – 697 stores, $4.8B
Wegman’sWegman’s (Rochester, NY) – 79 stores, $3.1B (Rochester, NY) – 79 stores, $3.1B
Stew Leonard’sStew Leonard’s (Norwalk, CT) – 3 stores $200MM (Norwalk, CT) – 3 stores $200MM

41AmericanLogistics.ppt
What These Four Companies Have in CommonWhat These Four Companies Have in Common Long-term thinkingLong-term thinking: All follow a strategy and resist reacting to daily : All follow a strategy and resist reacting to daily
threatsthreats
Customer FocusCustomer Focus: Base assortment & merchandising decisions on what : Base assortment & merchandising decisions on what their customers want, not on what their competitors are doing or ontheir customers want, not on what their competitors are doing or onthe latest hot dealthe latest hot deal
Strong Community TiesStrong Community Ties: All participate in & contribute to local : All participate in & contribute to local community events which they aggressively leverage in in-store community events which they aggressively leverage in in-store
merchandising and advertising activitiesmerchandising and advertising activities
Market-Leading InnovationMarket-Leading Innovation: On-premise restaurants, take-out food, : On-premise restaurants, take-out food, non-food merchandise “surprises”, self-scanning & self-checkouts and non-food merchandise “surprises”, self-scanning & self-checkouts and “traffic directors”“traffic directors”
Well-trained & Courteous EmployeesWell-trained & Courteous Employees: The customer is : The customer is always kingalways king
Store as a BrandStore as a Brand: Customers know what to expect and can “trust” the : Customers know what to expect and can “trust” the experience on every visitexperience on every visit
42AmericanLogistics.ppt
Moral of story:Moral of story:
It’s not just price; it’s a It’s not just price; it’s a combination of factors, carefully combination of factors, carefully blended and balanced to satisfy a blended and balanced to satisfy a
particular consumer need or particular consumer need or aspiration. Each retailer has to aspiration. Each retailer has to
search within its own strengths to search within its own strengths to find the right formula. There are find the right formula. There are
no easy answers.no easy answers.

We Appreciate The Time and Attention You We Appreciate The Time and Attention You Have Given Us TodayHave Given Us Today
Specifically, we want to thank Alan Nissalke and the Specifically, we want to thank Alan Nissalke and the American Logistics Association for inviting us and American Logistics Association for inviting us and
trust that this has been both fun and helpful.trust that this has been both fun and helpful.
8912 East Pinnacle Peak Road • Scottsdale, AZ 85255 Phone (480) 513-0547 • Fax (480) 513-0548 • E-Mail: [email protected] • [email protected]
www.hoytnet.com
44AmericanLogistics.ppt
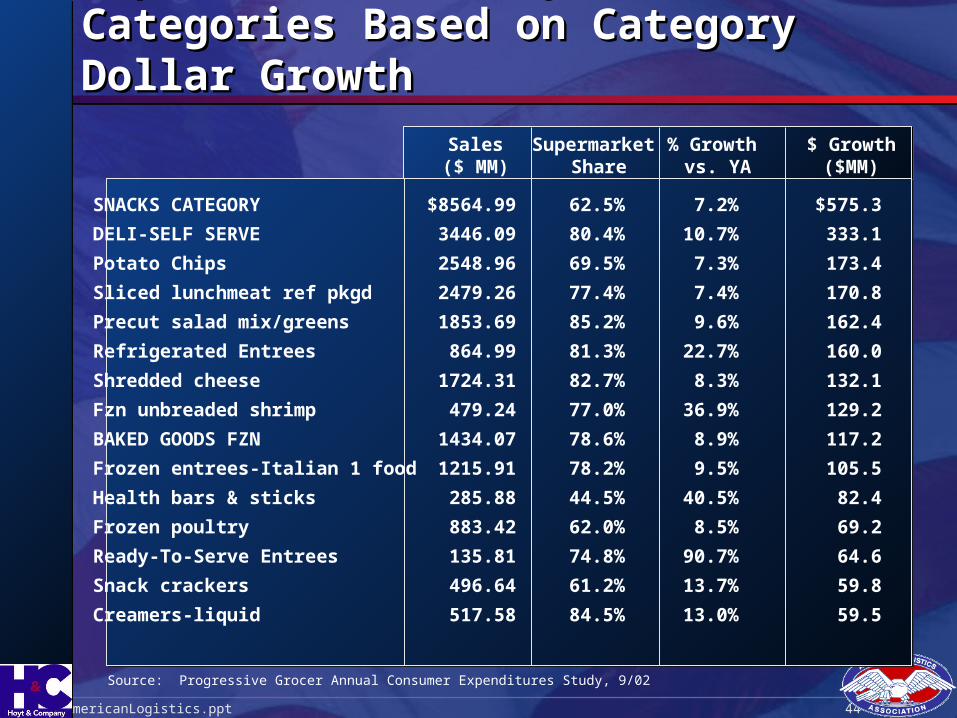
Top 15 “Quick, Easy, Convenient” Categories Top 15 “Quick, Easy, Convenient” Categories Based on Category Dollar GrowthBased on Category Dollar Growth
SNACKS CATEGORY
DELI-SELF SERVE
Potato Chips
Sliced lunchmeat ref pkgd
Precut salad mix/greens
Refrigerated Entrees
Shredded cheese
Fzn unbreaded shrimp
BAKED GOODS FZN
Frozen entrees-Italian 1 food
Health bars & sticks
Frozen poultry
Ready-To-Serve Entrees
Snack crackers
Creamers-liquid
$8564.99
3446.09
2548.96
2479.26
1853.69
864.99
1724.31
479.24
1434.07
1215.91
285.88
883.42
135.81
496.64
517.58
7.2%
10.7%
7.3%
7.4%
9.6%
22.7%
8.3%
36.9%
8.9%
9.5%
40.5%
8.5%
90.7%
13.7%
13.0%
$575.3
333.1
173.4
170.8
162.4
160.0
132.1
129.2
117.2
105.5
82.4
69.2
64.6
59.8
59.5
Sales($ MM)
% Growth vs. YA
$ Growth($MM)
62.5%
80.4%
69.5%
77.4%
85.2%
81.3%
82.7%
77.0%
78.6%
78.2%
44.5%
62.0%
74.8%
61.2%
84.5%
Supermarket Share
Source: Progressive Grocer Annual Consumer Expenditures Study, 9/02

45AmericanLogistics.ppt
Top 15 Ethnic CategoriesTop 15 Ethnic CategoriesBased on Category Dollar GrowthBased on Category Dollar Growth
Dry-mix Mexican tortillas
Frozen entrees-Mexican-1 food
Frozen entrees-Oriental-1 food
RTS -Oriental 2 foods
Canned Veg-tomatoes
Fruit drinks canned
Juice/drinks
Tequila
Sauces-Misc SS
Olives-black
Peppers
Dry-mix Mexican shells
Cooking sauce
RTS - Mexican specialties
Frozen entrees-Oriental-2 food
$803.92
461.23
437.94
234.64
332.95
120.28
343.17
370.83
93.34
222.36
175.33
169.21
137.22
76.93
20.76
10.4%
19.4%
10.3%
15.2%
9.8%
32%
9.0%
8.2%
25.1%
7.5%
9.4%
7.3%
9%
12.5%
66%
$75.7
74.9
40.9
31.0
29.7
29.2
28.3
28.1
18.7
15.5
15.1
11.5
11.3
8.5
8.3
83.8%
68.8%
76.2%
83.3%
79.4%
71.7%
68.1%
29.6%
71.2%
81.4%
76.3%
84.8%
78.2%
80.3%
84.1%
Sales($ MM)
% Growth vs. YA
$ Growth($MM)
Supermarket Share

46AmericanLogistics.ppt
Top 15 Health CategoriesTop 15 Health CategoriesBased on Category Dollar GrowthBased on Category Dollar Growth
BOTTLED WATER CATEGORY
YOGURT CATEGORY
Yogurt
Diet Carbonated Bev
Hot Cereal
Yogurt shakes/drinks
Sugar substitutes
Water purifiers/filters
Refrigerated veg juice
Insect repellents
Dietetic Choc Candy
Wasp & hornet killers
Nectars
Refrigerated pineapple juice
Flying insect spray
Roach traps & motels
$2282.17
2280.34
2185.06
881.56
834.38
95.28
237.19
55.62
10.62
36.79
15.25
17.71
24.74
10.28
12.99
2.27
19.8%
11.0%
9.7%
10.1%
7.1%
51.2%
11.3%
10.3%
80.3%
11.4%
24.5%
20.3%
8.5%
22.0%
12.3%
123.8%
$377.2
226.0
193.2
80.9
55.3
32.3
24.1
5.2
4.7
3.8
3.0
3.0
1.9
1.9
1.4
1.3
59.4%
83.2%
83.4%
79.6%
79.2%
77.3%
57.5%
14.0%
59.2%
24.3%
27.7%
30.9%
93.0%
96.1%
38.6%
na
Sales($ MM)
% Growth vs. YA
$ Growth($MM)
Supermarket Share
47AmericanLogistics.ppt
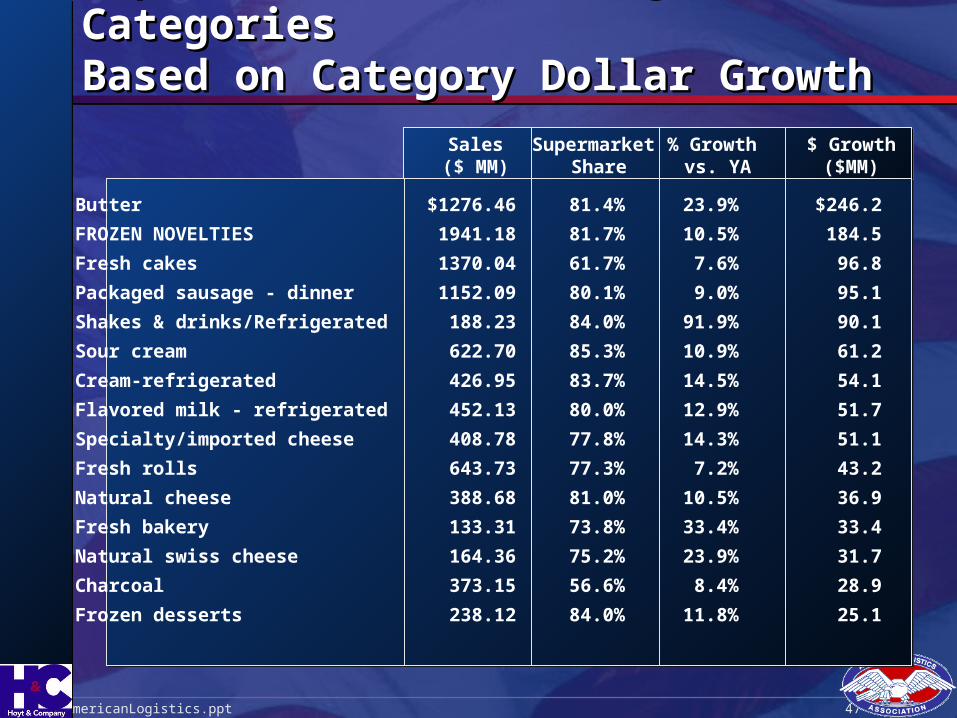
Top 15 “Personal Indulgence” CategoriesTop 15 “Personal Indulgence” CategoriesBased on Category Dollar GrowthBased on Category Dollar Growth
Butter
FROZEN NOVELTIES
Fresh cakes
Packaged sausage - dinner
Shakes & drinks/Refrigerated
Sour cream
Cream-refrigerated
Flavored milk - refrigerated
Specialty/imported cheese
Fresh rolls
Natural cheese
Fresh bakery
Natural swiss cheese
Charcoal
Frozen desserts
$1276.46
1941.18
1370.04
1152.09
188.23
622.70
426.95
452.13
408.78
643.73
388.68
133.31
164.36
373.15
238.12
23.9%
10.5%
7.6%
9.0%
91.9%
10.9%
14.5%
12.9%
14.3%
7.2%
10.5%
33.4%
23.9%
8.4%
11.8%
$246.2
184.5
96.8
95.1
90.1
61.2
54.1
51.7
51.1
43.2
36.9
33.4
31.7
28.9
25.1
81.4%
81.7%
61.7%
80.1%
84.0%
85.3%
83.7%
80.0%
77.8%
77.3%
81.0%
73.8%
75.2%
56.6%
84.0%
Sales($ MM)
% Growth vs. YA
$ Growth($MM)
Supermarket Share