SCIENCE NEWS Magnitude 6.3 - CENTRAL ITALY Magnitude 6.3 - CENTRAL ITALY.
/7?y
The Operating Characteristics of Minipermeameter and
Its Ability to Investigate The Small Scale
Permeability Heterogeneity
by
Mohammed Athar Suboor
Submitted in Partial Fulfillment of
the Requirement for the Degree of
Master of Science in Petroleum Engineering
New Mexico Institute Of Mining and Technology
Socorro New Mexico 87801
March 1994
PRRC LIBRARY COPY

bBIiGnSiiVllVCObA

1
TABLE OF CONTENTS
List of Figures iii
List of Tables v
Acknowledgements vi
Abstract ix
Chapter 1. Introduction 1
Chapter 2. Literature review 9
Chapter 3. Characteristics of the PRRC automatic minipermeameter 20
3.1 Minipermeameter device 20
3.2 Flow analysis of minipermeameter 24
3.3 Parameters for calculating permeability 29
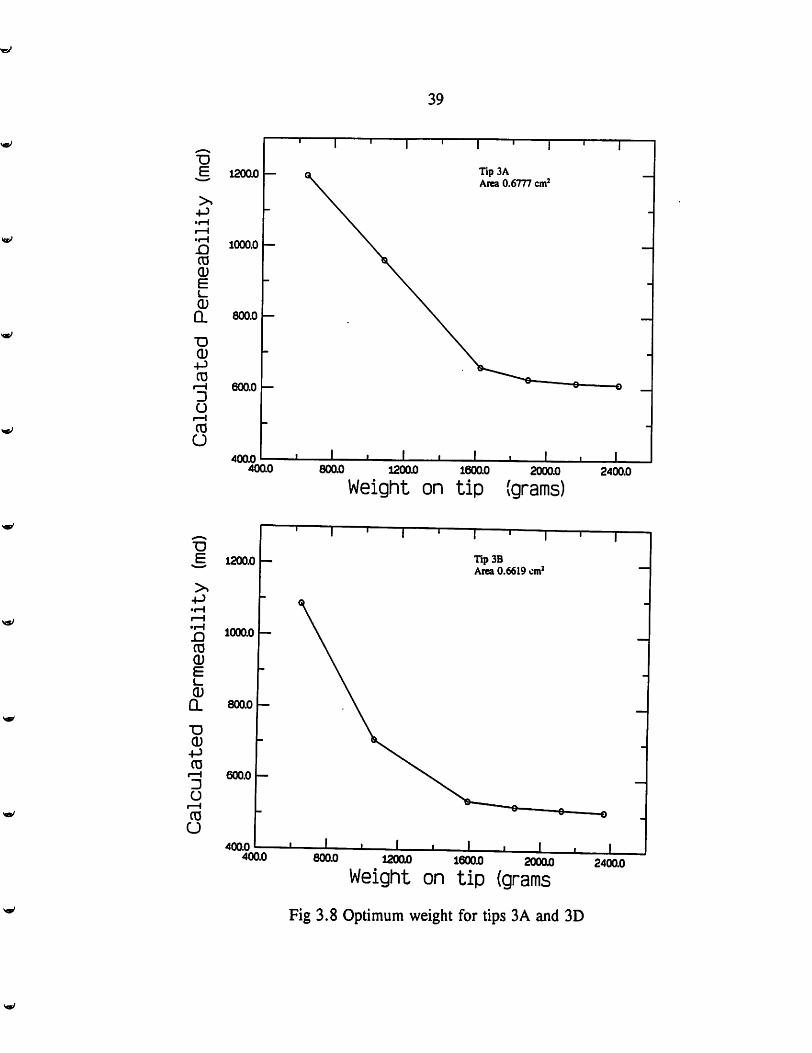
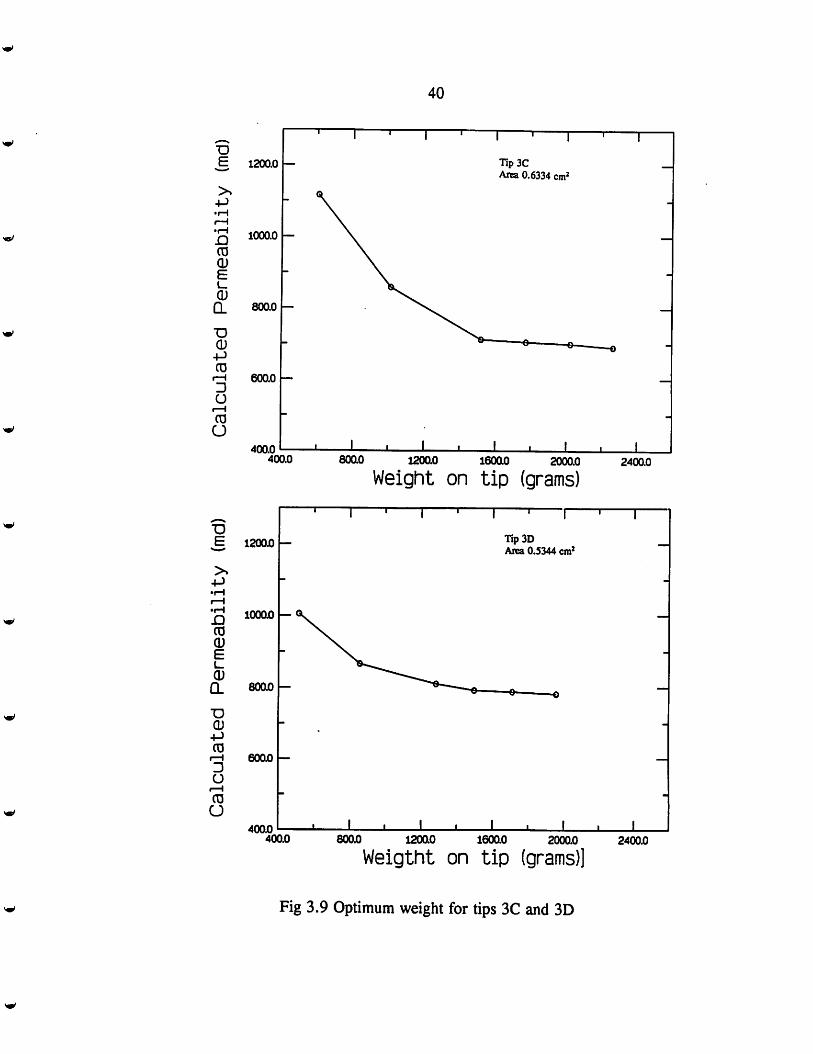
3.4 Optimum weight on the tip 32
3.5 Repeatability in permeability measurements 41
Chapter 4. Investigation of flow geometry for minipermeameter 45
4.1 Radius of investigation laterally from the tip 45
4.2 Air-Permeameter device 50
4.3 Depth of investigation of minipermeameter 55

11
4.4 The Practical Limits of Measurements for different tips 61
4.5 Computation of Flow Geometry 73
Chapter 5. Investigation of small scale heterogeneity 76
5.1 Small scale permeability heterogeneity 77
5.2 Influence of measurement spacing on measured value of permeabilty 78
5.3 Investigation of vertical heterogeneity of permeability 87
Chapter 6. Conclusion and Recommendations 105
6.1 Conclusion 105
6.2 Recommendations 107
Table of Nomenclature 109
References Ill

m
List of Figures
Figure 1.1 Minipermeameter flow geometry and gas streamlines 6
Figure 2.1 Darcy's fluid flow apparatus 9
Figure 3.1 PRRC Automatic Scanning Minipermeameter 22
Figure 3.2 Goggin Geometrical Factor 27
Figure 3.3 The Syringe Minipermeameter 30
Figure 3.4 Tip conditions under which air might leak or not leak 35
Figure 3.5 Optimum weight vs tip area 36
Figure 3.6 Optimum weight for tip 2A and 2B 37
Figure 3.7 Optimum weight for tip 2C and 2D 38
Figure 3.8 Optimum weight for tip 3A and 3B 39
Figure 3.9 Optimum weight for tip 3C and 3D 40
Figure 3.10 Repeated measurements of permeability 43
Figure 3.11 Permeability measurements at two different Scales 44
Figure 4.1 Plot for lateral radius of Investigation 48
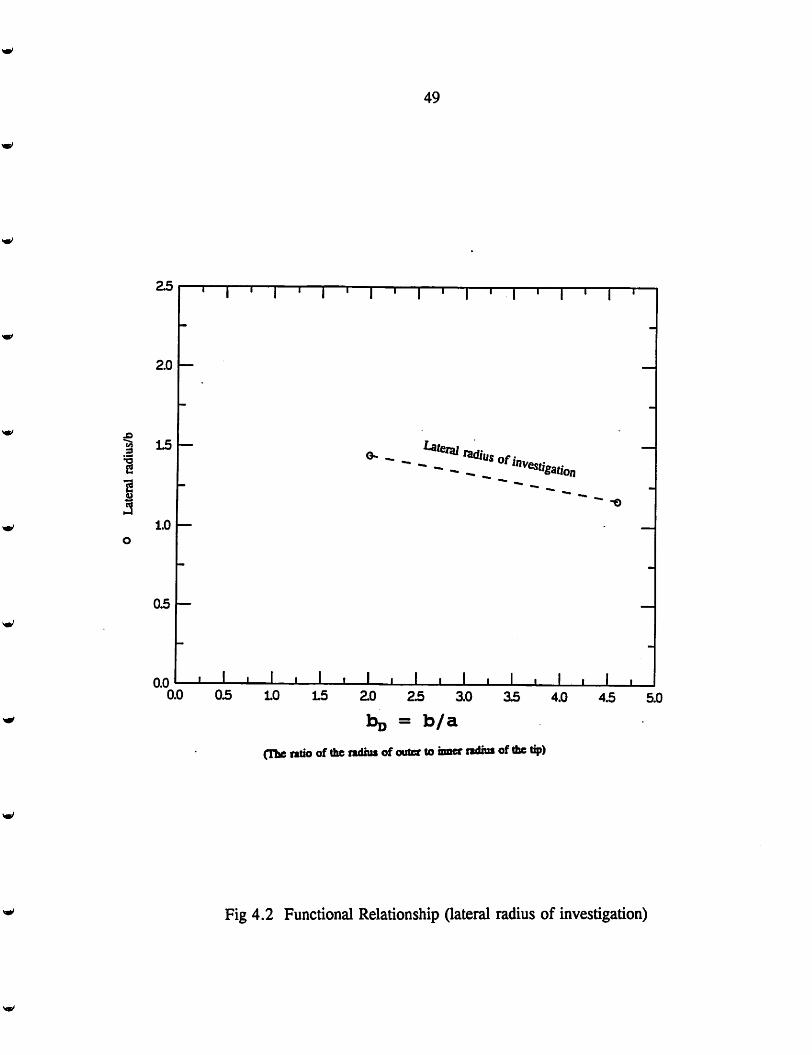
Figure 4.2 Functional Relationship (lateral radius of investigation) 49
Figure 4.3 A set-up for Air- permeameter 52
Figure 4.4 Permeability of pack of glass beads measured by Air- Permeameter 54
Figure 4.5 Functional Relationship (depth of investigation) 63
Figure 4.6 Practical limits of measurements for different tips 64

iv
Figure 4.7 Depth of investigation of minipermeameter 69
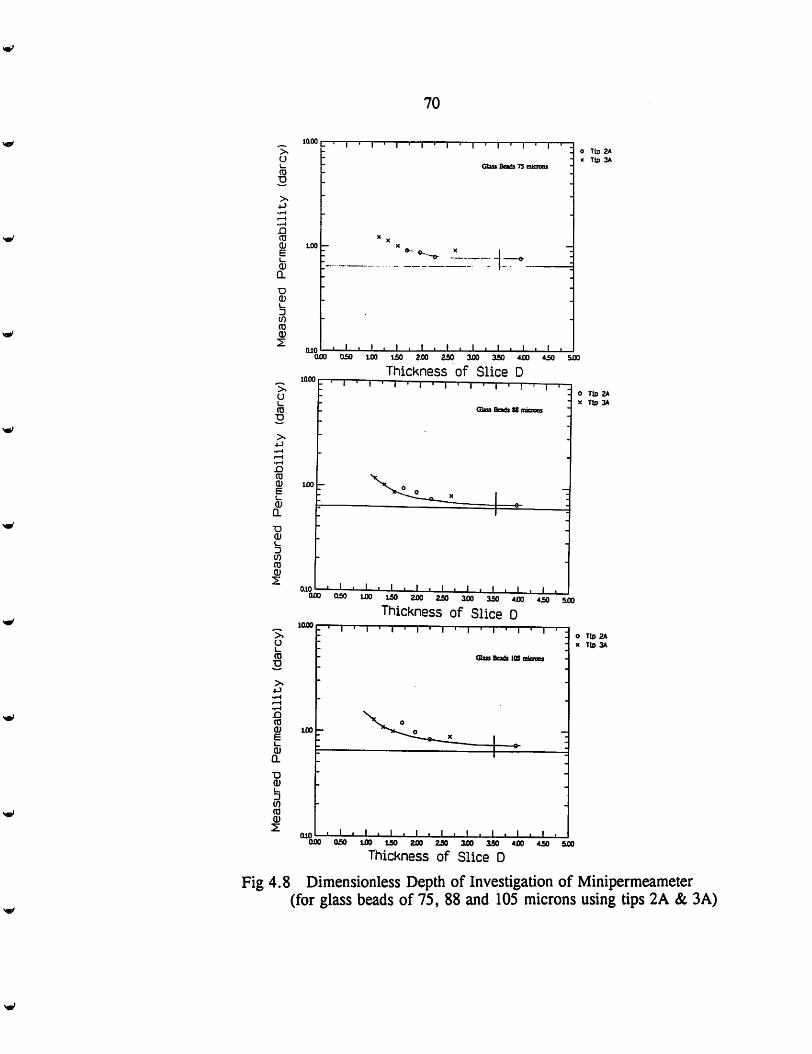
Figure 4.8 Depth of investigation of minipermeameter 70
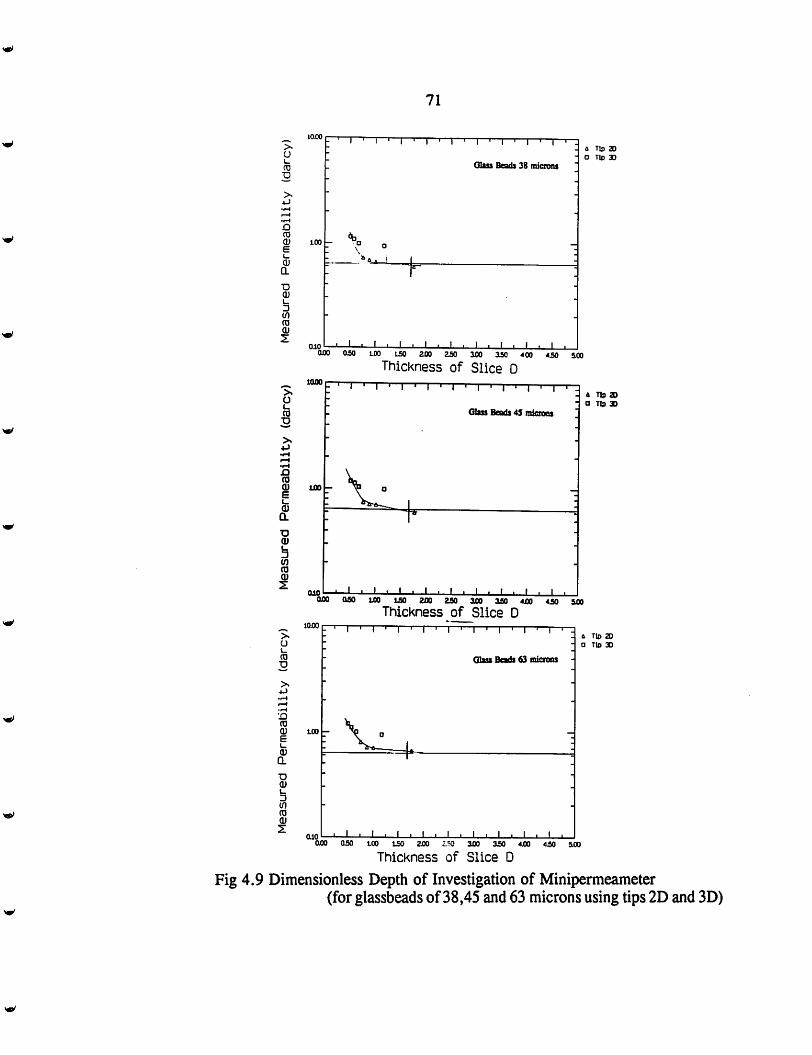
Figure 4.9 Depth of investigation of minipermeameter 71
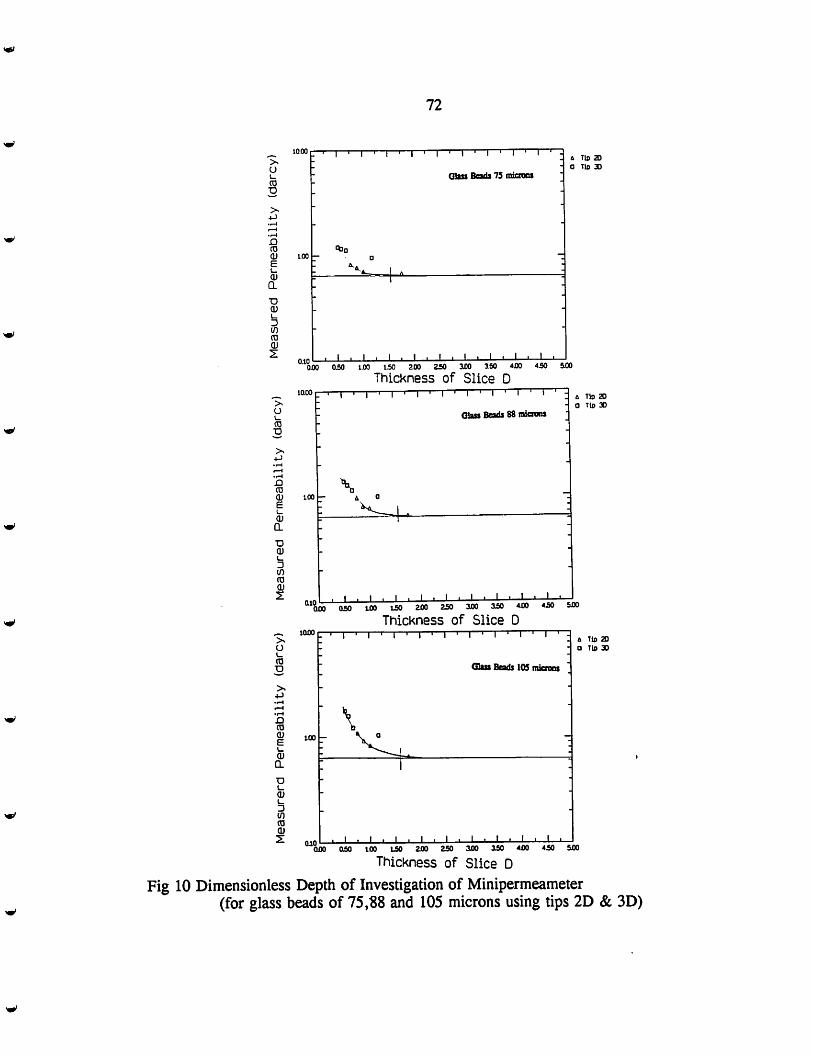
Figure 4.10 Depth of investigation of minipermeameter 72
Figure 4.11 Grayscale plot of pressure distribution 75
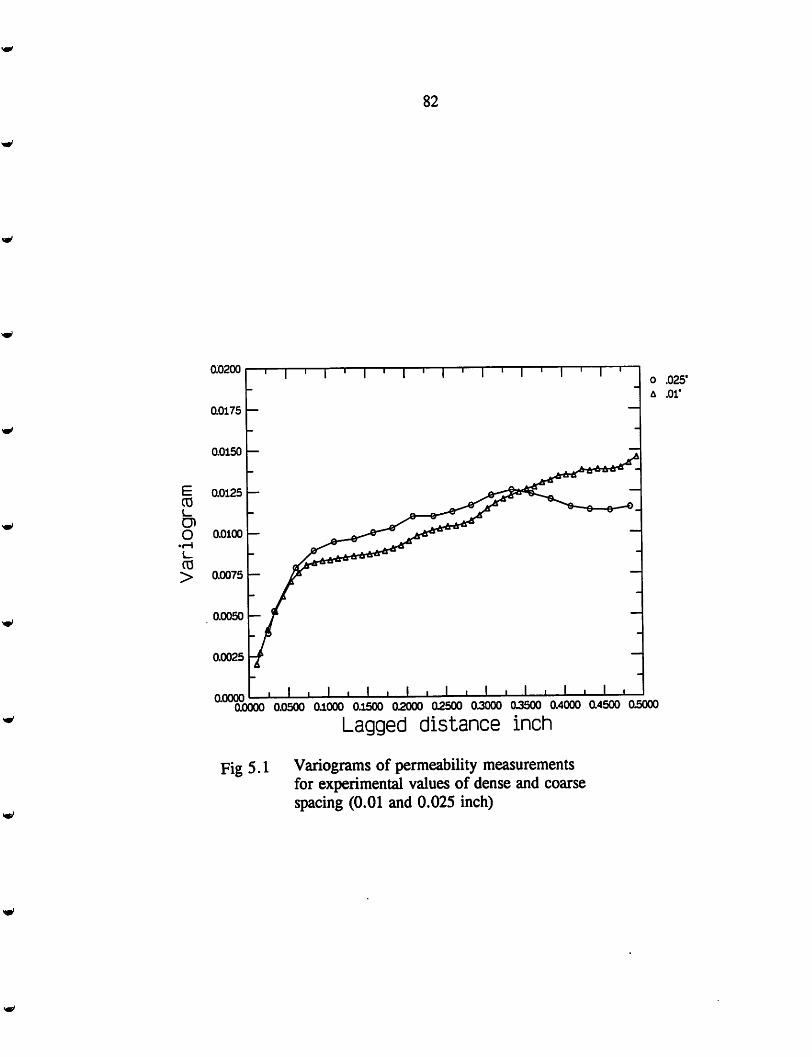
Figure 5.1 Variograms of perm.measurements for exp. values dense/coarse 82
Figure 5.2 Variograms of perm.measurements for comp. values 83
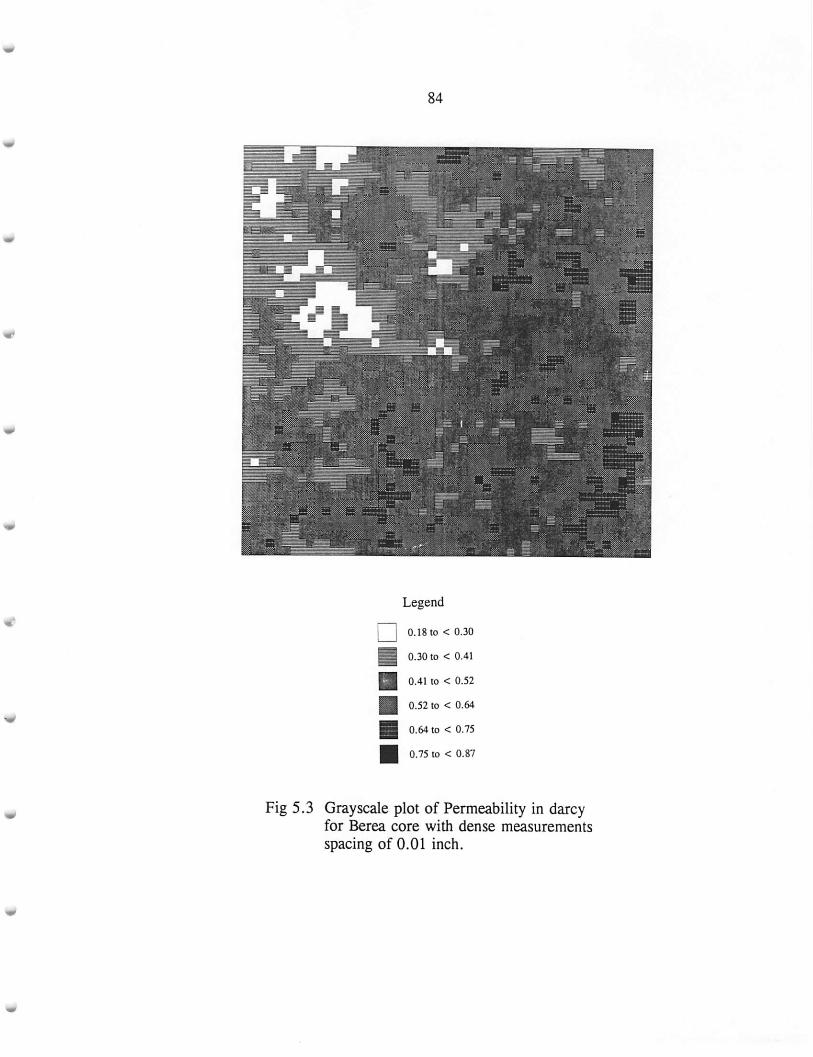
Figure 5.3 Grayscale plot for Berea core with dense measurement spacing 84
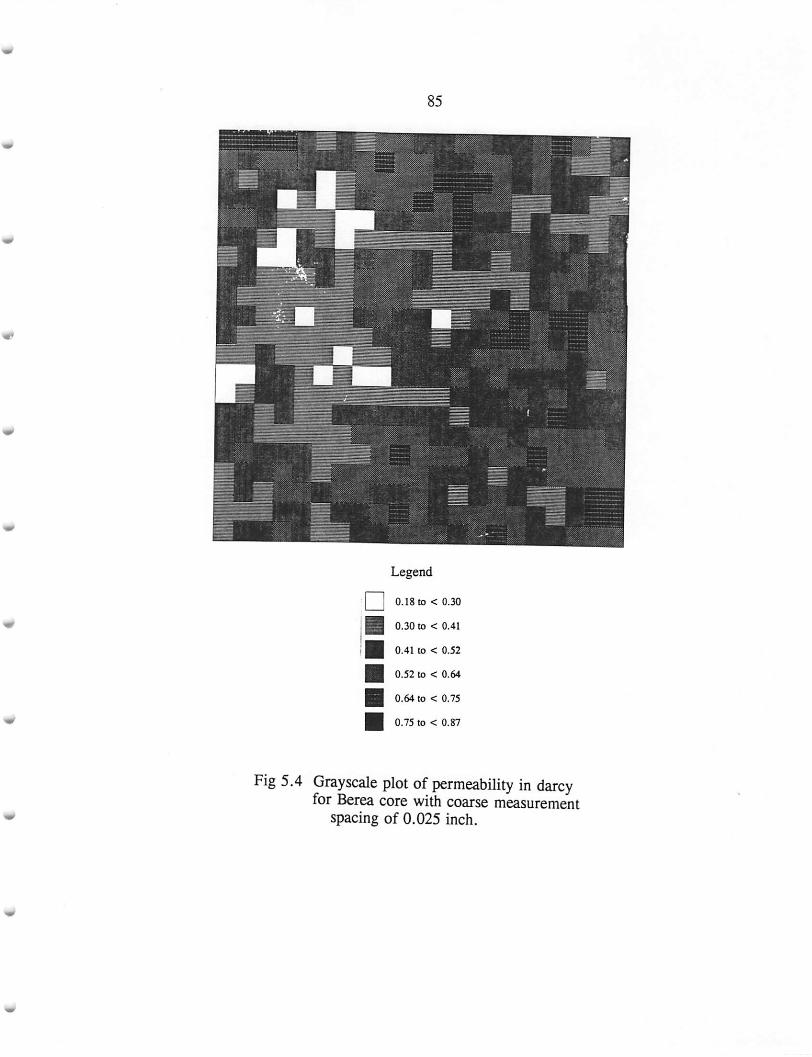
Figure 5.4 Grayscale plot for Berea core with coarse measurement spacing 85
Figure 5.5 Histogram of measured permeability values at dence/coarse spacing 86
Figure 5.6 Permeability data of Berea layers 91
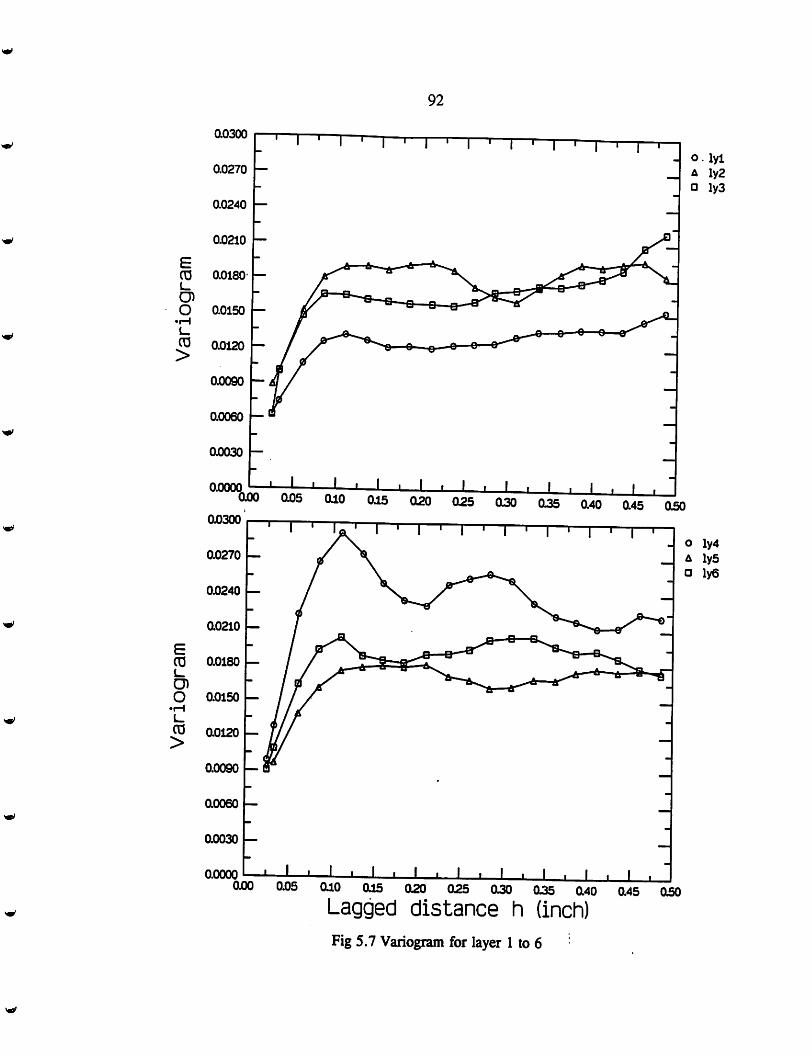
Figure 5.7 Variogram for layer 1 to 6 92
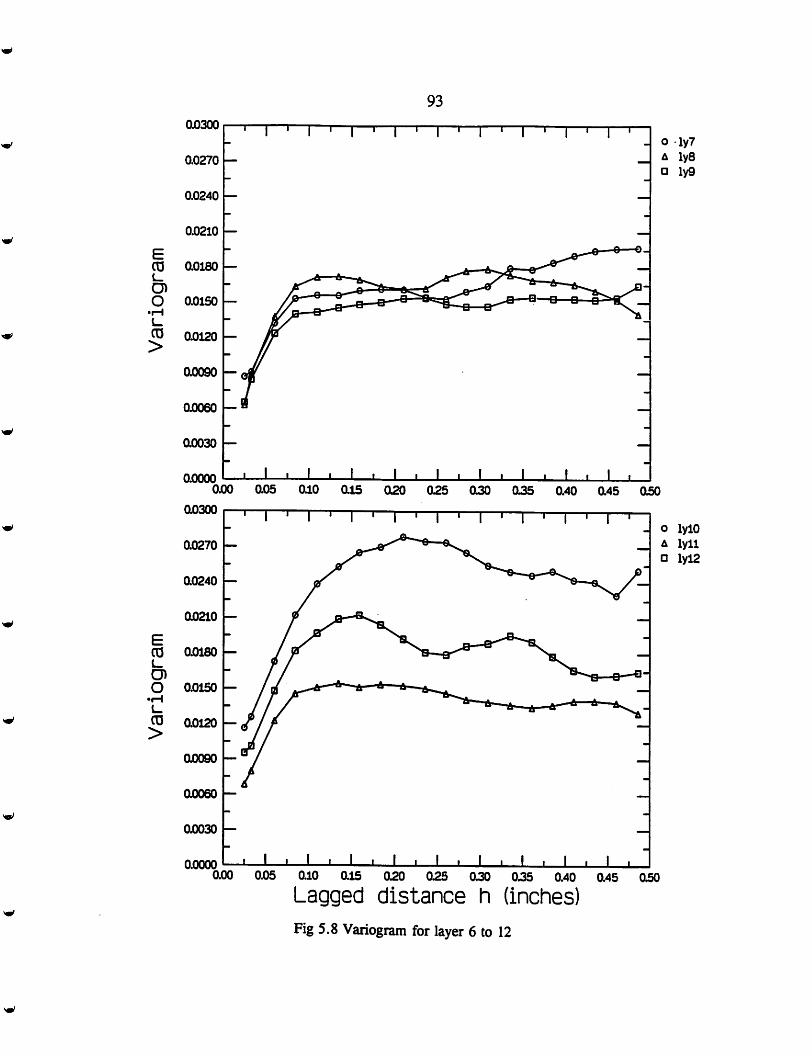
Figure 5.8 Variogram for layer 6 to 12 93
Figure 5.9 Grayscale plot for permeability of 1st and 2nd layer 94
Figure 5.10 Grayscale plot for permeability of 3rd and 4th layer 95
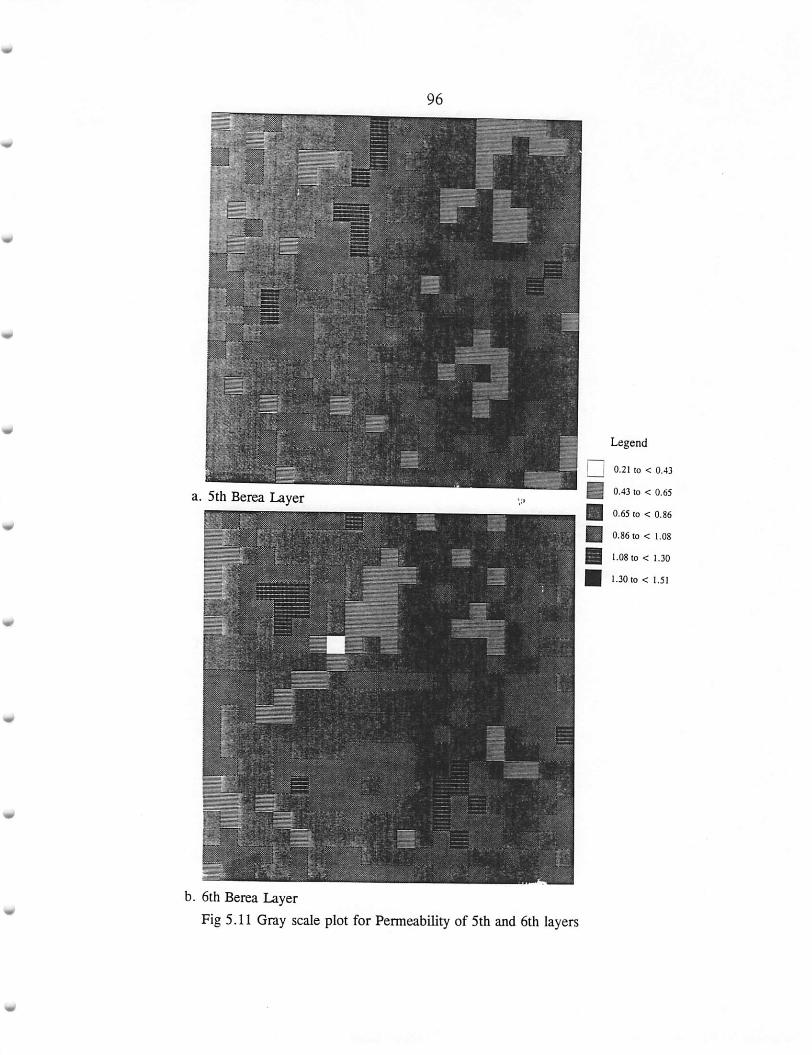
Figure 5.11 Grayscale plot for permeability of 5th and 6th layer 96
Figure 5.12 Grayscale plot for permeability of 7th and 8th layer 97
Figure 5.13 Grayscale plot for permeability of 9th and 10th layer 98
Figure 5.14 Grayscale plot for permeability of 11th and 12th layer 99
Figure 5.15 Histogram for Berea Layers 1-7 100
Figure 5.16 Histogram for Berea Layers 7-12 101

List of Tables
Table 3.1 Optimum weight for each tip 32
Table 4.1 Air-permeability data for glass beads 51
Table 4.2 Dimensions of tip used in experiments 57
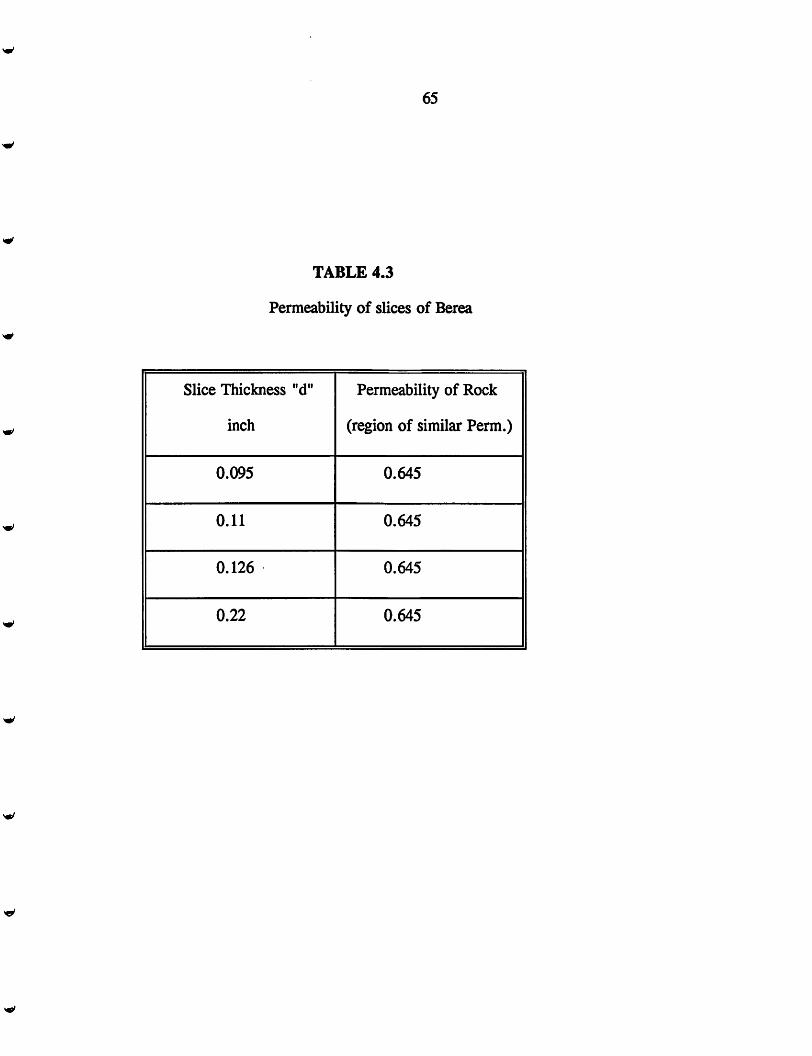
Table 4.3 Permeability of slices of Berea 63
Table 4.4 Measured permeability for two layers(tip bj)=4.5) 64
Table 4.5 Measured permeability for two layers(tip bp=2) 65
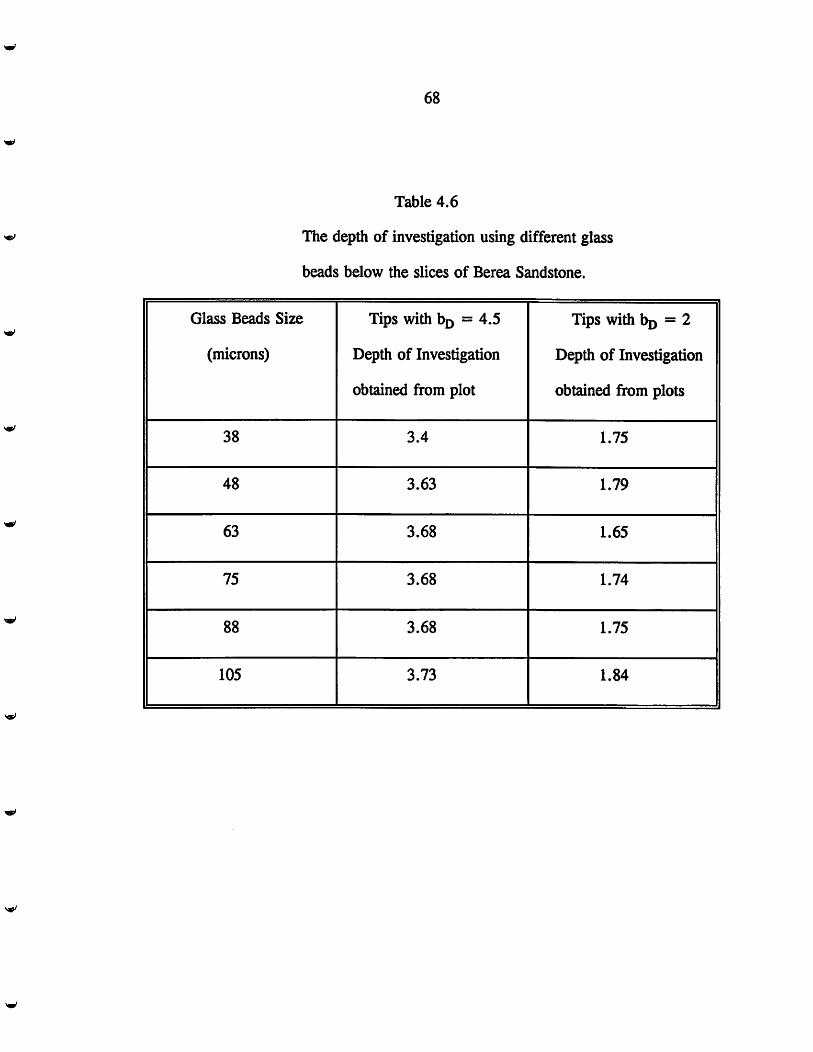
Table 4.6 The depth of investigation 66
Table 5.1 Permeability data of Berea core at coarse and dense spacing 79
Table 5.2 Computed Permeability data at coarse and dense spacing 88
Table 5.3 Permeability data of Berea layers 90
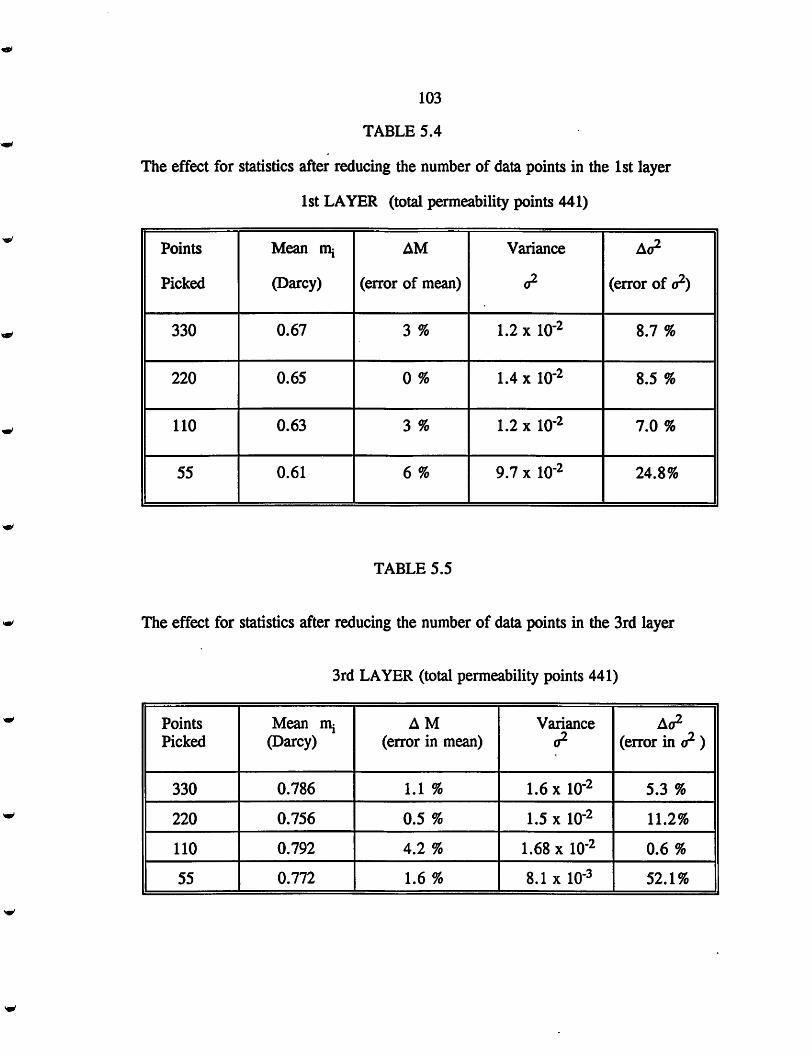
Table 5.4 Reduced permeability data points for 1st layer 103
Table 5.5 Reduced permeability data points for 3rd layer 103
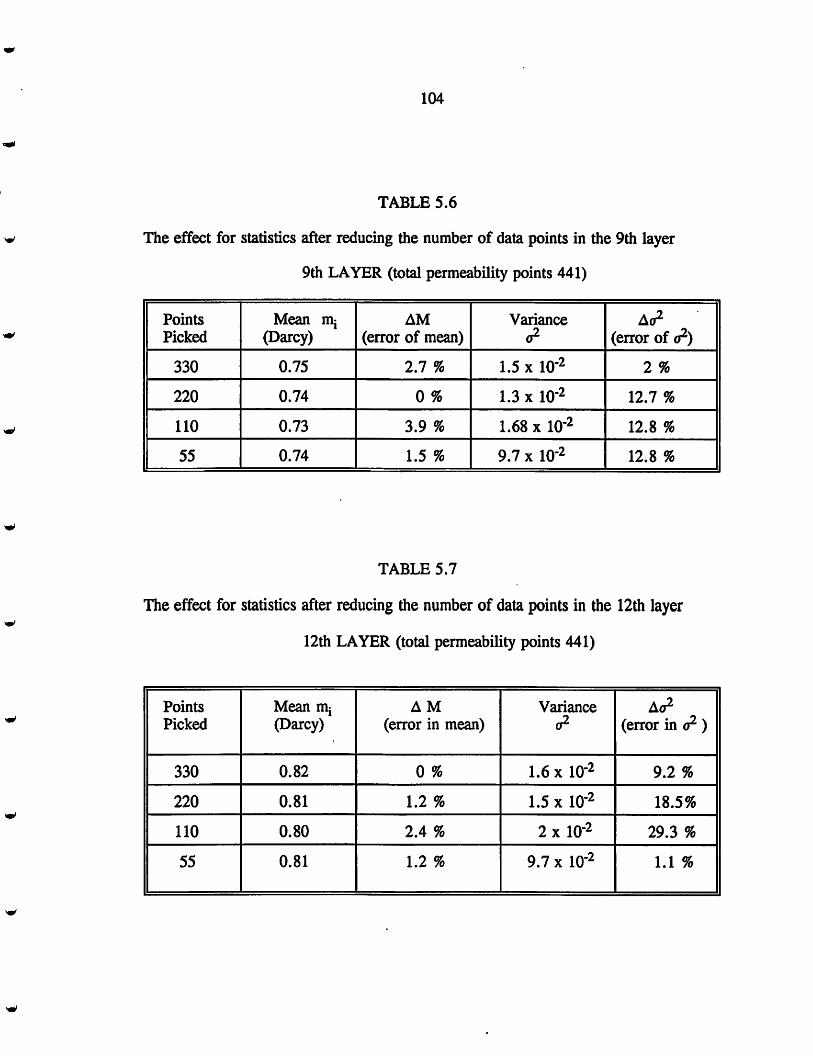
Table 5.6 Reduced permeability data points for 9th layer 104
Table 5.7 Reduced permeability data points for 12th layer 104

VI
ACKNOWLEDGEMENTS
I would like to express the deepest gratitude and indebtedness to my research advisor Dr.John
P. Heller for his continuous guidance and encouragement, giving the freedom to pursue the
research, helping in collecting data, providmg the financial support throughout the course of this
research.
I also wish to thank the members of my thesis committee Dr.William Lyons, Dr Reid
Grigg and Dr Larry Teufel for their time, encouragement and valuable suggestions throughout
the course of this work.
I feel espicially indebted to Mr Ted Morgan of TEXACO and Mrs Cathy A Morgan, their help
and support has been invaluable.
Special thanks are extended to Dr Ahmed Guenes, Dr Saleem Ghous Khan Ghori and Dr Ahmad
Junaid Sultan. I also acknowledge my colleagues for their helpful discussion and suggestions.
Deep gratitude is expressed to Jim McLemore, Robert Nickel, Floyd Hewitt, John Duncan and
Tariq Ahsan for doing much of work in constructing the minipermeameter.
The author is indebted to the Petroleum Recovery Research Center (PRRC) for the financial
support during the course of this study. Much appreciation is due to staff of PRRC and

Vll
Petroleum Engineering Department of NMIMT for their help in research and study.
Thanks to my wife Mahjabeen for her love, support and encouragement I thank my beloved
daughter Wajiha and son Bilal for their patience and love.
Finally, I am deeply indebted to my parents for their education, love, prayer and moral
support.

Vlll
Dedicated to my parents

IX
ABSTRACT
The heterogeneity of a reservoir is one of the most important characteristics that influences the
oil recovery. These variations exist at all scales, ranging from formation level to scale of few
pores. The most important aspect of reservoir heterogeneityis the permeability variations which
influences the performance of the displacement process.
The minipermeameter is used for measurement of permeability both in the laboratory and field
application where localized measurements are needed to characterize the spatial distribution of
permeability. The operating characteristics of the minipermeameter are studied. The size and
shape of the region measured by the minipermeameter is found experimentally, to show the
magnitude of the spatial range of measurement of the instrument with real rock.
The influenceon measured value of permeability by using differenttip sizesat the same surface
location of a sample is also studied. In addition to the magnitude and occurrence of natural
variability in the rock, several instrumental sources of measurement variability are studied .
Once the operating conditions of the minipermeameter are known, the capability of the device
to obtain permeability measurement on a very small scale is investigated. The heterogeneity
within reservoir core sample is measured with precision at the very small measurement intervals
of 1.25 X 10'̂ inch. The small scale permeability minipermeameter measurements made in this
study at a close spacing over the surface of many samples revealed that most reservoir rocks

exhibits significant heterogeneity.
The vertical heterogeneity of permeability in a core was also investigated in this thesis. There
was no trend of permeability, however the limiting variances for each layer vary significantly.

CHAPTER 1
INTRODUCTION
The knowledge ofpermeability variations in reservoir rock is a very important, if not the
most important, reservoir property for obtaining optimum recovery in the exploitation
of reserves. An objective of this work is to examine the small-scale heterogeneity of an
apparently uniform rock sample by measuring permeability and using an automatic
minipermeameter. A further objective is to define the operating characteristics of the
minipermeameter itself.
For enhanced oil recovery, detailed information about the permeability of a reservoir is
an important characteristic that affects oil recovery. Permeability of a heterogeneous
reservoir should be precisely determined to show how fluids are moving in the reservoir
to help design highly efficient enhanced oil recovery projects. Reservoir heterogeneities,
suchas fractures, channels, and highpermeability streaks, can cause early breakthrough
of injected water or gas, which will have an adverse effect on oil recovery. An
apparatus for measuring local permeabilities of consolidated reservoir samples was
described in 1950by Dykstraand Parsonsusing the principleof steady-state flowthrough
the rock. This was the first form of minipermeameter.

2
Dykstra and Parsons measured local permeability at the surface of core samples taken
from a sandstone oil reservoir and examined the effect of local permeability variations
on the recovery of oil by waterflood. They investigated the distribution of permeability
of the end face of a core plug, finding significant variability even on this relatively small
area, and noticeable correlation between uniformity of the core and effectiveness of oil
recovery by waterflood.
Later, Eijpe and Weber (1971) and Chandler et al, (1986) constructed and used
minipermeameters for laboratory use and field measurements of permeability manually.
In these measurements, the air flow rate is measured by a rotameter and the permeability
of the sample rock is derived firom this flow rate and applied pressure. Daltaban et al.
(1989) developed an electronic field minipermeameter in which the flow rate is
determined using a series of laminar flow elements and a macromanometer. The
injection pressure is measured using an electronic pressure transducer positioned at the
injection tip. For a given laminar flow element and a given pressure differential, the
drop in pressure along the flow element is proportional to the flow rate. Using this
relationship, the gas law and an experimentally derived calibration of macromanometer
reading permeability values are calculated. Halvorson and Hurst (1990) constructed an
automatic minipermeameter to perform permeability measurements on center-cut cores.
A completely computer controlled automatic scanning minipermeameter was developed
at the Petroleum Recovery Research Center (PRRC), which is used in this study of small-
scale permeability heterogeneity (Heller, 1992). For this apparatus, the time is measured

3
for a known volume of air to flow into and through the rock through a small tip at a
known, constant pressure.
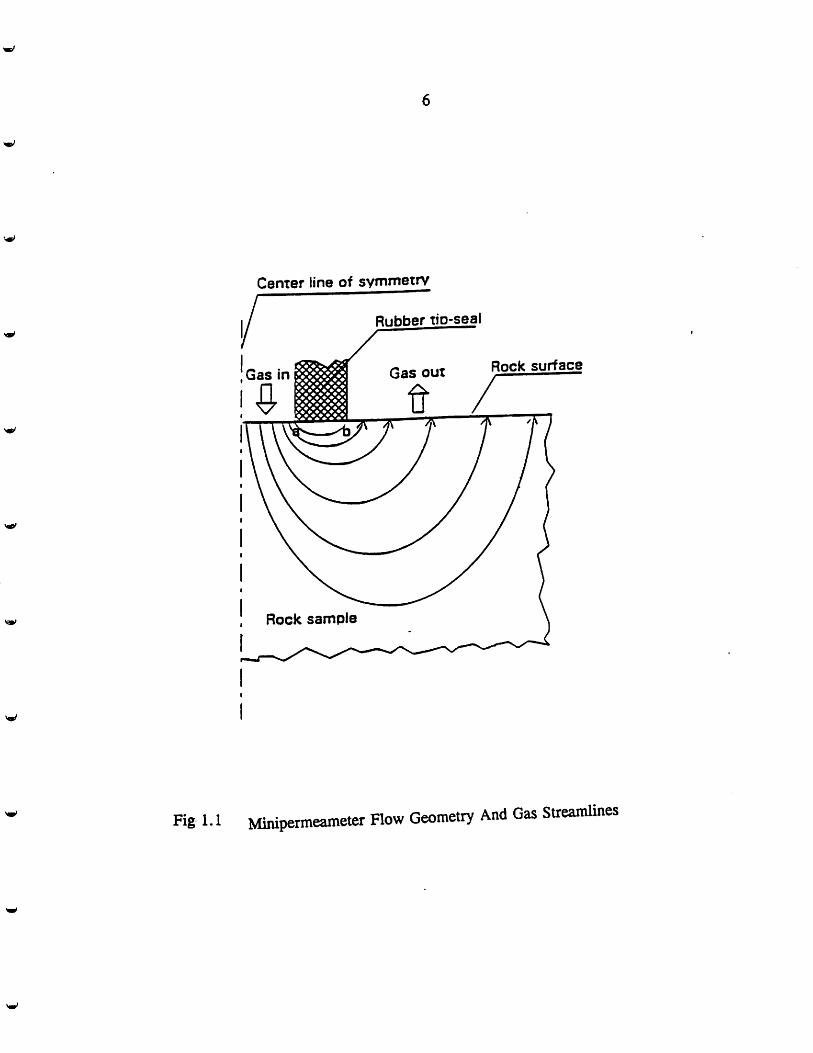
The distinguishing feature of minipermeameters is the geometry of the flow—air flows
out through a small tip into the rock directly below the tip and out again through the
same slabbed surface at various distances from the tip Fig 1.1. Although the
permeability of the rock is expected to be proportional to the ratio of the flow rate to the
pressure function, the value of proportionality constant is not evident in this nonlinear
geometry. Goggin (1988) used a numerical simulation technique to compute the
geometric factor that should be substituted into a modified form of Darcy law to allow
computation of permeability from a steady-state measurement of gas/flow rate and
injection pressure. This geometrical factor G is defined in Goggin's work for placement
of the tip in the center of one face of a conventional cylindrical core. Under these
circumstances, G is primarily a function of bo, (ratio of the outside to the inside radii
of the tip) and to someextent as a function of the dimensionless core samplelength and
the dimensionless core sample radius.
Chen (1992) further developed the above work to measure not only the local permeability
but also the porosity at approximately the same location of the rock. The permeability
measurement is done under a steady-state flow and the porosity is determined under a
transient flow. Chen treated the dimensionless length and radius (that is distance of the
tip from outside boundary) to be large enough so that the difference between the values

4
of G computed for these conditions is less than 0.2%. In this the case the geometric
factor G only depends on the dimensionless tip-seal radii.
The numerical computations by Goggin and by Chen involved solution of the partial
differential equation for flow of an ideal gas in the characteristic geometry of the
minipermeameter. The differential equation was derived from the Darcy's Law, and is
based on the usual assumption that both rock and fluid are mathematically continuous and
devoid of internal structure, and that the porous sample is homogeneous in its properties
within the region of investigation. In the usual use of Darcy's Law for the measurement
of permeability in a sample cut into a right circular cylinder, the ^region of investigation'
is clearly defined. For the minipermeameter, on the other hand, this region is not
immediately evident. It is one of the purposes of this work to define at least the ^practical
limits' of this region.
Information on permeability variability in a heterogeneous reservoir evaluated on a core
is best obtained by minipermeameter, which gives a rapid localized nondestructive
measurement with a highresolution. It can be used to supplement conventional core plug
measurements of permeability, which are generally analyzed by Hassler/Sleeve
measurements that provide overall average permeability measurements for the core.
Customarycore analyses generallyrepresent measurement ofonly one small samplefrom
each foot of core. Instead of such a limited number of measurements, an approximately
continuous log of permeability data can be collected by using the minipermeameter.

5
which can give more information about core permeability without increasing the cost.
It is difficult to detect high and low permeabilities in a laminated reservoir using
conventional methods. Minipermeameter data can be used to evaluate the degree of
permeability heterogeneity present and show when conventional data might be sufficient
for characterization ofa reservoir. The automatic minipermeameter allows high volumes
of permeability data to be collected without an increase in cost. This data improves the
understanding of permeability distribution, the zonation of a reservoir, and can help in
the accurate small scale characterization of a reservoir.
The minipermeameter measurements made in this and other studies at a close spacing
over the surfaces of many samples have revealed that most reservoir rock exhibits
Center line of symmetry
Rubber tin-seal
Gas in Gas out
Rock sample
Rock surface
Fig 1-1 Minipermeameter Row Geometry And Gas Streamlines

7
significant heterogeneity. This study continues the collection of such data, and also
describes the capability of the minipermeameter to perform permeability measurements
on a very small scale to investigate heterogeneity within reservoir core samples.
Permeability measurements carried out for identification of this heterogeneity are
constrained by the flow geometry of injected air in the sample rock. In this
investigation, the size and shape of the region measured by the minipermeameter is
investigated. The experimental study is hampered by the presence of heterogeneities
even in the very small volume of rock directly below the tip and in the surrounding rock
outside and below the main region of investigation for even apparently uniform rock. For
instance, regularly spaced permeability measurements taken on Berea core along a
diameter line of0.5 inch, with increments ofonly 1.25 x 10"^ inch, show a permeability
variation from 434 to 1400 md.
In addition to the magnitude and occurrence of natural variability in the rock, several
instrumental sources of measurement variability are studied in this thesis.
Another instrument variation is caused by the proximity of the tip to the edge of the core.
The influence of this, and of the type of boundary condition (free flow or no-flow) are
examined. The general question of the size and shape of the region which is examined
by the minipermeameter is also studied both experimentally and computationally.
Although the former of these is made uncertain by the lack of any perfectly uniform rock
samples, it was possible in both cases to consider the apparent permeability of structures

8
consisting of two layers, of different permeabilities and thickness, and to use this effect
to estimate the *depth of investigation' below the tip.
The measurements taken by an automatic minipermeameter help to accurately determine
a quantitative small scale description of permeability distribution in a reservoir rock.

CHAPTER 2
LITERATURE REVIEW
In 1856, Darcy studied the vertical flow of water through packed sand filter beds and
found that the volumetric flow rate of water was directly proportional to the head of
water above the outlet pipe at the base of the filter.
A schematic drawing of the equipment used is shown in Fig 2 .
WATER
• V • ^
Ah
SAND
-29—•-•'w
Fig 2.1 Darcy's fluid flow apparatus
10
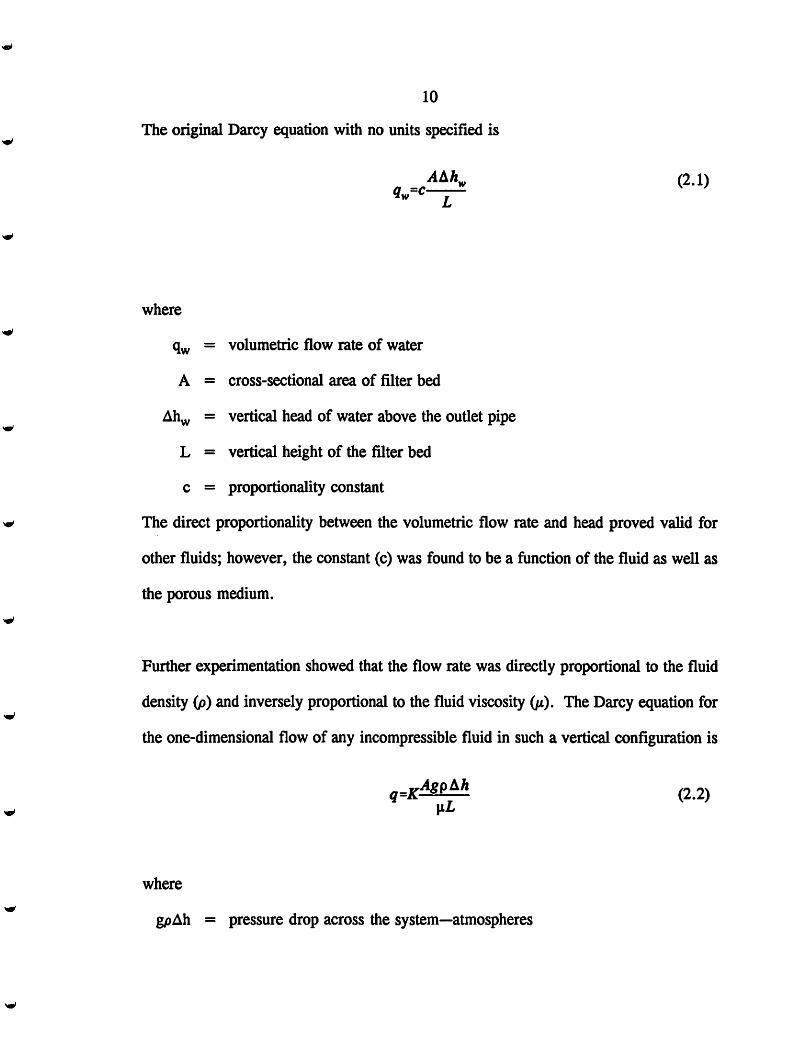
The original Darcy equation with no units specified is
(2.1)"w r
where
q^ = volumetric flow rate of water
A = cross-sectional area of filter bed
Ah^ = vertical head of water above the outiet pipe
L = vertical height of the filter bed
c = proportionality constant
The direct proportionality between the volumetric flow rate and head proved valid for
other fluids; however, the constant (c) was found to be a function of the fluid as well as
the porous medium.
Further experimentation showed that the flow rate was directiy proportional to the fluid
density (p) and inversely proportional to the fluid viscosity (jt). The Darcy equation for
the one-dimensional flow of any incompressible fluid in such a vertical configuration is
(2.2)|iL
where
gpAh = pressure drop across the system—atmospheres

11
By including the acceleration of gravity in the pressure drop term gpAh, the
proportionality constant (K) is, to first approximation, a function of the porous medium
only and is termed the permeability of the medium. The unit of permeability, the darcy,
is defined by the sentence "A porous medium with a superficial cross-section area of
1cm"^ and a length ofone cm has apermeability ofone darcy if fluid ofone cp viscosity
flows at the rate of one cc per second under a pressure drop of one atmosphere." The
permeability, K, as it appears in Eq. (2.2) is the absolute permeability, measured when
only one fluid is present in the porous medium. Eq. (2.2) was developed for the gravity
flow of fluid through a vertical porous medium, where the gravity factor gpAh represents
the pressure drop in the direction of flow. During fluid flow problems that are
encountered in reservoir engineering, the flowing pressure gradient can be in any
direction. If gravity forces are important, the force causing flow in a vertical direction
is the vector sum of the pressure imposed gradient and gravity forces. This resultant
force is often called the flow potential (^). If the flow is in a level system and gravity
is not important, we can use the externally imposed pressure for flow potentials.
The Darcy law, for the flow of an incompressible fluid, in terms of pressure at the inlet
and outlet ends of the system, is
q = (2.3)liL
where
q = flow rate in cc/sec
jLt = viscosity in cp.

12
pQ = the pressure at the inlet end—atmospheres
Pl = the pressure at the outlet end—atmospheres
L = length of core in cm.
In contrast to that for a liquid the gas volumetric flow rate varies with pressure and the
value for q at average pressure in the core must be used in Eq. (2.3). To convert gas
volumes at the mean pressure to gas volumes at a given base pressure P|„ and the term
Qis introduced for gas flow rate in cm^/sec ofpressure, P|,.
Substituting this in Eq. (2.3)
Q ^ (Pq^Pl)q ' 2P,
rr 2QL^P^or K = —
Mvl-vl)
(2.4)
(2.5)
where
K = permeability of rock sample in darcies
The darcy law gives average value of permeability K in the region under examination.
Reservoirs have complicated shapes and nonuniform permeabilities and porosities. Most
reservoirs are deposited from water (although some are buried sand dunes or Eolian
deposits) and are layered because of variations that existed in the depositional

13
environment. Slow moving water deposits mostly small-grain particles at specific
locations, but when the water is moving much faster, only relatively large particles are
deposited at the same place. This results in a vertical series of dissimilar units called
strata. Conditions also vary from one location to another at the same time during
deposition, resulting in lateral as well as vertical changes within the rock unit. Both
vertical and lateral changes in rock properties result in variations in porosity fluid
distribution, and permeability to fluids.
Cardwell and Parsons (1944) estimated a single equivalent permeability for a
heterogeneous oil reservoir, or a portion thereof, whose actual permeability varies in an
irregular manner. The equivalent permeability lies between the harmonic and arithmetic-
volume average of the actual permeabilities. The effective permeability of the formation
around a wellbore lies between a volume-harmonicand volume-arithmetic average of the
core-sample permeabilities. When the permeability variations away from a well are
unknown, it is reasonable to assume that the equivalent permeability of a heterogeneous
oil reservoir lies between the harmonic-depth average and the arithmetic-depth average
of the core-sample permeabilities.
Greenkom and Johnson (1960) analyzed natural sandstone reservoir cores and showed
that thickness, permeability, and porosity can have large variations over a relatively small
area. The variation of permeability changes extremely with in small areas. The
variations are quite large, both areally and vertically. Also variation of porosity is
14
significant within small areas. Change in variation of porosity, both areally and
vertically is also significant.
Knutson (1961) coordinated a logging-coring program which yielded significant formation
characterization data for the San Miguel sandstone reservoir. He showed that good
evaluation of core measurement deviations are required to determine the well drainage
area and field variations.
Warren, Skiba, and Price (1961) compared core-analysis permeabilities to those
determined from a pressure buildup test. The results showed that the permeability
measurements are significant in the qualitative determination of the nature of the
heterogeneity that exists in a reservoir. More accurate core data, improved pressure
buildup testing, and independent determination ofanisotropy are needed to obtain a better
reservoir description.
Warren and Price (1961) studied the effect of the disposition of heterogeneous
permeabilities on a single-phase flow for a known permeability-distribution function and
attempted to infer the presence and probable configuration of heterogeneities from core
analysis and pressure buildup data. A three-dimensional model was used in which the
block permeabilities were randomly arranged. The fiow equations were solved
numerically and the results were interpreted statistically. They concluded that the most
probable behavior of a heterogenous system approaches that of a homogenous system
with a permeability equal to the geometric mean of individual permeabilities. Also, a

15
qualitative measure of the degree of heterogeneity and its spatial configuration are
obtained from a comparative study of core analysis and pressure build-up data.
Bums (1969) showed that a vertical test can determine the in-situ vertical and horizontal
permeabilities of tested zones and the effectiveness of tight zones as a barrier to vertical
flow can also be determined directiy by the harmonic average across layers of different
permeabilities of actual vertical permeability of each layer. The measured value of
vertical permeability can appear to be low if the well has skin damage or if partial shale
barriers are present in the tested interval, and can be higher in case of a poor cementjob
behind the casing.
Kamal (1979) discussed the use of pressure transient tests to obtain quantitative reservoir
description for homogenous and heterogeneous reservoirs. He recommended the use of
the parameter estimationtechniqueto analyzepressure-transientdata from a heterogenous
system.
Weber (1982) collected data on shale continuity as a function of the environment of
deposition and used four methods for determining the effective vertical permeability of
a distribution of shale in porous media, and achieved consistent results in similar models
both in two and three dimensions.
Begg and King (1985) demonstrated that the effective vertical permeability is strongly
dependent on shale dimension, shale density, and facies thickness.

16
Giordano et.al (1985) showed that a finite difference simulator can accurately model the
qualitative behavior of non-steady flows if the permeability distribution, and viscosity
behavior of the process are properly accounted for. Their work suggests that qualitative
agreement could be obtained if the permeability distribution on a finer scale could be
measured.
Weber (1986) determined that the key to the analysis of heterogeneity is the correct
identification of the environment of deposition and digenetic history. The author suggests
that information for quantification of heterogeneity can be obtained with the aid of cores,
logs, analogue models, conceptual modeling and reservoir production tests. The enhanced
oil recovery projects have shown that heterogeneities cannot be neglected and simple
averaging procedures rarely lead to the expected results.
Goggin et al. (1986) described the minipermeameter as an excellent field device for the
detailed sampling of large outcrops and showed that the mean permeability is a strong
function of three stratification types—grainflow, wind-ripple, and interdune—in eolian
deposits.
Lewis (1988) indicated that the reservoir data obtained from cores are insufficient in most
cases for accurate prediction and quantification of reservoir heterogeneity. In order to
understand the scale and magnitudeof reservoir heterogeneity, it should be quantified in
large two-dimensional, and preferably three-dimensional, exposed outcrops ofanalogous

17
sediments. A minipermeameter was used for taking the permeability measurements of
outcrops in their studies.
Martin and Evans (1988), while investigating permeability distributions in Rotliegentes
sandstone, found that plug measurements were incapable of adequately describing
permeability variations.
Robertson and McPhee (1990) made a comparison of permeability distribution in a
heterogeneous reservoir using conventional core-plug data and the automatic
minipermeameter data and found that the minipermeameter can provide a more accurate
estimate ofcore heterogeneity and can identify very thin permeability zones which cannot
be identified by core plug measurements alone.
Bahralolom (1991) Investigated the variability of rock properties at small scale using
computerized imaging techniques. The comparison of spatial variability of field and
laboratory permeability measurements to find the relationship of small to large scale
permeability heterogeneity, suggested that the variograms made from large scale data
includes the small scale variability as a major component.
Bahralolom and Heller (1992) discussed the implication of small-scale heterogeneities on
displacement, or coreflood experiments. In addition to measuring the permeability and
porosity variations by a variety of ways, they calculated the apparent dispersion that

18
would be observed in a miscible flood of a rock containing permeability heterogeneities
correlated along the length of a flow sample.
Ghori and Heller's (1992) experimental work used a minipermeameter to measure areal
permeability on grid points. Rock sample permeability was measured at the top and
bottom surfaces ofa block of sandstone using the minipermeameter. A tracer experiment
was performed and tracer output curves were obtained at the outlet of the rock sample.
The minipermeameter data was used in the numerical simulation. The tracer curves
obtained from simulations were compared with experimental ones and good agreement
between the two showed that the flow of tracer was mainly affected by permeability
variations. This experiment showed that reliable permeability data can be obtained by
the minipermeameter.
Ghori (1992) Describe a basis on which well-to-well tracer tests can be used to obtain
quantitative information about the geostatistical parameters (variance and correlation
length) of permeability. One of his conclusion is that a comparison of the numerical and
experimental tracer curves indicates that the tracer outputcurves are affected mainly by
permeability variation.
Jones (1992) designed a new fast minipermeameter for measurement of permeability in
a range from 0.001 to 20,(XX) md. This instrument is modified to reduce the
permeability measurement time by removing the flow controller and using reservoirs of
different calibrated volumes. The time rate of pressure decay as nitrogen flows from any

19
one or all of these reservoirs through the probe and into the sample yielded a direct
measure of the sample's permeability. It reduced the time required for the low
permeability samples from 20 minutes to 20 seconds and the uncertainty of all
measurements was reduced to ±5%.
Heller (1992) introduced the PRRC automatic scanning minipermeameter. For this
instrument, both the air supply and the means for flow measurement are achieved by the
use of a simple glass syringe and pressure is calculated based on the weight on the
syringe plunger. All other minipermeameters use a compressed gas source and flow
meters to determine the flow rate, q, and pressure transducers or mechanical gauges to
measure the pressure difference, Ap. The PRRC automatic scanning minipermeameter
is simple and moreeconomical than similardevices that are commercially available and
used in other laboratories.
Chen, Mclemore and Heller (1993) developed the Miniporopermeameter for simultaneous
measurement of permeability and porosity, The capability of minipermeameter is further
expanded to measure porosity as well. Immediately aftercalculation of the permeability,
and under deflned conditions, a precise value of the porosity at same portion of rock is
computed from the transient pressure change thatis observed at theprobe-tip aftercutting
off air supply into the rock from the probe.

20
CHAPTERS
CHARACTERISTICS OF THE PRRC AUTOMATIC MINIPERMEAMETER
In this chapter, characteristics of the minipermeameter are described. The accuracy of
the measurement and the size and shape of the region measured by the minipermeameter
are investigated. The minipermeameter can perform permeability measurements on very
small and large areas of rock samples with high measurement density, precision, and
accuracy. An air-permeameter is also briefly described, which is used to determine the
permeability of packed glass beads, that are used in an auxiliary experiment.
3.1 MINIPERMEAMETER DEVICE
The minipermeameter used in this study is a completely computer controlled automatic
scanning minipermeameter which was designed by Dr. John Heller of New Mexico
Tech's Petroleum Recovery Research Center (Heller, 1992). In this device, both the air
supply and the means for flow measurements are achievedby the use of an ordinary glass
syringe (an air pump is used to fill the syringe prior to measurement) with a weighted
plunger. The syringe minipermeameter is mounted on a movableinstrument carriage that
scans over a table holding the rock sample. The table is also movable in a direction at
right angles to the direction in which the instrument carriage moves. The maximumscan
area is 22 x 22 inches. Measurements can be taken at minimum spacing of 1.25 x 10'̂
inch in X-direction and 1 x 10"^ inch in Y-direction.

21
The device is computer controlled. Sensors and actuators are mounted with the probe
and syringe on the instrument carriage, and a digital control card is located inside the
computer. The program to control the operation of the device is written in Turbo Pascal.
The minipermeameter has a vertically moving probe with an interchangeable silicone
rubber tip that is pressed against the face of the rock surface to measure permeability.
Oneof theparameters thataffects thepermeability measurement is the quality of theseal
between the injection tip and the rock surface. To provide a good seal between the rock
surface and the tip, an optimum weight is placed on the probe to press it against the rock
surface. The optimum weight depends not only on the tip size and the ratio of outer to
inner radii (that is, on the area of the rubber in contact with the rock), but also on the
permeability of the rock. Ali (1993) determined optimum weights for earlier version of
tip design. The total time interval (T) that is required to inject the fixed volume of air
is a characteristic of the permeability of that portion of the rock sample underneath the
injection tip.

I
Fig 3.1 PRRC Automatic Scanning Minipermeameter.

23
Figure 3.1 Shows the parts of PRRC minipermeameter.
A: Complete setup of PRRC minipermeameter along with control box and the computer.
B: A close up of minipermeameter.
C: Syringe,plunger and the weights on the plunger.
1. Aluminum frame
2. Steel table
3. Long screw to move the steel table
4. Diaphragm air pump
5. Stepping motors
6. Probe
7. Silicone rubber tip
8. Slotted weights
9. Glass syringe
10. Weights on the syringe plunger
11. Slot detector
12. Photographic film

24
3.2 FLOW ANALYSIS OF MINIPERMEAMETER.
To obtain accurate measurement of permeability it is critical to acheive a steady state
condition for flow of gas/air in the porous rock. The steady state condition can be
affected by the non-steady, vertical movement of the plunger. The leakage that may
occur between the interface of the syringe and plunger, and between the rubber tip seal
and the rock surface can void an assumption that air flows only through the rock. In
addition, the time required for the air flow to reach steady state condition needs to be
determined.
In absence of any leak between the syringe and the plunger, the flow rate could be
calculated as follows:
q =^^tyringe^ '̂syringe (3.1)
T
In a core test for a homogeneous rock sample, the Darcy streamlines are considered to
be straight lines parallel to the axis of the core, and the permeability is calculated by a
simple application of the compressible gas form of Darcy law.
2QL|iP^K=-V-T (3-2)
A-(Po ~Pl)
It is convenient to refer to the quantity as the pressure function. In the
minipermeameter and as verified by the Darcy Law solutions of Goggin and Chen,
streamlines are curved even in a perfectly uniform rock as indicated in Fig 1.1 This is
because the cross-section for the flow changes from one part of the sample to another.
25
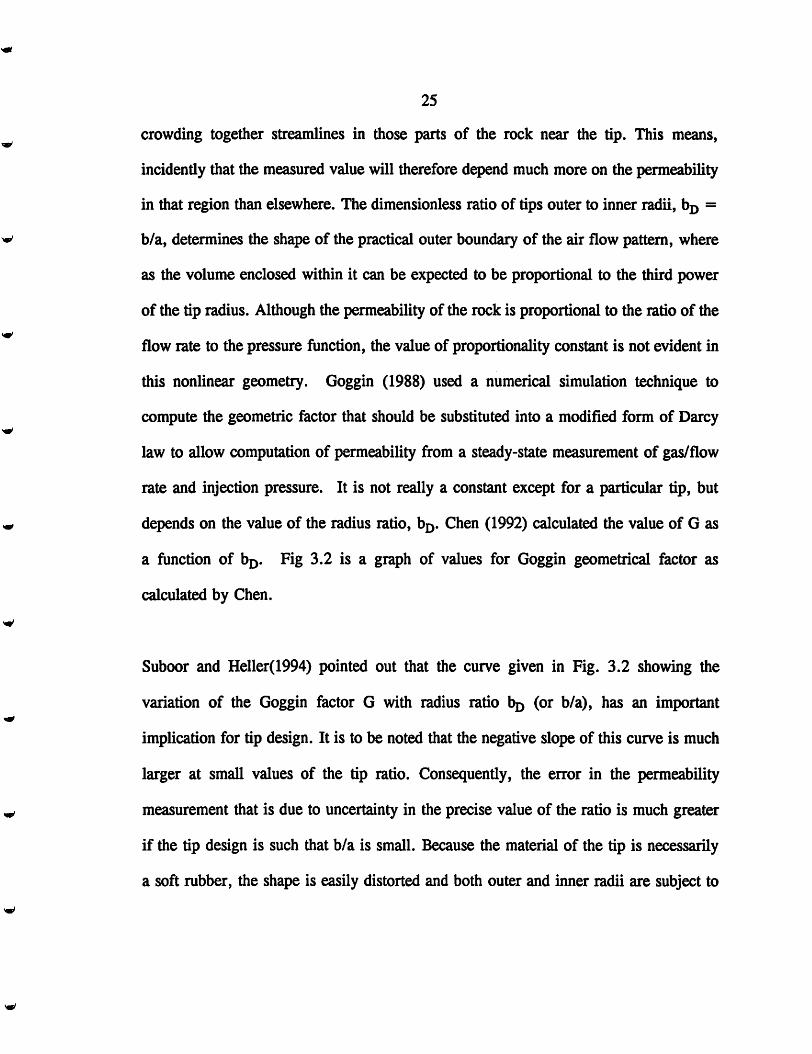
crowding together streamlines in those parts of the rock near the tip. This means,
incidently that the measured value will therefore depend much more on the permeability
in that region than elsewhere. The dimensionless ratio of tips outer to inner radii, bp =
b/a, determines the shape of the practical outer boundary of the air flow pattern, where
as the volume enclosed within it can be expected to be proportional to the third power
of the tip radius. Although the permeability of the rock is proportional to the ratio of the
flow rate to the pressure function, the value of proportionality constant is not evident in
this nonlinear geometry. Goggin (1988) used a numerical simulation technique to
compute the geometric factor that should be substituted into a modified form of Darcy
law to allow computation of permeability from a steady-state measurement of gas/flow
rate and injection pressure. It is not really a constant except for a particular tip, but
depends on the value of the radius ratio, bp. Chen (1992) calculated the value of G as
a function of b^. Fig 3.2 is a graph of values for Goggin geometrical factor as
calculated by Chen.
Suboor and Heller(1994) pointed out that the curve given in Fig. 3.2 showing the
variation of the Goggin factor G with radius ratio bjy (or b/a), has an important
implication for tip design. It is to be noted that the negative slope of this curve is much
larger at small values of the tip ratio. Consequently, the error in the permeability
measurement that is due to uncertainty in the precise value of the ratio is much greater
if the tip design is such that b/a is small. Because the material of the tip is necessarily
a soft rubber, the shape is easily distorted and both outer and inner radii are subject to
26
change when the tip is pressed against the sample. There has even been a tendency, in
the manufacture of commercial minipermeameters, to use "O-Rings" as the tip seal.
Suboor and Heller (1994) see this as an unfortunate design choice, since with it, the
actual seal with the rock sample cannot be made unless the outer radius (of rubber in
contact with the rock) is increased and the inner radius decreased simultaneously by the
pressure of the tip against the sample. Unless this pressure is very accurately maintained,
from one measurement to next, there will be significant uncertainty in the value of b/a,
and therefore in G, to be used in the permeability calculation. This will cause the same
relative error on the measured permeability.
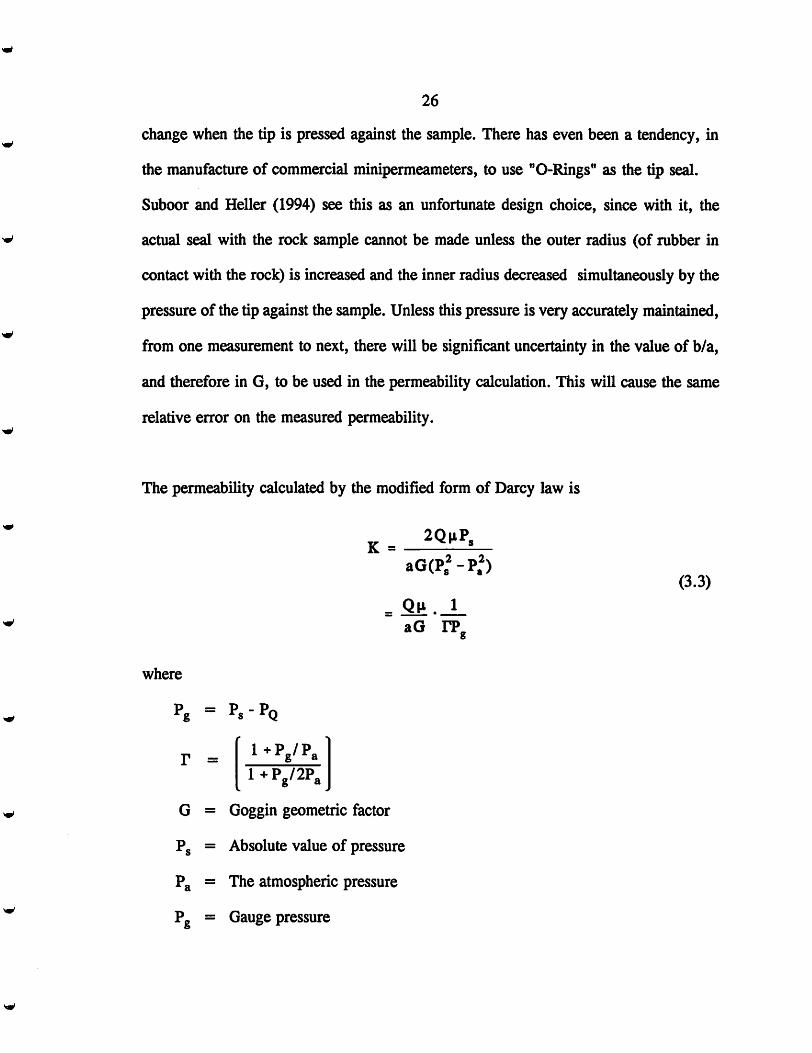
The permeability calculated by the modified form of Darcy law is
where
Pg
r =
G =
p, =
Pa =
P» =
2Q|iP,K =
aG(Pf-P^
Ps-Pq
1-Pg/Pal+Pg/2Pa
aO rp.
Goggin geometric factor
Absolute value of pressure
The atmospheric pressure
Gauge pressure
(3.3)