Polymer Flooding 2020 - PRRC Home
29
SPE 169027 Field vs Laboratory Polymer Retention Values for a Polymer Flood in the Tambaredjo Field 180
Transcript of Polymer Flooding 2020 - PRRC Home
SPE 169027
Field vs Laboratory Polymer Retention Values for a Polymer Flood in the
Tambaredjo Field
180
OUTLINE
1. Importance of polymer retention.2. Literature review of polymer retention. 3. Literature review of inaccessible pore volume
(IAPV). 4. Review of methods to assess polymer retention.5. Laboratory polymer retention values In
Tambarejo sand (associated with Sarah Maria polymer flood pilot).
6. Field polymer retention values associated with Sarah Maria polymer flood pilot in Suriname.
181
0
0.5
1
1.5
2
1 10 100 1000
Polymer retention, µg/g
Po
re v
olu
me
de
lay
fa
cto
r
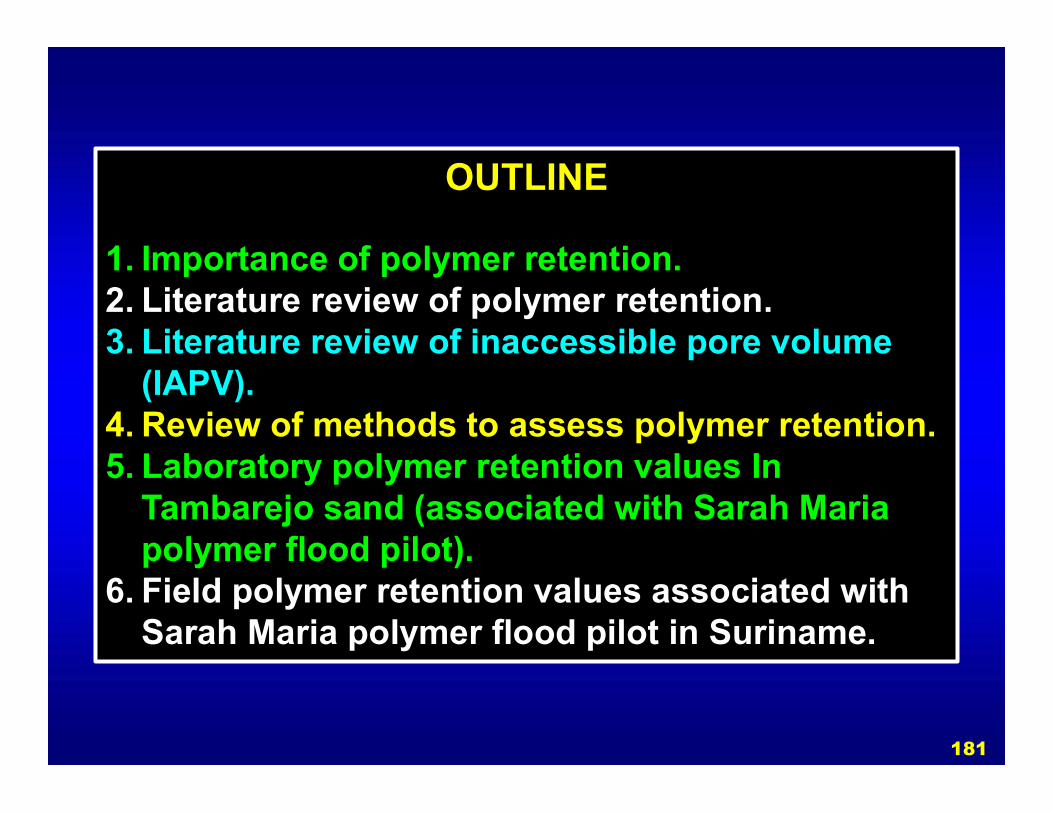
200 ppm500 ppm1000 ppm 1500 ppm2000 ppm3000 ppm
= 0.3rock = 2.65 g/cm3
IAPV = 0.
Polymer Concentration
Polymer bank delay factors associated with polymer retention.
10 µg/g & 1500 ppm polymer: delay = 0.04 PV.100 µg/g & 1500 ppm polymer: delay = 0.41 PV.200 µg/g & 1500 ppm polymer: delay = 0.82 PV.
182

LITERATURE REVIEW OF POLYMER RETENTION
1. Clay (high-surface-area materials) and iron in the rock dominate polymer retention.
2. Polymer retention can increase dramatically with decreasing permeability, especially below 100 md. Most current polymer floods are applied in very permeable formations (> 500 md).
3. Most (but not all) polymer retention data suggests that use of the Langmuir isotherm is inappropriate. Ironically, most commercial simulators use the Langmuir isotherm.
4. Retention of xanthan is usually less than that of HPAM. 5. The most reliable current means to measure polymer
retention is the double-polymer/tracer-bank method. 6. Retention in the presence of residual oil is ~1/2 half that
without Sor. Wettability has not been established as a key factor in polymer retention.
183

LITERATURE REVIEW OF INACCESSIBLE PV (IAPV)
1. Reported IAPV values are VERY inconsistent, especially with respect to permeability dependence.
2. The available theories for the IAPV phenomenon cannot explain the magnitude and odd variations of IAPV with changes in permeability . Experimental limitations?
3. More work is needed to understand IAPV phenomenon.
4. Most current large polymer floods are in reservoirs with high-permeability sands or sandstones (Daqing: 800 md; Pelican Lake: 1-3 darcys; Mangala: 5 darcys; Marmul: 15 darcys; Dalia: >1 darcy; Tambaredjo: 4-12 darcys).
5. A conservative approach to design of a polymer flood would assume that inaccessible pore volume is zero, especially in multi-darcy sands
184

REVIEW OF POLYMER RETENTION METHODS
1. Mass balance on polymer: Polymer slug followed by water.a. Unfavorable displacement during water injection after
polymer –requiring MANY PV of water.b.Significant errors accumulate from measuring low
polymer concentrations.
2. Static method: Sand mixed with polymer solution.a. Relies on only two measurements of polymer
concentration.b. Exposes extra mineral area for crushed rock.c. Does not account for mechanically entrapped polymer.
185
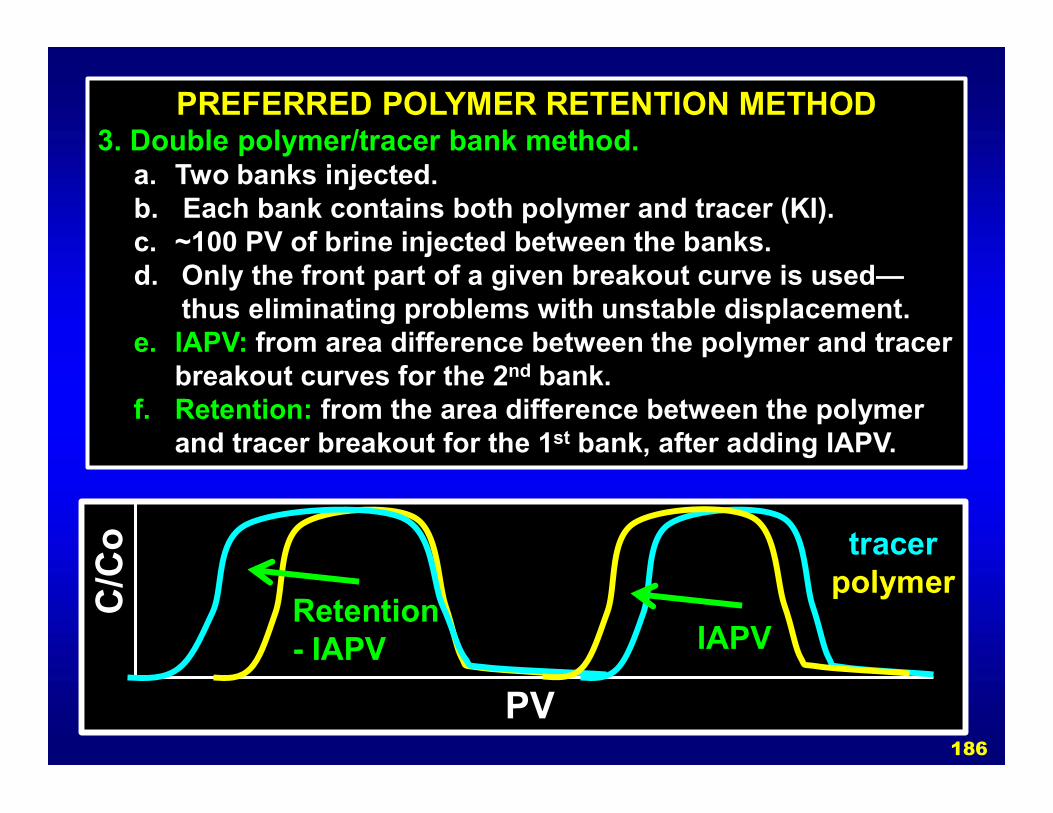
PREFERRED POLYMER RETENTION METHOD3. Double polymer/tracer bank method.
a. Two banks injected.b. Each bank contains both polymer and tracer (KI).c. ~100 PV of brine injected between the banks.d. Only the front part of a given breakout curve is used—
thus eliminating problems with unstable displacement.e. IAPV: from area difference between the polymer and tracer
breakout curves for the 2nd bank.f. Retention: from the area difference between the polymer
and tracer breakout for the 1st bank, after adding IAPV.
C/C
o
PV
Retention- IAPV
tracerpolymer
IAPV
186
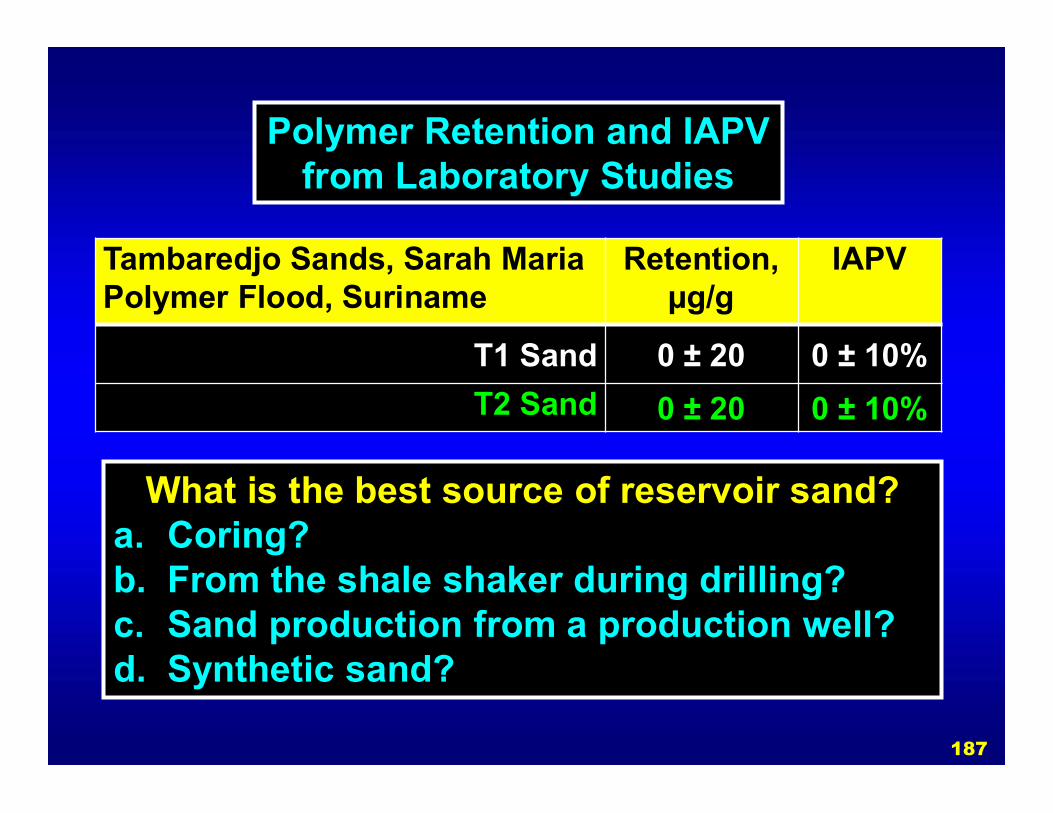
Tambaredjo Sands, Sarah Maria Polymer Flood, Suriname
Retention, µg/g
IAPV
T1 Sand 0 ± 20 0 ± 10%
T2 Sand 0 ± 20 0 ± 10%
Polymer Retention and IAPVfrom Laboratory Studies
What is the best source of reservoir sand? a. Coring? b. From the shale shaker during drilling?c. Sand production from a production well? d. Synthetic sand?
187
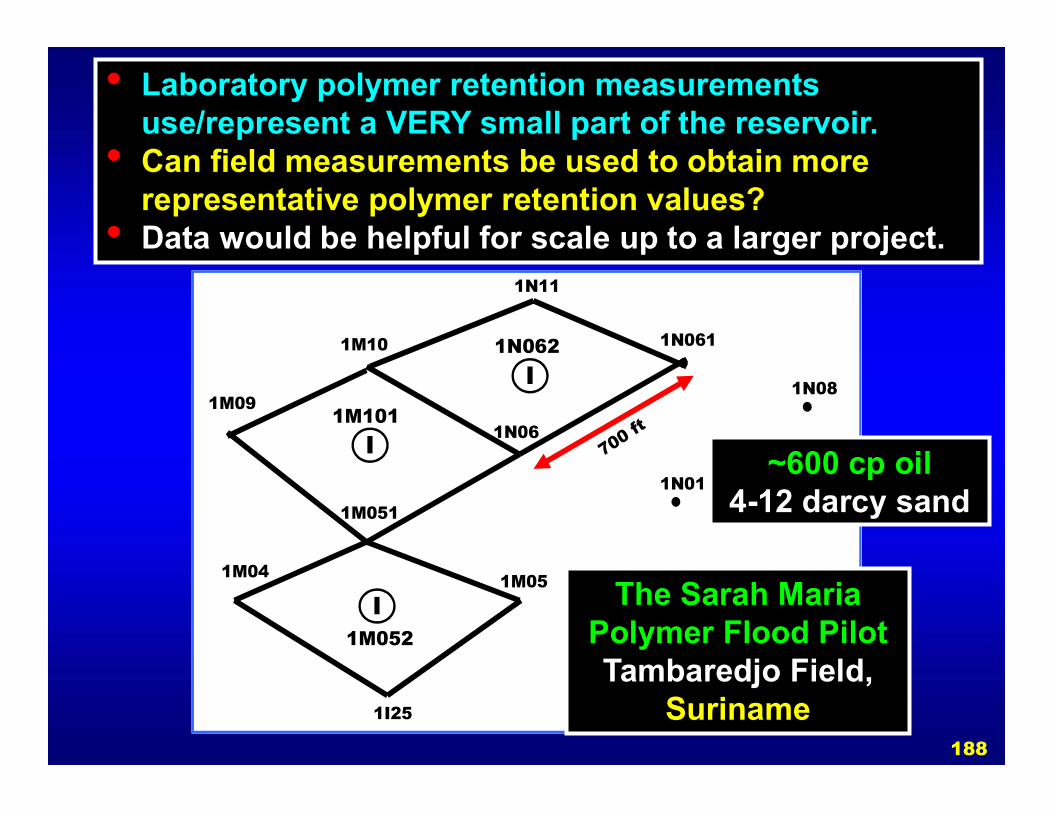
I
I
I
1N11
1N061
1N01
1M10
1N06
1M04
1I25
1M051
1M09
1M05
1M052
1M101
1N062
1N08
The Sarah Maria Polymer Flood PilotTambaredjo Field,
Suriname
• Laboratory polymer retention measurements use/represent a VERY small part of the reservoir.
• Can field measurements be used to obtain more representative polymer retention values?
• Data would be helpful for scale up to a larger project.
~600 cp oil4-12 darcy sand
188
0
1000
2000
3000
4000
5000
6000
2008 2009 2010 2011 2012 2013 2014
Year
Pro
duce
d w
ater
sal
inity
, ppm
TD
S 1N11
1I25
1N06
1M05
1M09
1N01
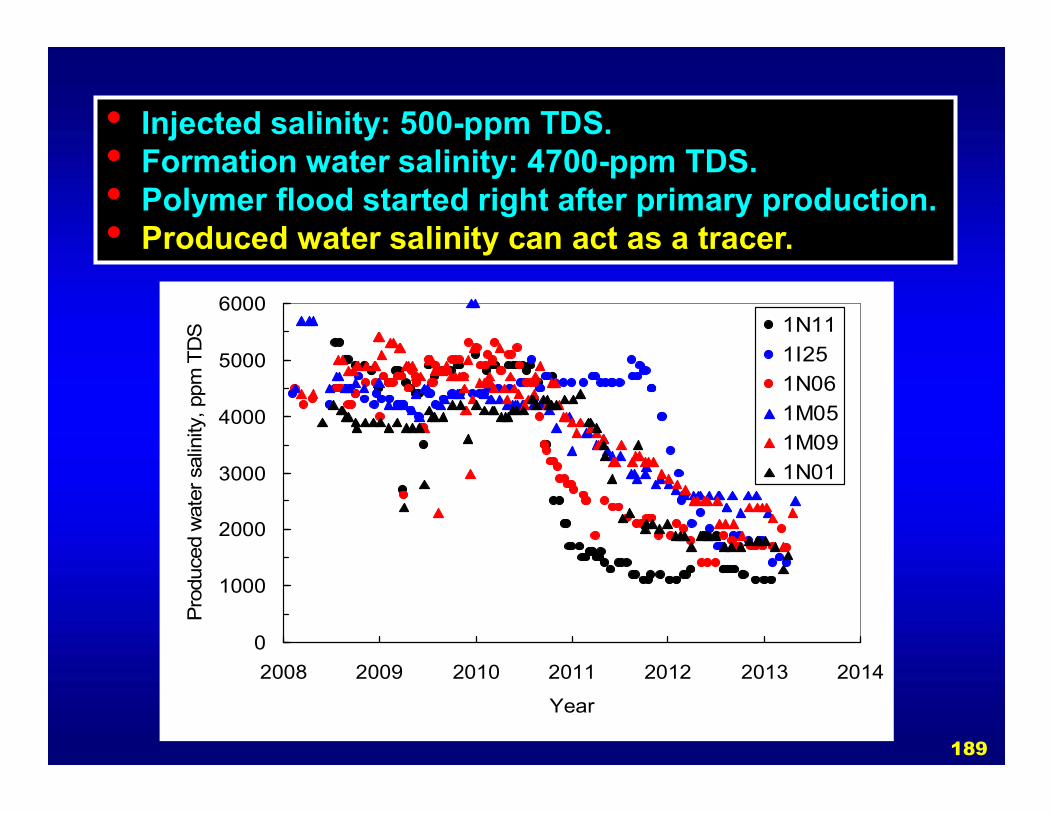
• Injected salinity: 500-ppm TDS.• Formation water salinity: 4700-ppm TDS.• Polymer flood started right after primary production.• Produced water salinity can act as a tracer.
189

0
100
200
300
400
500
600
700
800
900
2008 2009 2010 2011 2012 2013 2014 2015
Year
Pro
duce
d po
lym
er, p
pm
1N11
1I25
1N06
1M05
1M09
1N01
• Injected 1000-ppm HPAM from 9/2008 – 11/2011.• Inected 1350-ppm HPAM from 11/2011 – 2/2013.• Recommend more frequent polymer sampling.
190

Procedure to Estimate Polymer Retention from Field Data
1. Assume IAPV = 0.2. For each producer, use the stabilized salinity data to
establish the fraction of water flow coming from a nearby injector. (fwtrac = B/A).
3. Use salinity to assign a swept volume between an injector producer pair.
0
1000
2000
3000
4000
5000
6000
2008 2009 2010 2011 2012 2013 2014
Year
Pro
duce
d w
ater
sal
inity
, ppm
TD
S
1N11
A
B
191

Procedure to Estimate Polymer Retention from Field Data
4.Estimate the rock mass in the swept area:
5.Estimate polymer retention:
0
100
200
300
400
500
600
700
800
900
2008 2009 2010 2011 2012 2013 2014 2015
Year
Pro
duce
d p
olym
er,
pp
m
1N11
Cpolyo possibilities:1. Stabilized produced
polymer concentration2. 1000 ppm x fwtrac
1
2 Injected polymer = 1000 ppm
192

Production well 1N11 1I25 1N06 1M05 1M09 1N01
Starting salinity, ppm TDS
4737 4686 4657 4432 4707 3998
Ending salinity, ppm TDS
1291 1692 1684 2531 2281 1769
Ending polymer, ppm
634 550 375 226 216 395
fwtrac 0.813 0.708 0.715 0.483 0.577 0.637
Range of retention values,
µg/g160-517 129-247 53-125 14-337 45-99 50-168
Parameters for Estimation of Polymer Retention from Field Data
Most retention values fall between 50 and 250 µg/g
193
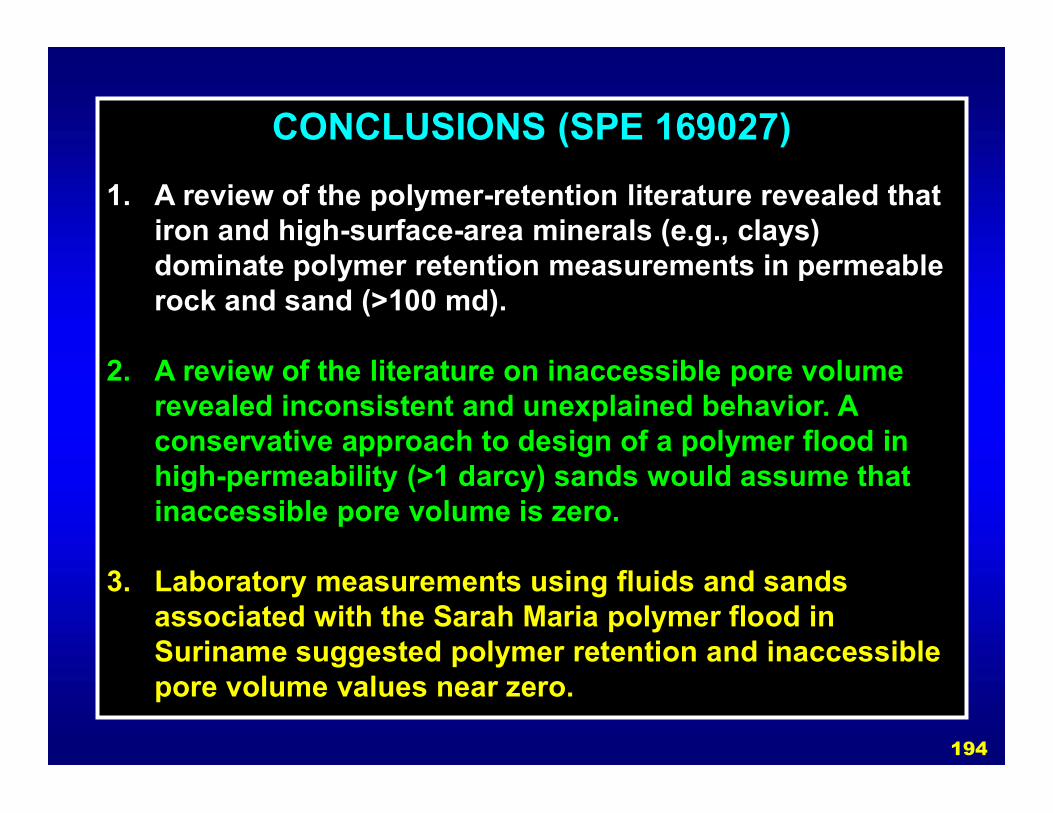
CONCLUSIONS (SPE 169027)
1. A review of the polymer-retention literature revealed that iron and high-surface-area minerals (e.g., clays) dominate polymer retention measurements in permeable rock and sand (>100 md).
2. A review of the literature on inaccessible pore volume revealed inconsistent and unexplained behavior. A conservative approach to design of a polymer flood in high-permeability (>1 darcy) sands would assume that inaccessible pore volume is zero.
3. Laboratory measurements using fluids and sands associated with the Sarah Maria polymer flood in Suriname suggested polymer retention and inaccessible pore volume values near zero.
194

CONCLUSIONS (SPE 169027)
4. A procedure was developed using salinity-tracer and polymer concentrations from production wells to estimate polymer retention during the Sarah Maria polymer flood in the Tambaredjo reservoir.
5. Field calculations indicated much higher polymer retention values than lab tests, typically ranging from ~50 to 250 µg/g.
6. Field cores necessarily represent an extremely small fraction of the reservoir. Because of the importance of polymer retention, there is considerable value in deriving polymer retention from field results, so that information can be used in the design of project expansions.
195

SPE-200428
Polymer Retention Evaluation in a Heavy Oil Sand for a Polymer Flooding Application on Alaska’s North
Slope
196

SPE-200428Milne Point Polymer Flood--Alaska’s North Slope
Schrader Bluff Formation.
1. Is retention large or small?2. Is inaccessible pore volume (IAPV) important?3. Does retention depend on areal location? (Well source
of the core in the NB sand?)4. Does retention depend on the sand? (NB or OA sand?)5. Is retention different with/without residual oil?6. What is the form of the retention function? Langmuir
isotherm? Concentration-dependence?
197
1
10
100
10 100 1000Vi
scos
ity, c
p at
7.3
1/s
HPAM concentration, ppm
actual
predicted
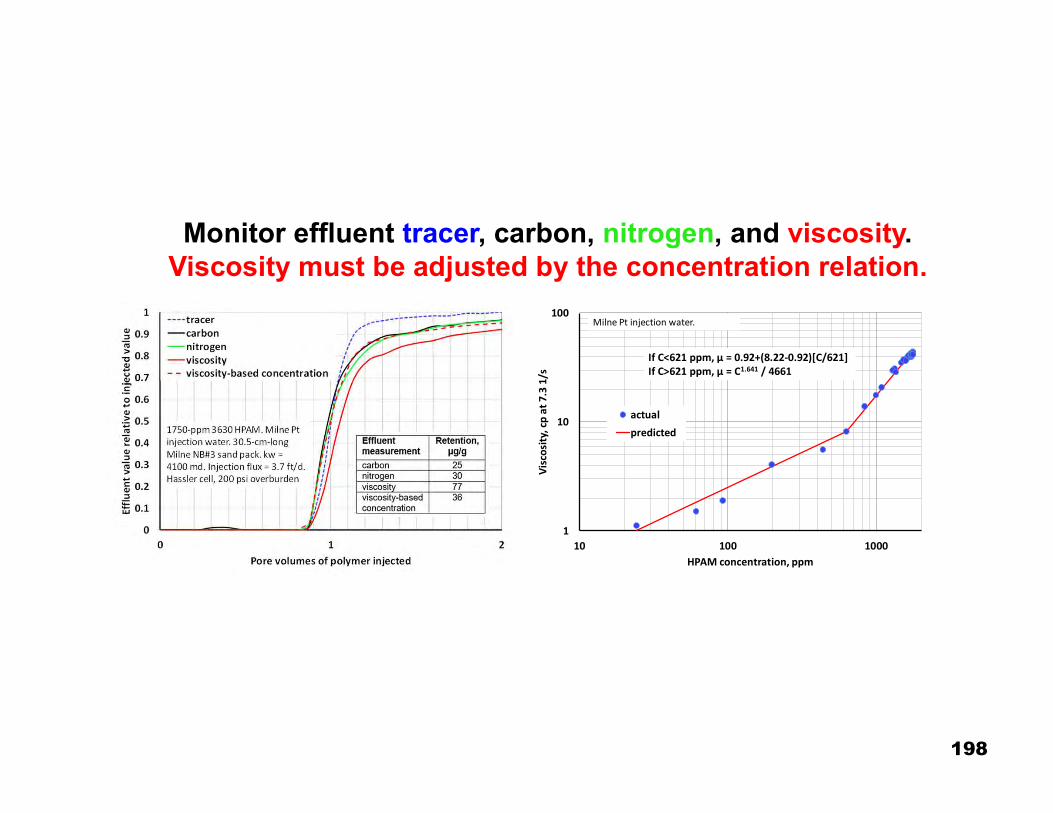
Milne Pt injection water.
If C<621 ppm, µ = 0.92+(8.22-0.92)[C/621]If C>621 ppm, µ = C1.641 / 4661
Monitor effluent tracer, carbon, nitrogen, and viscosity. Viscosity must be adjusted by the concentration relation.
198
1
10
0.1 1 10 100
Resi
dual
resi
stan
ce fa
ctor
Pore volumes of brine injected
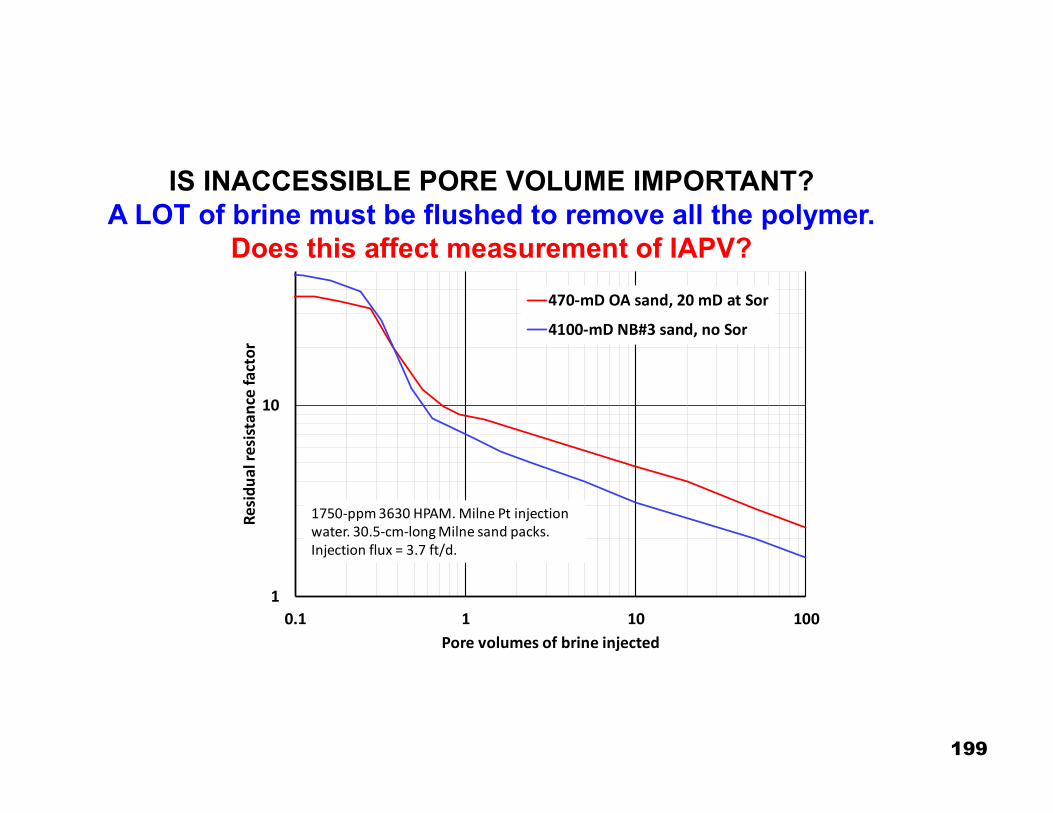
470-mD OA sand, 20 mD at Sor
4100-mD NB#3 sand, no Sor
1750-ppm 3630 HPAM. Milne Pt injection water. 30.5-cm-long Milne sand packs. Injection flux = 3.7 ft/d.
IS INACCESSIBLE PORE VOLUME IMPORTANT?A LOT of brine must be flushed to remove all the polymer.
Does this affect measurement of IAPV?
199

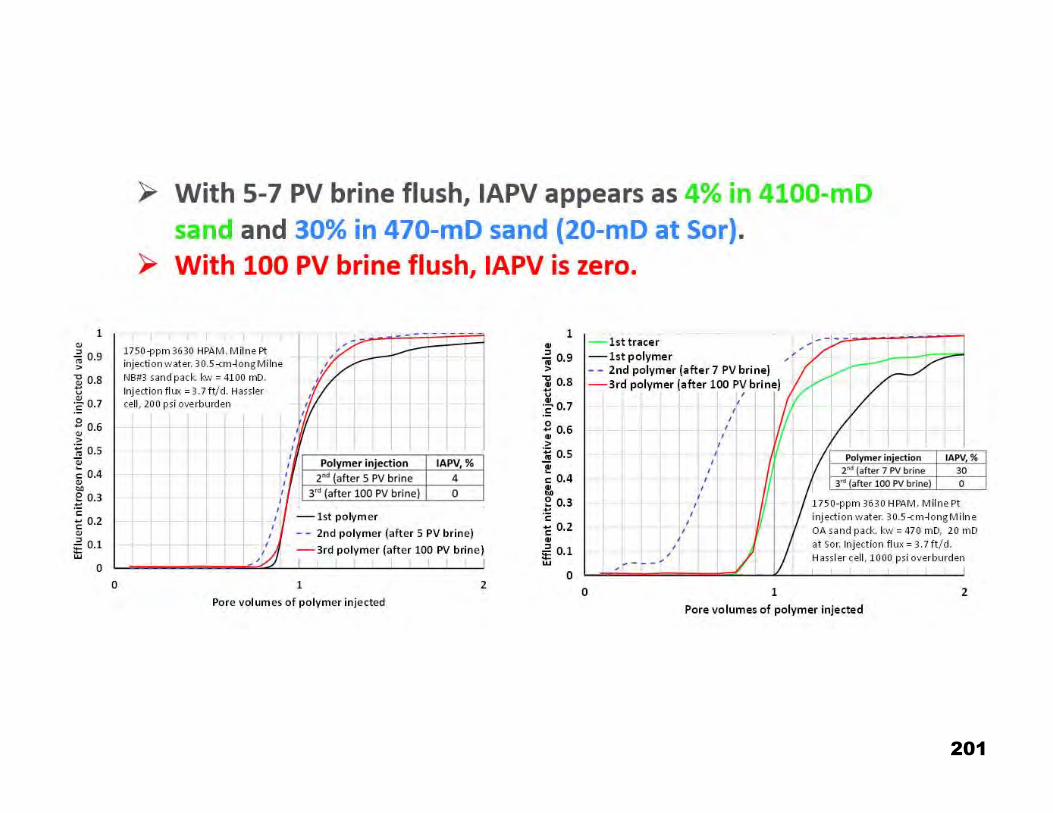
Literature inaccessible pore volume values are inconsistent.
They do not correlate well with k or Mw. Is the inconsistency due to variable brine flush volumes?
200
201
202
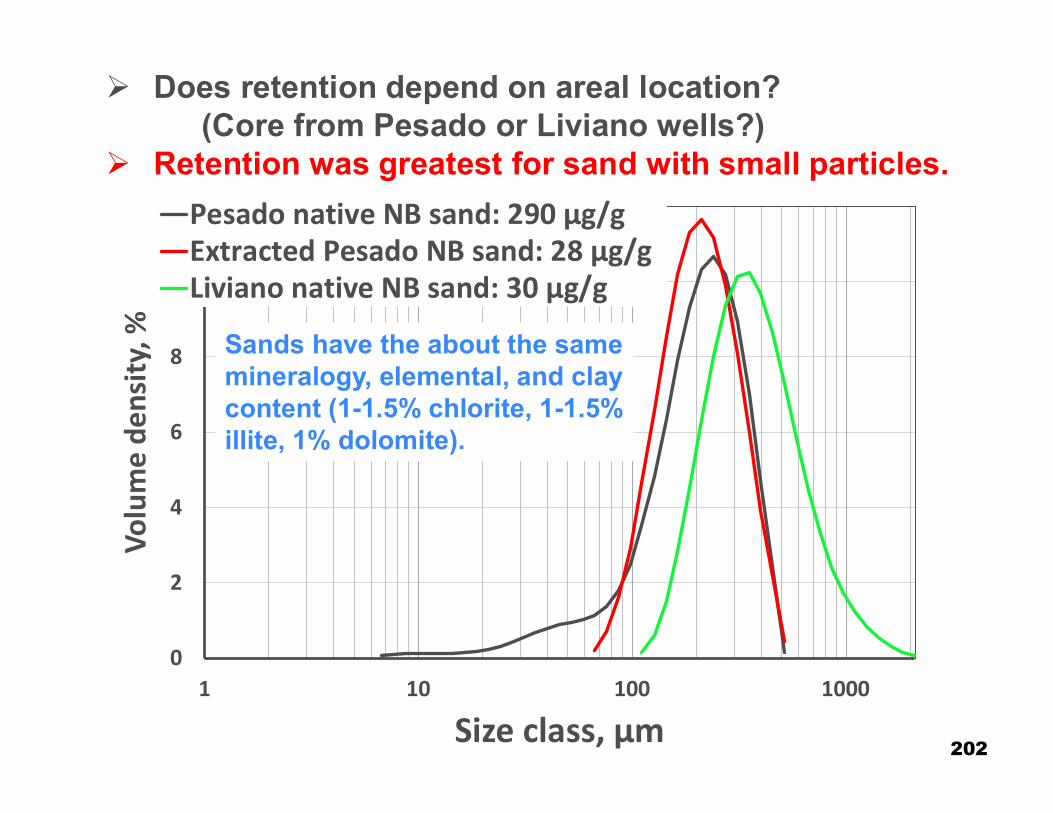
Does retention depend on areal location? (Core from Pesado or Liviano wells?)
Retention was greatest for sand with small particles.
0
2
4
6
8
10
12
1 10 100 1000
Volu
me
dens
ity, %
Size class, µm
Pesado native NB sand: 290 µg/gExtracted Pesado NB sand: 28 µg/gLiviano native NB sand: 30 µg/g
Sands have the about the same mineralogy, elemental, and clay content (1-1.5% chlorite, 1-1.5% illite, 1% dolomite).

203

204
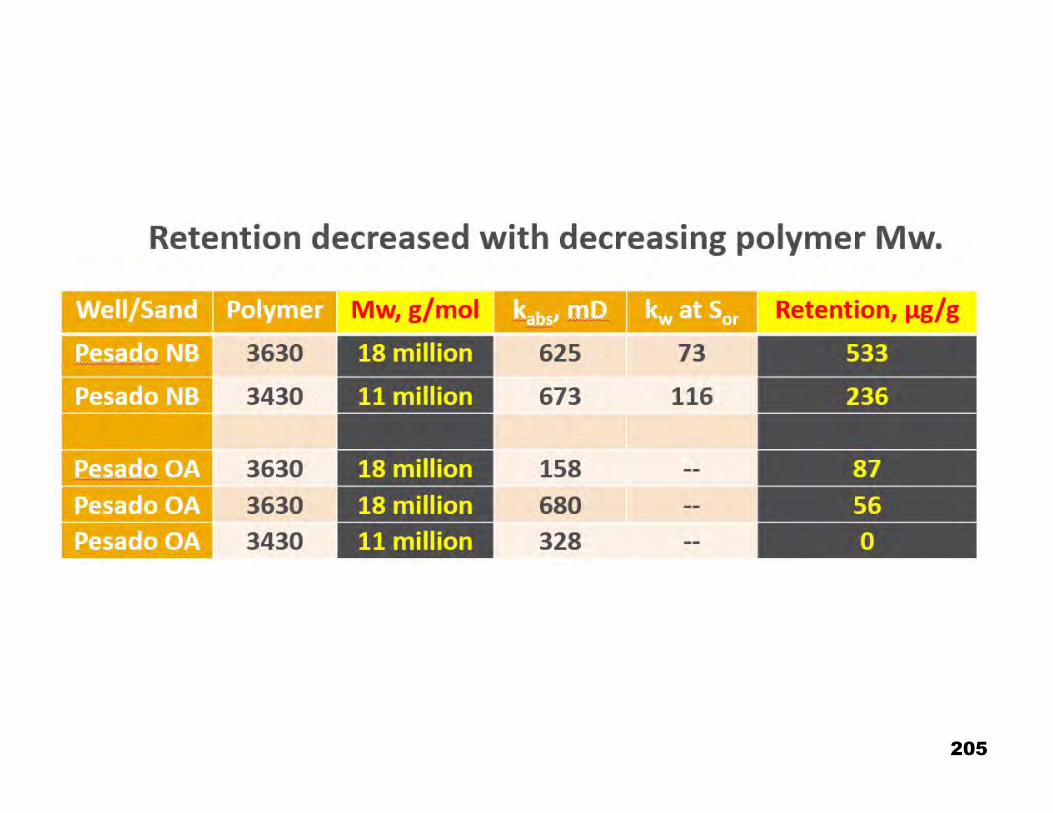
205
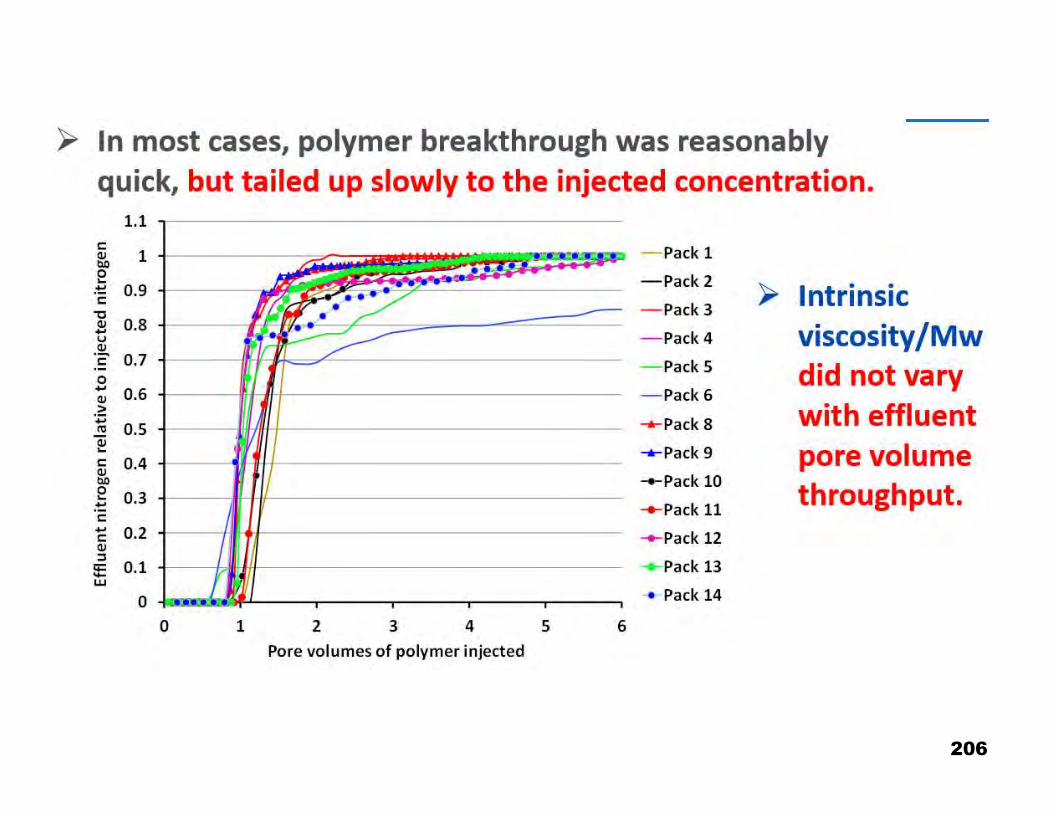
206
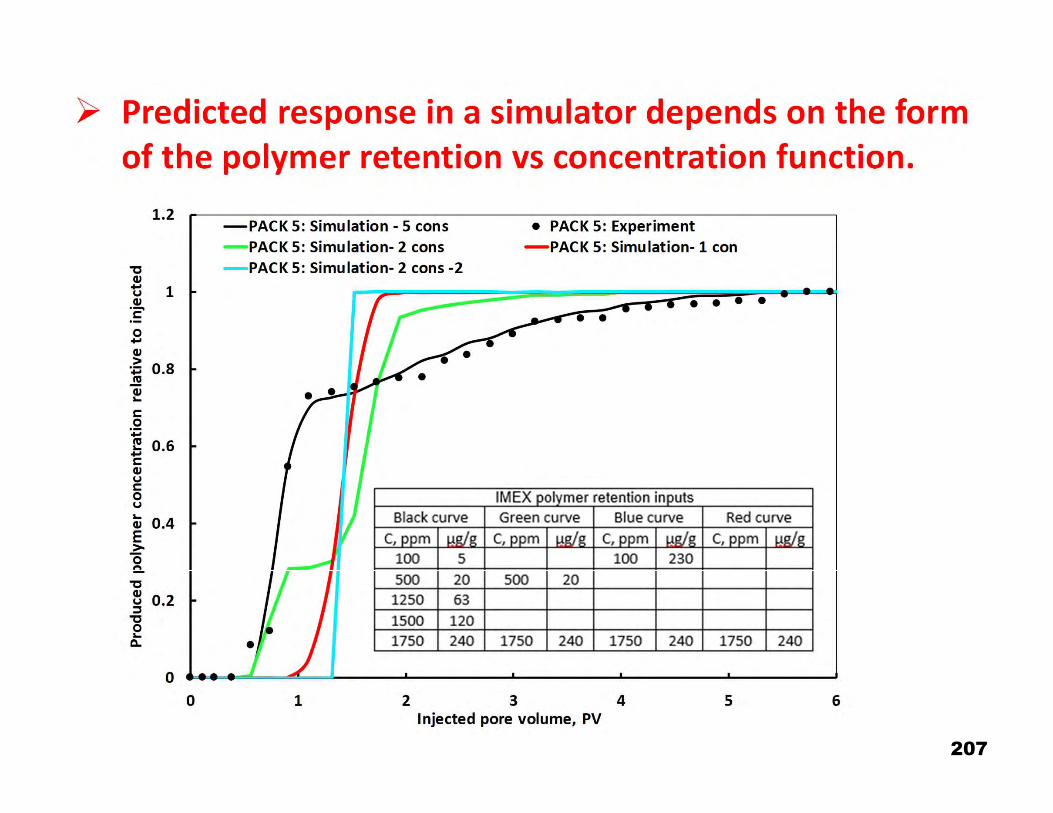
207

208