
Administration of Veritas InfoScale Storage 7.1 for UNIX/Linux

COURT ADMINISTRATION
7.1
7 Court administration
CONTENTS
7.1 Profile of court administration services 7.1
7.2 Framework of performance indicators 7.21
7.3 Key performance indicator results 7.23
7.4 Future directions in performance reporting 7.51
7.5 Jurisdictions’ comments 7.52
7.6 Definitions of key terms and indicators 7.61
7.7 Attachment tables 7.64
7.8 References 7.65
Attachment tables Attachment tables are identified in references throughout this chapter by a ‘7A’ suffix (for example, table 7A.3). A full list of attachment tables is provided at the end of this chapter, and the attachment tables are available from the Review website at www.pc.gov.au/gsp.
7.1 Profile of court administration services
This chapter focuses on administrative support functions for the courts, not on the judicial decisions made in the courts. The primary support functions of court administration services are to:
• manage court facilities and staff, including buildings, security and ancillary services such as registries, libraries and transcription services
• provide case management services, including client information, scheduling and case flow management

7.2 REPORT ON GOVERNMENT SERVICES 2011
• enforce court orders through the sheriff’s department or a similar mechanism.
This chapter covers the State and Territory supreme, district/county and magistrates’ (including children’s) courts, electronic infringement and enforcement systems, coroners’ courts and probate registries. It also covers the Federal Court of Australia, the Family Court of Australia, the Family Court of WA and the Federal Magistrates Court of Australia. The chapter does not include information on the High Court of Australia, and broadly excludes tribunals and specialist jurisdiction courts (for example, Indigenous courts, circle sentencing courts and drug courts are excluded).
Major improvements in reporting on court administration this year include data quality information (DQI) for some performance indicators. Improvements in consistency and integrity of data reported are ongoing by all jurisdictions and are footnoted where appropriate.
Roles and responsibilities
State and Territory court levels
In this chapter, the term ‘jurisdiction’ can refer to not only individual Australian states and territories, but also the roles and responsibilities that different courts have. There is a hierarchy of courts within each State and Territory. Supreme courts hear disputes of greater seriousness than those heard in the other courts. Supreme courts also develop the law and operate as courts of judicial review or appeal. For the majority of states and territories, the hierarchy of courts is as outlined below (although Tasmania, the ACT and the NT do not have a district/county court):
• supreme courts
• district/county courts
• magistrates’ courts.
Within certain court levels, a number of specialist jurisdiction courts (such as Indigenous courts, circle sentencing courts and drug courts) aim to improve the responsiveness of courts to the special needs of particular service users. Tribunals can also improve responsiveness and assist in alleviating the workload of courts — for example, small claims tribunals can assist in diverting work from the magistrates’ court. Specialist jurisdiction courts (other than the children’s courts, family courts and coroners’ courts) and tribunals are outside the scope of this Report and excluded from reported data where possible.

COURT ADMINISTRATION
7.3
Differences in State and Territory court levels mean that the allocation of cases to courts varies across states and territories (boxes 7.1 to 7.3). As a result, the seriousness and complexity of cases heard in a court level can also vary across states and territories. Therefore, any comparison of administrative performance needs to account for these factors.
Box 7.1 Supreme court jurisdictions across states and territories
Criminal
All State and Territory supreme courts have jurisdiction over serious criminal matters such as murder, treason and certain serious drug offences, but significant differences exist in this court level across the states and territories:
• District/county courts do not operate in Tasmania, the ACT and the NT, so in this state and these territories the supreme courts generally exercise a jurisdiction equal to that of both the supreme and district/county courts in other states.
• The Queensland Supreme Court deals with a significant amount of minor drug matters, which supreme courts in other states and territories do not hear.
• In the NSW Supreme Court, almost all indictments are for offences of murder and manslaughter, whereas the range of indictments routinely presented in other states and territories is broader.
All State and Territory supreme courts hear appeals, but the number and type of appeals vary because NSW, Victoria and Queensland also hear some appeals in their district/county courts.
Civil
All supreme courts deal with appeals and probate applications and have an unlimited jurisdiction on claims but:
NSW usually deals with complex cases, all claims over $750 000 (except claims related to motor vehicle accidents or worker’s compensation) and various other civil matters.
Victoria generally handles civil claims over $200 000.
Queensland usually deals with claims over $250 000 and administrative law matters.
WA usually deals with claims over $750 000.
SA exercises its unlimited jurisdiction for general and personal injury matters.
Tasmania usually deals with claims over $50 000.
ACT usually deals with claims over $50 000.
NT also deals with mental health, family law and Coroners Act 1993 applications.
Source: State and Territory court administration authorities and departments (unpublished).

7.4 REPORT ON GOVERNMENT SERVICES 2011
Box 7.2 District/county court jurisdictions across states and
territories A district/county court level exists in all states except Tasmania and does not exist in the ACT or the NT.
Criminal
The district/county courts have jurisdiction over indictable criminal matters (such as rape and armed robbery) except murder and treason, but differences exist among the states that have a district/county court. For example, appeals from magistrates’ courts are heard in the district/county courts in NSW, Victoria and Queensland, but not in WA and SA. Briefly, the jurisdictions of the district/county courts are:
NSW: The NSW District Court deals with most of the serious criminal cases that come before the courts in NSW. It has responsibility for indictable criminal offences that are normally heard by a judge and jury, but on occasions by a judge alone. It does not deal with treason or murder.
Victoria: The Victorian County Court deals with all indictable offences, except the following (which must be heard in the Supreme Court): murder; attempted murder; child destruction; certain conspiracy charges; treason; and concealing an offence of treason. Examples of criminal offences heard in the County Court include: drug trafficking; serious assaults; serious theft; rape; and obtaining financial advantage by deception.
Queensland: The Queensland District Court deals with more serious criminal offences than heard by the Magistrates’ Court — for example, rape, armed robbery and fraud.
WA: The WA District Court deals with any indictable offence except those that carry a penalty of life imprisonment.
SA: The SA District Court is the principal trial court and has jurisdiction to try a charge of any offence except treason or murder or offences related to those charges. Almost all matters have been referred following a committal process in the Magistrates Court.
Civil
All district/county civil courts hear appeals and deal with the following types of cases:
NSW: claims up to $750 000 (or more if the parties consent) and has unlimited jurisdiction in motor accident injury claims.
Victoria: appeals under the Crimes (Family Violence) Act 1987, adoption matters and change-of-name applications. Has unlimited jurisdiction in both personal injury claims and other claims.
Queensland: claims between $50 000 and $250 000.
WA: claims up to $750 000 and unlimited claims for personal injuries, and has exclusive jurisdiction for motor accident injury claims.
SA: unlimited claims for general and personal injury matters.
Source: State and Territory court administration authorities and departments (unpublished).

COURT ADMINISTRATION
7.5
Box 7.3 Magistrates court jurisdictions across states and
territories Criminal courts deal: NSW: Summarily with matters with a maximum penalty of up to two years’ imprisonment for a single offence, and up to five years’ imprisonment for multiple offences, including some indictable offences. Victoria: With summary offences and determines some indictable offences summarily. Queensland: With summary offences and determines summarily some indictable matters which have a maximum penalty of up to three years’ imprisonment. WA: With summary offences and determines some indictable offences summarily. SA: With matters with a maximum penalty of up to two years’ imprisonment, juvenile prosecutions and intervention orders (including breaches). Tasmania: With matters with a maximum penalty of up to two years’ imprisonment for a single offence and up to five years’ imprisonment for multiple offences. Also deals with some indictable offences summarily. ACT: With matters with a maximum penalty of up to 14 years’ imprisonment where the offence relates to money or property, and up to 10 years’ in other cases. NT: With some drug and fraud charges and matters with a maximum penalty of up to 10 years’ imprisonment (or 10–14 years’ imprisonment if the accused consents).
Civil courts deal: NSW: With small claims up to $10 000 and general division claims up to $60 000, as well as family law matters. Victoria: With claims up to $100 000 for monetary damages, and applications for equitable relief and applications under the Crimes (Family Violence) Act 1987. Queensland: [Prior to 1 December 2009] With small claims (including residential tenancy disputes) up to $7500, minor debt claims up to $7500 and other claims up to $50 000. Now deals with claims up to $50 000, minor civil disputes are now lodged with the Queensland Civil and Administrative Tribunal (QCAT). WA: With claims for debt recovery and damages (not personal injury) up to $75 000, minor cases up to $10 000, residential tenancy applications for monies up to $10 000, residential tenancy disputes and restraining orders. SA: With small claims up to $6000, commercial cases up to $40 000 and personal injury claims up to $80 000. Tasmania: With claims up to $20 000 (or more if both parties consent) for monetary damages and debt recovery, minor civil claims up to $5000, residential tenancy disputes, restraint orders and family violence orders. ACT: With claims between $10 000 and $50 000, victims financial assistance applications up to $50 000, matters under the Domestic Relationships Act 1994 and commercial leasing matters. Since February 2009, small claims up to $10 000 are dealt with by the ACT Civil and Administrative Tribunal. NT: With claims up to $100 000 and workers’ compensation claims.
Source: State and Territory court administration authorities and departments (unpublished).

7.6 REPORT ON GOVERNMENT SERVICES 2011
State and Territory court levels — specific elements
This chapter reports data by court level for each State and Territory. In addition, the chapter separates out certain data items from each court level to improve the comparability and understanding of the data presented. In particular instances, the data sets from the following areas are reported separately from their court level:
• probate registries (separate from the supreme courts level)
• children’s courts (separate from the magistrates’ courts level)
• electronic infringement and enforcement systems (separate from the magistrates’ courts level)
• coroners’ courts (separate from the magistrates’ courts level).
The following section outlines the role of these areas and their coverage within each State and Territory.
Probate
In all states and territories, probate issues are heard in supreme courts and encompass applications for the appointment of an executor or administrator to the estate of a deceased person. The two most common types of application are:
• where the executor nominated by a will applies to have the will proved
• where the deceased was intestate (died without a will) and a person applies for letters of administration to be entitled to administer the estate.
Children’s courts
Children’s courts are specialist jurisdiction courts that, depending on the State or Territory legislation, may hear both criminal and civil matters. These courts in the main deal with summary proceedings, however some jurisdictions have the power to also hear indictable matters.
Children’s courts deal with complaints of offences alleged to have been committed by young people. In all states and territories except Queensland, defendants under the age of 18 are treated legally as children or juveniles. In Queensland, defendants are treated legally as adults if aged 17 or older at the time the offence was committed. In all states and territories, children under the age of 10 years cannot be charged with a criminal offence (ABS 2010).

COURT ADMINISTRATION
7.7
Children’s courts may also hear matters where a child has been seriously abused or neglected. In these instances, the court has jurisdiction to determine matters relating to the child’s care and protection.
Electronic infringement and enforcement systems
Electronic infringement and enforcement systems operate to process infringements, on-the-spot fines and summary offences. They have the status of courts (despite minimal judicial involvement) because they have the capacity and authority to produce enforceable orders against defendants. The orders impose penalties such as fines (which may be enforced by warrants or licence cancellation), asset seizure, garnishment, arrest, community correction orders and incarceration.
Electronic infringement and enforcement systems included in the scope of this chapter operate in Victoria, Queensland, WA and SA. In these states, the electronic infringement and enforcement systems come under the ambit of the magistrates’ courts, but the workload and expenditure of these systems have been separately identified to allow for a more comparable interpretation of magistrates’ courts data. In other states and territories, the magistrates’ courts may enforce infringements and on-the-spot fines, or State/Territory debt recovery offices and/or fines enforcement units may operate outside the auspices of a court.
Data for electronic infringement and enforcement systems are presented with criminal jurisdiction data in this chapter.
Coroners’ courts
In all states and territories, coroners’ courts (which generally operate under the auspices of State and Territory magistrates’ courts) inquire into the cause of sudden and/or unexpected reported deaths. The definition of a reported death differs across states and territories, but generally includes deaths for which the cause is violent, suspicious or unknown. In some states and territories, the coroner has the power to commit for hearing, while in others the coroner is prohibited from making any finding of criminal or civil liability (but may refer the matter to the Director of Public Prosecutions). Suspicious fires are generally within the jurisdiction of the coroners’ courts in NSW, Victoria, Tasmania and the ACT but not in the other states and territories. Coroners’ courts are distinct from other courts because they have a role in inquiring into the cause of sudden and unexpected deaths (and suspicious fires), and also because they have other functions, including reporting inadequacies in regulatory systems.
Data for coroners’ courts are presented with civil jurisdiction data in this chapter.

7.8 REPORT ON GOVERNMENT SERVICES 2011
Australian court levels — specific elements
Australian courts comprise the following courts, in order of hierarchy:
• the High Court of Australia
• the Federal Court of Australia and the Family Court of Australia
• the Federal Magistrates Court of Australia.
Data for the High Court are not published in this Report.
The following sections highlight the relationship between the other three Australian courts.
Federal Court of Australia
This court is a superior court of record and a court of law and equity. It sits in all capital cities on a continuous basis and elsewhere in Australia from time to time.
The Federal Court has jurisdiction to hear and determine any civil matter arising under laws made by the Federal Parliament, as well as any matter arising under the Constitution or involving its interpretation. The Federal Court also has original jurisdiction in respect of specific subject matter conferred by over 150 statutes of the Federal Parliament.
The Federal Court has a substantial and diverse appellate jurisdiction. It hears appeals from decisions of single judges of the Federal Court, decisions of the Federal Magistrates Court in non-family law matters, decisions of the Supreme Court of Norfolk Island and particular decisions of State and Territory supreme courts exercising federal jurisdiction.
The Federal Court has the power to exercise indictable criminal jurisdiction for serious cartel offences under the Trade Practices Act. The jurisdiction came into force on 6 November 2009. No cases have been filed in the court. The Federal Court also exercises a very small summary criminal jurisdiction, but the cases are not separately counted. There are so few cases, these would not make a material difference by being included in the civil case totals.
Family Court of Australia and Family Court of Western Australia
The Family Court of Australia has jurisdiction in all states and territories except WA (which has its own family court). It has jurisdiction to deal with matrimonial cases and associated responsibilities, including divorce proceedings, financial issues

COURT ADMINISTRATION
7.9
and children’s matters such as who the children will live with, spend time with and communicate with, as well as other specific issues relating to parental responsibilities. It can also deal with ex-nuptial cases involving children’s matters. A practice direction was issued by the Family Court of Australia with agreement from the Federal Magistrates Court, that from November 2003 all divorce applications are to be lodged in the Federal Magistrates Court. However, registrars of the Family Court of Australia, under delegated powers from the Federal Magistrates Court, still determine about 10 per cent of divorce applications lodged in the Federal Magistrates Court. A small number of divorce applications are initiated in the Family Court of Australia where these arise within other proceedings before the Family Court of Australia. This practice direction does not affect the Family Court of WA. The Family Court of WA (since 2004) and the federal family law courts have jurisdiction (since 1 March 2009) to deal with financial matters between parties that were in a de facto relationship (including same sex relationships).
During 2008 the Family Law Courts board approved the Family Court of Australia, commencing during 2009, to provide the following administrative services to the Federal Magistrates Court:
• property management
• contracts and procurement
• information management
• financial management
• payroll management
• human resources.
These changes resulted from the increased size of the Federal Magistrates Court and its limited staffing and systems to support and sustain these services. Additionally, the Family Court agreed to also provide statistical services support for the Federal Magistrates Court. Therefore the Family Court of Australia administrative and statistical services units are now providing the Federal Magistrates Court data for this Report.
Federal Magistrates Court of Australia
The first sittings of the Federal Magistrates Court were on 3 July 2000. The court was established to provide a simpler and more accessible service for litigants, and to ease the workloads of both the Federal Court and the Family Court of Australia. Its jurisdiction includes family law and child support, administrative law, admiralty,

7.10 REPORT ON GOVERNMENT SERVICES 2011
anti-terrorism, bankruptcy, copyright, human rights, migration, privacy and trade practices. State and Territory courts also continue to do some work in these areas.
The Federal Magistrates Court shares its jurisdiction with the Federal Court and the Family Court of Australia. The intention is for the latter two courts to focus on more complex legal matters. The Federal Magistrates Court hears most first instance judicial reviews of migration matters. In trade practices matters it can award damages up to $750 000. In family law matters its jurisdiction is similar to that of the Family Court of Australia, except that only the Family Court of Australia can consider adoption disputes and applications concerning the nullity and validity of marriage. Otherwise, the Federal Magistrates Court has jurisdiction to hear any matter transferred to it by either the Federal Court or the Family Court of Australia.
The major relationships between, and hierarchy of, courts in Australia are summarised in figure 7.1.
Administrative structures
Most courts use similar infrastructure (such as court buildings and facilities) for the civil and criminal jurisdictions. However, separate information systems and case flow management practices have been established for civil and criminal case types. The Steering Committee has therefore sought to report the criminal and civil jurisdictions separately where possible.
The allocation of responsibilities between court administration and other elements of the system (including the judiciary) varies across the Australian, State and Territory legal systems.

COURT ADMINISTRATION
7.11
Figure 7.1 Major relationships of courts in Australiaa
a In some jurisdictions, appeals from lower courts or district/county courts may go directly to the full court or court of appeal at the supreme/federal level; appeals from the Federal Magistrates Court can also be heard by a single judge exercising the Federal/Family Courts’ appellate jurisdiction. b Appeals from federal, State and Territory tribunals may go to any higher court in their jurisdiction.
Recurrent expenditure less income
A number of factors affect court-related expenditure and income, including the volume and type of work undertaken. In some jurisdictions, court fees (which are part of income) are set by government and not by court administrators. Some states and territories apportion, while others allocate, expenditure (and income) between the criminal and civil jurisdictions of their courts.
Recurrent expenditure provides an estimate of annual service costs. Recurrent expenditure on court administration comprises costs associated with the judiciary, court and probate registries, sheriff and bailiff’s offices, court accommodation and

7.12 REPORT ON GOVERNMENT SERVICES 2011
other overheads. The expenditure components include salary and non-salary expenditure, court administration agency and umbrella department expenditure, and contract expenditure. Total recurrent expenditure by Australian, State and Territory court authorities (excluding the High Court and specialist jurisdiction courts — except for family courts, children’s courts and coroners’ courts) was $1.55 billion in 2009-10 (table 7.1).
Court administration income is derived from court fees, library revenue, court reporting revenue, sheriff and bailiff revenue, probate revenue, mediation revenue, rental income and any other sources of revenue (excluding fines). Total income (excluding fines) for the Australian, State and Territory courts covered in this Report was $390 million in 2009-10 (see table 7A.11).
Nationally, the civil jurisdiction of the courts reported the largest income, followed by the electronic infringement and enforcement systems (reported separately within the criminal jurisdiction). Income from electronic infringement and enforcement systems is reported for Victoria, Queensland, WA and SA. In other states and territories (NSW, Tasmania, the ACT and the NT), unpaid traffic infringement notices may be processed by other bodies that do not have the status of a court (such as a State or Territory debt recovery office) and are therefore out of scope for this Report. This will have an impact on the income reported for these states and territories.
Total recurrent expenditure less income (excluding fines), for the Australian, State and Territory courts covered in this Report, was $1.16 billion in 2009-10 (table 7.1). Expenditure exceeds income in all court jurisdictions except for electronic infringement and enforcement systems, and probate registries in the supreme courts. Expenditure is relatively low on probate matters, as these are limited to uncontested matters that are dealt with by probate registrars (or other registry staff). Where a probate matter is contested, it is reported as part of supreme court data in the civil jurisdiction. Likewise, electronic infringement and enforcement system matters are dealt with by registry staff, unless contested, in which case the matter will generally be heard in the magistrates’ courts (table 7.1).

COURT ADMINISTRATION
7.13
Table 7.1 Court administration recurrent expenditure less income (excluding fines), 2009-10 ($ million)a, b
NSWc Vic Qld WA SAd Tas ACT NT Aust courts TotalCourt administration recurrent expenditure Civil courtse, f, g, h 165.6 112.7 56.7 56.8 33.4 5.8 10.0 10.5 90.8 542.3 Criminal courtsh, i 204.1 154.8 130.2 108.6 60.8 15.6 12.8 17.4 .. 704.3 Electronic systems .. 2.9 16.8 9.1 6.9 .. .. .. .. 35.7 Family courtsj .. .. .. 24.0 .. .. .. .. 107.1 131.1 Federal Magistratesk .. .. .. .. .. .. .. .. 94.1 94.1 Coroners’ courtsl 5.0 11.0 9.7 3.4 2.8 0.6 0.8 1.6 .. 35.0 Probate — Supremem 1.2 0.7 0.3 0.4 0.6 0.1 – – .. 3.3 Total 375.9 282.0 213.7 202.3 104.5 22.0 23.7 29.5 292.0 1 545.7 Court administration recurrent expenditure less income (excluding fines) Civil courtse, f, g, h 102.3 79.3 39.5 42.1 22.2 4.3 7.5 9.7 80.9 387.8 Criminal courtsh, i 190.7 154.8 128.1 100.8 55.0 14.3 12.5 17.2 .. 673.2 Electronic systems .. -77.7 -9.8 -10.4 -3.3 .. .. .. .. -101.2 Family courtsj .. .. .. 21.5 .. .. .. .. 101.1 122.6 Federal Magistratesk .. .. .. .. .. .. .. .. 73.4 73.4 Coroners’ courtsl 4.9 11.0 9.6 3.4 2.8 0.6 0.8 1.2 .. 34.2 Probate — Supremem -21.0 -4.1 -3.9 -0.8 -3.7 -0.7 -0.5 -0.1 .. -34.7 Total 276.8 163.2 163.5 156.7 73.0 18.5 20.3 28.0 255.5 1 155.5 a Totals may not sum as a result of rounding. b Payroll tax is excluded. c Extraction and validation of data from the NSW Justicelink database is still in development. Data for 2009-10 include actual and estimated data. d A new financial allocation modelling system has been implemented in South Australian courts for 2009-10, resulting in more accurate apportionments of staffing, expenses and revenue, which may not be comparable with data for previous years. e Includes data for the supreme, district/county and magistrates’ courts (including children’s courts) and the Federal Court. Excludes data for probate, family courts, the Federal Magistrates Court and coroners’ courts. f Data for the Federal Court exclude the cost of resources provided free of charge to the Federal Magistrates Court. g Victorian Magistrates’ Court civil data include a proportion of expenditure from the Victorian Civil and Administrative Tribunal (VCAT). h The method used to calculate expenses for the Judicial Pension Scheme was amended for 2008-09 and 2009-10 data. i Includes data for supreme, district/county and magistrates’ courts (including children’s courts). Excludes data for electronic infringement and enforcement systems. j Discounted (estimate) for resources and services (work of court staff and accommodation) provided free of charge to the FMC in accordance with the Federal Magistrates Act 1999 and appropriations transferred to FMC (shown as expenditure in Family Court of Australia annual report) arising as a result of delays in the ‘Federal Courts Restructure’. In addition the Family Court of Australia provides further shared services, including IT, accommodation, work of court staff, depreciation and amortisation that cannot be quantified and as such no additional discount could be applied. k FMC expenditure data include resources received free of charge from the Federal Court and Family Court. For 2009-10 funds transferred from FCOA and FCA as income are excluded from these data as these amounts are now considered equivalent to government appropriations (noting that the full appropriation amount was returned to the court due to delays in the restructure of the federal courts). Expenditure for the FMC is based on the total net expenditure for that court and does not isolate family law work from general federal law work. Some Bankruptcy and Immigration matters filed with the FMC are delegated to be dealt with by Federal Court registrars. This work is funded by the FMC and is therefore included in its expenditure. l Excludes expenditure for autopsy, forensic science, pathology tests and body conveyancing fees as the inclusion of these costs in coroners’ court expenditure varies between states and territories. Expenditure data for the Queensland Coroners’ Court and the Victorian Coroners’ Court include the full costs of government assisted burials/cremations, legal fees incurred in briefing counsel assisting for inquests and costs of preparing matters for inquest, including the costs of obtaining independent expert reports. m The true net revenue may not be identified because rent and depreciation attributable to probate matters may be reported with data for supreme courts. .. Not applicable. – Nil or rounded to zero.
Source: Australian, State and Territory court administration authorities and departments (unpublished); tables 7A.9–13.

7.14 REPORT ON GOVERNMENT SERVICES 2011
Real recurrent expenditure less income (excluding fines) on court administration from 2005-06 to 2009-10, for each of the Australian, State and Territory court levels covered by this Report, is reported in tables 7A.12 and 7A.13.
Distribution of criminal and civil court administration expenditure
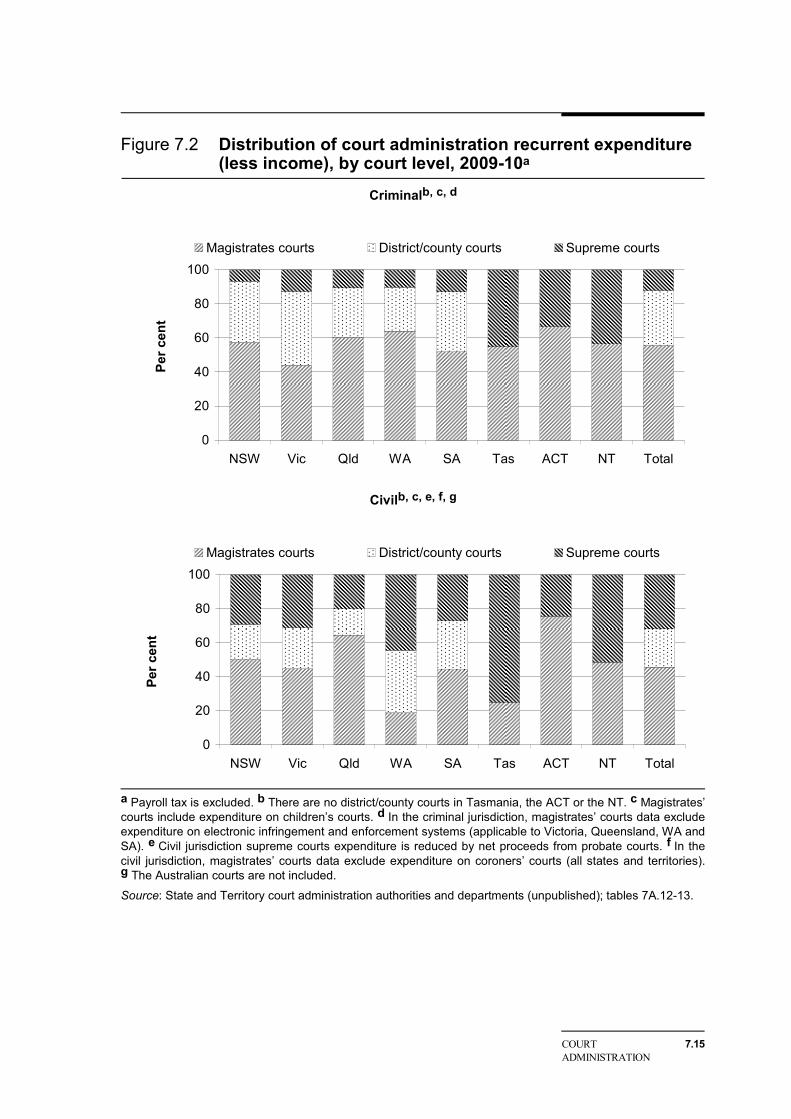
The distribution of court administration expenditure (less income) on magistrates’, district/county and supreme courts varied across states and territories in 2009-10. A greater proportion of funds were expended by the supreme courts of Tasmania, the ACT and the NT (under the two-tier court system) than by the supreme courts of other states and territories (under the three-tier court system) (figure 7.2).
In 2009-10, magistrates’ courts (excluding electronic infringement and enforcement systems) in the criminal jurisdiction accounted for the largest proportion nationally of recurrent expenditure (less income) across State and Territory criminal courts (55.5 per cent). In the civil jurisdiction, magistrates’ courts accounted for a smaller proportion of recurrent expenditure (less income) nationally (45.5 per cent). Further details are contained in tables 7A.12 and 7A.13.
Comparison of court expenditure across states and territories should take into account the difficulty in apportioning income and expenditure between civil and criminal jurisdictions within court levels. The apportionments are determined within individual states and territories and different approaches to apportionment are used.
COURT ADMINISTRATION
7.15
Figure 7.2 Distribution of court administration recurrent expenditure (less income), by court level, 2009-10a
Criminalb, c, d
0
20
40
60
80
100
NSW Vic Qld WA SA Tas ACT NT Total
Per c
ent
Magistrates courts District/county courts Supreme courts
Civilb, c, e, f, g
0
20
40
60
80
100
NSW Vic Qld WA SA Tas ACT NT Total
Per c
ent
Magistrates courts District/county courts Supreme courts
a Payroll tax is excluded. b There are no district/county courts in Tasmania, the ACT or the NT. c Magistrates’ courts include expenditure on children’s courts. d In the criminal jurisdiction, magistrates’ courts data exclude expenditure on electronic infringement and enforcement systems (applicable to Victoria, Queensland, WA and SA). e Civil jurisdiction supreme courts expenditure is reduced by net proceeds from probate courts. f In the civil jurisdiction, magistrates’ courts data exclude expenditure on coroners’ courts (all states and territories). g The Australian courts are not included.
Source: State and Territory court administration authorities and departments (unpublished); tables 7A.12-13.
7.16 REPORT ON GOVERNMENT SERVICES 2011
Size and scope of court activity
Lodgments
Lodgments are matters initiated in the court system. Box 7.4 explains how lodgment data are collected for this chapter.
Box 7.4 Explanation of lodgment data used in this chapter Lodgments reflect community demand for court services, such as dispute resolution and criminal justice. The different ways of counting a court’s workload reflect the variety of work undertaken within the court system. The units of measurement of workload (or counting units) used within this chapter are:
• criminal courts — lodgment counts are based on the number of defendants
• civil and family courts — lodgment counts are based on the number of cases (except in children’s courts where, if more than one child can be involved in an application, the counting unit is the number of children involved in the originating application)
• electronic infringement and enforcement systems — lodgment counts are based on the number of unpaid infringement notices
• coroners’ courts — lodgment counts are based on the number of reported deaths (and, if applicable, reported fires).
Unless otherwise noted, the following types of lodgment are excluded from the criminal and/or civil lodgment data reported in this chapter:
• any lodgment that does not have a defendant element (for example, applications for telephone taps)
• extraordinary driver’s licence applications
• bail procedures (including applications and review)
• directions
• warrants
• admissions matters (original applications to practise and mutual recognition matters)
• cross-claims
• secondary processes — for example, interlocutory matters, breaches of penalties (that is, bail, suspended sentences, probation)
• applications for default judgments (because the application is a secondary process).
Table 7.2 (criminal) and table 7.3 (civil) outline the number of lodgments in 2009-10, by court level, for the Australian courts and for each State and Territory.

COURT ADMINISTRATION
7.17
Nationally, in the criminal jurisdiction, there were 854 100 lodgments registered in the supreme, district/county and magistrates’ courts, and approximately 2.3 million infringement notices processed in electronic infringement and enforcement systems in 2009-10 (table 7.2).
Table 7.2 Court lodgments — criminal, by court level, 2009-10 (‘000)a NSWb Vic Qld WA SA Tas ACT NT TotalSupremec, d 0.5 0.7 1.8 0.6 0.3 0.7 0.4 0.5 5.5 District/countyd 11.6 5.1 6.6 2.3 2.0 .. .. .. 27.7 Magistrates’ (total) 204.7 183.4 215.2 114.8 59.1 23.6 6.3 13.9 821.0
Magistrates’ (only) 187.9 160.4 203.0 104.0 52.6 21.3 5.7 12.6 747.6 Children’s 16.8 22.9 12.2 10.8 6.5 2.3 0.6 1.3 73.4
All criminal courts 216.8 189.2 223.5 117.7 61.5 24.3 6.7 14.3 854.1 E – infringement and enforcement systemse, f .. 1 226.7 620.3 266.2 197.7 .. .. .. 2 310.9 a Totals may not add as a result of rounding. b Extraction and validation of data from the NSW Justicelink database is still in development. Data provided for 2009-10 include actual and estimated data. c During 2009-10, the Supreme Court of Victoria implemented a new Case Management system and associated Courts Data Warehouse. This has required changes to work practices in registries and judges’ chambers and introduced new systems and opportunities for data analysis. d Queensland Supreme and District Court data for the number of originating criminal lodgments are based on a count of the number of defendants who had a Court Record entered on the computerised case management system in the financial year, it is not a count of the number of defendants committed to the Supreme/District Court for trial or sentencing. e Only Victoria, Queensland, WA and SA have electronic infringement and enforcement systems. In other states and territories, unpaid traffic infringement notices may be dealt with by other bodies that do not have the status of a court (such as a State debt recovery office). f Excludes unpaid court fines. .. Not applicable.
Source: State and Territory court administration authorities and departments (unpublished); table 7A.1.
Nationally, 595 200 cases were lodged in civil jurisdiction courts (excluding family courts, the Federal Magistrates Court, coroners’ and probate courts), comprising 591 600 cases in the State and Territory supreme, district/county and magistrates’ courts, and 3600 cases in the Federal Court (table 7.3). In the states and territories, an additional 61 600 probate matters were lodged in the supreme courts.
In the Australian court jurisdiction, approximately 3600 cases were lodged in the Federal Court, 91 700 (civil and family law) matters were lodged in the Federal Magistrates Court, and a further 34 400 family law matters were filed in the Family Court of Australia (19 300) and Family Court of WA (15 000).
In the coroners’ courts, there were 22 100 reported deaths and fires. Reporting rates for deaths reported to a coroner varied across jurisdictions as a result of different reporting requirements. Deaths in institutions (such as nursing homes) of people suffering intellectual impairment of any type, for example, must be reported in SA but not in other jurisdictions. Reporting requirements also vary for fires. Fires may be reported and investigated at the discretion of the coroner in NSW, Victoria, Tasmania and the ACT, but are excluded from the coroners’ jurisdiction in

7.18 REPORT ON GOVERNMENT SERVICES 2011
Queensland, WA, SA and the NT. A disaggregation of coroners’ courts data by reported deaths and fires is in table 7A.2.
Table 7.3 Court lodgments — civil, by court level, 2009-10 (‘000)a NSWb Vic Qld WA SA Tas ACT NT Aust
courts Total
Supreme (excl. probate)/Federalc, d 11.0 7.2 7.6 3.2 1.3 0.9 0.9 0.2 3.6 36.0 District/County 8.3 6.2 5.4 4.2 2.8 .. .. .. .. 26.9 Magistrates’ (total)e, f 191.5 171.2 69.0 53.5 26.6 10.0 3.5 7.1 .. 532.4
Magistrates’ (only)g 182.6 166.0 65.5 51.8 25.4 9.6 3.3 6.7 .. 510.8 Children’se, h, i 8.9 5.2 3.5 1.6 1.3 0.5 0.2 0.4 .. 21.6
All civil courts 210.8 184.7 82.0 60.8 30.7 10.9 4.4 7.3 3.6 595.2 Family courtsj .. .. .. 15.0 .. .. .. .. 19.3 34.4 Federal Magistratesd .. .. .. .. .. .. .. .. 91.7 91.7 Coroners’ courtsk 6.3 5.3 4.3 1.9 1.9 0.6 1.6 0.3 .. 22.1 Probate — Supreme 21.8 18.1 7.7 6.0 5.1 2.1 0.7 0.2 .. 61.6 a Totals may not add as a result of rounding. b Extraction and validation of data from the NSW Justicelink database is still in development. Data provided for 2009-10 include actual and estimated data. c During 2009-10, the Supreme Court of Victoria implemented a new Case Management system and associated Courts Data Warehouse. This has required changes to work practices in registries and judges’ chambers and introduced new systems and opportunities for data analysis. d Some Bankruptcy and Immigration matters filed with the Federal Magistrates Court are delegated to be dealt with by Federal Court registrars. Those matters finalised by Federal Court registrars are counted as part of the Federal Magistrates Court matters as they are filed and funded by the Federal Magistrates Court. Previously these matters were also included in Federal courts data but they are now excluded. e NSW lodgment data for children in the civil court are based on a count of each child listed in all new applications for care and protection, not just the originating application. f The number of civil cases lodged as at 30 June 2010 in the Queensland Magistrates Courts has decreased due to the introduction of the Queensland Civil and Administrative Tribunal (QCAT) on 1 December 2009. During the period 1 December 2009 to 30 June 2010 there were 16 060 minor civil disputes lodged with QCAT. Previously these lodgments would have been included in the Magistrates Court Civil jurisdiction. In the Magistrates Courts outside the South East Queensland region, magistrates are still responsible for hearing these civil cases, in addition to other disputes lodged with QCAT, such as cases including guardianship, anti-discrimination and childrens’ services, which are not within the scope of this Report. g Victorian Magistrates’ Court civil data include a proportion of lodgments from VCAT. In the ACT, since 2 February 2009, small claims up to $10 000 are no longer lodged with the Magistrates Court (they are now lodged with the ACT Civil and Administrative Tribunal). h Queensland Children’s Court data for civil cases is based on a count of cases, not the number of children involved in the care and protection case. i In the NT a perpetual file is held for each child, therefore additional applications are not lodged separately but as part of the original application. j Family Court of Australia data do not include instances where its registrars are given delegation to conduct Federal Magistrates Court divorce applications, or when conducting conciliation conferences on Federal Magistrates Court matters. These services are provided free of charge to the Federal Magistrates Court. k In 2009-10 the WA Coroners Court implemented a new reporting system utilising WA Coroners Court data stored in the National Coroners Information System, which now includes WA State-wide data. .. Not applicable.
Source: Australian, State and Territory court administration authorities and departments (unpublished); table 7A.2.
The number of lodgments per 100 000 people can be used to assist in understanding the comparative workload of a court in relation to the population size of the State or Territory. Tables 7A.3 and 7A.4 provide data on criminal and civil lodgments (per 100 000 people) respectively for each State and Territory.
COURT ADMINISTRATION
7.19
Distribution of court lodgments
The majority of both criminal and civil matters in Australia in 2009-10 were lodged in magistrates’ courts (table 7.4). A greater proportion of criminal matters were lodged in district/county courts compared to supreme courts while the opposite was true for civil matters.
Table 7.4 Distribution of court lodgments, by court level, 2009-10a Unit NSWb Vic Qld WA SA Tas ACT NT TotalCriminal courts Supremec % 0.2 0.4 0.8 0.5 0.6 2.8 6.1 3.1 0.6District/county % 5.4 2.7 3.0 2.0 3.3 .. .. .. 3.2Magistrates’ (total) % 94.4 96.9 96.3 97.5 96.1 97.2 93.9 96.9 96.1All criminal courtsd ‘000 216.8 189.2 223.5 117.7 61.5 24.3 6.7 14.3 854.1 Civil courts Supremee % 5.2 3.9 9.2 5.2 4.2 8.3 20.5 3.4 5.5District/county % 3.9 3.4 6.6 6.9 9.1 .. .. .. 4.5Magistrates’ (total)f % 90.9 92.7 84.2 87.9 86.7 91.7 79.5 96.6 90.0All civil courtsg ‘000 210.8 184.7 82.0 60.8 30.7 10.9 4.4 7.3 591.6a Totals may not add as a result of rounding. b Extraction and validation of data from the NSW Justicelink database is still in development. Data provided for 2009-10 include actual and estimated data. c During 2009-10, the Supreme Court of Victoria implemented a new Case Management system and associated Courts Data Warehouse. This has required changes to work practices in registries and judges’ chambers and introduced new systems and opportunities for data analysis. d Excludes electronic infringement and enforcement systems (Victoria, Queensland, WA and SA). e Excludes probate matters. f The Victorian Magistrates’ Court civil data include a proportion of lodgments from VCAT. In the ACT, since 2 February 2009, small claims up to $10 000 are no longer lodged with the Magistrates Court (they are now lodged with the ACT Civil and Administrative Tribunal). g Excludes data for the Federal Court, family courts, the Federal Magistrates Court and coroners’ courts. .. Not applicable.
Source: State and Territory court administration authorities and departments (unpublished); tables 7A.1—2.
Finalisations
Finalisations represent the completion of matters in the court system. Each lodgment can be finalised only once. Matters may be finalised by adjudication, transfer, or another non-adjudicated method (such as withdrawal of a matter by the prosecution or settlement by the parties involved).
Tables 7.5 (criminal) and 7.6 (civil) outline the number of finalisations in 2009-10, by court level, for the Australian courts and each State and Territory. Lodgments need not equal finalisations in any given year because not all matters lodged in one year will be finalised in the same year.

7.20 REPORT ON GOVERNMENT SERVICES 2011
In 2009-10, there were 876 800 criminal finalisations in the supreme, district/county and magistrates’ courts and approximately 2.1 million infringement notices finalised through electronic infringement and enforcements systems (table 7.5).
Table 7.5 Court finalisations — criminal, 2009-10 (‘000)a NSWb Vic Qld WA SA Tas ACT NT Total Supremec 0.5 0.7 1.6 0.5 0.4 0.7 0.3 0.4 5.2District/County 11.7 4.7 6.5 2.6 2.1 .. .. .. 27.5Magistrates’ (total)d 198.5 200.1 218.5 119.3 65.4 22.5 6.5 13.4 844.1
Magistrates’ (only) 183.0 176.1 206.2 108.1 58.7 20.4 5.9 12.2 770.7Children’s 15.4 23.9 12.2 11.1 6.8 2.1 0.7 1.2 73.4
All criminal courts 210.6 205.5 226.6 122.4 67.9 23.1 6.8 13.8 876.8Elec. infringement and enforcement systemse, f .. 997.3 565.3 244.5 262.2 .. .. .. 2069.3a Totals may not add as a result of rounding. b Extraction and validation of data from the NSW Justicelink database is still in development. Data provided for 2009-10 include actual and estimated data. c During 2009-10, the Supreme Court of Victoria implemented a new Case Management system and associated Courts Data Warehouse. This has required changes to work practices in registries and judges’ chambers and introduced new systems and opportunities for data analysis. d Queensland Magistrates Court finalisations include cases finalised due to a committal hearing. e Only Victoria, Queensland, WA and SA have electronic infringement and enforcement systems. In other jurisdictions, unpaid traffic infringement notices may be dealt with by other bodies that do not have the status of a court (such as a State debt recovery office). Lodgment data for electronic infringement and enforcement systems exclude unpaid court fines. f WA electronic infringement and enforcement system finalisation data include all adjudicated finalisations except those where a time to pay arrangement has been entered into, but is not yet complete. .. Not applicable.
Source: State and Territory court administration authorities and departments (unpublished); table 7A.5.
Nationally, in 2009-10, 589 000 cases were finalised in the civil jurisdiction (excluding family courts, the Federal Magistrates Court, coroners’ and probate courts) comprising 585 500 civil cases finalised in State and Territory supreme, district/county and magistrates’ courts, and 3500 cases finalised in the Federal Court. In addition, the Federal Magistrates Court finalised 89 100 matters (mainly family law forms and some federal law cases) and the two family courts finalised 32 100 matters. The Family Court of WA processes a mixture of work that includes elements of the work dealt with by the different federal courts. There were around 22 000 finalisations (involving reported deaths and fires) in coroners’ courts (table 7.6).

COURT ADMINISTRATION
7.21
Table 7.6 Court finalisations — civil, 2009-10 (‘000)a NSWb Vic Qld WA SA Tas ACT NT Aust
courts Total
Supremec, d/Federal 13.4 8.2 7.2 3.1 1.4 1.1 1.0 0.3 3.5 39.1District/Countyd 8.3 5.6 5.1 4.8 2.6 .. .. .. .. 26.4Magistrates’ (total)e 169.7 172.0 77.4 55.1 28.5 10.3 3.8 6.6 .. 523.5
Magistrates’ (only)f 162.1 167.6 73.8 53.7 27.2 9.9 3.6 6.2 .. 504.1Children’sg 7.6 4.5 3.7 1.5 1.2 0.4 0.2 0.4 .. 19.4
All civil courts 191.4 185.9 89.7 63.0 32.4 11.4 4.8 6.9 3.5 589.0Family courtsh, i .. .. .. 12.6 .. .. .. .. 19.4 32.1Federal Magistratesj .. .. .. .. .. .. .. .. 89.1 89.1Coroners’ courts 6.1 5.6 3.7 1.9 2.1 0.6 1.6 0.4 .. 22.0a Totals may not add as a result of rounding. b Extraction and validation of data from the NSW Justicelink database is still in development. Data provided for 2009-10 include actual and estimated data. c During 2009-10, the Supreme Court of Victoria implemented a new Case Management system and associated Courts Data Warehouse. This has required changes to work practices in registries and judges’ chambers and introduced new systems and opportunities for data analysis. d Supreme courts data exclude finalisations of uncontested probate cases. e The number of civil cases finalised as at 30 June 2010 in the Queensland Magistrates Courts has decreased due to the introduction of the Queensland Civil and Administrative Tribunal (QCAT) on 1 December 2009. During the period 1 December 2009 to 30 June 2010 there were 16 060 minor civil disputes lodged with QCAT. Previously these lodgments would have been included in the Magistrates Court Civil jurisdiction. In the Magistrates Courts outside the South East Queensland region, magistrates are still responsible for hearing these civil cases, in addition to other disputes lodged with QCAT, such as cases including guardianship, anti-discrimination and childrens’ services, which are not within the scope of this Report. f Victorian Magistrates’ Court civil data include a proportion of finalisations from VCAT. In the ACT, since 2 February 2009, small claims up to $10 000 are no longer lodged with the Magistrates Court (they are now lodged with the ACT Civil and Administrative Tribunal). g Queensland children’s court data for civil cases are based on a count of cases, not the number of children involved in the care and protection case. h Family Court of Australia data do not include instances where its registrars are given delegation to conduct Federal Magistrates Court divorce applications, or when conducting conciliation conferences on Federal Magistrates Court matters. These services are provided free of charge to the Federal Magistrates Court. i The Family Court of Australia does not deem a matter finalised even if it has not had a court event for at least 12 months as this is not consistent with its case management practices. j The Federal Magistrates Court does not deem a matter finalised even if it has not had a court event for at least 12 months. Some bankruptcy and immigration matters filed with the Federal Magistrates Court are delegated to be dealt with by Federal Court registrars. Those matters finalised by Federal Court registrars are counted as part of the Federal Magistrates Court matters as they are filed and funded by the Federal Magistrates Court. .. Not applicable.
Source: Australian, State and Territory court administration authorities and departments (unpublished); table 7A.6.
The number of finalisations per 100 000 people is available in tables 7A.7 and 7A.8.
7.2 Framework of performance indicators
Performance indicators focus on outputs and/or outcomes aimed at meeting common, agreed objectives. The Steering Committee has identified four objectives of court administration services across Australia (box 7.5). The emphasis placed on each objective may vary across states and territories and court level.

7.22 REPORT ON GOVERNMENT SERVICES 2011
Box 7.5 Objectives for court administration Objectives for court administration are:
• to be open and accessible
• to process matters in an expeditious and timely manner
• to provide due process and equal protection before the law
• to be independent yet publicly accountable for performance.
In addition, all governments aim to provide court administration services in an efficient manner.
The performance indicator framework for court administration is shown in figure 7.3. For all data, the text includes relevant caveats and supporting commentary. Indicators that are considered comparable are only comparable subject to the caveats and footnotes accompanying the definition of the indicator and the tables of indicator results.
The Steering Committee focuses on providing the best available data in a timely manner. Jurisdictions, when endorsing the data, acknowledge that the data have been supplied according to the nationally agreed counting rules. Where a jurisdiction advises that it has diverged from these counting rules, this divergence is appropriately footnoted in the table and surrounding text. Chapter 1 discusses data comparability from a Report-wide perspective (see section 1.6).
The Steering Committee recognises that this collection (unlike some other data collections) does not have an intermediary data collector or validator akin to the Australian Institute of Health and Welfare or the ABS. The reporting process in this chapter is one of continual improvement and refinement, with the long term aim of developing a national data collection that covers court administration activities across the Australian, State and Territory jurisdictions in a timely and comparable way.
As shown in figure 7.3, all of the indicators reported in this chapter are output indicators. Outputs are the services delivered, while outcomes are the impact of these services on the status of an individual or group (see chapter 1, section 1.5). Equity is currently represented through one output indicator (‘fees paid by applicants’). Effectiveness is represented through two output indicators (‘backlog’ and ‘judicial officers’). Efficiency is currently represented through three output indicators (‘attendance’, ‘clearance’ and ‘cost per finalisation’).

COURT ADMINISTRATION
7.23
To date, no specific outcome indicators have been identified for court administration. The activities of court administrators lead to broad outcomes within the overall justice system that are not readily addressed by this service specific chapter.
The report’s statistical appendix contains data that may assist in interpreting the performance indicators presented in this chapter. These data cover a range of demographic and geographic characteristics including age profile, geographic distribution of the population, income levels, education levels, tenure of dwellings and cultural heritage (such as Indigenous and ethnic status) (appendix A).
Figure 7.3 Performance indicator framework for court administration
7.3 Key performance indicator results
Different delivery locations, caseloads, casemixes and government policies may affect the equity, effectiveness and efficiency of court administration services. The allocation of cases to different courts also differs across states and territories and Australian courts. Performance comparison needs to take these factors into account. In addition to the material in boxes 7.1, 7.2 and 7.3, appendix A — the statistical appendix — contains detailed statistics and short profiles on each State and Territory, and other data which may assist in interpreting the performance indicators presented in this chapter.

7.24 REPORT ON GOVERNMENT SERVICES 2011
The court administration data collection is based on national counting rules, so data presented in this chapter may differ from data published by individual jurisdictions in their annual reports. There also can be differences from the data reported in the ABS Criminal Courts publication (ABS 2010).
Outputs
Outputs are the services delivered (while outcomes are the impact of these services on the status of an individual or group) (see chapter 1, section 1.5).
Equity — fees paid by applicants
‘Fees paid by applicants’ is an indicator of governments’ achievement against the objective of keeping services accessible. Court fees may have a range of functions, including recovering costs and sending appropriate price signals to potential litigants (with the intention of ensuring that parties consider all appropriate options to resolve disputes). This measure monitors the affordability of average court fees paid by litigants. It is important to note, however, that court fees are only part of the broader legal costs faced by applicants.
Box 7.6 Fees paid by applicants ‘Fees paid by applicants’ is defined as the average court fees paid per lodgment. It is derived by dividing the total court fees collected by the number of lodgments in a year.
Court fees largely relate to civil cases. Providing court administration service quality is held constant, lower court fees help keep courts accessible.
Court fees are only part of the costs faced by litigants (with legal fees being more significant).
Data reported for this indicator are comparable.
Data quality information for this indicator is at www.pc.gov.au/gsp/reports/rogs/2011 .
In 2009-10, average court fees paid per lodgment were generally greater in supreme courts than in district/county and magistrates’ courts (table 7.7). The average fees collected by the Australian, State and Territory courts vary for many reasons and caution should be used in making direct comparisons.

COURT ADMINISTRATION
7.25
Table 7.7 Average civil court fees collected per lodgment, 2009-10 (dollars)a, b
NSWc Vic Qld WA SA Tas ACT NT Aust courts
Total
Supreme (excl. probate)d /Federal 1 988 1 186 782 1 301 2 126 465 1 166 979 1 910 1 443District/county 1 330 1 289 660 856 811 .. .. .. .. 1 057Magistrates’ (total)e 136 90 94 91 134 68 45 50 .. 108
Magistrates’ (only) 143 93 100 93 141 71 47 53 .. 113Children’s — .. — — 3 .. .. .. .. —
Family courtsf .. .. .. 161 .. .. .. .. 51 99Federal Magistrates .. .. .. .. .. .. .. .. 222 222Probate — Supreme 1 020 256 540 193 841 368 708 914 .. 614a Some jurisdictions charge corporations twice the amount individuals are charged, therefore average fees can overstate the charge to individuals. b Totals are derived for each court level by dividing the total fees for that court level by the lodgments for that court level. c Extraction and validation of data from the NSW Justicelink database is still in development. Data provided for 2009-10 include actual and estimated data. d During 2009-10, the Supreme Court of Victoria implemented a new Case Management system and associated Courts Data Warehouse. This has required changes to work practices in registries and judges’ chambers and introduced new systems and opportunities for data analysis. e Victorian Magistrates Court fees include fees paid through VCAT. f Many of the Family Court of Australia’s applications do not attract a fee. .. Not applicable. – Nil or rounded to zero. Source: Australian, State and Territory court administration authorities and departments (unpublished); table 7A.16.
The level of cost recovery from the collection of court fees varied across court levels and across jurisdictions in 2009-10 (table 7.8). Nationally, for the states and territories in total, the proportion of costs recovered through court fees was greatest for magistrates’ courts, followed by district/county courts and then supreme courts. Cost recovery was lowest in the children’s courts and in the Family Court of Australia — in these courts many applications do not attract a fee.
Table 7.8 Civil court fees collected as a proportion of civil recurrent expenditure (cost recovery), 2009-10 (per cent)a, b
NSWc Vic Qld WA SA Tas ACT NT Aust courts
Total
Supremed/Federal 31.8 24.0 34.6 17.4 22.5 10.7 26.2 4.5 7.7 19.8District/County 37.7 30.4 38.8 19.0 28.4 .. .. .. .. 31.0Magistrates’ (total)e 38.6 30.5 21.4 34.3 26.8 36.9 2.5 7.0 .. 30.5
Magistrates’ (only)d 44.9 35.7 25.5 36.8 28.8 37.7 2.8 7.5 .. 35.1Children’s — .. — — 0.4 .. .. .. .. —
Family courtsf .. .. .. 10.1 .. .. .. .. 0.9 2.6Federal Magistrates .. .. .. .. .. .. .. .. 21.6 21.6a Excludes payroll tax. b Some jurisdictions charge corporations twice the amount individuals are charged, therefore average fees can overstate the charge to individuals. c Extraction and validation of data from the NSW Justicelink database is still in development. Data provided for 2009-10 include actual and estimated data. d Excludes probate costs. e Victorian Magistrates’ Court fees include civil and criminal court fees paid through VCAT. f Many of the Family Court of Australia’s applications do not attract a fee. .. Not applicable. – Nil or rounded to zero.
Source: Australian, State and Territory court administration authorities and departments (unpublished); table 7A.15.

7.26 REPORT ON GOVERNMENT SERVICES 2011
Effectiveness — quality
‘Quality’ is an indicator of governments’ achievement against the objective of providing due process. The Steering Committee has identified quality as an important measure of court administration performance (box 7.7). However, a suitable indicator of quality for court administration has not yet been identified for inclusion in the performance framework.
Box 7.7 Indicators of quality Indicators of quality for court administration have not yet been identified.
The perceptions of court users about the quality of the services delivered by courts may be strongly influenced by the outcomes of judicial decisions (which are not the subject of this chapter). Isolating perceptions of the quality of court administration may be difficult.
Effectiveness — backlog indicator
The ‘backlog indicator’ is an indicator of governments’ achievement against the objective of processing matters in an expeditious and timely manner. The indicator recognises that case processing must take some time, that such time does not necessarily equal delay and that the time it takes to process a case can be affected by factors outside the direct control of court administration.
COURT ADMINISTRATION
7.27
Box 7.8 Backlog indicator The ‘backlog indicator’ measures the age of a court’s pending caseload against nominated time standards. The number of cases in the nominated age category is expressed as a percentage of the total pending caseload.
The following national standards have been set:
The Federal Magistrates Court, magistrates’ and children’s courts:
• no more than 10 per cent of lodgments pending completion are to be more than 6 months old
• no lodgments pending completion are to be more than 12 months old.
Supreme courts, the Federal Court, district/county, family and coroners’ courts and all appeals:
• no more than 10 per cent of lodgments pending completion are to be more than 12 months old
• no lodgments pending completion are to be more than 24 months old.
Performance relative to the time standards indicates effective management of caseloads and timely accessibility of court services.
Time taken to process cases is not necessarily court administration delay. Some delays are caused by factors other than those related to the workload of the court (for example, a witness being unavailable).
Data reported for this indicator are not directly comparable.
Data quality information for this indicator is under development.
Results can be affected by the complexity and distribution of cases, which may vary across court levels within each State and Territory and the Australian courts (boxes 7.1, 7.2 and 7.3). Additionally, Tasmania, the ACT and the NT have a two-tier court system (that is, they do not have a district/county court level), whereas the other states and territories have a three-tier court system. This difference needs to be taken into account when comparing the results of the backlog indicator.
Data on the backlog indicator for criminal matters are contained in table 7.9. In the criminal jurisdiction, those defendants who failed to appear when required and had warrants issued have been excluded from the pending caseload count.

7.28 REPORT ON GOVERNMENT SERVICES 2011
Table 7.9 Backlog indicator — all criminal matters, as at 30 June 2010
Unit NSWa Vic Qld WA SA Tas ACT NT Higherb, c — appeal Pending caseload no. 1 684 1 850 393 187 79 17 82 17cases > 12 mths % 1.6 17.0 10.4 3.7 2.5 11.8 15.9 –cases > 24 mths % 0.4 2.8 0.5 – – – 3.7 –Higherb, c — non-appealc Pending caseload no. 1 772 1 959 2 811 1 166 1 625 321 398 157cases > 12 mths % 6.0 26.6 16.0 5.9 23.3 12.1 38.4 8.3cases > 24 mths % 0.5 7.6 5.8 0.8 5.8 4.0 9.5 –Supremec, d — appeal Pending caseload no. 236 569 156 187 79 17 82 17cases > 12 mths % 7.6 38.1 5.1 3.7 2.5 11.8 15.9 –cases > 24 mths % 3.0 6.0 0.6 – – – 3.7 –Supremec, d — non-appeale Pending caseload no. 75 108 540 52 50 321 398 157cases > 12 mths % 16.0 30.6 17.2 5.8 14.0 12.1 38.4 8.3cases > 24 mths % 1.3 8.3 3.7 – 2.0 4.0 9.5 –District/County — appealf Pending caseload no. 1 448 1 281 237 .. .. .. .. ..cases > 12 mths % 0.6 7.6 13.9 .. .. .. .. ..cases > 24 mths % – 1.3 0.4 .. .. .. .. ..District/Countye — non-appeal Pending caseload no. 1 697 1 851 2 271 1 114 1 575 .. .. ..cases > 12 mths % 5.6 26.4 15.7 5.9 23.6 .. .. ..cases > 24 mths % 0.4 7.5 6.3 0.8 5.9 .. .. ..Magistrates’ Pending caseload no. 21 859 30 506 29 503 11 276 18 703 8 543 1 450 3 040cases > 6 mths % 11.1 26.6 29.8 22.8 29.6 33.1 19.6 43.1cases >12 mths % 2.3 8.4 14.1 7.9 11.9 14.7 7.2 30.2Children’s
Pending caseload no. 2 550 4 157 2 504 1 934 1 811 847 223 385cases > 6 mths % 8.4 16.5 24.6 23.9 18.8 27.9 16.1 29.1cases >12 mths % 0.9 3.5 9.9 7.8 5.2 10.9 8.1 17.4a Extraction and validation of data from the NSW Justicelink database is still in development. Data provided for 2009-10 include actual and estimated data. b Higher refers to supreme and district/county courts combined. c In NSW, the criminal casemix of the Supreme Court is principally murder and manslaughter cases and therefore not directly comparable with supreme courts in other states and territories. d During 2009-10, the Supreme Court of Victoria implemented a new Case Management system and associated Courts Data Warehouse. This has required changes to work practices in registries and judges’ chambers and introduced new systems and opportunities for data analysis. e For Queensland supreme and district courts, the age of non-appeal cases is calculated from the date the court record was first created in the computerised case management system in the supreme or district court, not from the date of the committal order in the magistrates’ court. f There is no criminal appellate jurisdiction in the district courts in WA or SA. All criminal appeals from magistrates’ courts go directly to supreme courts in these states. .. Not applicable. – Nil or rounded to zero.
Source: State and Territory court administration authorities and departments (unpublished); table 7A.17.

COURT ADMINISTRATION
7.29
The age of the pending workload and civil case processing timeliness can be affected by several factors (box 7.9).
Box 7.9 Civil timeliness factors The following factors may affect the timeliness of case processing in the civil courts:
• where civil cases are contested, a single case may involve several related applications or issues that require judgments and decisions by the court
• the parties to a case can significantly affect the conduct and timeliness of a case — that is, matters often may be adjourned at the instigation of, and by the consent of, the parties — such consent arrangements are outside the control of the court
• the court may employ case management or other dispute resolution processes (for example, mediation) that are alternatives to formal adjudication
• an inactive case is regarded as finalised (or closed) 12 months after the last action on the case (in accordance with the counting rules for this data collection).
The age of the pending caseload and case processing timeliness in criminal cases (and for some civil cases) can also be affected by orders or programs that are initiated following a court lodgment, but prior to a court finalisation. These programs or orders are commonly referred to as diversion programs and are outlined in more detail in box 7.10.
Different case completion times in the civil jurisdiction of the states and territories generally reflect different case flow management practices, the individual needs of cases, and the priority given to criminal matters.
Data for the backlog indicator for civil matters are contained in table 7.10. In the civil jurisdiction, those lodgments that have not been acted upon in the past 12 months are counted as finalised for the purpose of this Report, the aim being to focus on those matters that are part of an ‘active pending’ population. Some courts (for example, the Australian courts) proactively manage all their civil cases and apply this deeming rule to very few, if any, cases.

7.30 REPORT ON GOVERNMENT SERVICES 2011
Box 7.10 Diversion programs and the impact on timeliness Courts offer diversion programs to improve the quality of outcomes within the justice system and for the community generally. Diversion programs can involve processes that are outside the control of court administration. The period between lodgment and finalisation can be affected by those processes. Within the criminal justice system, diversion programs are usually focussed on rehabilitation for the defendant and/or restoration for the victim. They are most often (but not exclusively) used in magistrates’ courts, and usually are voluntary. Examples include:
• referral of defendants to drug programs (from counselling through to treatment programs) — available in all states and territories except Tasmania
• referral of defendants to a mental health court (Queensland and SA) or for various mental health assessments (NSW, WA and the ACT)
• referral of defendants to a family violence court (WA and SA) for participation in targeted programs
• referral of defendants to an Indigenous court or Circle Sentencing program (NSW, Victoria, Queensland, SA and the ACT and a pilot program in WA).
The processes listed above can range in completion times between one week and seven years. With some diversion programs, success will delay finalisation significantly. For example, some drug court programs can require compliance for 12 months or longer before the defendant is considered to have completed the program.
Within the civil justice system, diversion programs can be a quicker and cheaper form of dispute resolution. Examples include:
• mediation — referrals can be made at any time during the proceedings. A court may require parties to complete a mediation program within a specified time, or can consider the timeframe to be ‘open-ended’ (for example, referrals to the National Native Title Tribunal). Completion time can also be affected by the complexity of the dispute and the number of parties involved, and can therefore vary significantly from case to case. Usually all parties consent to use mediation, but in some states parties can be ordered to mediate their dispute
• arbitration — referrals are usually made early in the proceedings and the court supervises the process. The hearing is shorter than a court hearing. Participation can be voluntary or by order
• reference to a referee — technical issues arising in proceedings may be referred to suitably qualified experts (referees) for inquiry and report. The court supervises the process and may adopt, vary or reject the report.
Success at mediation (settlement of the case) or at arbitration (acceptance of the arbitrator’s award) generally finalises cases earlier than if finalised by trial and judgment. Where the mediation or arbitration is unsuccessful, the delaying effect on finalisation is highly variable.

COURT ADMINISTRATION
7.31
Table 7.10 Backlog indicator — all civil matters, as at 30 June 2010 Unit NSWa Vic Qld WA SA Tas ACT NT Aust
courtsHigherb — appeal Pending caseload no. 522 404 181 216 72 51 25 37 280cases > 12 mths % 10.7 25.7 9.4 15.7 19.4 29.4 20.0 2.7 10.4cases > 24 mths % 2.7 6.7 1.1 2.3 6.9 9.8 – – 2.1Higher (excl probate)b — non-appealc Pending caseload no. 13 340 11 095 10 728 6 612 4 219 868 1 557 166 2 494cases >12 mths % 23.3 26.1 22.3 26.8 42.6 38.4 51.4 48.8 43.4cases > 24 mths % 9.1 8.7 4.7 10.8 18.8 11.8 23.6 19.3 31.0Supreme/Federal — appealb, d Pending caseload no. 459 345 112 129 63 51 25 37 280cases >12 mths % 11.5 28.4 – 15.5 22.2 29.4 20.0 2.7 10.4cases > 24 mths % 3.1 7.8 – 1.6 7.9 9.8 – – 2.1Supreme (excl probate)/Federal — non-appealc, d Pending caseload no. 6 620 4 906 6 263 3 330 698 868 1 557 166 2 494cases >12 mths % 29.4 27.3 24.1 28.1 31.4 38.4 51.4 48.8 43.4cases > 24 mths % 13.8 9.3 5.4 12.7 13.5 11.8 23.6 19.3 31.0District/county — appeal Pending caseload no. 63 59 69 87 9 .. .. .. ..cases >12 mths % 4.8 10.2 24.6 16.1 – .. .. .. ..cases >24 mths % – – 2.9 3.4 – .. .. .. ..District/county — non-appeal Pending caseload no. 6 720 6 189 4 465 3 282 3 521 .. .. .. ..cases >12 mths % 17.2 25.1 19.6 25.4 44.8 .. .. .. ..cases > 24 mths % 4.4 8.2 3.8 8.9 19.9 .. .. .. ..Magistrates’e, f, g Pending caseload no. na 18 835 28 275 22 378 13 237 5 781 720 2 201 ..cases > 6 mths % na 28.0 49.8 38.7 42.9 41.8 40.8 39.7 ..cases > 12 mths % na 14.0 7.7 6.0 9.3 10.8 15.7 7.6 ..Family courts — appeal Pending caseload no. .. .. .. 22 .. .. .. .. 201cases >12 mths % .. .. .. 27.3 .. .. .. .. 23.9cases > 24 mths % .. .. .. 18.2 .. .. .. .. 7.5Family courts — non-appealh Pending caseload no. .. .. .. 11 857 .. .. .. .. 5 873cases > 12 mths % .. .. .. 38.5 .. .. .. .. 27.8cases > 24 mths % .. .. .. 16.9 .. .. .. .. 10.4Federal Magistratesh Pending caseload no. .. .. .. .. .. .. .. .. 28 930cases > 6 mths % .. .. .. .. .. .. .. .. 26.8cases > 12 mths % .. .. .. .. .. .. .. .. 9.3Coroners’ courtsi
Pending caseload no. 3 098 5 586 2 707 1 685 1 456 321 236 360 ..cases > 12 mths % 38.1 46.3 23.2 33.7 29.7 29.6 27.5 19.7 ..cases > 24 mths % 13.0 18.4 7.6 17.8 11.1 9.3 11.9 10.6 ..
(Continued on next page)

7.32 REPORT ON GOVERNMENT SERVICES 2011
Table 7.10 (Continued) a Extraction and validation of data from the NSW Justicelink database is still in development. Data provided for 2009-10 include actual and estimated data. b Higher refers to State and Territory supreme and district/county courts combined, and includes the Federal Court. c Non-appeal matters for the Federal Court include a significant number of Native Title matters which by nature are both long and complex. d During 2009-10, the Supreme Court of Victoria implemented a new Case Management system and associated Courts Data Warehouse. This has required changes to work practices in registries and judges’ chambers and introduced new systems and opportunities for data analysis. e Excludes children’s courts. Pending and backlog data are not available for civil matters in the NSW Magistrates Courts. f Victorian Magistrates’ Court civil data include a proportion of pending caseload from VCAT. g The number of civil cases lodged and pending as at 30 June 2010 in the Queensland Magistrates Courts has decreased due to the introduction of the Queensland Civil and Administrative Tribunal (QCAT) on 1 December 2009. During the period 1 December 2009 to 30 June 2010 there were 16 060 minor civil disputes lodged with QCAT. Previously these lodgments would have been included in the Magistrates Court Civil jurisdiction. In the Magistrates Courts outside the South East Queensland region, magistrates are still responsible for hearing these civil cases, in addition to other disputes lodged with QCAT, such as cases including guardianship, anti-discrimination and childrens’ services, which are not within the scope of this Report. h The Family Court of Australia and the Federal Magistrates Court do not deem a matter as finalised even where there has been no court event for at least 12 months. Some matters may be affected by proceedings in other courts, for example, and although currently inactive they are included in the data for this indicator. The more complex and entrenched Family Law disputes commence with the Family Court so a higher proportion of its cases require more lengthy and intensive case management. i In 2009-10 the WA Coroners Court implemented a new reporting system utilising WA Coroners Court data stored in the National Coroners Information System which now includes WA State-wide data. na Not available. .. Not applicable. – Nil or rounded to zero.
Source: Australian, State and Territory court authorities and departments (unpublished); table 7A.18.
Effectiveness — judicial officers
‘Judicial officers’ is an indicator of governments’ achievement against the objective of providing services that are accessible to the community. This indicator relates access to the number of judicial officers available to deal with cases in relation to population size (box 7.11).

COURT ADMINISTRATION
7.33
Box 7.11 Judicial officers ‘Judicial officers’ is an indicator that represents the availability of resources to provide services. Judicial officers are officers who can make enforceable orders of the court. For the purposes of this chapter, the definition of a judicial officer includes:
• judges
• associate judges
• magistrates
• masters
• coroners
• judicial registrars
• all other officers who, following argument and giving of evidence, make enforceable orders of the court.
The number of judicial officers is expressed in full time equivalent units and, where judicial officers have both judicial and non-judicial work, refers to the proportion of time allocated to judicial work.
The number of judicial officers is additionally presented in comparison to the population of each jurisdiction. A higher proportion of judicial officers in the population indicates potentially greater access to the judicial system.
Factors such as geographical dispersion, judicial workload and population density are also important to consider when comparing figures concerning judicial officers.
Data reported for this indicator are comparable.
Data quality information for this indicator is at www.pc.gov.au/gsp/reports/rogs/2011 .
The number of full time equivalent judicial officers for each court level is outlined in table 7.11. In all State and Territory jurisdictions with a three-tier system, there were more judicial officers in magistrates’ courts than in district/county courts, and (apart from WA) more officers in the district/county courts than in the supreme courts. Table 7.12 shows the number of judicial officers per 100 000 people.

7.34 REPORT ON GOVERNMENT SERVICES 2011
Table 7.11 Judicial officers, full time equivalent, 2009-10a NSWb Vic Qld WA SA Tas ACT NT Aust
courts Total
Supreme/Federal 61.4 45.0 23.3 29.4 13.8 6.9 5.2 8.2 52.0 245.1District/County 65.7 58.7 32.3 28.8 21.4 .. .. .. .. 206.9Magistrates’c 114.0 125.5 71.4 46.0 35.6 11.4 6.7 13.4 .. 424.0Children’s 20.1 8.0 7.6 5.6 4.3 0.8 1.4 1.1 .. 48.8Family courtsd .. .. .. 14.6 .. .. .. .. 35.4 50.0Federal Magistratese .. .. .. .. .. .. .. .. 59.3 59.3Coroners’ courts 5.0 9.0 6.4 2.0 2.0 0.6 0.2 1.6 .. 26.8Totalf 266.2 246.2 141.1 126.4 77.1 19.7 13.5 24.2 146.7 1 060.9a Totals may not add as a result of rounding. b Extraction and validation of data from the NSW Justicelink database is still in development. Data provided for 2009-10 include actual and estimated data. c Data for Victoria include a proportion of judicial officers from VCAT. d Family Court of Australia figures include Family Court of Australia judges assigned to the Full Court Appeals division. e Includes Family Court of Australia services provided free of charge. f Excludes electronic infringement and enforcement systems as they do not have open court sittings and therefore do not require judicial officers. .. Not applicable. na Not available.
Source: Australian, State and Territory court administration authorities and departments (unpublished); table 7A.20.
Table 7.12 Judicial officers, full time equivalent, per 100 000 people, 2009-10
NSW a Vic Qld WA SA Tas ACT NT Aust courtsb
Totalc
Population (‘000)d 7 191 5 496 4 473 2 270 1 634 505 355 228 22 155 Judicial officers per 100 000 people Supreme/Federal 0.9 0.8 0.5 1.3 0.8 1.4 1.5 3.6 0.2 1.1District/County 0.9 1.1 0.7 1.3 1.3 .. .. .. .. 0.9Magistrates’e 1.6 2.3 1.6 2.0 2.2 2.3 1.9 5.9 .. 1.9Children’s 0.3 0.1 0.2 0.2 0.3 0.2 0.4 0.5 .. 0.2Family courts f .. .. .. 0.6 .. .. .. .. 0.2 0.2Federal Magistrates .. .. .. .. .. .. .. .. 0.3 0.3Coroners’ courts 0.1 0.2 0.1 0.1 0.1 0.1 0.1 0.7 .. 0.1Totalg 3.7 4.5 3.2 5.6 4.7 3.9 3.8 10.6 0.7 4.8a Extraction and validation of data from the NSW Justicelink database is still in development. Data provided for 2009-10 include actual and estimated data. b The Australian courts results have been derived using the total population figure for Australia. c Totals are derived by dividing the total number of judicial FTE at each court level by the Australian population (per 100 000). d Population total for Australia includes ‘Other territories’. Population data for the financial year is the midpoint (31 December) estimate. e Victorian Magistrates’ Court data include a proportion of judicial officers from VCAT. f Family Court of Australia figures include Family Court of Australia judges assigned to the Full Court Appeals division. g Excludes electronic infringement and enforcement systems as they do not have open court sittings and therefore do not require judicial officers. .. Not applicable. na Not available
Source: Australian, State and Territory court administration authorities and departments (unpublished).

COURT ADMINISTRATION
7.35
Efficiency — attendance indicator
The ‘attendance indicator’ is an indicator of governments’ achievement against the objective of providing court administration services in an efficient manner (box 7.12). Court attendances act as a proxy for input costs. Attendance data can be difficult to collect. Due to system limitations, some jurisdictions supply data on listed hearings rather than actual attendances in court.
Box 7.12 Attendance indicator The ‘attendance indicator’ is defined as the average number of attendances recorded (no matter when the attendance occurred) for those cases that were finalised during the year. The number of attendances is the number of times that parties or their representatives are required to be present in court to be heard by a judicial officer or mediator/arbitrator where binding orders can be made. The number includes appointments that are adjourned or rescheduled.
Fewer attendances may suggest a more efficient process. However, this should be balanced against the likelihood that the number of attendances will increase if rehabilitation or diversionary programs are used, or if intensive case management is used. Both of these paths are believed to improve the quality of outcomes:
• rehabilitation and diversionary programs aim to provide therapeutic benefits for the offenders, and benefits of reduced recidivism for the community
• intensive case management is believed to maximise the prospects of settlement (and thereby reduce the litigant’s costs, the number of cases queuing for hearing, and the flow of work on to appellate courts); alternatively, it can narrow the issues for trial (thus shortening trial time and also reducing costs and the queuing time for other cases waiting for hearing).
Data reported for this indicator are not directly comparable.
Data quality information for this indicator is under development.
Attendance indicator results for criminal proceedings are reported in table 7.13.

7.36 REPORT ON GOVERNMENT SERVICES 2011
Table 7.13 Attendance indicator — criminal, 2009-10a NSWb Vic Qld WA SA Tas ACT NT Average attendances per finalisation Supremec, d na 1.7 2.8 2.8 4.0 6.2 6.7 6.9District/Countye na 7.8 3.8 4.0 6.1 .. .. ..Magistrates’f na 3.0 2.3 2.3 3.5 3.6 3.3 4.1Children’s na 3.1 2.7 3.6 3.4 4.8 6.9 5.6a Excludes data for the electronic infringement and enforcement systems. b NSW data are not available. c During 2009-10, the Supreme Court of Victoria implemented a new Case Management system and associated Courts Data Warehouse. This has required changes to work practices in registries and judges’ chambers and introduced new systems and opportunities for data analysis. d Queensland attendance data do not include attendances for appeal cases. e Attendance data for WA are based on number of hearings listed, not the number which actually occurred. f Data for Victoria include a proportion of hearings from VCAT. na Not available. .. Not applicable.
Source: State and Territory court administration authorities and departments (unpublished); table 7A.19.
Attendance indicator results for civil proceedings are reported in table 7.14.
Table 7.14 Attendance indicator — civil, 2009-10 NSWa Vic Qld WA SA Tas ACT NT Aust
courts Average attendances per finalisation Supreme (excl. probate)b, c/Federal na 1.0 1.5 2.3 4.0 na 4.8 5.6 3.8District/countyb na 2.3 0.8 2.2 4.9 .. .. .. ..Magistratesd, e na 0.9 0.7 0.7 0.8 0.3 1.5 1.0 ..Children’se, f na 1.8 3.0 5.0 2.7 .. 6.5 1.5 ..Family courtsg .. .. .. 1.6 .. .. .. .. 2.8Federal Magistratesh .. .. .. .. .. .. .. .. 2.1Coroners’ courts na 0.9 3.1 1.0 1.3 1.0 3.9 1.0 ..a NSW data are not available. b Queensland’s supreme and district courts data diverge from the national counting rules as follows: (i) multiple attendances are counted for multi-day court events (such as multi-day trials); (ii) attendances for unfinalised cases are included in the data; (iii) case-managed court events are not included in the data; and (iv) attendances for appeal cases are not included. c During 2009-10, the Supreme Court of Victoria implemented a new Case Management system and associated Courts Data Warehouse. This has required changes to work practices in registries and judges’ chambers and introduced new systems and opportunities for data analysis. d Victorian Magistrates’ Court data include a proportion of hearings from VCAT. e ACT data are based on all listings for a case, including return of subpoenas, settlement and case management conferences. Multiple attendances are counted for a single event. f Queensland Children’s Court data are based on a count of cases, not the number of children involved in the care and protection case. g Family Court of Australia data include all conference events that may have binding orders made. Data also contain events that may not require the attendance of parties (such as divorce hearings), however these are included as they form part of the lodgment and finalisation data. h Federal Magistrates Court attendance data exclude responses to applications. na Not available. .. Not applicable.
Source: Australian, State and Territory court administration authorities and departments (unpublished); table 7A.19.
In the context of the attendance indicator, it is important to note that Alternative Dispute Resolution (ADR) can resolve some types of matters out of court and

COURT ADMINISTRATION
7.37
thereby reduce the need for judicial hearings. Accordingly, differences between and within states and territories in the availability and use of ADR can affect the comparability of the attendance indicator.
Efficiency — clearance indicator
The ‘clearance indicator’ is another indicator of governments’ achievement against the objective of providing court administration services in an efficient manner (box 7.13).
Box 7.13 Clearance indicator The ‘clearance indicator’ is measured by dividing the number of finalisations in the reporting period by the number of lodgments in the same period. The result is multiplied by 100 to convert to a percentage. It shows whether the volume of case finalisations has matched the number of case lodgments during the reporting period. It indicates whether a court’s pending caseload would have increased or decreased over that period.
The following can assist in interpretation of this indicator:
• a figure of 100 per cent indicates that, during the reporting period, the court finalised as many cases as were lodged, and the pending caseload should be similar to the pending caseload 12 months earlier
• a figure greater than 100 per cent indicates that, during the reporting period, the court finalised more cases than were lodged, and the pending caseload should have decreased
• a figure less than 100 per cent indicates that, during the reporting period, the court finalised fewer cases than were lodged, and the pending caseload should have increased.
The clearance indicator should be interpreted alongside lodgment and finalisation data, and the backlog indicator reported earlier in this chapter. Trends over time should also be considered.
The clearance indicator can be affected by external factors (such as those causing changes in lodgment rates), as well as by changes in a court’s case management practices.
Data reported for this indicator are comparable.
Data quality information for this indicator is under development.
Lodgments are a reflection of demand for court services. Lodgments need not equal finalisations in any given year because not all matters lodged in a given year will be finalised in the same year. Consequently, results for this indicator need to be interpreted within the context of changes in the volumes of lodgments, finalisations

7.38 REPORT ON GOVERNMENT SERVICES 2011
and pending caseloads over time. Clearance indicator data in 2009-10 are presented separately for the criminal and civil jurisdictions in tables 7.15 and 7.16. Where relevant, the clearance indicator data have been disaggregated between appeal and non-appeal matters.
Table 7.15 Clearance indicator — all criminal matters, 2009-10a unit NSWb Vic Qld WA SA Tas ACT NT Supreme — appealc Lodgments ‘000 0.41 0.56 0.35 0.34 0.25 0.02 0.10 0.03 Finalisations ‘000 0.35 0.53 0.34 0.31 0.27 0.03 0.07 0.03Clearance rate % 86.7 95.7 98.6 92.6 109.2 131.8 68.6 73.5Supreme — non-appealc, d Lodgments ‘000 0.10 0.19 1.40 0.23 0.09 0.66 0.31 0.42 Finalisations ‘000 0.12 0.20 1.30 0.23 0.09 0.62 0.27 0.40Clearance rate % 119.2 107.5 92.8 99.6 101.1 94.5 85.9 95.2District/County — appeale Lodgments ‘000 8.17 2.84 0.40 .. .. .. .. .. Finalisations ‘000 8.19 2.48 0.49 .. .. .. .. ..Clearance rate % 100.2 87.3 122.3 .. .. .. .. ..District/County — non-appeale Lodgments ‘000 3.45 2.23 6.21 2.34 2.03 .. .. .. Finalisations ‘000 3.52 2.25 6.00 2.55 2.05 .. .. ..Clearance rate % 101.9 100.9 96.6 109.2 101.0 .. .. ..Magistrates’ Lodgments ‘000 187.92 160.44 202.97 104.02 52.64 21.32 5.70 12.59 Finalisations ‘000 183.03 176.13 206.20 108.14 58.69 20.39 5.85 12.22Clearance rate % 97.4 109.8 101.6 104.0 111.5 95.6 102.7 97.0Children’s
Lodgments ‘000 16.76 22.92 12.22 10.79 6.48 2.32 0.62 1.30 Finalisations ‘000 15.43 23.92 12.25 11.14 6.75 2.08 0.66 1.19Clearance rate % 92.0 104.4 100.2 103.3 104.3 89.8 105.6 91.0Electronic infringement and enforcement systemsf Lodgments ‘000 .. 1226.67 620.34 266.16 197.74 .. .. .. Finalisations ‘000 .. 997.28 565.29 244.54 262.23 .. .. ..Clearance rate % .. 81.3 91.1 91.9 132.6 .. .. ..
a Clearance indicator results are derived from finalisation and lodgment data presented in tables 7A.1 and 7A.5. b Extraction and validation of data from the NSW Justicelink database is still in development. Data provided for 2009-10 include actual and estimated data. c During 2009-10, the Supreme Court of Victoria implemented a new Case Management system and associated Courts Data Warehouse. This has required changes to work practices in registries and judges’ chambers and introduced new systems and opportunities for data analysis. d Queensland supreme and district courts data for the number of originating criminal lodgments are based on a count of the number of defendants who had an indictment presented in the financial year — it is not a count of the number of defendants committed to the supreme/district courts for trial or sentencing. e Appeals are not heard in the district courts in WA or SA, instead they are referred to the supreme courts in these states. f Data for the electronic infringement and enforcement systems include unpaid infringement notices but exclude unpaid court fines. .. Not applicable.
Source: Australian, State and Territory court administration authorities and departments (unpublished); tables 7A.1, 7A.5, and 7A.21.
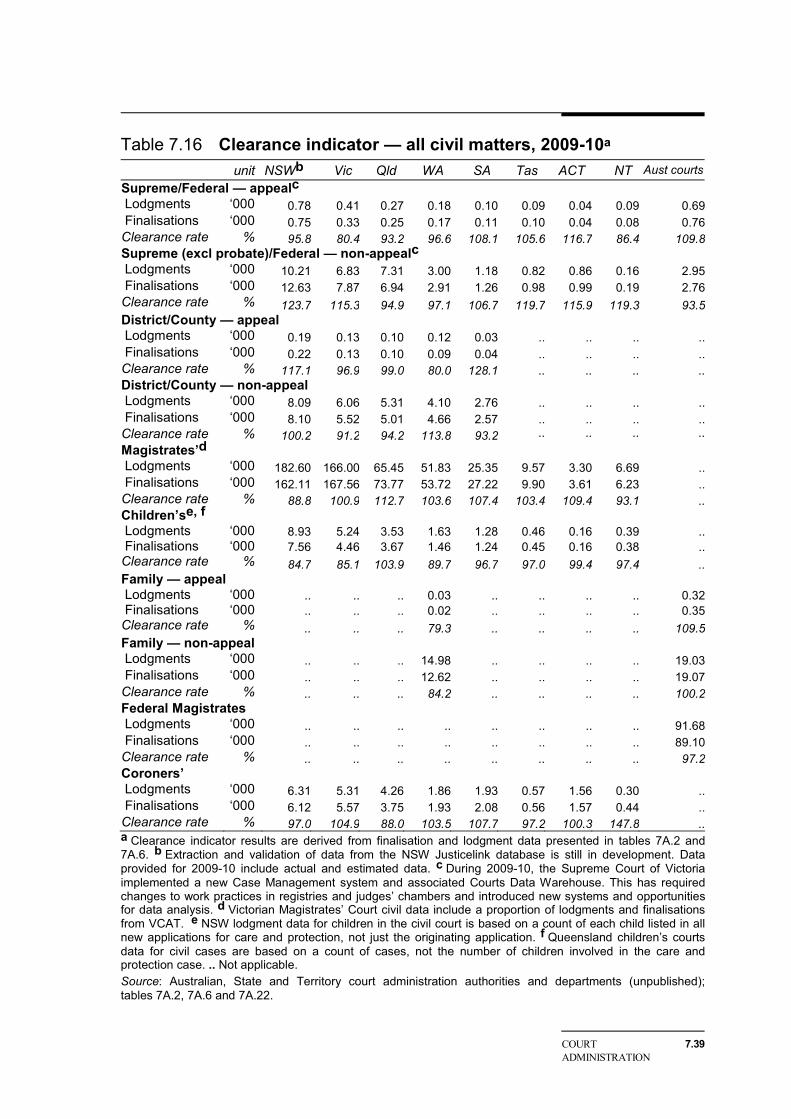
COURT ADMINISTRATION
7.39
Table 7.16 Clearance indicator — all civil matters, 2009-10a unit NSWb Vic Qld WA SA Tas ACT NT Aust courtsSupreme/Federal — appealc Lodgments ‘000 0.78 0.41 0.27 0.18 0.10 0.09 0.04 0.09 0.69 Finalisations ‘000 0.75 0.33 0.25 0.17 0.11 0.10 0.04 0.08 0.76Clearance rate % 95.8 80.4 93.2 96.6 108.1 105.6 116.7 86.4 109.8Supreme (excl probate)/Federal — non-appealc Lodgments ‘000 10.21 6.83 7.31 3.00 1.18 0.82 0.86 0.16 2.95 Finalisations ‘000 12.63 7.87 6.94 2.91 1.26 0.98 0.99 0.19 2.76Clearance rate % 123.7 115.3 94.9 97.1 106.7 119.7 115.9 119.3 93.5District/County — appeal Lodgments ‘000 0.19 0.13 0.10 0.12 0.03 .. .. .. .. Finalisations ‘000 0.22 0.13 0.10 0.09 0.04 .. .. .. ..Clearance rate % 117.1 96.9 99.0 80.0 128.1 .. .. .. ..District/County — non-appeal Lodgments ‘000 8.09 6.06 5.31 4.10 2.76 .. .. .. .. Finalisations ‘000 8.10 5.52 5.01 4.66 2.57 .. .. .. ..Clearance rate % 100.2 91.2 94.2 113.8 93.2 .. .. .. ..Magistrates’d Lodgments ‘000 182.60 166.00 65.45 51.83 25.35 9.57 3.30 6.69 .. Finalisations ‘000 162.11 167.56 73.77 53.72 27.22 9.90 3.61 6.23 ..Clearance rate % 88.8 100.9 112.7 103.6 107.4 103.4 109.4 93.1 ..Children’se, f Lodgments ‘000 8.93 5.24 3.53 1.63 1.28 0.46 0.16 0.39 .. Finalisations ‘000 7.56 4.46 3.67 1.46 1.24 0.45 0.16 0.38 ..Clearance rate % 84.7 85.1 103.9 89.7 96.7 97.0 99.4 97.4 ..Family — appeal Lodgments ‘000 .. .. .. 0.03 .. .. .. .. 0.32 Finalisations ‘000 .. .. .. 0.02 .. .. .. .. 0.35Clearance rate % .. .. .. 79.3 .. .. .. .. 109.5Family — non-appeal Lodgments ‘000 .. .. .. 14.98 .. .. .. .. 19.03 Finalisations ‘000 .. .. .. 12.62 .. .. .. .. 19.07Clearance rate % .. .. .. 84.2 .. .. .. .. 100.2Federal Magistrates Lodgments ‘000 .. .. .. .. .. .. .. .. 91.68 Finalisations ‘000 .. .. .. .. .. .. .. .. 89.10Clearance rate % .. .. .. .. .. .. .. .. 97.2Coroners’ Lodgments ‘000 6.31 5.31 4.26 1.86 1.93 0.57 1.56 0.30 .. Finalisations ‘000 6.12 5.57 3.75 1.93 2.08 0.56 1.57 0.44 ..Clearance rate % 97.0 104.9 88.0 103.5 107.7 97.2 100.3 147.8 ..a Clearance indicator results are derived from finalisation and lodgment data presented in tables 7A.2 and 7A.6. b Extraction and validation of data from the NSW Justicelink database is still in development. Data provided for 2009-10 include actual and estimated data. c During 2009-10, the Supreme Court of Victoria implemented a new Case Management system and associated Courts Data Warehouse. This has required changes to work practices in registries and judges’ chambers and introduced new systems and opportunities for data analysis. d Victorian Magistrates’ Court civil data include a proportion of lodgments and finalisations from VCAT. e NSW lodgment data for children in the civil court is based on a count of each child listed in all new applications for care and protection, not just the originating application. f Queensland children’s courts data for civil cases are based on a count of cases, not the number of children involved in the care and protection case. .. Not applicable. Source: Australian, State and Territory court administration authorities and departments (unpublished); tables 7A.2, 7A.6 and 7A.22.

7.40 REPORT ON GOVERNMENT SERVICES 2011
All matters
Table 7.17 contains clearance indicator results for all court matters (both criminal and civil) in 2009-10, and combines appeal and non-appeal matters.
Table 7.17 Clearance indicator — all matters, 2009-10 (per cent)a NSWb Vic Qld WA SA Tas ACT NT Aust
courts Supreme/Federalc, d .. Criminal 93.1 98.7 93.9 95.4 107.1 95.7 81.6 93.6 .. Civil 121.7 113.3 94.9 97.1 106.8 118.3 115.9 107.6 96.6 Total 120.5 111.9 94.7 96.8 106.8 108.6 105.1 98.6 96.6District/county Criminal 100.7 93.3 98.2 109.2 101.0 .. .. .. .. Civil 100.6 91.3 94.3 112.8 93.6 .. .. .. .. Total 100.7 92.2 96.4 111.6 96.7 .. .. .. ..Magistrates’e Criminal 97.4 109.8 101.6 104.0 111.5 95.6 102.7 97.0 .. Civil 88.8 100.9 112.7 103.6 107.4 103.4 109.4 93.1 .. Total 93.2 105.3 104.3 103.8 110.2 98.1 105.2 95.7 ..Children’s f, g Criminal 92.0 104.4 100.2 103.3 104.3 89.8 105.6 91.0 .. Civilg 84.7 85.1 103.9 89.7 96.7 97.0 99.4 97.4 .. Total 89.5 100.8 101.0 101.6 103.1 91.0 104.3 92.4 ..E– infringement and enforcement systemsh .. 81.3 91.1 91.9 132.6 .. .. .. ..Family courts .. .. .. 84.2 .. .. .. .. 100.3Federal Magistrates .. .. .. .. .. .. .. .. 97.2Coroners’ courts 97.0 104.9 88.0 103.5 107.7 97.2 100.3 147.8 ..a Clearance indicator results are derived from finalisation and lodgment data presented in tables 7A.1-2 and 7A.5-6. b Extraction and validation of data from the NSW Justicelink database is still in development. Data provided for 2009-10 include actual and estimated data. c Supreme courts data exclude probate matters. d During 2009-10, the Supreme Court of Victoria implemented a new Case Management system and associated Courts Data Warehouse. This has required changes to work practices in registries and judges’ chambers and introduced new systems and opportunities for data analysis. e Victorian Magistrates’ Court civil data include a proportion of hearings from VCAT. f NSW lodgment data for children in the civil court are based on a count of each child listed in all new applications for care and protection, not just the originating application. g Queensland children’s courts data for civil cases are based on a count of cases, not the number of children involved in the care and protection case. h Data for the electronic infringement and enforcement systems include unpaid infringement notices but exclude unpaid court fines. .. Not applicable.
Source: Australian, State and Territory court administration authorities and departments (unpublished); tables 7A.1-2, 7A.5-6, and 7A.21-22.

COURT ADMINISTRATION
7.41
Efficiency — cost per finalisation
‘Cost per finalisation’ is a third indicator of governments’ achievement against the objective of providing court administration services in an efficient manner (box 7.14). Cost is taken as the total net recurrent annual expenditure, excluding payroll tax. Net expenditure refers to expenditure minus income (where income is derived from court fees and other revenue but excludes revenue from fines).
Box 7.14 Cost per finalisation ‘Cost per finalisation’ is measured by dividing the total net recurrent expenditure within each court for the financial year by the total number of finalisations for the same period. This indicator is not a measure of the actual cost per case.
The following points need to be considered in interpreting the cost per finalisation indicator results:
• some finalisations take only a short time and require few resources, whereas other finalisations may be resource intensive and involve complicated trials and interlocutory decisions
• cases in the civil jurisdiction that have not been acted upon in the last 12 months are counted (deemed) as finalised (although some jurisdictions are unable to comply with this deeming rule)
• expenditure data may include arbitrary allocation between criminal and civil jurisdictions
• net expenditure is calculated by deducting income (court fees) from total expenditure, noting that in some jurisdictions court fees are set by government rather than by court administrators
• a number of factors are beyond the control of jurisdictions, such as geographic dispersion, economies of scale and socioeconomic factors
• efficiency results need to be viewed in light of the performance indicator framework as a whole, because there can be trade-offs between efficiency on the one hand and equity, effectiveness and quality, on the other.
Data reported for this indicator are not directly comparable.
Data quality information for this indicator is under development.
In general, the net recurrent expenditure per finalisation results for civil courts will be lower than criminal courts, because, with the exception of electronic infringement and enforcements systems, relatively little income is generated by the criminal court system (table 7A.11). Civil court fee structures can also impact on cost per finalisation results (table 7A.15).

7.42 REPORT ON GOVERNMENT SERVICES 2011
Net expenditure per finalisation for the supreme courts and the Federal Court of Australia
Nationally, in 2009-10, total net expenditure per finalisation in the criminal jurisdiction of supreme courts was generally greater than the total net expenditure per finalisation for the civil jurisdiction, including the Federal Court — the Federal Court has no criminal jurisdiction (figure 7.4).
Figure 7.4 Net recurrent expenditure per finalisation, supreme courts and the Federal Court of Australia, 2009-10a, b, c, d, e
0
5 000
10 000
15 000
20 000
25 000
30 000
NSW Vic Qld WA SA Tas ACT NT FCA Total
$/fin
alis
atio
n
Criminal Civil
FCA = Federal Court of Australia
a Excludes payroll tax. b Supreme courts data for the civil jurisdiction exclude uncontested probate matters. c During 2009-10, the Supreme Court of Victoria implemented a new Case Management system and associated Courts Data Warehouse. This has required changes to work practices in registries and judges’ chambers and introduced new systems and opportunities for data analysis. d The Federal Court does not operate in the criminal jurisdiction. e Extraction and validation of data from the NSW Justicelink database is still in development. Data provided for 2009-10 include actual and estimated data.
Source: State and Territory court administration authorities and departments and the Federal Court of Australia (unpublished); tables 7A.23–24.
Tasmania, the ACT and the NT have a broader range of matters that are heard in their supreme courts as none of these jurisdictions have district/county courts. The difference in scope of supreme court work (box 7.1) should be considered when making comparisons between states and territories.

COURT ADMINISTRATION
7.43
Net expenditure per finalisation for district/county courts
In 2009-10, total net expenditure per finalisation in the criminal jurisdiction of district/county courts was about three times that in the civil jurisdiction (figure 7.5). This trend was similar across all states and territories, and is consistent over time (tables 7A.23–24).
Tasmania, the ACT, the NT and the Australian Government do not operate district/county courts.
Figure 7.5 Net recurrent expenditure per finalisation, district/county courts, 2009-10a, b, c
0
4 000
8 000
12 000
16 000
20 000
NSW Vic Qld WA SA Total
$/fin
alis
atio
n
Criminal Civil
a Excludes payroll tax. b In Queensland, some children’s courts criminal matters are heard in the District Court but in this Report are included with children’s courts data. c Extraction and validation of data from the NSW Justicelink database is still in development. Data provided for 2009-10 include actual and estimated data.
Source: State and Territory court administration authorities and departments (unpublished); tables 7A.23-24.

7.44 REPORT ON GOVERNMENT SERVICES 2011
Net expenditure per finalisation for magistrates’ courts (including children’s courts)
Nationally for magistrates’ courts, net expenditure per criminal finalisation was greater than net expenditure per civil finalisation. This was also the case across most states and territories (figure 7.6).
Figure 7.6 Net recurrent expenditure per finalisation, total magistrates’ courts (including magistrates’ and children’s courts), 2009-10a, b, c, d
0
250
500
750
1 000
1 250
1 500
NSW Vic Qld WA SA Tas ACT NT Total
$/fin
alis
atio
n
Criminal Civil
a Excludes payroll tax. b Extraction and validation of data from the NSW Justicelink database is still in development. Data provided for 2009-10 include actual and estimated data. c Victorian Magistrates’ Court civil data include a proportion of expenditure and finalisations from VCAT. d Queensland children’s courts data for civil cases are based on a count of cases, not the number of children involved in each care and protection case.
Source: State and Territory court administration authorities and departments (unpublished); tables 7A.23-24.
Net expenditure per finalisation for children’s courts
Net expenditure per finalisation for children’s courts varies across states and territories, particularly for civil matters, but also for criminal matters (figure 7.7). The majority of matters heard in the civil jurisdiction of children’s courts are care and protection orders. However, some jurisdictions will also hear matters such as applications for intervention orders. In Tasmania, child protection matters are lodged in the criminal registry as urgent.
Nationally, and in most states and territories, net recurrent expenditure per finalisation is higher in the civil jurisdiction.

COURT ADMINISTRATION
7.45
Figure 7.7 Net recurrent expenditure per finalisation, children’s courts, 2009-10a, b, c, d
0
1 000
2 000
3 000
4 000
5 000
NSW Vic Qld WA SA Tas ACT NT Total
$/fin
alis
atio
n
Criminal Civil
a Excludes payroll tax. b Extraction and validation of data from the NSW Justicelink database is still in development. Data provided for 2009-10 include actual and estimated data. c In Victoria, children’s criminal cases that are not heard in the Melbourne Children’s Court are heard in the magistrates’ court in regional areas. The expenditure related to those cases cannot be separately identified, and is included with the expenditure for the magistrates’ court. However, the quantity of those cases is known, and the finalisations are included with children’s court data. d Queensland children’s courts data for civil cases are based on a count of cases, not the number of children involved in the care and protection case.
Source: State and Territory court administration authorities and departments (unpublished); tables 7A.23-24.
Net expenditure per finalisation for magistrates’ courts only
Net expenditure per criminal and civil finalisation for magistrates’ courts only, excluding children’s courts and electronic infringement and enforcement systems for 200910, is presented in figure 7.8. Nationally, and in most states and territories, net recurrent expenditure per finalisation is higher in the criminal jurisdiction.
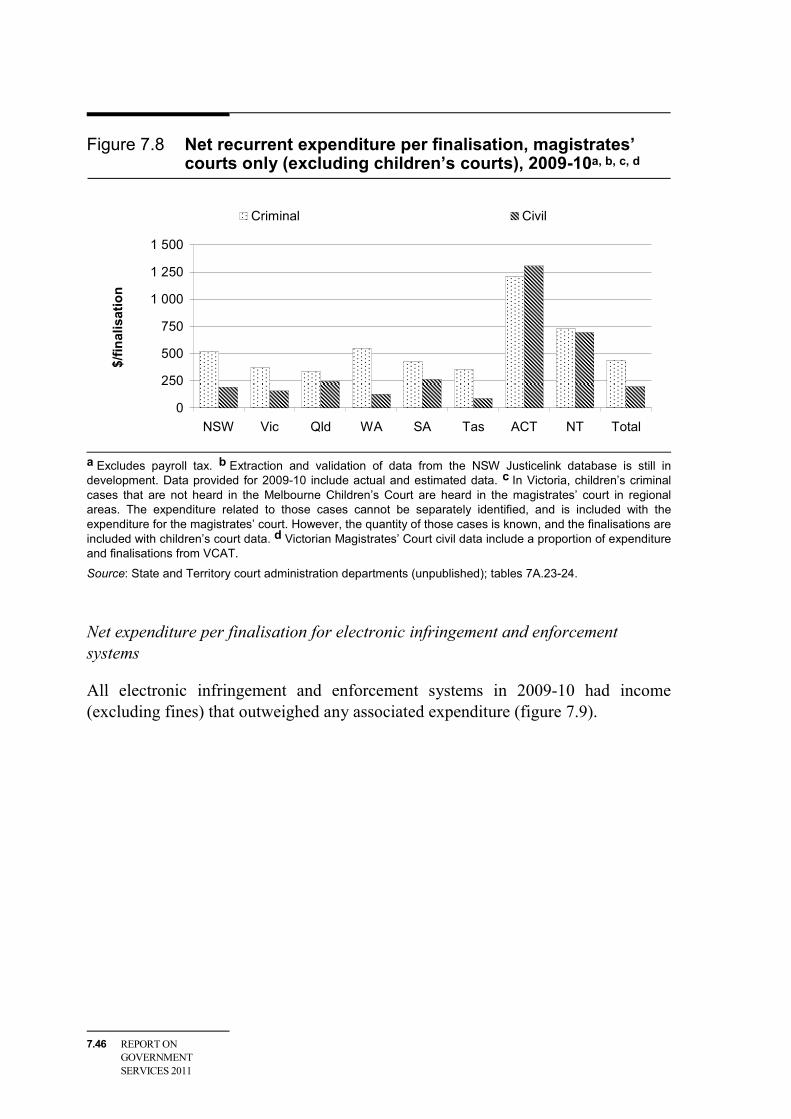
7.46 REPORT ON GOVERNMENT SERVICES 2011
Figure 7.8 Net recurrent expenditure per finalisation, magistrates’ courts only (excluding children’s courts), 2009-10a, b, c, d
0
250
500
750
1 000
1 250
1 500
NSW Vic Qld WA SA Tas ACT NT Total
$/fin
alis
atio
n
Criminal Civil
a Excludes payroll tax. b Extraction and validation of data from the NSW Justicelink database is still in development. Data provided for 2009-10 include actual and estimated data. c In Victoria, children’s criminal cases that are not heard in the Melbourne Children’s Court are heard in the magistrates’ court in regional areas. The expenditure related to those cases cannot be separately identified, and is included with the expenditure for the magistrates’ court. However, the quantity of those cases is known, and the finalisations are included with children’s court data. d Victorian Magistrates’ Court civil data include a proportion of expenditure and finalisations from VCAT.
Source: State and Territory court administration departments (unpublished); tables 7A.23-24.
Net expenditure per finalisation for electronic infringement and enforcement systems
All electronic infringement and enforcement systems in 2009-10 had income (excluding fines) that outweighed any associated expenditure (figure 7.9).

COURT ADMINISTRATION
7.47
Figure 7.9 Net recurrent expenditure per finalisation, electronic infringement and enforcement systems, 2009-10a, b
-90
-75
-60
-45
-30
-15
0
Vic Qld WA SA Total
$/fin
alis
atio
n
a Excludes payroll tax. b Electronic infringement and enforcement systems (infringement and expiated offence processing systems that have the status of a court) operate only in Victoria, Queensland, WA and SA. Other states and territories may operate similar bodies that do not operate under the auspices of a court.
Source: State and Territory court administration authorities and departments (unpublished); table 7A.23.
The analysis of magistrates’ courts efficiency in figures 7.6 and 7.8 excludes electronic infringement and enforcement systems expenditure and finalisations. Box 7.15 shows the impact of including electronic infringement and enforcement systems within the efficiency results of the magistrates’ courts.

7.48 REPORT ON GOVERNMENT SERVICES 2011
Box 7.15 The impact of the electronic infringement and
enforcement systems on the cost per criminal finalisation for magistrates’ courts
All State, Territory and Australian governments operate tribunals and specialist jurisdiction courts, partly to reduce the workload on courts such as magistrates’ courts.
Electronic infringement and enforcement systems — which are infringement and offence processing systems that have the status of a court and deal with matters such as unpaid infringement notices for minor traffic offences — can also reduce the workload on magistrates’ courts.
Electronic infringement and enforcement systems, as defined above, currently operate only in Victoria, Queensland, WA and SA. The figure in this box shows the impact that including electronic infringement and enforcement systems data for these jurisdictions would have on the magistrates’ courts (including children’s courts) efficiency results reported in figure 7.6.
The impact is a reduction in net recurrent expenditure per criminal finalisation for magistrates’ courts in all four jurisdictions (assuming all of the matters processed by the electronic infringement and enforcement systems would otherwise have been dealt with in the magistrates’ courts). The magnitude of the reductions under this assumption is shown in the figure below and table 7A.23. In Victoria the result is net income of $8 per finalisation.
- 100
0
100
200
300
400
500
600
Vic Qld WA SA
$/fin
alis
atio
n
Magistrates courts (excl. electronic courts) Magistrates courts (incl. electronic courts)
Source: State and Territory court administration authorities and departments (unpublished); table 7A.23.
Although NSW, Tasmania, the ACT and the NT do not operate electronic infringement and enforcement systems that fall under the jurisdiction of magistrates’ courts, they have bodies (such as the NSW State Debt Recovery Office, the Monetary Penalties Enforcement Service in Tasmania, the Motor Vehicle Registry in the ACT, and the Fines Recovery Unit in the NT) that process unpaid infringement notices and may have a similar impact in reducing the workload of their magistrates’ courts.

COURT ADMINISTRATION
7.49
Net expenditure per finalisation for family courts and the Federal Magistrates Court of Australia
The Family Court of Australia, Family Court of WA and the Federal Magistrates Court are responsible for determining matters related to family law and child support, but each court has a different focus, breadth and complexity of work, which contribute to the differences in net recurrent expenditure per finalisation results presented in figure 7.10.
Figure 7.10 Net recurrent expenditure per finalisation, family courts and the Federal Magistrates Court of Australia, 2009-10a, b
0
1 000
2 000
3 000
4 000
5 000
6 000
Family Court of WA Family Court of Australia Federal MagistratesCourt of Australia
$/fin
alis
atio
n
a Expenditure per finalisation for the Federal Magistrates Court is based on the total net expenditure and all finalisations for that court; it does not isolate family law work from general federal law work and is therefore not strictly comparable with the results for either the Family Court of Australia or the Family Court of WA. Some bankruptcy and immigration matters filed with the Federal Magistrates Court are delegated to be dealt with by Federal Court registrars. The Federal Magistrates Court fully funds the Federal Court, through cash payments, to undertake this work on its behalf. Those matters finalised by the Federal Court registrars are appropriately counted as part of the Federal Magistrates Court matters as they form part of the Federal Magistrates Court’s filings and expenditure and therefore contribute to the cost per finalisation. b Discounted (estimate) for resources and services (work of court staff and accommodation) provided free of charge to the Federal Magistrates Court in accordance with the Federal Magistrates Act 1999 and appropriations transferred to the Federal Magistrates Court (shown as expenditure in Family Court of Australia annual report) arising as a result of delays in the ‘Federal Courts Restructure’. In addition, the Family Court of Australia provides further shared services, including IT services, accommodation, work of court staff and depreciation and amortisation that cannot be quantified and as such no additional discount could be applied. This will cause an overestimate for the Family Court of Australia data (and an underestimate for the Federal Magistrates Court data).
Source: Australian and state court administration authorities and departments (unpublished); table 7A.24.
The establishment of the Federal Magistrates Court in 2000 has had implications for the finalisations and expenditure reported for the Family Court of Australia, because the Federal Magistrates Court now deals with some of the matters previously managed by the Family Court of Australia. For example, before the establishment of the Federal Magistrates Court, all divorce applications (other than those lodged in

7.50 REPORT ON GOVERNMENT SERVICES 2011
the Family Court of WA) were lodged in the Family Court of Australia; now (aside from those lodged in the Family Court of WA) almost all divorce applications are lodged in the Federal Magistrates Court. In general federal law, the Federal Magistrates Court also deals with the less complex administrative law, bankruptcy law, discrimination, workplace relations and consumer protection law matters that were previously dealt with in the Federal Court of Australia.
Net expenditure per reported death and fire for coroners’ courts
Nationally, expenditure per reported death and fire in coroners’ courts (excluding costs associated with autopsy, forensic science, pathology tests and body conveyancing fees) was approximately $1558 in 2009-10 (figure 7.11).
Figure 7.11 Net recurrent expenditure per finalisation, coroners’ courts, 2009-10a, b, c, d, e
0
500
1 000
1 500
2 000
2 500
3 000
NSW Vic Qld WA SA Tas ACT NT Total
$/fin
alis
atio
n
a Excludes payroll tax. b Extraction and validation of data from the NSW Justicelink database is still in development. Data provided for 2009-10 include actual and estimated data. c Data for NSW, Victoria and the ACT include reported fires. d Expenditure data for the Queensland Coroners’ Court and the Victorian Coroners’ Court include the full costs of government assisted burials/cremations, legal fees incurred in briefing counsel assisting for inquests and costs of preparing matters for inquest, including the costs of obtaining independent expert reports. e Excludes expenditure for autopsy, forensic science, pathology tests and body conveyancing fees.
Source: State and Territory court administration authorities and departments (unpublished); table 7A.24.
As there are differences across jurisdictions in the way that autopsy and chemical analysis costs are managed, their inclusion in recurrent expenditure can lead to large variations in the net expenditure reported per finalisation. To improve consistency, these costs are excluded from net recurrent expenditure for coroners’ courts in this Report. These costs are separately identified in Table 7A.10.

COURT ADMINISTRATION
7.51
Data for NSW, Victoria, Tasmania and the ACT include fires reported to the coroner. Fires are not reported to the coroner in other jurisdictions. Care needs to be taken when making comparisons across the states and territories.
Outcomes
Outcomes are the impact of services on the status of an individual or group (while outputs are the services delivered) (see chapter 1, section 1.5).
No outcome indicators for court administration are currently reported. It is noted, however, that the activities of court administrators lead to broader outcomes within the overall justice system that are not readily addressed in this service-specific chapter. The Steering Committee has identified outcome indicators as an important element of the performance indicator framework to develop for future reports.
7.4 Future directions in performance reporting
Improving data quality
Differences across states and territories in the jurisdiction of courts, and in the allocation of cases between courts, affect the comparability of equity, efficiency and effectiveness data. The different methods undertaken to collect the data can also have an impact on data consistency and quality.
The Review, through the Court Administration Working Group (CAWG), the Courts Practitioner Group (CPG) and the Courts Finance Group (CFG), seeks to continuously improve data quality. Some of the activities and processes by which this is done include:
• assessing and implementing recommendations associated with the ABS Courts Administration Data Collection National Report on lodgments and finalisations
• clearly defining issues pertaining to the scope of the data collection and reporting within the chapter
• assessing the most appropriate way in which to collect and publish data
• amending data definitions
• improving data verification and data quality.
At a broader level, the CAWG is monitoring studies by the Australasian Institute of Judicial Administration (AIJA) of the quality and performance of court systems

7.52 REPORT ON GOVERNMENT SERVICES 2011
worldwide. The AIJA is a research and educational institute funded by the Standing Committee of Attorneys-General and also from subscription income from its membership. An AIJA seminar was held in July 2009, attended by Chief Justices, other members of the judiciary, and court administrators, to discuss the Court Administration chapter and ways in which performance indicators might be improved. In late 2009 a working group, funded by AIJA, was established to investigate how performance indicators might be made more relevant and informative. Outcomes from this group are likely to be known some time in 2011 and the CAWG is maintaining an interest in their progress.
Proposed restructure of federal courts
The Australian Government Attorney-General has announced a proposal to restructure federal courts to more effectively deliver legal and justice services to the community. If a restructure occurs there may be an impact on the future performance reporting for federal courts in this chapter.
Outcomes from review of Report on Government Services
COAG endorsed recommendations of a review of the Report in December 2009. Those recommendations implemented during 2010 are reflected in this Report.
Further recommendations will be reflected in future Reports, including implementation of Independent Reference Group and Steering Committee recommendations arising from the ‘Review of the general performance indicator framework’ and the ‘Review of the performance indicators and their associated measures’. The 2012 Report and later editions will continue:
• lengthening time series data in attachment tables
• developing data quality information documents for performance indicators
• developing mini-case studies.
7.5 Jurisdictions’ comments
This section provides comments from each jurisdiction on the services covered in this chapter.

COURT ADMINISTRATION
7.53
New South Wales Government comments
“
NSW continues to improve performance. The NSW Supreme Court has reduced the percentage of its criminal appeal cases older than 12 months, and the percentage of its civil appeal cases older than 12 months (reaching its lowest level in five years). The District Court reduced its criminal non-appeal backlog for the fifth year in a row and for the third year in a row reduced its criminal appeal backlog. That court now has no civil appeal cases older than 24 months, and has reduced its civil non-appeal backlog to the lowest since ROGS reporting commenced.
The Local Court (Magistrates court) and Children’s Court both performed well, reducing their backlogs of criminal cases older than 6 months, despite a 1 per cent increase in criminal lodgments in the Local Court and a 10 per cent increase in the Children’s Court. NSW courts also continue to improve efficiency with clearance rates increasing in 2009-10 for Supreme Court civil cases, and for District Court criminal cases and civil cases. Each of these jurisdictions have clearance rates above 100 per cent, with the Supreme Court having a civil clearance rate above 100 per cent every year for the past five years.
Justicelink is one of the first integrated, multi-jurisdictional case management systems in the common law world. JusticeLink was rolled out to all NSW criminal court locations in November 2009. The rollout for civil cases in the Supreme, District and Local Courts was completed in June 2010. JusticeLink is also being used by law firms to ‘e-file’ motions and evidence, enabling the parties in litigation to access information more easily. The e-filing system became available in the District and Local Courts in May 2010.
The promotion of alternative dispute resolution has continued in NSW. NSW Community Justice Centres provide free mediation and conflict management services to help people resolve their disputes outside of court. In 2009-10, these centres handled almost 5000 disputes (up from 3000 in 2008-09) and conducted a total of 1725 mediations (up from 1612 in 2008-09). In 2009-10, 81 percent of these mediations ended in agreement (up from 79 per cent in 2008-09).
The Children’s Court is introducing a range of alternative dispute resolution measures enabling more care and protection cases to be resolved outside of court. This will give children and families more involvement in the decision-making process, and will spare many vulnerable children and families the trauma of a court hearing. As part of the increased focus on the role of alternative dispute resolution, all Children’s Registrars will be trained in mediation.
Video conferencing has now been installed at over 200 courts, prisons, juvenile justice centres and Legal Aid offices across the state. In 2009-10 there were over 56 000 court sessions using the technology, saving the taxpayer about $10 million.
NSW is committed to identifying further areas for improvement, and continuing to innovate to meet the changing needs of our clients.
”

7.54 REPORT ON GOVERNMENT SERVICES 2011
Victorian Government comments
“
In the reporting year, the Supreme Court of Victoria introduced a new court data collection system. It differs from the system applied in 2007-2008 and 2008-2009. The figures will become consistent by the 2010-2011 year. In criminal non-appeals and appeals and civil appeals there are discrepancies in the counting that may be clarified in 2010-2011 under the new system. In criminal non-appeals two factors affect the figures:
• the inclusion of long, older trials delayed due to extradition proceedings and related matters; and
• an unusually high number of retrials following appeals and which are counted as ongoing when remitted for retrial. The figures for civil appeals include both criminal and civil appeals from the Magistrates’ Court to a single judge, and are not confined to the Court of Appeal. Further, the counting of criminal appeals in the Court of Appeal commences from the date the proceeding is filed as distinct from when the final notice of appeal is filed.
The County Court maintained a clearance rate in the criminal jurisdiction above 100 per cent for the second year in a row, enabling a reduction in the number of pending cases in each of the last three years. There has been a significant improvement in the case management of sexual offence cases in response to the sexual assault legislative reforms in Victoria, which mandate timelines for the conduct of sexual assault cases involving children and adults with cognitive impairment. Initiations, finalisations and duration of trials all increased in the latest year, demanding an increase in the number of attendances by more than 10,200 over the previous year. The Court continues to address delays in the criminal list with initiatives such as the Circuit Review aimed at addressing the backlog in circuit locations. The number of cases pending for more than 12 months has decreased due to a concerted focus upon those cases.
In the Civil Jurisdiction, initiations have increased by 26 per cent since 2005-06. This increase is mainly in the Commercial List which can be attributed to the removal of the monetary jurisdictional limit as from 1 January 2007. Finalisations have been constant over the last 3 financial years, with approximately 5 500 cases. This has slightly increased our pending figures over the same period.
The growth of workload for the Magistrates' Court of Victoria has most markedly been in the Court’s Family Violence Division. From 2006-06 the cumulative growth in Family Violence matters has been 21 per cent. Compounding factors such as population growth, the impact of previous economic downturns and an increased policing focus have contributed to this workload growth. Other influences include volume increases, case complexity and an increase in activities and time expenditure, all of which may constrain the court’s ability to finalise more cases in the future. The clearance rate of criminal matters remains at very high levels, accompanied by a reduction in pending matters. This has been achieved through a number of new initiatives including listing reforms.
”

COURT ADMINISTRATION
7.55
Queensland Government comments
“
• The Queensland Civil and Administrative Tribunal (QCAT) commenced on 1 December 2009, combining 18 tribunals and 23 jurisdictions. Outside of the South East Queensland region, Magistrates are responsible for hearing QCAT matters such as minor civil disputes, guardianship, anti-discrimination and children services matters. QCAT in its first seven months recorded a 37 per cent growth in applications received by the relevant individual tribunals over the same period in 2008-09.
• On 13 April 2010, the Civil and Criminal Jurisdiction Reform and Modernisation Amendment Bill 2010 (the Bill) was tabled in Parliament. This Bill contained the first stage of legislation in response to the report by the Honourable Martin Moynihan AO QC for a more efficient and effective civil and criminal justice system in Queensland.
• In 2009-10, the Supreme, District and Magistrates Courts recorded a combined average clearance rate of more than 100 per cent. The combined clearance rate for criminal matters was 101.4% while the civil clearance rate was 109.7 per cent.
• The eTrial initiative has continued to provide an online technology solution reducing trial time and costs by establishing a more efficient way to manage documentary evidence electronically. In 2009-10, a number of complex and lengthy eTrials were supported including three criminal trials and two matters before the Appeal division of the Supreme Court. To allow further promotion and uptake of the eTrials solution, a Court Registrar has been appointed to work with parties and the legal profession. An independent assessment from the Queensland University of Technology Law School identified a reduction in the length of trials of up to 20 per cent.
• The State Penalties Enforcement Registry (SPER) implemented the redevelopment of instalment plans which has led to an increase in the volume of payments and a more efficient collection of debts by SPER
• SPER also expanded the use of driver licence suspension as an enforcement option to include non motor vehicle offences. From 1 January 2010 SPER also commenced the trialling of vehicle immobilisation and seizure and sale, targeting recalcitrant debtors who owe more than $5000 in unpaid fines.
• The 17th Murri Court was commissioned and the Mornington Island Restorative Justice (MIRJ) Project continued working with the remote Indigenous community of Mornington Island to develop and implement a peacemaking service that respects and is consistent with Indigenous culture while conforming to the requirements of the Queensland justice system.
”

7.56 REPORT ON GOVERNMENT SERVICES 2011
Western Australian Government comments
“
In 2009-2010, Western Australian courts focused on enhanced access to justice, streamlining court services through the use of technology and online services and continued to improve processes to ensure delays in time to trial and pending caseloads are reduced where possible.
• In the Supreme Court the number of lodgments has increased for civil and appeal divisions. Continuing case management initiatives have maintained the positive clearance index. The increase in the civil backlog has been mainly due to possession of property matters. Criminal pending matters have been significantly reduced, with the lowest result for the past four financial years.
• The District Court continued to benefit from the criminal listing project and maintained its lowest criminal time to trial at about 23 weeks. However, with median delay to a criminal trial in country circuit locations being at approximately forty weeks, a review commenced aimed at reducing this delay and included an assessment of the readiness of cases proceeding to trial and the utilisation of resources and facilities available in the circuit courts. The Court’s civil workload has increased 30 per cent over the past two years.
• The Family Court received additional commonwealth funding to allow the appointment of an acting Magistrate for 2009-10 to assist by primarily hearing trials that would otherwise have been heard by a Judge in order to reduce the increasing delays to trial.
• Magistrates Court experienced a 30 per cent increase in criminal lodgments over the last five years, with significant increases mainly in theft, public order and traffic offences. Despite the increase, the clearance rate has been maintained consistently through improvement of listing practices and increased use of audio visual equipment in all departmental courts.
• In November 2009, the Children’s Court launched its first website to provide information for court users and also access to Children’s Court forms for both the criminal and protection and care jurisdiction. The Court, in collaboration with the Department for Child Protection and Legal Aid, has implemented the “Signs of Safety” mediation process with the means to bring together parents, children and professionals to mediate and devise child safety plans.
• From March 2010 divorce applications could be filed electronically and tracked in the Family Courts case management system. As a result parties and lawyers now do more business online and monitor the progress of their applications.
• The Government has provided funding to expand access to justice services to an increasing population in regional areas. The funding will be used to develop new courthouses in Kalgoorlie, Kununurra and Carnarvon.
”

COURT ADMINISTRATION
7.57
South Australian Government comments
“
• In 2009-10, total criminal non appeal lodgments in the District Court were 2 031 which was a marginal decline (1 per cent) from 2008-09 (2 075).
• Total finalisations for non appeal criminal matters in the District Court increased by 13.4 per cent in 2009-10 (2 051) relative to 2008-09 (1 768). The increase in finalisations is attributed to the allocation of resources for two additional criminal courtrooms which came on line in September 2009, and two additional judges.
• In July 2009, Government increased Court fees by 20 per cent above CPI. This has impacted on revenue collected.
• The Courts Administration Authority continues to pursue the use of Audio Visual (AVL) links in courtrooms, both to provide vulnerable witness facilities and to reduce the number of defendants transported to court from correctional institutions. In 2009-10 Correctional Services made AVL available from Yatala Prison which expanded the potential use of AVL. Courts are now using AVL on average approximately 150 per month.
• Approximately 65 per cent of the State’s courtrooms have been upgraded with digital audio recording units. Work has commenced on optimising the use of this technology by pursuing the introduction of remote and concurrent monitoring of civil proceedings for transcript production purposes.
• In March 2010, the Supreme Court Civil Registry was co-located with the District Court and Environment, Resources and Development Court registries, providing one-stop registry services to court users. The move included upgraded public counter facilities and improved management of telephone and personal enquiry services to reduce waiting times.
• In July 2009, the offence of driving an unregistered and uninsured vehicle was made expiable. This has removed approximately 9,000 matters from the Magistrates and Children’s Courts and is a key reason for the reduction in the number of lodgments. This has also had an effect on the number of attendances per finalisation, as a large number of minor matters have been removed from the list, leaving more complex matters which require more appearances.
• In 2010 the Magistrates Court adopted an electronic diary system for court listings. This system is a vast improvement on the old paper diaries and trial booking process.
• An evaluation of the modified committal process in the Adelaide Magistrates Court concluded that this process had saved trial time. Committal conferencing continues to be offered in the Adelaide Magistrates Court
”

7.58 REPORT ON GOVERNMENT SERVICES 2011
Tasmanian Government comments
“
The financial year 2009-10 has been a year of consolidation for the Tasmanian Courts.
The impact of the changes introduced in February 2008 to the committal process for defendants charged with indictable offences was confirmed in 2009-10. The total time between charge in the Magistrates Court and disposition in the Supreme Court has reduced. The number and amount of time spent on committal hearings (which are now dealt with as preliminary proceedings) in the Magistrates Court has reduced significantly. The once off increase in lodgments in the Supreme Court arising from this change appears to have settled with lodgments decreasing by 15 per cent in 2009-10.
The Magistrates Court completed the implementation of a new Civil Case Management System in 2010. This system has provided the Court with access to a richer set of performance information. One relevant fact is that over 90 per cent of claims lodged with the Magistrates Court are finalised without any involvement of the Court; explaining in part the low cost per finalisation.
The Court and Government are continuing to monitor the size and age of the pending criminal caseload in the Magistrates Court. In March 2010 an additional Magistrate was appointed to serve on Tasmania’s North West Coast to improve the Court’s capacity to deal with matters in a timely manner.
The Youth Justice Division (Children’s Court) is one area of on-going concern for the Magistrates Court and Tasmanian Government. Lodgments have increased by over 35 per cent over the past four years. The Government has announced that there will be a twelve month trial of a dedicated Magistrate for youth justice matters in 2011.
Tasmanian Courts continue to report one of the lowest net recurrent expenditures per finalisation for all courts in Australia.
”

COURT ADMINISTRATION
7.59
Australian Capital Territory Government comments
“
The ACT Courts showed an overall improvement in clearance rates. Indeed in the Supreme, Magistrates and Children’s Courts more cases were finalised than lodged. There was a general decline in the number of civil and criminal lodgments across the Supreme Court and the Magistrates Court in the reporting period with the exception of Court of Appeal matters.
The cost per finalisation in the Supreme Court was less this year while the Magistrates Court finalisation costs slightly increased. As a small jurisdiction, where many of the costs of providing court services are fixed, any change in lodgment numbers has a greater effect on the cost per case than is the case in a larger jurisdiction.
The Supreme Court met the backlog benchmark of 0 per cent lodgments over 24 months for civil appeal matters while criminal cases older than 12 months and 24 months continued to increase. In recognition of the increasing backlog in the Supreme Court, the Chief Justice and the Attorney General established a working group in September 2009 to look at the issues affecting the court’s ability to deal with the volume of cases coming before it. This work resulted in resources being provided to refurbish two Magistrates Court hearing rooms to serve as a third jury trial court and jury deliberation room for the Supreme Court allowing more jury trials to proceed. Provision was also made for additional judicial resources on an interim basis to allow the Supreme Court to tackle the existing backlog of cases.
The ACT is continuing to look at ways to enhance the administration of justice in the Territory. These include:
• A review of case management including listing practices in the Supreme Court to be undertaken in 2010-2011.
• The amendment of the Court Procedures Rules 2006 to extend the powers of the Registrars and Deputy Registrars in relation to making interim protection orders under the Domestic Violence and Protection Orders Act 2008, allowing more efficient use of the Magistrates Court judicial resources.
• The Ngambra Circle Sentencing Court, a culturally sensitive and specialist sentencing process for eligible Aboriginal and Torres Strait Islander defendants, has recently been expanded to include young people. Work is underway to ensure that adequate structures and systems are in place to support the program.
• A Fine Enforcement Unit was established in the Magistrates Court to administer court imposed fines. This follows the passing of legislation in June 2010 to allow the Territory to more effectively recoup court imposed fines by providing a number of new enforcement options as well as the introduction of a number of new steps between defaulting on a fine and discharging that debt by way of imprisonment.
”

7.60 REPORT ON GOVERNMENT SERVICES 2011
Northern Territory Government comments
“
Northern Territory courts continued to have a high workload in the criminal jurisdiction. The workload within the criminal jurisdiction of the Supreme Court increased by 11 per cent from 2008-09 (32 per cent since 2004-05), with the number of jury days increasing by 27 per cent from 2008-09. The Supreme Court’s civil jurisdiction workload has reduced (lodgments decreased by 10 per cent from 2008-09), due to new procedures being adopted designed to promote resolution of disputes informally and prior to commencement of proceedings.
The Supreme Court produced an updated instructional DVD for jurors and designed and developed a new juror database. The Supreme Court also introduced the capacity to video record evidence from the witness box inside the courtroom, thereby reducing the need for vulnerable witnesses to repeat their evidence in the case of a re-trial or mis-trial. Lodgments at the Magistrates Court decreased slightly from 2008-09 (by 3 per cent) but were still 20 per cent higher than in 2004-05. In response to the increases, two additional stipendiary magistrates were appointed, increasing the number of positions to 14 across the Northern Territory, with the number of magistrates at Alice Springs increasing to four.
Numerous infrastructure works were completed at Magistrates Courts throughout the Northern Territory including renovations at the Darwin Magistrates Court to accommodate witnesses and legal aid agencies, construction of additional Judges and Magistrates chambers, holding cells, interview rooms and facilities for vulnerable witnesses at the Alice Springs courthouse. Facilities were also upgraded at Tennant Creek and Nhulunbuy while closed circuit television security was installed at the Katherine courthouse. Work commenced on the installation of enhanced security facilities at both the Darwin and Alice Springs courts.
The Community Court continued to expand under the ‘Closing the Gap Generational Plan of Action’ and by the end of 2009-10 the Court had sat in a total of 11 Northern Territory centres. The Alcohol Court and CREDIT Court programs continued to grow with a 16 per cent increase in referrals from 2008-09.
During the year the Chief Justice announced his retirement while the former Chief Magistrate was appointed to the Supreme Court. New heads of jurisdiction commenced early in 2010-11.
A Court Education and Liaison Officer was appointed while, in partnership with Western Australia and South Australia, the Cross Border Justice Scheme commenced on 1 December 2009. Cross Border Magistrates and Registrars were appointed and sworn in to deal with matters across all three jurisdictions.
For 2010-11 the Northern Territory Government’s proposed alcohol reforms, which are aimed at reducing the number of assaults and domestic violence incidents across the Territory, are likely to have a significant impact on the workloads of the courts.
”

COURT ADMINISTRATION
7.61
7.6 Definitions of key terms and indicators
Active pending population
A lodgment that is yet to be finalised but is part of the active case management of court administrators.
Average expenditure per civil case
The total cost of the administrative services provided to civil matters, divided by the total number of civil files handled. Includes salaries, sheriff expenses, juror costs, accommodation costs, library services, information technology, departmental overheads and court operating expenses.
Attendance indicator The average number of attendances for each finalisation in the reporting period. An attendance is defined as the number of times that parties or their representatives are required to be present in court (including any appointment which is adjourned or rescheduled) for all finalised matters during the year. The actual attendance is one that is heard by a judicial officer or mediator/arbitrator.
Backlog indicator A measure of case processing timeliness. It is the number of pending cases older than the applicable reporting standards, divided by the total pending caseload (multiplied by 100 to convert to a percentage).
Bench warrant A warrant issued by a court for the arrest of a person who has been indicted.
Case The measurement of workload in the civil jurisdiction. It is the issues, grievances or complaints that constitute a single and related series of disputes brought by an entity (or group of entities) against another entity (or group).
Clearance rate An indicator that shows whether the volume of case finalisations has matched the volume of case lodgments during the reporting period. It indicates whether a court’s pending caseload has increased or decreased over that period.
Cost recovery The level of court fees divided by the level of court expenditure.
Court fees collected Total court income from fees charged in the civil jurisdiction. Includes filing, sitting hearing and deposition fees, and excludes transcript fees.
Electronic infringement and enforcement system
A court with the capacity to produce enforceable orders against defendants (such as fines, licence cancellation and incarceration) and to process infringements, on-the-spot fines and summary offences.
Excluded courts and tribunals
This includes such bodies as guardianship boards, environment resources and development courts, and administrative appeals tribunals. The types of excluded courts and tribunals vary among the states and territories.
Extraordinary driver's licence
An extraordinary licence is a licence granted at the discretion of the court. It authorises the holder to drive in certain circumstances even though the holder's normal driver's licence has been suspended.
Finalisation The completion of a matter so it ceases to be an item of work to be dealt with by the court. Finalisations are derived from timeliness data that may not reflect the total matters disposed by the courts in the reporting period.
Forms The counting unit used in the family courts and family law matters pertaining to the Federal Magistrates Court. Forms are applications or notices lodged with the court.
7.62 REPORT ON GOVERNMENT SERVICES 2011
Income Income derived from court fees, library revenue, court reporting revenue, sheriff and bailiff revenue, probate revenue, mediation revenue, rental income and any other sources of revenue (excluding fines).
Information technology expenditure
Non-salary and salary expenditure on information technology. Excludes capital expenditure on information technology infrastructure and includes licensing costs, computer leasing costs, the cost of consumables (such as data lines, paper and disks), training fees, access fees (for example, catalogue search and Internet access) and maintenance charges for software and hardware.
Inquests and inquiries held
Court hearings to determine the cause and circumstances of deaths reported to the coroner. Includes all coronial inquests and inquiries in full court hearings.
Judicial officer Judges, magistrates, masters, coroners, judicial registrars and all other officers who, following argument and giving of evidence, make enforceable orders of the court. The data are provided on the basis of the proportion of time spent on the judicial activity.
Judicial and judicial support salaries
All salary expenditure and payments in the nature of salary that are paid to employees of court administration. Includes base salaries, the employer contributed component of superannuation, workers compensation (full cost, inclusive of any levies, bills and legal fees), higher duty allowances, overtime, actual and accruing terminal and long service leave, fringe benefits tax and untaxed fringe benefits. (Judicial officers include judges, magistrates, masters, judicial registrars and other judicial officers who fulfil a primarily judicial function. Judicial support staff include judicial secretaries, tipstaff and associates.)
Library expenditure Non-salary and salary expenditure on court operated libraries. Non-salary expenditure includes book purchases, journal subscriptions, fees for interlibrary loans, copyright charges, news clippings service fees and photocopying. Expenditure also includes recurrent information technology costs and court administration contributions towards the running costs of non-government operated libraries. Any costs recovered through borrowing and photocopy fees by court operated libraries are subtracted from expenditure.
Lodgment The initiation or commencement of a matter before the court. The date of commencement is counted as the date of registration of a court matter.
Matters Coronial matters: Deaths and fires reported to the coroner in each jurisdiction, including all reported deaths and fires regardless of whether the coroner held an inquest or inquiry. Coronial jurisdictions can extend to the manner of the death of a person who was killed; was found drowned; died a sudden death of which the cause is unknown; died under suspicious or unusual circumstances; died during or following the administration of an operation of a medical, surgical, dental, diagnostic or like nature; died in a prison remand centre or lockup; or died under circumstances that (in the opinion of the Attorney-General) require that the cause of death be more clearly ascertained. Criminal matters: Matters brought to the court by a government prosecuting agency, which is generally the Director of Public Prosecutions but could also be the Attorney-General, the police, local councils or traffic camera branches.

COURT ADMINISTRATION
7.63
Civil matters: Matters brought before the court by individuals or organisations against another party, such as small claims and residential tenancies, as well as matters dealt with by the appeal court jurisdiction. Excluded matters: Extraordinary driver’s licence applications; any application on a pending dispute; applications for bail directions or judgment; secondary processes (for example, applications for default judgments); interlocutory matters; investigation/examination summonses; firearms appeals; escort agents’ licensing appeals; pastoral lands appeals; local government tribunals; police promotions appeals; applications appealing the decisions of workers compensation review officers. Probate matters: Matters such as applications for the appointment of an executor or administrator to the estate of a deceased person.
Method of finalisation The process that leads to the completion of a criminal charge within a higher court so it ceases to be an item of work in that court.
Method of initiation How a criminal charge is introduced to a court level. Non-adjudicated finalisation
A non-adjudicated finalisation is where a charge is considered completed and ceases to be active in a court even though there has not been a determination on whether the defendant is guilty, that is, the charge(s) have not been adjudicated. The methods of non-adjudicated finalisation include but are not limited to defendant deceased; unfit to plead; withdrawn by the prosecution; diplomatic immunity and statute of limitation applies.
Probate registry expenditure
Salary expenditure of the probate registrar and probate clerks, along with non-salary expenditure directly attributable to probate registries.
Real expenditure Actual expenditure adjusted for changes in prices using the Gross Domestic Product (GDP) price deflator and expressed in terms of final year prices (i.e. for the court administration chapter with 2009-10 as the base year). Additional information about the GDP index can be found in the statistical appendix and in table AA.26.
Recurrent expenditure Expenditure that does not result in the creation or acquisition of fixed assets (new or second hand). It consists mainly of expenditure on wages, salaries and supplements, purchases of goods and services, and the consumption of fixed capital (depreciation).
Sheriff and bailiff expenditure
Expenditure on court orderlies, court security, jury management and witness payment administration. For the civil jurisdiction, it includes expenditure (by or on behalf of the court) on bailiffs to enforce court orders. In the coronial jurisdiction, it includes expenditure on police officers permanently attached to the coroner for the purpose of assisting in coronial investigations. Excludes witness payments, fines enforcement (criminal jurisdiction) and prisoner security.
Specialist jurisdiction court
A court which has exclusive jurisdiction in a field of law presided over by a judicial officer with expertise in that area. Examples of these types of courts which are within the scope of this Report are the family courts, the Children’s Courts and the Coroners’ Courts. Examples of specialist jurisdiction courts which are excluded from this Report include Indigenous and circle sentencing courts and drug courts.
Withdrawn The formal withdrawal of charges by the prosecution (that is, by police, the Director of Public Prosecutions or the Attorney-General).

7.64 REPORT ON GOVERNMENT SERVICES 2011
7.7 List of attachment tables
Attachment tables are identified in references throughout this appendix by an ‘A’ suffix (for example, table 7A.3 is table 3 in the attachment). Attachment tables are provided on the Review website (www.pc.gov.au/gsp). Users without access to the website can contact the Secretariat to obtain the attachment tables (see contact details on the inside front cover of the Report). Preamble Court administration — attachment tables
Table 7A.1 Lodgments, criminal
Table 7A.2 Lodgments, civil
Table 7A.3 Lodgments, criminal, per 100 000 people
Table 7A.4 Lodgments, civil, per 100 000 people
Table 7A.5 Finalisations, criminal
Table 7A.6 Finalisations, civil
Table 7A.7 Finalisations, criminal , per 100 000 people
Table 7A.8 Finalisations, civil, per 100 000 people
Table 7A.9 Real recurrent expenditure, criminal, 2009-10 dollars ($'000)
Table 7A.10 Real recurrent expenditure, civil, 2009-10 dollars ($’000)
Table 7A.11 Real income (excluding fines), criminal and civil, 2009-10 dollars ($’000)
Table 7A.12 Real net recurrent expenditure, criminal, 2009-10 dollars ($’000)
Table 7A.13 Real net recurrent expenditure, civil, 2009-10 dollars ($’000)
Table 7A.14 Real net recurrent expenditure, criminal and civil, 2009-10 dollars ($’000)
Table 7A.15 Cost recovery – civil court fees collected as a proportion of civil expenditure excluding payroll tax (per cent)
Table 7A.16 Real average civil court fees collected per lodgment, 2009-10 dollars ($)
Table 7A.17 Backlog indicator, criminal (as at 30 June)
Table 7A.18 Backlog indicator, civil (as at 30 June)
Table 7A.19 Attendance indicator (average number of attendances per finalisation)
Table 7A.20 Judicial officers (FTE and number per 100 000 people)
Table 7A.21 Clearance rate – finalisations/lodgments, criminal (per cent)
Table 7A.22 Clearance rate – finalisations/lodgments, civil (per cent)
Table 7A.23 Real net recurrent expenditure per finalisation, criminal, 2009–10 dollars ($)
Table 7A.24 Real net recurrent expenditure per finalisation, civil, 2009–10 dollars ($)
Table 7A.25 Real net recurrent expenditure per finalisation, criminal and civil, 2009–10 dollars ($)
Table 7A.26 Treatment of assets by court administration agencies

COURT ADMINISTRATION
7.65
7.8 References ABS (Australian Bureau of Statistics) 2010, Criminal Courts, Australia, 2008–09,
Cat. no. 4513.0, Canberra.

7.66 REPORT ON GOVERNMENT SERVICES 2011


![Low profile: 0.28” [7.1 mm]](https://static.fdocuments.us/doc/165x107/61735eb1bb371d2f6a322473/low-profile-028-71-mm.jpg)


