7 September 2007 C Chhallengeerr Technologies Ltd Initiate...
24
Trek 2000 International Ltd – Initiate Coverage www.siasresearch.com SIAS Research Pte Ltd 32 Maxwell Road #01-15 Whitehouse Singapore 069115 Tel: [65] 6227 2107 Fax: [65] 6227 2079 Email: [email protected] 7 September 2007 Challenger Technologies Lt d d Initiate Coverage Good cash business at an attractive price Buy Starting operations in 1984 in a 430 square feet premise, Challenger has excelled to become a leading IT retailer in Singapore. The Group currently has an extensive network of 16 retail outlets, six of which were opened during the first half of FY07. With at least another new outlet expected by the end of the year, Challenger is poised to deliver a strong set of results for the full year ending in December. For the half-year ending on 30 th Jun 07, Challenger demonstrated the pay-off of its aggressive expansion strategy by reporting a year-on-year increase in revenue of 56% to S$65.3 million. Net profit over the same period rose 71% to S$3.8 million. Compared to its listed peers, Challenger’s operating results over the past few years has singled it out as the most efficiently-run IT retailer. Without resorting to large amounts of debt, Challenger has consistently managed to achieve a return on equity far higher than its peers. In addition, it has been able to translate its earnings into cash which it generously pays out to its shareholders. Based on a dividend discount model, we estimate the intrinsic value of each Challenger share to be between 32.5 and 43 cents. At the current price of 25.5 cents, this presents a potential upside of between 27 and 69%. In addition to the potential price appreciation, if Challenger simply maintains its dividend payout at FY06 levels, the dividend yield at current prices would be an attractive 10.2%. We initiate coverage with a “Buy” recommendation. Current S$0.255 Target S$0.325-0.43 MAIN ACTIVITIES Challenger is a leading retailer of IT products in Singapore. The Group offers a diverse range of IT merchandise through its 16 outlets which are located across the island. ISSUE STATISTICS No of shares: 201.8 Market cap: S$51.5m Year Hi/Lo: S$0.285 /S$0.15 Listing Bourse: SGX Mainboard Listing Date: 14 th Jan 2004 (Upgraded from Sesdaq to Mainboard on 30 th Aug 07) SGX Stock code: 573 SHARE PRICE v STI 50 100 150 200 250 Aug-06 Sep-06 Oct-06 Nov-06 Dec-06 Jan-07 Feb-07 Mar-07 Apr-07 May-07 Jun-07 Jul-07 Challenger STI Sesdaq Source: SIAS Research ANALYST Goh Si Xian [email protected] Financial Summary S$m (Y/E Dec) FY05 FY06 FY07F FY08F Turnover 77.5 92.3 148.2 161.9 Net profit 3.8 4.5 7.3 8.1 EPS (Scts) 2.5 3.0 3.7 4.1 EPS Growth (%) 31.4 19.5 23.8 10.8 P/E (x) 10.3 8.6 7.0 6.3 P/BV (x) 2.9 2.8 2.5 2.2 Div yield (%) 12.5 10.2 10.2 10.5 ROE (%) 27.1 33.0 42.4 36.9 Net Gearing (%) Cash Cash Cash Cash Current ratio (x) 2.8 1.8 1.8 1.8 Source: Company, SIAS Research Refer to last page for important disclaimer FUNDAMENTALS Good VALUATION Attractive
-
Upload
hoangkhanh -
Category
Documents
-
view
215 -
download
1
Transcript of 7 September 2007 C Chhallengeerr Technologies Ltd Initiate...

Trek 2000 International Ltd – Initiate Coverage www.siasresearch.com
SIAS Research Pte Ltd 32 Maxwell Road #01-15 Whitehouse Singapore 069115 Tel: [65] 6227 2107 Fax: [65] 6227 2079 Email: [email protected]
7 September 2007 CChhaalllleennggeerr TTeecchhnnoollooggiieess LLttddInitiate Coverage Good cash business at an attractive price
Buy
Starting operations in 1984 in a 430 square feet premise, Challenger has excelled to become a leading IT retailer in Singapore. The Group currently has an extensive network of 16 retail outlets, six of which were opened during the first half of FY07. With at least another new outlet expected by the end of the year, Challenger is poised to deliver a strong set of results for the full year ending in December. For the half-year ending on 30th Jun 07, Challenger demonstrated the pay-off of its aggressive expansion strategy by reporting a year-on-year increase in revenue of 56% to S$65.3 million. Net profit over the same period rose 71% to S$3.8 million. Compared to its listed peers, Challenger’s operating results over the past few years has singled it out as the most efficiently-run IT retailer. Without resorting to large amounts of debt, Challenger has consistently managed to achieve a return on equity far higher than its peers. In addition, it has been able to translate its earnings into cash which it generously pays out to its shareholders. Based on a dividend discount model, we estimate the intrinsic value of each Challenger share to be between 32.5 and 43 cents. At the current price of 25.5 cents, this presents a potential upside of between 27 and 69%. In addition to the potential price appreciation, if Challenger simply maintains its dividend payout at FY06 levels, the dividend yield at current prices would be an attractive 10.2%. We initiate coverage with a “Buy” recommendation.
Current S$0.255 Target S$0.325-0.43 MAIN ACTIVITIES Challenger is a leading retailer of IT products in Singapore. The Group offers a diverse range of IT merchandise through its 16 outlets which are located across the island. ISSUE STATISTICS No of shares: 201.8 Market cap: S$51.5m Year Hi/Lo: S$0.285 /S$0.15 Listing Bourse: SGX Mainboard Listing Date: 14th Jan 2004 (Upgraded from Sesdaq to Mainboard on 30th Aug 07) SGX Stock code: 573 SHARE PRICE v STI
50
100
150
200
250
Aug-0
6
Sep-0
6
Oct
-06
Nov-0
6
Dec-
06
Jan-0
7
Feb-0
7
Mar-
07
Apr-
07
May-0
7
Jun-0
7
Jul-
07
Challenger STI Sesdaq Source: SIAS Research ANALYST Goh Si Xian [email protected]
Financial Summary S$m (Y/E Dec) FY05 FY06 FY07F FY08F Turnover 77.5 92.3 148.2 161.9 Net profit 3.8 4.5 7.3 8.1 EPS (Scts) 2.5 3.0 3.7 4.1 EPS Growth (%) 31.4 19.5 23.8 10.8 P/E (x) 10.3 8.6 7.0 6.3 P/BV (x) 2.9 2.8 2.5 2.2 Div yield (%) 12.5 10.2 10.2 10.5 ROE (%) 27.1 33.0 42.4 36.9 Net Gearing (%) Cash Cash Cash Cash Current ratio (x) 2.8 1.8 1.8 1.8
Source: Company, SIAS Research Refer to last page for important disclaimer
FUNDAMENTALS
Good
VALUATION
Attractive

Challenger Technology Ltd – Initiate Coverage Page 2 of 24
TABLE OF CONTENTS
Company 3 Industry Outlook 8 Investment Merits 10 Risks 15 Financials 17 Valuations 19 Financial Tables & Ratios 20 Appendix I – Key Management & Shareholders 21 Appendix II – Awards ( 2005 to 2007) 23 Disclaimer

Challenger Technology Ltd – Initiate Coverage Page 3 of 24
Challenger has a network of 16 retail outlets with a combined retail space of over 75,000 sq ft Challenger derives almost 100% of its revenue and profits from IT retail
CCOOMMPPAANNYY History and background: Established in 1984 as a retailer of IT products, Challenger Technologies Limited began its operations from a single retail outlet of approximately 430 square feet in floor area. Today, Challenger has grown to become a leading IT retailer in Singapore. The Group has an extensive network of 16 retail outlets across the island, with a combined retail space of approximately 75,000 square feet. Challenger was listed on the SGX-Sesdaq on the 14th of Jan 04, at an Initial Public Offering price of 23 cents a share, or 15.2 times 2002 net profit of S$1.8 million. On the 30th of Aug 07, it was upgraded to the Mainboard. Figure 1: Challenger’s corporate structure
Source: AsiaOne Business segments: Challenger’s core business is primarily in IT retail where it derives close to 100% of its revenue and nearly all its profits. Apart from IT retail, Challenger also provides electronic signage services through its wholly-owned subsidiary, CBD eVision Pte Ltd. Under its IT retail business, Challenger sells a wide range of IT merchandise which includes personal computers, software, printers, scanners, PDAs, MP3 players, digital cameras, LCD TVs and various IT accessories. Challenger’s sells its products through 16 retail outlets which comprise of one Megastore, seven Superstores and eight Speciality Stores. The Megastore and Superstores carry the ‘Challenger’ brand whereas the Specialty Stores are branded under ‘Matrix’ and ‘Pixels’. While the Challenger stores carry a broad assortment of IT products, the six Matrix stores specialise in retailing personal computers and notebooks, and the two Pixels outlets focus on LCD TVs, mobile phones, and PDAs. Altogether, Challenger offers its customers a selection of more than 30 product categories which it sources from over 180 IT vendors.

Challenger Technology Ltd – Initiate Coverage Page 4 of 24
Challenger also provides customer-support services through its PC Clinic
Figure 2: Challenger’s Business Segments Challenger Technologies Ltd IT Retail Electronic Signage
‘Challenger’ Stores
‘Pixels’ Stores
‘Matrix’ Stores
FY06 Revenue breakdown
98.4%
1.6%
IT Retail Electronic Signage
Source: SIAS Research Figure 3: Location of Challenger’s Mega and Super Stores
Source: AsiaOne Apart from the sale of IT products, Challenger also provides customer-support services. For the past seven years, Challenger has been providing after-sales services through its PC Clinic, a one-stop service centre that is opened seven days a week. The services are also available to customers who have not purchased their products from Challenger. In addition to the PC Clinic, Challenger also has a support hotline (6339 9008) to respond to customers’ enquiries. Another unique feature of Challenger is its membership program

Challenger Technology Ltd – Initiate Coverage Page 5 of 24
With a membership base of over 100,000, Challenger enjoys a huge volume of repeat business Challenger’s excellence as an IT retailer is evident through the numerous awards it has won Challenger embarked on an aggressive expansion plan in late 2005 The new lease at Parkway Parade will bring the Group’s total number of retail outlet to 17
which currently has over 100,000 members. The success of its membership program has allowed Challenger to capture a huge volume of repeat business. In FY06, more than 60% of sales were made to members. Among the host of membership privileges and benefits offered by Challenger, members are able to view their purchase history online and are guaranteed lowest prices or a 110% refund on product price difference. Members also get to enjoy an extended five year service warranty on PCs and notebooks. Challenger’s excellence as an IT retailer is evident through the numerous awards it has won over the years. In 2006, it was conferred the ‘HotShop’ award by Capitaland for being the most popular store in Funan DigitaLife Mall. In the same year, Challenger also won the Hardware Retailer of the Year Award, Best Merchandising Award for Xbox and Consumer Software Retailer of the Year Award from Microsoft (S) Pte Ltd. A more comprehensive list of awards won by Challenger can be found in the appendix. Challenger’s electronic signage business designs, installs and maintains electronic sign systems for owners of commercial buildings, corporations, government agencies, and various organizations. It is also involved in project consultation, outdoor advertising, and the rental of electronic signs for exhibitions, shows and seminars. The electronic signage business has traditionally constituted less than two percent of Challenger’s revenue and made losses of S$0.14m and S$0.07m in FY05 and FY06 respectively. Going forward, management believes the Group’s electronic signage business to be highly scalable and would be placing greater emphasis on commercial and residential architectural lighting projects. Expansion strategy: In late 2005, Challenger embarked on an aggressive expansion plan to capture a greater share of the local IT retail market. It began by renovating its flagship outlet at Funan DigtaLife Mall, creating additional space to carry a wider product range and house dedicated areas such as an expanded Apple Gallery and a section for popular lifestyle products. The Group also increased the number of its retail outlets by securing new leases in strategic locations across Singapore. On the 21st of Aug 07, Challenger announced that it has secured a new lease at Parkway Parade which commences in Nov 07. The new 3000 square-feet premise will bring the total number of retail outlets operated by Challenger and its subsidiaries to 17.

Challenger Technology Ltd – Initiate Coverage Page 6 of 24
The proliferation of new retail outlets has led to growth in sales and net profit for the Group
Figure 4: Number of Challenger retail outlets No. of outlets 31 Dec 05 30 Jun 06 31 Dec 06 30 Jun 07 Megastore 0 1 1 1 Superstores 2* 2 4 7 Specialty stores 2 4 5 8 Total 4 7 10 16
*The flagship superstore was converted into a megastore while the second superstore located at DBS Tampines Centre was later closed due to the redevelopment of the building. Source: Company
Figure 5: Retail floor area (As of 30th June 07) Outlet Approximate floor area (sq ft) Megastore 40,000 Superstores 29,060 Specialty stores 6,167 Total 75,227
Source: Company Figure 6: Revenue and net profit
67.375.5 77.5
92.3
65.3
3.84.5
3.82.93.2
0.0
20.0
40.0
60.0
80.0
100.0
FY03 FY04 FY05 FY06 1H07
Re
ve
nu
e S
$m
0.0
2.0
4.0
6.0
8.0
10.0
Ne
t p
rofi
t S
$m
Revenue Net profit
Source: Company, SIAS Research
Figure 7: Earnings per share Cents FY03 FY04 FY05 FY06 1H07 EPS 2.61 1.88 2.47 2.95 2.01 YoY growth 72.8% -28.0% 31.4% 19.4% 60.0%
Source: Company Judging from its operating results, Challenger’s expansion strategy appears to be paying off. In FY06, Challenger reported a 22% increase in net profit to S$4.5m amid a 19% rise in revenue to S$92.3m. In the first half of FY07, Challenger reported a further year-on-year increase in revenue of 56%, which largely accounted for the 71% increase in net profit. Excluding the S$0.5m foreign exchange gain recognised by Challenger in 1H07, its half year net profit in FY07 would still be higher than the full year profits of FY03 and FY04. As Challenger has funded its expansion plans through the issuance of new shares, earnings per share have grown less than

Challenger Technology Ltd – Initiate Coverage Page 7 of 24
Challenger’s major competitors are Best Denki, Courts and Harvey Norman
proportionately to net profits due to the greater number of shares outstanding. Currently, all of Challenger’s 16 retail outlets are profitable. Its megastore and specialty stores also managed to deliver higher retail revenue in 1H07. As nearly all of Challenger’s superstores are less than a year old, no meaningful same store comparison can be made on a year-on-year basis. Regional expansion: Challenger has expressed the possibility of expanding overseas in future via a franchise model. Through franchising, Challenger would be able to tap on the expertise and cultural-familiarity of the local management. It would also minimise Challenger’s risk in terms of capital exposure. In 2000, prior to IPO, Challenger had made an attempt to independently enter the IT retail market in Brunei, Indonesia and Thailand. The endeavour was unsuccessful and Challenger made a swift exit within a year. As a result of the high operating cost and loss on disposals arising from the regionalization attempt, Challenger ended FY00 with a loss of S$3.7m. Challenger’s attempt at taking its electronic signage business overseas has also not been successful. In FY05 and FY06, CBD eVision divested its holdings in its poorly-performing subsidiaries in Thailand and Malaysia respectively. Following the divestiture, Challenger’s electronic signage business will focus solely on the Singapore market. Although Challenger may make a second attempt at taking its IT retail business overseas, it will only do so if it is able to find suitable franchisees. As there are no prospective candidates at the moment, it is likely that Challenger’s operations in the near future will remain confined to Singapore. Competition: While Challenger has to compete with many sole proprietors all over Singapore, especially those located in Sim Lim Square and Funan DigitaLife Mall, its biggest competition comes from large IT retailers like Best Denki, Courts and Harvey Norman. Among the three, Courts and Pertama Holdings, which operates the Harvey Norman stores in Singapore and Malaysia, are listed on the Singapore Exchange (SGX).

Challenger Technology Ltd – Initiate Coverage Page 8 of 24
Challenger’s revenue has generally grown and decline in greater proportion than that of Singapore’s GDP Given the strong economic outlook, Challenger is likely to continue performing well in the second half of FY07 and beyond
IINNDDUUSSTTRRYY OOUUTTLLOOOOKK As the cost of IT and other electronic products generally constitute a significant portion of ones income, they are luxury items and tend to have high income elasticity. Demand for products with high income elasticity will increase (decrease) more than proportionately with an increase (decrease) in income. Reflecting the high income elasticity of its products, Challenger’s revenue has generally grown and declined in greater proportion than that of Singapore’s GDP. Going forward, the health of Singapore’s economy is therefore likely to have a significant impact on Challenger’s performance. Figure 8: Revenue and GDP growth comparison
Challenger's revenue growth against Singapore's GDP growth
-10.00%
-5.00%
0.00%
5.00%
10.00%
15.00%
20.00%
2001 2002 2003 2004 2005 2006Gro
wth
ra
te
GDP growth Revenue growth
Source: Company, Ministry of Trade and Industry (Singapore), SIAS Research Compared to June 2006, overall retail sales in Singapore rose 14.4% in June 2007. In particular, again reflecting their high income elasticity, sales of telecommunication apparatus and computers, as well as other luxury items like watches, jewellery, furniture, household equipment and recreational goods, rose more substantially, by 21.3% to 48.4%. In the second quarter of 2007, Singapore’s GDP grew by 8.6 percent year-on-year, following a 6.4 percent increase in the previous quarter. On the 10th of Aug 07, the Ministry of Trade and Industry raised the full-year GDP growth estimate from 5.0-7.0 percent to 7.0-8.0 percent. Given the strong economic outlook, retailers like Challenger are expected to continue performing well for the second half of FY07 and beyond.

Challenger Technology Ltd – Initiate Coverage Page 9 of 24
Reflecting the strong demand for IT products in Singapore, the IT Show 2007 and PC Show 2007 both generated record sales
Figure 9: Retail price index Activity % Change at current prices
Jun 07/ Jun 06
Jun 07/ May 07
Total 14.4 9.0 Total (excl Motor Vehicles) 19.4 6.8 Department Stores 13.5 2.3 Supermarkets 15.3 -1.0 Provision & Sundry Shops 11.8 0.4 Food & Beverages 6.9 -2.5 Motor Vehicles 5.5 13.8 Petrol Service Stations 8.3 -2.6 Medical Goods & Toiletries 10.8 3.2 Wearing Apparel & Footwear 15.7 8.9 Furniture & Household Equipment 40.3 22.1 Recreational Goods 28.0 9.8 Watches & Jewellery 48.4 16.5 Telecomm Apparatus & Computers 21.3 23.8 Optical Goods & Books 16.7 3.5 Others 10.9 1.6
Source: Department of Statistics, Singapore From a slightly more micro-perspective, the demand for IT products in Singapore has been experiencing robust growth as evidenced by the turnout at the IT Show 2007. Held over a period of four days in March 2007, the IT show attracted an estimated 718,000 visitors, surpassing the previous year’s record of 630,000 visitors. Over the four-day event, approximately S$40 million worth of IT products were sold, a S$6 million increase from 2006. In similar fashion, the PC Show 2007, held between 31st May and 3rd June 07, generated over S$26.2 million in sales, a new record for the exhibition. The PC Show, which is Singapore’s longest running IT and consumer electronics exhibition, has registered record turnout and sales every year for the past 17 years. This year, it attracted an estimated 907,000 people. According to IT research agency IDC, IT vendors sold 242,000 PCs in the second quarter of 2007, a 19% increase from 203,000 units sold one year ago. IDC predicts that PC sales in Singapore will reach 1.044 million units in 2007, 23% higher than the 847,000 units sold the whole of last year. Given the strong demand for PCs, the demand for software and other IT peripherals is likely to increase as well.

Challenger Technology Ltd – Initiate Coverage Page 10 of 24
Challenger has managed to achieve superior margins through careful management of its cost drivers
Figure 10: Singapore PC market forecast
Source: IDC, The Business Times
IINNVVEESSTTMMEENNTT MMEERRIITTSS Boosted by the positive economic and industry outlook, IT retailers are generally expected to perform well in the near future. For their first quarter ended 30th June 07, Courts, Singapore’s largest furniture, electronics and IT retailer, reported a 73.6% increase in net profit to S$1.3 million. The higher net profit was mainly due to an increase in sales. During periods of strong growth where the proverbial rising tide lifts all boats, it is tempting for market participants to place less emphasis on risk. This is due to ‘recency bias’, a psychological phenomenon which has been documented to lead to poor decision-making. Recency bias is the tendency for humans to place greater and undue importance on more recent data or experience, thereby neglecting past information. However, as succinctly worded by Warren Buffett, billionaire investor and Chairman of Berkshire Hathaway, ‘businesses seldom operate in a tranquil, no-surprise environment’. Investors should therefore also take into consideration how a potential investment would perform during more difficult times. We believe that Challenger’s ability to weather unfavourable business conditions to be one of its key investment merits. Higher margins: Challenger’s superior ability to stay afloat when the business tide turns stems from its superior profit margin. In FY06, Challenger’s net margin was over twice as high as its listed peers. Challenger has been able to command higher margins due to its success in managing its key cost drivers which are its cost of goods, employee salary, and rental. In FY06, these key cost drivers amounted to almost 91% of revenue.

Challenger Technology Ltd – Initiate Coverage Page 11 of 24
Careful management of its product mix is one reason that has allowed Challenger to maintain high gross margins Challenger’s large scale operations also allow it to achieve economies of scale
Figure 11: Revenue breakdown (FY06)
80.3%
4.9%
3.8%
4.3%
6.7%
COGS Staff cost Rental Other costs Net profit
Source: Company, SIAS Research Cost of goods: Even before embarking on its expansion strategy in late 2005, Challenger has consistently managed to achieve a gross margin of between 18% and 20%. While, in the IT retail market, mark-ups for higher-value products typically don't go beyond the low-teens in terms of percentage, those for accessories and software can range from 20% to 50%. As Challenger carries a greater portion of these higher-margin items in its product mix, it is able to generate better margins than its listed peers. Challenger’s volume purchases have also given it a strong bargaining position in relation to its vendors. Following its expansion strategy, the increased purchases would allow Challenger to negotiate for even more favourable pricing terms. The Group has indicated that a portion of the cost-savings arising from economies of scale will be transferred to its customers, further enhancing Challenger’s ability to make good its promise of offering the best prices. Salary: In FY06, labour cost was approximately 7% of Challenger’s revenue. The Group manages this cost item by incorporating a high variable component in the compensation of its sales staff. With a low fixed base, the salaries of Challenger’s sales personnel are closely aligned with their performance. Rental: Over the past three years, rental expense for retail space has been rising steadily. From the beginning of 2004 till March 2007, the median rental rate for retail space in the central region has risen by roughly 17%. The median rates in the fringes have gone up approximately 9% over the same period. Most of the leases that Challenger has signed are for a duration of three years. Many of them also come with an option to renew the lease for another three years. By securing these lease agreements, Challenger’s existing stores would be sheltered from further increases

Challenger Technology Ltd – Initiate Coverage Page 12 of 24
in rental rates over the next few years. Challenger’s strategy of locating its megastore at the top floor of Funan DigitaLife Mall has also helped the Group to manage its rental cost. As human traffic in the higher levels is expected to be lower, rental rates for higher levels are generally cheaper. Figure 12: Median rental rates for retail space (S$ per sq m)
Source: Bloomberg
Figure 13: Sales per square foot of retail space Sales per square foot ($) FY04 FY05 FY06 Challenger 1,348 1,435 1,565 Courts 676 712 780
Source: Courts Annual Report 2007, Company, SIAS Research Inventory management: Accounting standards require inventory be carried on the balance sheet at the lower of cost or market value. With the average selling prices of IT products declining relatively quickly, slow-moving items face the risk of being written down or written off completely. At Challenger, inventory that is not sold within six months is 50% written down. If the goods remain unsold after a year, they will be completely written off. Given its potentially negative impact on the bottom-line, how a company manages its
Central
Fringe

Challenger Technology Ltd – Initiate Coverage Page 13 of 24
As a result of its effective inventory management, Challenger’s inventory turnover has consistently been the highest amongst its peers Challenger’s excellence in working capital management has allowed it to become an attractive cash business
inventory would thus be of concern to investors. We see Challenger’s adeptness at managing its inventory to be another of its key investment merit. Figure 14: Inventory turnover comparison* Inventory turnover FY04 FY05 FY06 Challenger 10.2 10.1 10.8 Courts 7.2 7.9 9 Pertama 7.0 6.5 8.0
* Based on respective year-end figure. Challenger’s year-end is in December whereas Courts’ and Pertama’s year-ends are in March and June respectively. Source: Bloomberg, Company, SIAS Research Attesting to the effectiveness of its inventory management, Challenger’s inventory turnover has consistently been the highest amongst its listed peers. One of the control measures that Challenger has in place is the performance indicator of its buyers. The buyers, which are responsible for deciding Challenger’s product mix, are rewarded based on the gross profit that their products generate and are conversely penalised for bringing in slow-moving items. At Challenger, products not sold within 90 days are closely monitored by management. Cash business: Given that most of Challenger’s customers pay for their purchases in cash, as well as Challenger’s policy of limiting credit terms to 12 months, the Group’s business is cash generating and has minimal amounts tied up in receivables. In addition, Challenger’s volume purchases and good track record has also allowed it to negotiate with its vendors for attractive payment terms. Compared to its peers, Challenger is the only company whose trade receivables is less than its trade payables. Figure 15: Trade receivables and trade payables (FY06) S$m Trade receivables Trade payables Challenger 2.5 9.0 Courts 90.1 25.5 Pertama 32.9 21.8
Source: Company, SIAS Research Added with the earlier point on Challenger being adept at inventory management, the Group has a very short cash conversion cycle. This has enabled Challenger to pay vendors promptly, eliciting discounts which further enhance its gross margin. By limiting the extension of credit to customers, Challenger also saves on the payments to credit card firms, which again help inflate margins. These factors, coupled with the fact that its business is not capital intensive, have allowed Challenger to payout generous dividends to its shareholders. In FY05 and FY06, Challenger dividend payout ratio was 130% and 88% respectively.

Challenger Technology Ltd – Initiate Coverage Page 14 of 24
Compared to its peers, Challenger has managed to achieve far higher returns on equity without resorting to debt
Attractive return on equity: While book value, or shareholder equity, captures the amount that shareholders have invested into a business, intrinsic value is an estimate of the amount that shareholders would be able to take out. One of the major determinants of intrinsic value is thus the profit that a company is able to earn on its shareholder’s investment. A confluence of investment merits has allowed Challenger to consistently achieve a high return on equity of approximately 30%. This is much higher than what its listed peers have managed to achieve. On top of that, the management of Challenger has managed to deliver the high returns of equity without resorting to high levels of borrowing. Figure 16: Profitability comparison* Gross margin (%) FY04 FY05 FY06 Challenger 19.2 19.7 20.2 Courts 9.9 12.6 15.1 Pertama 9.5 9.7 8.8 Profit margin (%) FY04 FY05 FY06 Challenger 3.7 4.8 4.9 Courts -0.9 1.5 2.3 Pertama 2.1 2.5 2.4 ROE (%) FY04 FY05 FY06 Challenger 27.8 27.1 33.0 Courts -1.1 2.3 4.8 Pertama 10.4 11.5 10.2 Debt/Equity (%) FY04 FY05 FY06 Challenger 6.6 0 0 Courts 19.9 61.5 89.8 Pertama 0 0 0
* Based on respective year-end figure. Challenger’s year-end is in December whereas Courts’ and Pertama’s year-ends are in March and June respectively. Source: Bloomberg, SIAS Research

Challenger Technology Ltd – Initiate Coverage Page 15 of 24
Challenger’s operations are confined to Singapore The housing crisis in the US might temporarily slow down the growth of economies worldwide
RRIISSKKSS Operations confined to Singapore: Currently, all of Challenger’s operations are confined to Singapore. The lack of segregation makes Challenger vulnerable to the economic climate of a single locality. With IT products having high income elasticities, Challenger might face a significant drop in sales during times when the Singapore economy experiences a recession. With a well run company, however, we believe such declines in turnover to be ephemeral. Housing crisis in the US: During the recession in 2001, which came right after the bursting of the dotcom bubble, the US Federal Reserve sparked a housing boom by slashing interest rates. According to America’s National Association of Realtors, the median price of existing houses rose 76.2% between 1997 and 2006. The increase was most pronounced from 2001 to 2004, where the median price grew at an average rate of 8% annually. At the height of the boom in 2005, the median price rose by as much as 12.4%. Figure 17: Inflation adjusted US home prices
Source: Irrational Exuberance, 2nd Edition, Robert Shiller Although geographically thousands of miles away, the housing problems in the US is a significant risk factor because of its potential impact on economic growth worldwide. Over the past 50 years, housing-related expenditures accounted for more than 20% of America’s GDP. Beyond this direct contribution, it has also been observed that real estate prices influence the level of consumer spending. This is due to the “wealth effect”. The wealth effect refers to increased spending that follows from a real or perceived increase in wealth. From 2001 to 2003, home price appreciation helped lift consumer spending in the US to new heights. Given that consumer spending accounts for roughly two-thirds of GDP, the increased spending, engineered by the Federal Reserve,

Challenger Technology Ltd – Initiate Coverage Page 16 of 24
boosted the American economy and pre-empted a more severe recession that might have taken place after the dotcom bubble was pricked. Compared to stocks, housing prices have a greater wealth effect as homeownership is more widespread. Figure 18: GDP 2006 Economy GDP (billions of US dollars) United States 13,201.8 Japan 4,340.1 Germany 2,906.7 China 2,668.1 Singapore 132.2
Source: World Bank While the robust growth of India, China and the rest of Asia is expected to continue over the next couple of decades, conditions in America still have the ability to temporarily slow down the growth of the global economy. This is due to the sheer size of its economy in relation to the rest of the world. In 2006, the GDP of the United States was US$ 13 trillion - three times that of Japan, the world’s second largest economy. Recent data released by The National Association of Realtors revealed that in July 2007, the median price of homes slid 0.6 percent year-on-year to US$ 230,200. This marked the 12th consecutive month that home prices have declined, a record stretch. With the American real estate market in the beginning stages of what may be a severe decline, there might be a negative impact on consumer spending locally, and then globally. The potentially adverse spill-over might dampen the positive industry outlook for retail companies like Challenger. One of the reasons for the inflated home prices in the US was due to indiscriminate lending on the part of financial institutions. This has now led to the subprime malaise as a growing number of Americans find themselves unable to repay their mortgage loans - a large number of which were borrowed against bogus home prices, leaving the owners holding negative equity. The concerns over subprime loans have led to fears of a credit-crunch worldwide, which would increase the cost of borrowing for individuals and businesses. With the consequence being delayed expenditure and investments, a tightening of credit from the subprime fallout could also put a drag on economic growth in various countries.

Challenger Technology Ltd – Initiate Coverage Page 17 of 24
In 1H07, Challenger’s net profit increased 71% to S$3.8m amid a 56% increase in revenue to S$65.3m. The onset of the GST hike in July 07 may have helped boost Challenger’s 1H07 results
FFIINNAANNCCIIAALLSS Profit and loss: In FY06, Challenger’s net profit rose 21.4% to S$4.5m amid a 19.1% increase in sales to S$92.3m. The growth momentum, resulting from an expansion in retail operations, has continued into FY07. For the first half of FY07, sales increased 56% year-on-year to S$65.3m. Net profit increased 71% to S$3.8m, boosted by a foreign exchange gain of S$0.5m. Excluding the effects of foreign exchange in 1H06 and 1H07, net profit would have increased 34% year-on year. Figure 19: Profitability and Margins S$m FY05 FY06 1H06 1H07 Revenue 77.5 92.3 42.0 65.3 Net profit 3.7 4.5 2.2 3.8 Net margin (%) 4.9 4.9 5.3 5.9 ROE (%) 27.1 33.0 16.8 22.2 EPS 2.47 2.95 1.26 2.03* EPS (diluted) 2.47 2.95 1.26 2.01*
* Based on the weighted average number of shares in issue of 188.36m Diluted EPS assumes total ordinary shares in issue of 189.75m Source: Company, SIAS Research
Figure 20: Number of shares outstanding Balance at 1 Jan 07 153,500,000 Shares arising from rights issue at S$0.1 each 46,050,000 Shares arising from warrants exercised* 1,356,182 Balance at 30 June 2007 200,906,182
* As at 30 Jun 07, 29.34m warrants have not been exercised. The warrants, which expire on the 8th of April 2010, carry the right to subscribe for one new ordinary share of the Company at an exercise price of S$0.10. Source: Company As Challenger has been financing its expansion strategy through the issuance of new shares and warrants, investors would have to take their dilutive effects into consideration. Unfortunately, this cannot be ascertained as it would be dependent on when the warrants are exercised. If all the remaining 29.34m warrants are exercised, it would increase the number of shares in issue by nearly 15%, to a total of 230.25m shares. Although Challenger achieved very respectable results in 1H07, apart from the foreign exchange gain, the results may have also been inflated by the onset of the GST (Goods and Services Tax) increase in July 2007. Other than having high income elasticities as mentioned earlier in the report, the relatively high costs of IT and electronic products would also mean that they would tend to have high price elasticities as well. Demand for products with high price elasticity will increase (decrease) more than proportionately with a decrease (increase) in price.

Challenger Technology Ltd – Initiate Coverage Page 18 of 24
Cash and cash equivalents make up half of Challenger’s total assets
In June 2007, Singapore’s retail sales index rose nine percent over May 2007. Total retail sales value in June 2007 was estimated at S$3 billion. One of the key reasons for the good showing was due to the increased spending before the onset of the GST hike. Partially a result of their product’s high price elasticity, retailers of luxury items enjoyed double-digit growths of 13.8% to 23.8% over the same period. Investors may wish to factor in this information when deriving their growth expectations for the second half of the year. Balance sheet: Challenger’s balance sheet is healthy. As at 30th June 07, 50% of its total assets comprised of cash and cash equivalents. The Group is also debt-free. At the end of 1H07, net cash per share was 9.1 cents compared to 7.4 cents at the end of FY06. Figure 21: Balance Sheet S$m FY05 FY06 1H07 Cash and cash equivalents 10.7 11.4 18.2 Total assets 20.6 26.5 36.1 Trade and other receivables 2.3 3.6 3.7 Trade and other payables 5.6 9.3 12.0 Current Ratio (x) 2.8 1.8 2.0 Net debt/Equity Cash Cash Cash Net cash/ share (S cts) 6.9 7.4 9.1 Book value/ share (S cts) 8.8 9.1 10.1
Source: Company, SIAS Research Cashflow: Challenger’s attractiveness as a cash business is reflected in its cashflow statement. The Group has been able to generate positive cashflow from its operations which is more than sufficient to cover the Group’s investing activities. The negative financing cashflow in FY05 and FY06 was largely due to dividends paid. In 1H07, financing cashflow was positive as Challenger raised S$4.6m from issuing shares, net of expenses. At the end of 1H07, Challenger’s cash and cash equivalents stood at S$18.2m. Figure 22: Cashflow S$m FY05 FY06 1H06 1H07 Operating CF 3.9 8.4 2.2 6.2 Investing CF (0.2) (3.6) (0.8) (1.8) Financing CF (5.2) (4.0) (2.5) 2.5
Source: Company, SIAS Research

Challenger Technology Ltd – Initiate Coverage Page 19 of 24
VVAALLUUAATTIIOONNSS Forecasts: Given the success of Challenger’s expansion strategy, we are expecting the growth momentum in sales and earnings to continue into the second half of FY07. For the full year, we are estimating a 60.5% increase in sales to S$148.2m and 62% increase in earnings to S$7.3m. Due to the increase in number of shares outstanding, our projections would translate into a 23.8% rise in earnings per share. Figure 23: Key forecasts S$m FY05 FY06 FY07F FY08F Revenues 77.5 92.3 148.2 161.9 Net profit 3.8 4.5 7.3 8.1 EPS (S cts) 2.5 3.0 3.7 4.1 EPS diluted* (S cts) 2.5 3.0 3.2 3.5
* Assuming all warrants exercised Source: Company, SIAS Research Figure 24: Peer comparison Company Price P/E Yield ROE $ (x) (%) (%) Challenger 0.255 8.6 10.2 33.0 Courts 0.59 n.a. 5.9 -11.9 Pertama 0.49 11.1 3.2 10.7 Average 9.9 6.4 10.6
Based on latest FY results Source: Bloomberg, SIAS Research Recommendation: Built upon several assumptions laid out in Figure 26, we estimate the value of each Challenger share to be between 32.5 and 43 cents. Within this price range, the forward PER of Challenger based on our FY07 EPS estimate of 3.5 cents would lie between 9.3 - 12.3x. Given Challenger’s track record, we do believe that expectations of an average dividend growth of 3% - 5% annually to be reasonable and conservative. Figure 25: Inputs for dividend discount model Dividend for FY07 2.6 cents Growth rate thereafter 3% - 5% Cost of Equity 11%
Source: SIAS Research At the current share price of 25.5 cents, an investment in Challenger presents an attractive upside potential of between 27% and 69%. In addition, a dividend payout of 2.6 cents translates into a dividend yield of 10.2% at current prices. For FY05 and FY06, Challenger paid out 3.2 cents and 2.6 cents in dividends respectively. With capital gain and dividend yield offering a potential total return of 37% - 79% for the year, we initiate coverage on Challenger with a “Buy” recommendation.

Challenger Technology Ltd – Initiate Coverage Page 20 of 24
FFIINNAANNCCIIAALL TTAABBLLEESS AANNDD RRAATTIIOOSS Year End Dec FY05 FY06 FY07F FY08F Profit & Loss (S$m) Turnover 77.5 92.3 148.2 161.9 Pretax 4.6 6.1 9.3 10.2 Earnings 3.8 4.5 7.3 8.1 EPS (weighted average – S cts) 2.5 3.0 3.7 4.1 EPS (fully diluted – S cts) 2.5 3.0 3.2 3.5 Balance Sheet (S$m) Long Term Assets 1.1 4.3 6.8 9.4 Current Assets 19.5 22.2 32.0 33.5 Current Liabilities 6.9 12.0 17.7 19.0 Long Term Liabilities 0.2 0.4 0.4 0.4 Total Equity 13.5 14.0 20.7 23.4 Cash Flow (S$m) Operating Cash Flow 3.9 8.4 7.8 9.0 Investing Cash Flow (0.2) (3.6) (3.6) (3.8) Financing Cash Flow (5.2) (4.0) (0.7) (5.4) Net Cash Increase/(Decrease) (1.5) 0.7 3.6 (0.2) Financial Ratios FY05 FY06 FY07F FY08F Revenue Growth (%) 2.7 19.1 60.5 9.3 Earnings Growth (%) 33.3 19.5 62.0 10.8 EPS Growth (%) 31.4 19.5 23.8 10.8 Net Margin (%) 4.9 4.9 5.0 5.0 Current Ratio (x) 2.8 1.8 1.8 1.8 Book value per share (S cts) 8.8 9.1 10.3 11.7 Net Cash/(Debt) per sh (S cts) 6.9 7.4 7.4 7.4 Net Debt / Equity (%) Cash Cash Cash Cash Dividend payout ratio (%) 129.5 88.1 71.1 66.1 Return on Equity (%) 27.1 33.0 42.4 36.9 Return on Asset (%) 17.5 19.3 22.5 19.9 Debtor Days 8.1 9.8 9.8 9.8 Creditor Days 31.3 44.4 43.8 43.8 Inventory Days 37.7 35.4 36.5 36.5 Cash Conversion Cycle 14.5 0.8 2.5 2.5 Valuations FY05 FY06 FY07F FY08F Price to sales (x) 0.5 0.4 0.3 0.3 PER (x) 10.3 8.6 7.0 6.3 Price to book (x) 2.9 2.8 2.5 2.2 Dividend Yield (%) 12.5 10.2 10.2 10.5
Source: Company, SIAS Research

Challenger Technology Ltd – Initiate Coverage Page 21 of 24
AAppppeennddiixx II –– KKeeyy MMaannaaggeemmeenntt && SShhaarreehhoollddeerrss Key Management Chief Executive Mr. Loo Leong Thye Chief Financial Officer Mr. Tan Wee Ko General Manager – CBD eVision Pte Ltd Mr. Chia Kang Whye Senior Merchandising Director Mr. Ng Kian Teck Assistant Merchandising Director Ms. Lim Kim Huay Executive Director – Matrix Integration Pte Ltd Mr. Neo Boon Guan Gavin Administration Director Ms. Chua Leh Suan
Source: Company Major Shareholders Direct Interest at 30 Aug 07 No. of shares % Loo Leong Thye 84,728,900 41.98 Ong Sock Hwee 18,224,700 9.03 Ng Leong Hai 48,179,000 23.87 Total 151,132,600 74.88
Source: Company Mr. Loo Leong Thye Chief Executive Mr. Loo is responsible for the overall management and day-to-day operations of the Group. He also charts the corporate directions, strategies, and policies. He has over 25 years of experience in the IT industry. He started the business operations of the Group in 1983 and has been instrumental in growing the operations of the Group to its present stature. In 1986, Mr. Loo started the electronics signage business under CBD eVision and has been involved in the operations of the Company ever since. Mr. Tan Wee Ko Chief Financial Officer Mr. Tan joined the Group in May 2005 and is overall in-charge of matters relating to human resource, business-development, accounting, financial and funding requirements of the Group, ad hoc investment evaluation, as well as compliance and reporting requirements of the Singapore Stock Exchange. He is a certified public accountant with the Institute of Certified Public Accountants of Singapore and CPA Australia. Mr. Chia Kang Whye General Manager – CBD eVision Pte Ltd He is responsible for the day-to-day management of the electronic signage business, which includes the marketing of electronic signage products and overseeing turnkey projects for the supply and installation of electronic signage. He joined CBD eVision in 1986 and has over 20 years of experience in the electronic signage business. Mr. Ng Kian Teck Senior Merchandising Director He is the senior director of merchandising and inventory control of the Singapore group of companies. He is also in charge of the marketing department of the Singapore group of companies. He joined the group of 1996 and more than 12 years of experience in the IT industry.

Challenger Technology Ltd – Initiate Coverage Page 22 of 24
Ms. Lim Kim Huay Assistant Merchandising Director She is responsible for the sourcing and merchandising of products across several products categories for the Group’s retail outlets. She joined the Company in 1985 and has over 21 years of experience in the IT industry. She holds a diploma in retail management from the Singapore Retailers Association. Mr. Neo Boon Guan Gavin Executive Director – Matrix Integration Pte Ltd He started our Group’s small format retail business in 2003 and is responsible for the day-to-day operations of 8 Matrix stores at Funan DigitaLife Mall and Sim Lim Square. He joined the Company in 1999 and has more than 8 years of experience in the IT industry. Ms. Chua Leh Suan Administration Director She is responsible for the day-to-day operations of the accounts for the Singapore Group of Companies. She joined the Company in 1984 and has over 22 years of experience in the IT industry.
Challenger Technology Ltd – Initiate Coverage Page 23 of 24
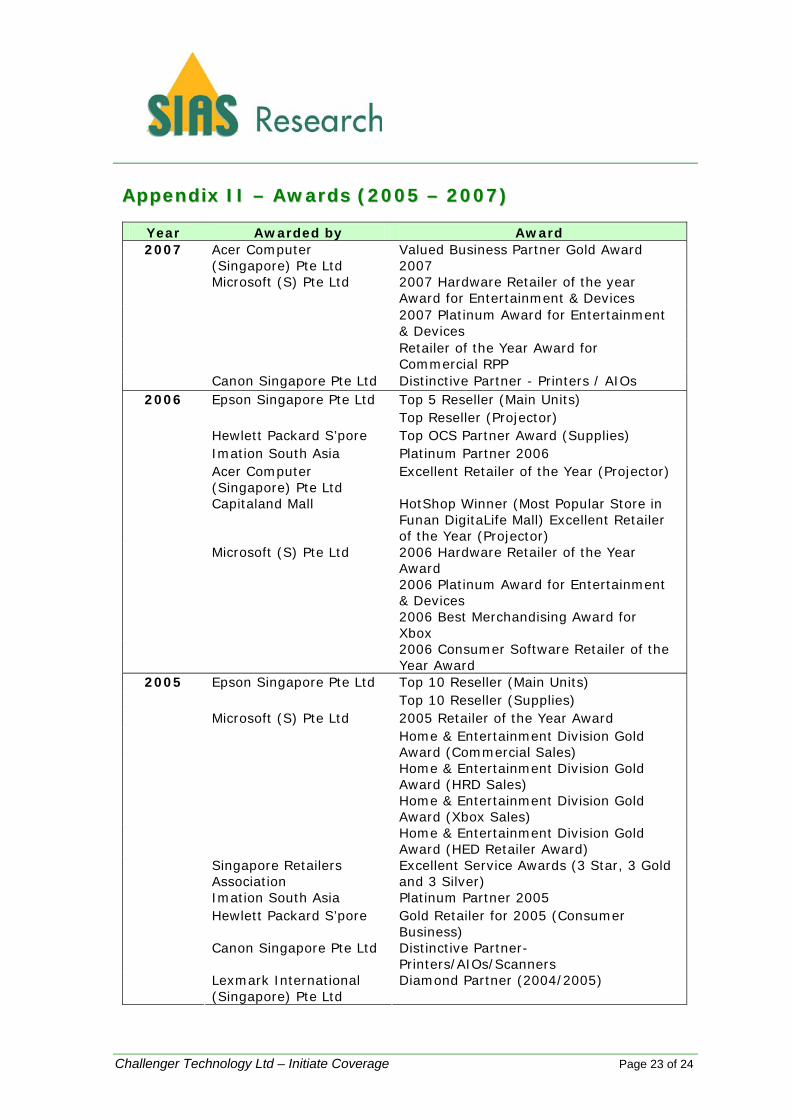
AAppppeennddiixx IIII –– AAwwaarrddss ((22000055 –– 22000077))
Year Awarded by Award Acer Computer (Singapore) Pte Ltd
Valued Business Partner Gold Award 2007 2007 Hardware Retailer of the year Award for Entertainment & Devices 2007 Platinum Award for Entertainment & Devices
Microsoft (S) Pte Ltd
Retailer of the Year Award for Commercial RPP
2007
Canon Singapore Pte Ltd Distinctive Partner - Printers / AIOs Top 5 Reseller (Main Units) Epson Singapore Pte Ltd Top Reseller (Projector)
Hewlett Packard S’pore Top OCS Partner Award (Supplies) Imation South Asia Platinum Partner 2006 Acer Computer (Singapore) Pte Ltd
Excellent Retailer of the Year (Projector)
Capitaland Mall HotShop Winner (Most Popular Store in Funan DigitaLife Mall) Excellent Retailer of the Year (Projector) 2006 Hardware Retailer of the Year Award 2006 Platinum Award for Entertainment & Devices 2006 Best Merchandising Award for Xbox
2006
Microsoft (S) Pte Ltd
2006 Consumer Software Retailer of the Year Award Top 10 Reseller (Main Units) Epson Singapore Pte Ltd Top 10 Reseller (Supplies) 2005 Retailer of the Year Award Home & Entertainment Division Gold Award (Commercial Sales) Home & Entertainment Division Gold Award (HRD Sales) Home & Entertainment Division Gold Award (Xbox Sales)
Microsoft (S) Pte Ltd
Home & Entertainment Division Gold Award (HED Retailer Award)
Singapore Retailers Association
Excellent Service Awards (3 Star, 3 Gold and 3 Silver)
Imation South Asia Platinum Partner 2005 Hewlett Packard S’pore Gold Retailer for 2005 (Consumer
Business) Canon Singapore Pte Ltd Distinctive Partner-
Printers/AIOs/Scanners
2005
Lexmark International (Singapore) Pte Ltd
Diamond Partner (2004/2005)

Challenger Technology Ltd – Initiate Coverage Page 24 of 24
DISCLAIMER
SIAS Research Pte Ltd received compensation for conducting this valuation research. The estimated fair value of the stock is statement of opinion, and not statement of fact or recommendation on the stock. As of the date of the report, the analyst and his immediate family do not hold positions in the securities recommended in this report. This research report is based on information, which we believe to be reliable. Any opinions expressed reflect our judgment at report date and are subject to change without notice. This research material is for information only. It does not have regards to the specific investment objectives, financial situation and the particular needs of any specific person who may receive or access this research material. It is not to be construed as an offer, or solicitation of an offer to sell or buy securities referred herein. The use of this material does not absolve you of your responsibility for your own investment decisions. We accept no liability for any direct or indirect loss arising from the use of this research material. We, our associates, directors and/or employees may have an interest in the securities and/or companies mentioned herein. This research material may not be reproduced, distributed or published for any purpose by anyone without our specific prior consent.