7. CONSERVATION - Plan Clearlakeplanclearlake.weebly.com/uploads/1/3/8/9/13895114/...Clearlake...
56
Clearlake General Plan Background Report Chapter 7- Conservation 125 7. CONSERVATION CONTENTS A. INTRODUCTION ...................................................................................................... 127 B. EXISTING CONDITIONS ........................................................................................... 128 1. SETTING ............................................................................................................................. 128 Location .......................................................................................................................................................128 Topography .................................................................................................................................................128 Climate ........................................................................................................................................................130 2. GEOLOGY AND MINERALS ...................................................................................................... 131 Regulation ...................................................................................................................................................131 Geologic Setting ..........................................................................................................................................132 Minerals.......................................................................................................................................................134 3. SOILS ................................................................................................................................. 135 Soil Information Resources ..........................................................................................................................135 Soil Types .....................................................................................................................................................135 4. WATER RESOURCES .............................................................................................................. 139 Regulatory Framework ................................................................................................................................139 Hydrology and Hydrogeology ......................................................................................................................142 5. WATER QUALITY .................................................................................................................. 148 Sediment and Nutrient Loading...................................................................................................................148 Agriculture ...................................................................................................................................................148 Invasive Species ...........................................................................................................................................150 Recreation ...................................................................................................................................................150 Wastewater .................................................................................................................................................153 Mining Activities ..........................................................................................................................................154 6. WATER SUPPLY AND DEMAND ................................................................................................ 154 Water Purveyors ..........................................................................................................................................156 Additional Information ................................................................................................................................158 Future Demand ............................................................................................................................................158 7. WATER RELATED PLANS, POLICIES, AND PROGRAMS ................................................................... 160 Lake County Groundwater Management Plan ............................................................................................160 Total Maximum Daily Load Monitoring and Implementation Plan .............................................................161 Clear Lake Integrated Watershed Management Plan .................................................................................161 Lake County Clean Water Program .............................................................................................................161 Full Circle Project .........................................................................................................................................162 8. AIR QUALITY ....................................................................................................................... 162 Air Quality Standards ..................................................................................................................................162 Climate Change ...........................................................................................................................................167 9. BIOLOGICAL RESOURCES ........................................................................................................ 169 Regulatory Framework ................................................................................................................................169 Habitats .......................................................................................................................................................170 Vegetation ...................................................................................................................................................171 Ecosystem Threats .......................................................................................................................................172 Endangered Plants and Wildlife ..................................................................................................................174
Transcript of 7. CONSERVATION - Plan Clearlakeplanclearlake.weebly.com/uploads/1/3/8/9/13895114/...Clearlake...

Clearlake General Plan Background Report
Chapter 7- Conservation 125
7. CONSERVATION CONTENTS
A. INTRODUCTION ...................................................................................................... 127
B. EXISTING CONDITIONS ........................................................................................... 128
1. SETTING ............................................................................................................................. 128 Location ....................................................................................................................................................... 128 Topography ................................................................................................................................................. 128 Climate ........................................................................................................................................................ 130
2. GEOLOGY AND MINERALS ...................................................................................................... 131 Regulation ................................................................................................................................................... 131 Geologic Setting .......................................................................................................................................... 132 Minerals ....................................................................................................................................................... 134
3. SOILS ................................................................................................................................. 135 Soil Information Resources .......................................................................................................................... 135 Soil Types ..................................................................................................................................................... 135
4. WATER RESOURCES .............................................................................................................. 139 Regulatory Framework ................................................................................................................................ 139 Hydrology and Hydrogeology ...................................................................................................................... 142
5. WATER QUALITY .................................................................................................................. 148 Sediment and Nutrient Loading ................................................................................................................... 148 Agriculture ................................................................................................................................................... 148 Invasive Species ........................................................................................................................................... 150 Recreation ................................................................................................................................................... 150 Wastewater ................................................................................................................................................. 153 Mining Activities .......................................................................................................................................... 154
6. WATER SUPPLY AND DEMAND ................................................................................................ 154 Water Purveyors .......................................................................................................................................... 156 Additional Information ................................................................................................................................ 158 Future Demand ............................................................................................................................................ 158
7. WATER RELATED PLANS, POLICIES, AND PROGRAMS ................................................................... 160 Lake County Groundwater Management Plan ............................................................................................ 160 Total Maximum Daily Load Monitoring and Implementation Plan ............................................................. 161 Clear Lake Integrated Watershed Management Plan ................................................................................. 161 Lake County Clean Water Program ............................................................................................................. 161 Full Circle Project ......................................................................................................................................... 162
8. AIR QUALITY ....................................................................................................................... 162 Air Quality Standards .................................................................................................................................. 162 Climate Change ........................................................................................................................................... 167
9. BIOLOGICAL RESOURCES ........................................................................................................ 169 Regulatory Framework ................................................................................................................................ 169 Habitats ....................................................................................................................................................... 170 Vegetation ................................................................................................................................................... 171 Ecosystem Threats ....................................................................................................................................... 172 Endangered Plants and Wildlife .................................................................................................................. 174

Clearlake General Plan Background Report
Chapter 7- Conservation 126
C. EMERGING DIRECTIONS .......................................................................................... 175
Geology and Minerals ................................................................................................................................. 175 Soils ............................................................................................................................................................. 175 Water........................................................................................................................................................... 176 Air ................................................................................................................................................................ 176 Biological Resources .................................................................................................................................... 176
D. REFERENCES ........................................................................................................... 177
LIST OF TABLES
TABLE 7.1 SOILS REPRESENTING MORE THAN 1% OF TOTAL LAND ACREAGE IN CLEARLAKE 136
TABLE 7.2 EXISTING AND PROJECTED URBAN WATER DEMAND BY DEMAND SECTOR ......... 159
TABLE 7.3 2040 EXISTING AND PROJECTED SURFACE WATER DEMAND FOR URBAN USE .... 159
TABLE 7.4 PROJECTED 2040 AVERAGE YEAR AGRICULTURAL DEMAND .............................. 160
TABLE 7.5 NATIONAL AMBIENT AIR QUALITY STANDARDS ESTABLISHED BY THE FEDERAL CLEAN AIR ACT .................................................................................................................. 163
TABLE 7.6 STATE AMBIENT AIR QUALITY STANDARDS ........................................................ 164
TABLE 7.7 CITY OF CLEARLAKE FEDERAL AND STATE AIR QUALITY STANDARDS ATTAINMENT STATUS, 2011 .................................................................................................................... 165
TABLE 7.8 2008 LAKE COUNTY AIR BASIN EMISSIONS SUMMARY ....................................... 165
TABLE 7.9 LAKE COUNTY HABITAT CHARACTERISTICS ......................................................... 172
TABLE 7.10 ENDANGERED PLANT SPECIES IN CITY OF CLEARLAKE QUADRANT AREA .......... 174
TABLE 7.11 ENDANGERED WILDLIFE SPECIES IN CITY OF CLEARLAKE QUADRANT AREA ....... 174
LIST OF FIGURES
FIGURE 7.1 LOCATION MAP ............................................................................................... 128
FIGURE 7.2 LAKE COUNTY TOPOGRAPHY MAP ................................................................... 129
FIGURE 7.3 CLEAR LAKE WATERSHED ANNUAL PRECIPITATION, AVERAGE .......................... 130
FIGURE 7.4 CLEAR LAKE WATERSHED GEOLOGY ................................................................. 133
FIGURE 7.5 CITY OF CLEARLAKE SOIL COMPOSITION MAP .................................................. 138
FIGURE 7.6 GROUND WATER BASINS IN THE CLEAR LAKE WATERSHED ............................... 141
FIGURE 7.7 CLEAR LAKE WATERSHED DRAINAGE BASINS .................................................... 142
FIGURE 7.8 CLEAR LAKE WATERSHED AGRICULTURAL LAND USE BY TYPE ........................... 143

Clearlake General Plan Background Report
Chapter 7- Conservation 127
FIGURE 7.9 CLEAR LAKE WATERSHED AND SULPHUR BANK MERCURY MINE ...................... 144
FIGURE 7.10 CLEAR LAKE FLOODPLAIN ............................................................................... 145
FIGURE 7.11 GROUNDWATER BASINS WITHIN THE CLEAR LAKE WATERSHED ..................... 147
FIGURE 7.12 AGRICULTURAL AREAS WITHIN THE CLEAR LAKE WATERSHED ........................ 149
FIGURE 7.13 CLEAR LAKE WATERSHED RECREATION AREAS................................................ 151
FIGURE 7.14 CLEAR LAKE BOAT ACCESS .............................................................................. 152
FIGURE 7.15 CLEAR LAKE WATERSHED INVENTORY UNITS .................................................. 155
FIGURE 7.16 SHORELINE AREA WATER SUPPLIERS .............................................................. 156
FIGURE 7.17 CALIFORNIA AIR BASINS BY ATTAINMENT STATUS FOR VISIBILITY REDUCING PARTICLES, 2011 ................................................................................................................ 166
FIGURE 7.18 CALIFORNIA METROPOLITAN PLANNING ORGANIZATIONS BY REGION ........... 168
FIGURE 7.19 CLEAR LAKE WATERSHED VEGETATION .......................................................... 173
A. INTRODUCTION Population growth and development require the use of natural resources. The conservation element addresses management and conservation of natural resources to benefit both human populations and economic growth, as well as for wildlife habitat and resource protection. The goal of the conservation element is to reconcile the “conflicting demands” between human and natural systems and develop policies which mitigate negative human influence on natural ecosystems while preserving ecosystem functioning into the future. Conservation is a mandatory element of the General Plan and is required by California state law to address water, forests, soil, rivers and lakes, fisheries, wildlife, minerals, and other natural resources as relevant. This chapter discusses the existing conditions of the natural resources located within the City as well as Lake County and the Clear Lake watershed. The chapter addresses:
• Geology and Minerals • Soils • Water Resources • Water Quality • Water Supply and Demand • Air Quality • Biological Resources

Clearlake General Plan Background Report
Chapter 7- Conservation 128
B. EXISTING CONDITIONS The physical setting of Clearlake is an important component that will guide future development and inform the types of policies, programs, and regulations established in the General Plan. This section provides background information on the location, topography, and climate of the City. The section also goes into detail on the existing state of all natural resources within the City and County, including minerals, soils, water, air and biological resources.
1. Setting Location Located within the Clear Lake watershed, the City of Clearlake is within the Central Coast Ranges of Northern California, approximately 80 miles north of San Francisco. At the center of the watershed lies Clear Lake, a 63 square mile lake consisting of three main arms: the Upper Arm (28,00 acres), Lower Arm (8,200 acres), and the Oaks Arm (2,800 acres). See Figure 7.1
Clear Lake Integrated Watershed Management Plan, 2010
Topography The topography of the area is rugged and diverse, as shown in Figure 7.2. Elevations within the watershed range from 700 feet above mean sea level at Cache Creek up to 7,057 feet above mean sea level at Snow Mountain. Bedrock composition is mostly volcanic rock and metamorphosed ocean sediment. Clear Lake is located in between the Russian River system and the Sacramento River system at roughly 1,326 feet above mean sea level.
Clearlake
Figure 7.1 Location Map

Clearlake General Plan Background Report
Chapter 7- Conservation 129
Lake County Groundwater Management Plan, 2006
Figure 7.2 Lake County Topography Map

Clearlake General Plan Background Report
Chapter 7- Conservation 130
Climate Lake County has a Mediterranean climate typical of coastal California regions. Mediterranean climates are characterized by warm and dry summers along with moist winters. Winters are the rainy months, yet temperatures average between 30 and 50 degrees Fahrenheit. Summer highs can exceed 90 degrees Fahrenheit, but summer temperatures can drop to 50 degrees Fahrenheit by nightfall. Located adjacent to Clear Lake, the City temperature rarely falls below freezing. Year round winds blow generally from west and northwest. Precipitation varies annually, with average rainfall of 25 to 30 inches per year for areas along the lake, with higher rates of precipitation and minor amounts of snowfall for higher elevations as shown in Figure 7.3.
Clear Lake Integrated Watershed Management Plan, 2010
Figure 7.3 Clear Lake Watershed Annual Precipitation, Average

Clearlake General Plan Background Report
Chapter 7- Conservation 131
2. Geology and Minerals Geology is the study of the solid Earth, including the rocks of which it is composed and their processes of change. Geologic processes shape the landscape and determine how a space or resource might be utilized. The geologic history and setting of a city determines the type and spatial distribution of resources and identifies potential hazardous areas prone to geologic activity, including volcanic eruption and earthquakes. Geology also requires an analysis of existing minerals within Lake County and the City. The geologic history and development of the area has provided the City and County with rich mineral deposits, which are a valuable economic resource. Understanding the distribution of mineral resources will help locate prime areas for mining efforts, while simultaneously identifying areas for resource conservation. According to the California Office of Planning and Research (OPR) minerals are defined as any naturally occurring chemical element or compound, or groups of elements and compounds, formed from inorganic processes and organic substances (General Plan Guidelines, 2003).
Regulation Geologic and mineral resources are managed at multiple levels in the United States. The following federal and state regulations pertain to the mineral resources within Lake County.
Federal Regulation
The Resource Conservation and Recovery Act, 1976 The Resource Conservation and Recovery Act is a federal law in the United States governing the disposal of solid and hazardous waste.
Surface Mining and Reclamation Act, 1975 The Surface Mining and Reclamation Act is a federal law that regulates the environmental effects of mining in the United States.
United States Environmental Protection Agency Superfund Program Superfund is the federal government’s program to clean up the nation’s uncontrolled hazardous waste sites. The Sulphur Bank Mine was designated as a USEPA Superfund Site in 1990. The USEPA is the lead agency, in charge of developing and implementing a remediation plan for the site. (Clearlake Watershed Sanitary Survey, 2002).
State Regulation
California Department of Toxic Substances Control The California Department of Toxic Substances Control regulates the generation, handling, treatment and disposal of hazardous waste in California.
State Mining and Geology Board The State Mining and Geology Board represents the State’s interest in the development, utilization, and conservation of mineral resources; reclamation of mined lands; development of geologic and seismic hazard information and the provision of a forum for public redress (Ca Dept. of Conservation, 2012)

Clearlake General Plan Background Report
Chapter 7- Conservation 132
State Water Resources Control Board 303(d) list A 303(d) listing leads to development and implementation of a state plan to control the Total Maximum Daily Load (TMDL) of the constituent in question in an impaired water body. Clear Lake is listed as impaired by mercury on the 303(d) list.
Geologic Setting The City of Clearlake sits atop an intricate geologic setting of tectonic activity within the San Andreas Fault system. The Clear Lake volcanic field contains lava dome complexes, cinder cones, and maars of basaltic-to-rhyolitic composition (Smithsonian Institution Website, Global Volcanism Program, 2004). The volcanic field encompasses Mt. Konocti, a composite dacitic lava dome and The Geysers geothermal field, the largest geothermal power producer in the United States (Smithsonian Institution Website, Global Volcanism Program, 2004).
History Mesozoic marine sedimentary rocks of the Franciscan Complex and Great Valley Sequence underlie much of the Clear Lake Watershed, as shown in Figure 7.4. Surrounding the center of Clear Lake are Volcanics, mainly Andesite by Mt. Konocti which began erupting 2 million years ago. Volcanic activity is considered by the United States Geologic Survey (USGS) to still be active, even though the most recent activity dates to more than 10,000 years ago. Low-lying areas around the watershed consist of alluvium, with sandstone dominating the higher elevations and the Clearlake area.
Watershed Formation Clear Lake is located at the center of the Clear Lake watershed in a depression created by the San Andreas Fault system. The geologic structure of the region is dominated by north, northwest-south, and southeast valleys and mountain ranges created by the action of the San Andreas Fault system along the Pacific-North American plate boundary. The fault system created the Clear Lake Basin, which is partially filled in by volcanic activity and sediment erosion.
The Geysers The Geysers geothermal field is located south of Clear Lake along the Sonoma and Lake County border. A large silicic magma chamber lies about 4 miles below the surface, providing heat for the geothermal field. The magma chamber is the source of heat for numerous thermal springs in the area and for the hydrothermal ore deposits, such as the Sulfur Bank Mercury Mine, which is still the site of active mercury deposition (USGS, 2004; CLIWMP 2010). Fifteen geothermal power plants generate about 725 megawatts of electricity – enough to power 725,000 homes, or a city the size of San Francisco. The Geysers are the largest geothermal power producer in the United States, and account for one-fifth of the green power produced in California (www.geysers.com).
Clearlake General Plan Background Report
Chapter 7- Conservation 133
Clear Lake Integrated Watershed Management Plan, 2010
Figure 7.4 Clear Lake Watershed Geology
Clearlake General Plan Background Report
Chapter 7- Conservation 134
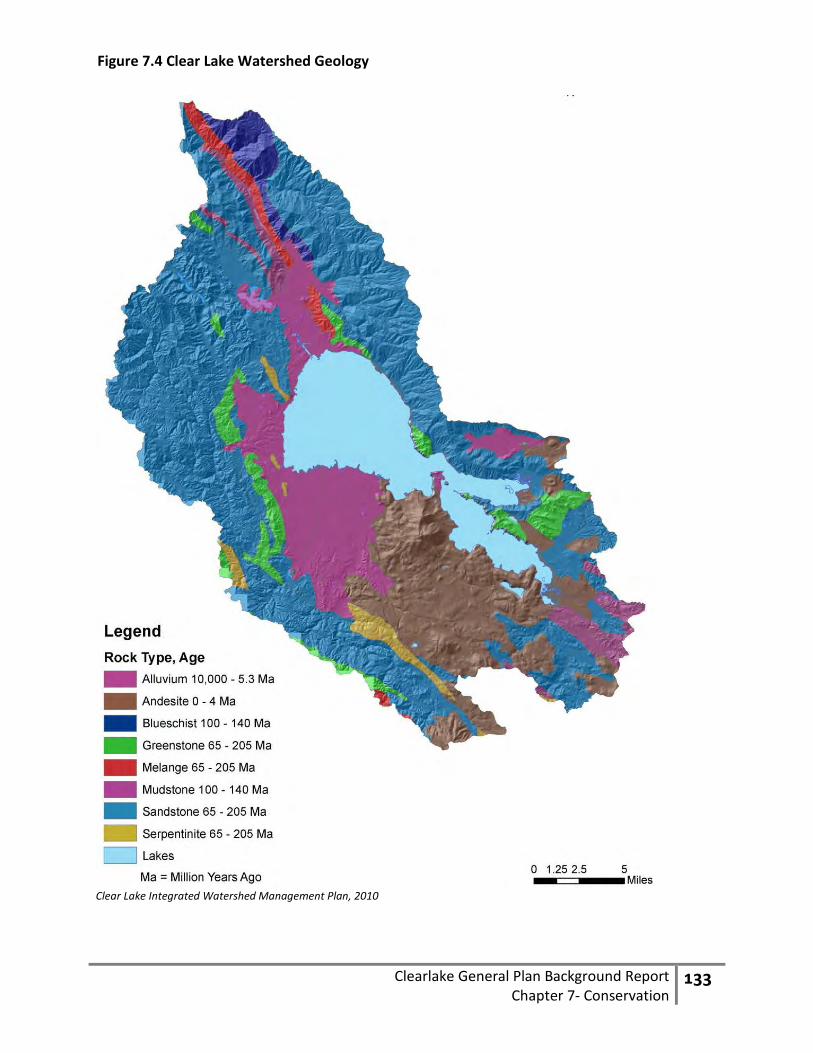
Minerals The following are some of the minerals found in or around Clearlake: Mercury is a common metal that is liquid at room temperature. It occurs either as native metal or in cinnabar, corderoite, livingstonite, and other minerals. High levels of mercury from the Sulfur Bank Mercury Mine have leached into Clear Lake and its tributaries. Mercury is poisonous to humans and wildlife if consumed. It is present in the aquatic life food chain of Clear Lake, necessitating consumption advisories for several Clear Lake fish. (Clearlake Watershed Sanitary Survey, 2002). Borax is a boron compound, a mineral, and a salt of boric acid. Borax Lake in Clearlake was one of the largest mining sites for Borax in the area. Borax mining contributed to high levels of boron in Clear Lake and its tributaries (Clearlake Watershed Sanitary Survey, 2002). Manganese is essential to iron and steel production by virtue of its sulfur-fixing properties. It is also a component of dry cell batteries, plant fertilizers, animal feed, and colorants for brick (USGS, 2012) Sand and Gravel are the only active mines in the Clear Lake watershed. Historic mining for sand and gravel has altered streambeds and has contributed to overall watershed erosion. Naturally Occurring Asbestos (NOA) includes fibrous minerals found in certain types of rock formations. Natural weathering or human disturbance can break NOA down to microscopic fibers, which are easily suspended in air and can present a potential health threat to people in proximity (USEPA, 2012
Sulfur Bank Mercury Mine The Sulfur Bank Mercury Mine located just north of the City of Clearlake is a United States Environmental Protection Agency (USEPA) Superfund Site and is estimated to contribute up to 97% of the current annual mercury loads to Clear Lake (CLIWMP, 2010). Approximately two million cubic yards of mine wastes and tailings remain on the mine site (USEPA, 2012). High levels of mercury and arsenic contaminate nearby soils, waterways and wetlands, Clear Lake, and the aquatic food web dependent on these habitats. (USEPA, 2012) To date, the EPA has completed erosion control measures to stabilize the shoreline waste pile, removed contaminated soil from residential property in the Elem Tribal Colony, constructed surface water controls to divert contaminated water away from Clear Lake, closed three geothermal wells, and removed contaminated waste from affected roadways (USEPA, 2012).
Clearlake General Plan Background Report
Chapter 7- Conservation 135
3. Soils Identification of soils can distinguish parts of the landscape which have different use capacities and therefore different management requirements. It is important to understand the characteristics of different soils in order to avoid potential hazards.
Soil Information Resources Web Soil Survey The Natural Resources Conservation Service (NRCS), part of the United States Department of Agriculture (USDA) operates the Web Soil Survey. This resource provides area specific, scientific soil data produced by the National Cooperative Soil Survey.
Soil Survey of Lake County, California, 1989 This document discusses the major soils found in Lake County, according to a 1981 field study of the area. It is a publication of the National Cooperative Soil Survey, a joint effort between federal, state and local agencies. The Survey highlights the limitations and hazards inherent in soils, improvements needed to overcome the limitations, and the impact of selected land uses on the environment.
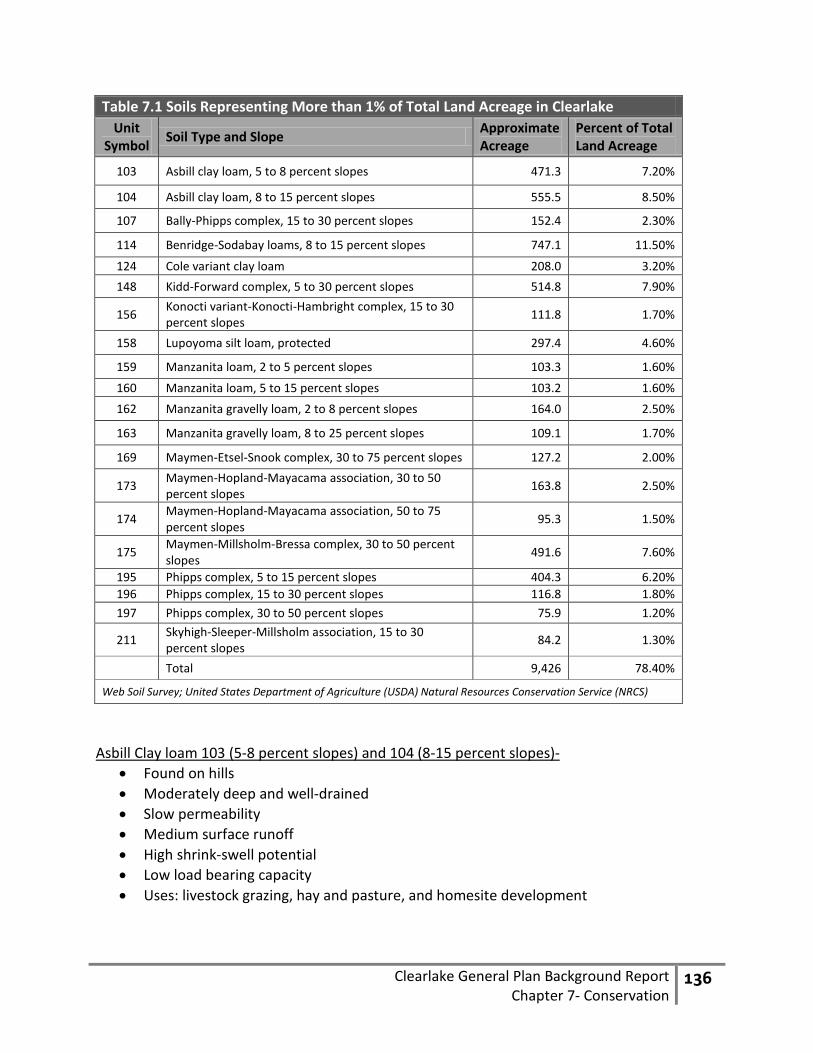
Soil Types Great differences in soil properties can occur within short distances. The City of Clearlake, CA is comprised of hills and valleys that stretch out from the Clear Lake shoreline. The soils on the hills are predominantly shallow or moderately deep, medium textured, and moderately well drained or well drained. The soils in the valleys and on low terraces are deep to very deep, medium textured or fine textured, and poorly drained to well-drained (Soil Conservation Service, 1989). Table 7.1 and Figure 7.5 shows the type and location of soils found in Clearlake along with the approximate acres and percentage of area within the City. Some of the more dominant soil types in the City are described in greater detail as provided by United States Department of Agriculture Soil Conservation Service; 1989 Soil Survey of Lake County, California. Benridge-Sodabay loams (8-15 percent slopes)-
• Found on hills • Deep and well drained • Moderately slow permeability • Medium surface runoff • Moderate erosion hazard • Uses: development, wildlife habitat and watershed
Clearlake General Plan Background Report
Chapter 7- Conservation 136
Table 7.1 Soils Representing More than 1% of Total Land Acreage in Clearlake Unit
Symbol Soil Type and Slope Approximate Acreage
Percent of Total Land Acreage
103 Asbill clay loam, 5 to 8 percent slopes 471.3 7.20%
104 Asbill clay loam, 8 to 15 percent slopes 555.5 8.50%
107 Bally-Phipps complex, 15 to 30 percent slopes 152.4 2.30%
114 Benridge-Sodabay loams, 8 to 15 percent slopes 747.1 11.50%
124 Cole variant clay loam 208.0 3.20% 148 Kidd-Forward complex, 5 to 30 percent slopes 514.8 7.90%
156 Konocti variant-Konocti-Hambright complex, 15 to 30 percent slopes 111.8 1.70%
158 Lupoyoma silt loam, protected 297.4 4.60%
159 Manzanita loam, 2 to 5 percent slopes 103.3 1.60%
160 Manzanita loam, 5 to 15 percent slopes 103.2 1.60% 162 Manzanita gravelly loam, 2 to 8 percent slopes 164.0 2.50%
163 Manzanita gravelly loam, 8 to 25 percent slopes 109.1 1.70%
169 Maymen-Etsel-Snook complex, 30 to 75 percent slopes 127.2 2.00%
173 Maymen-Hopland-Mayacama association, 30 to 50 percent slopes 163.8 2.50%
174 Maymen-Hopland-Mayacama association, 50 to 75 percent slopes 95.3 1.50%
175 Maymen-Millsholm-Bressa complex, 30 to 50 percent slopes 491.6 7.60%
195 Phipps complex, 5 to 15 percent slopes 404.3 6.20% 196 Phipps complex, 15 to 30 percent slopes 116.8 1.80% 197 Phipps complex, 30 to 50 percent slopes 75.9 1.20%
211 Skyhigh-Sleeper-Millsholm association, 15 to 30 percent slopes 84.2 1.30%
Total 9,426 78.40%
Web Soil Survey; United States Department of Agriculture (USDA) Natural Resources Conservation Service (NRCS)
Asbill Clay loam 103 (5-8 percent slopes) and 104 (8-15 percent slopes)- • Found on hills • Moderately deep and well-drained • Slow permeability • Medium surface runoff • High shrink-swell potential • Low load bearing capacity • Uses: livestock grazing, hay and pasture, and homesite development

Clearlake General Plan Background Report
Chapter 7- Conservation 137
Kidd-Forward complex (5-30 percent slopes)- • Found on hills and mountains • Shallow and excessively drained to moderately deep and well drained • Moderately rapid permeability • Medium surface runoff • Moderate to severe erosion hazard • Uses: wildlife habitat, watershed, firewood production, timber production, and
homesite development. Phillips Complex (5-15 percent slopes)-
• Found on uplifted and dissected hills. • Susceptible to slumping and gullying. • Very deep and well drained • Slow permeability • Rapid surface runoff • Moderate erosion hazard • High shrink-swell potential • Uses: livestock grazing, wildlife habitat, watershed, home site development and
firewood production. The results of the soil analysis reveal several limitations for future development within the City. High slope percent, depth to bedrock, tendency to flood, poor soil strength and the shrinking and swelling of soils all are limiting factors for building development, road construction, and soil erosion. Soil type is also important when considering waste disposal and placement of septic tanks. The majority of the soils within the City are unable to adequately absorb and filter septic tank effluent. Excess soil slopes may cause seepage into other soil types. Several soil types are underlain by loose sand and gravel or fractured bedrock, which can lead to groundwater contamination.

Clearlake General Plan Background Report
Chapter 7- Conservation 138
Figu
re 7
.5 C
ity o
f Cle
arla
ke S
oil C
ompo
sitio
n M
ap
Map
Gen
erat
ed U
sing
soil
info
rmat
ion
prov
ided
by
the
Unite
d St
ates
Dep
artm
ent o
f Agr
icul
ture
, Web
Soi
l Sur
vey
Clearlake General Plan Background Report
Chapter 7- Conservation 139
4. Water Resources State guidelines require that the Conservation Element include information about water supply and demand projections. In addition to these measures, Federal and State laws require the City to meet certain standards regarding water, water quality, and water body management. The following subsections discuss the regulatory framework in Lake County, the hydrologic and hydrogeological resources, water quality and threats to water quality.
Regulatory Framework Water is an essential commodity in California and involves a complex system of water rights and allocations. The following terms are used to delineate water rights in the state of California.
Riparian rights are the highest priority water rights and are allocated to individual landowners who own land that borders waterways, including lakes and creeks. Riparian rights water can only be used on the landowner’s property directly adjacent to the waterway or for individual consumption and is legally prohibited from being sold or distributed to others. Riparian rights do not allow for unlimited water use, and must meet ‘reasonable use’ standards in preventing water waste.
Appropriative rights can be secured by landowners with properties that do not directly border waterways and follow a ‘first-come, first-served’ rule. Appropriative water rights must be put to beneficial use, and can expire if the water is not used for a period of five years.
Beneficial uses include hydroelectric power, municipal and industrial, domestic, irrigation, stock watering, fire protection, frost protection, recreation, protection and enhancement of fish, wildlife habitat, and aesthetic enjoyment. State Regulation Conflict over water rights and appropriate use led to The Water Commission Act of 1913, which declares water as the property of the state and established the State Water Resources Control Board (State Water Board) to process water rights permits. The State Water Board is in charge of managing water quality within the state through control of wastewater discharge into surface and groundwater, regulating storm water discharge from agriculture and development and other activities determined to degrade water quality. In addition to the policies and regulations set forth in the State Water Code and California Health and Safety Code, the following laws apply to the management of water within Lake County.
Assembly Bill 3030 Assembly Bill 3030 requires local water agencies to create a Ground Water Management Plan in order to be eligible for grant funding (California Dept. of Water Resources, 2011). Twelve components have been identified and should be included in this plan.
Senate Bill 610 and Senate Bill 221 These bills are companion legislation, which seek to promote more collaborative planning between local water suppliers, cities and counties, and developers (California Dept. of Water Resources, 2003). Both statutes require detailed information regarding water availability to be provided to city and county decision-makers prior to approval of large development projects.

Clearlake General Plan Background Report
Chapter 7- Conservation 140
Local Regulation and Management Water resources in Clearlake, not under jurisdiction of the Yolo District, are regulated by the Lake County Water Resources Department (WRD). Once a component of the Lake County Public Works Department, the Water Resources Department was created in 2010 and reports directly to the Lake County Board of Supervisors. (LAFCO, 2005) The WRD is further divided into two branches: the Lake County Watershed Protection District (Watershed District, previously the Lake County Flood Control and Water Conservation District) and Lakebed Management. The duties of the Watershed District include administering the National Flood Insurance Program, implementing flood control projects, ground water management, and watershed management. Lakebed Management maintains public trust lands in Clear Lake, according to the Shoreline Ordinance (Lake County Code Chapter 23.639). The Lakebed Division also processes permits and leases for lake property below the 7.79 foot Rumsey gauge, maintains swim areas, and monitors lake water quality. Lake Enhancement and water quality are addressed through aquatic plant and algae management under the responsibility of Lakebed Management.
Surface Water As established in The Water Commission Act of 1913, water from Clear Lake is the property of the State of California. This provides the State with the rights to take water from the lake owned by The Yolo County Flood Control and Water Conservation District (Yolo District), which sells water for residential and agricultural users in both Yolo and Lake Counties. Most Lake County purveyors do not have rights to Clear Lake and must enter into contracts with Yolo County to purchase Clear Lake surface water. The Yolo District owns the Clear Lake Dam, located at the outlet to Cache Creek, and uses the dam to regulate water levels in Clear Lake for both flood control and water supply. As stipulated under the 1920 Gopcevic Decree, the Yolo County Flood Control and Water Conservation District is permitted to operate the lake level between the limits of zero and 7.56 feet on the Rumsey Gauge (The Rumsey Gauge was installed in Clear Lake in 1872 to measure the Lake’s water level. The lake is considered full at 7.56 feet Rumsey, 1,325.82 feet above sea level.). This water rights owned by the Yolo District allows them to divert up to 150,000 acre-feet of water annually from Clear Lake with certain exceptions during flood conditions.
Groundwater The State Water Board has no control over groundwater resources, and depending on the basin, individual users are not required to apply for permits before use. Figure 7.6 shows a map of the Clear Lake watershed groundwater basins as well as main sources of water for County areas. WRCB has no jurisdiction over groundwater use. Only adjudicated basins have an established system of rights and groundwater basins only become adjudicated when local landowners settle groundwater disputes in court. Lake County has no adjudicated groundwater basins. The Lake County Water Protection District, however, adopted a Groundwater Management Plan in 2006 that limits groundwater exportation to no more than one acre-foot per year without a permit.

Clearlake General Plan Background Report
Chapter 7- Conservation 141
Lake County Groundwater Management Plan, 2006
Figure 7.6 Ground Water Basins in the Clear Lake Watershed
Clearlake General Plan Background Report
Chapter 7- Conservation 142
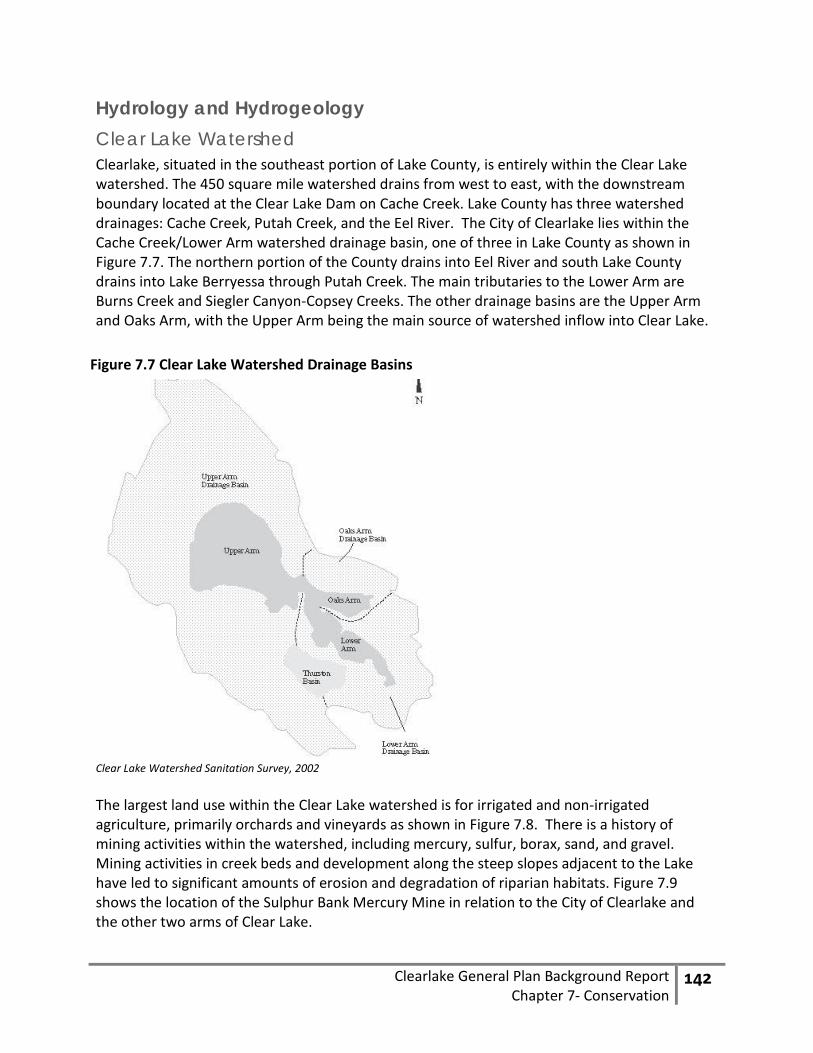
Hydrology and Hydrogeology Clear Lake Watershed Clearlake, situated in the southeast portion of Lake County, is entirely within the Clear Lake watershed. The 450 square mile watershed drains from west to east, with the downstream boundary located at the Clear Lake Dam on Cache Creek. Lake County has three watershed drainages: Cache Creek, Putah Creek, and the Eel River. The City of Clearlake lies within the Cache Creek/Lower Arm watershed drainage basin, one of three in Lake County as shown in Figure 7.7. The northern portion of the County drains into Eel River and south Lake County drains into Lake Berryessa through Putah Creek. The main tributaries to the Lower Arm are Burns Creek and Siegler Canyon-Copsey Creeks. The other drainage basins are the Upper Arm and Oaks Arm, with the Upper Arm being the main source of watershed inflow into Clear Lake.
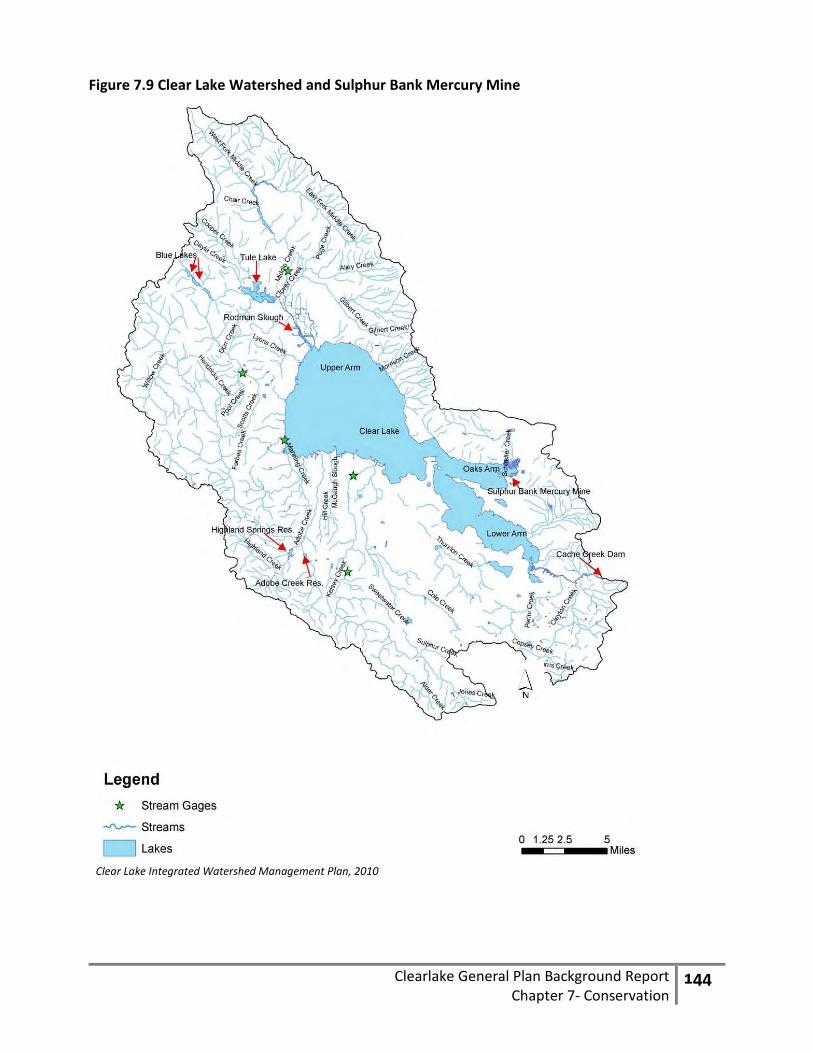
Clear Lake Watershed Sanitation Survey, 2002 The largest land use within the Clear Lake watershed is for irrigated and non-irrigated agriculture, primarily orchards and vineyards as shown in Figure 7.8. There is a history of mining activities within the watershed, including mercury, sulfur, borax, sand, and gravel. Mining activities in creek beds and development along the steep slopes adjacent to the Lake have led to significant amounts of erosion and degradation of riparian habitats. Figure 7.9 shows the location of the Sulphur Bank Mercury Mine in relation to the City of Clearlake and the other two arms of Clear Lake.
Figure 7.7 Clear Lake Watershed Drainage Basins

Clearlake General Plan Background Report
Chapter 7- Conservation 143
Clear Lake Integrated Watershed Management Plan, 2010
Figure 7.8 Clear Lake Watershed Agricultural Land Use by Type
Clearlake General Plan Background Report
Chapter 7- Conservation 144
Clear Lake Integrated Watershed Management Plan, 2010
Figure 7.9 Clear Lake Watershed and Sulphur Bank Mercury Mine

Clearlake General Plan Background Report
Chapter 7- Conservation 145
Clear Lake The largest body of water in Lake County is Clear Lake. Clear Lake is also the largest natural freshwater lake in California, with 110 miles of shoreline, 68 square miles of surface area and an average depth of 26 feet. Wind blows across the lake from the west and northwest, bringing Pacific storms during the rainy season. The active storage capacity of Clear Lake is 314,000-acre-feet with a 150,000 acre-feet used for irrigation and other uses, and the remaining 164,000-acre-feet lost to evaporation. Clear Lake drains southeast to the Sacramento River via Cache Creek. Although the Clear Lake Dam, located at southern edge of Cache Creek, has a high capacity to release Lake overflow, the upper arms of the Lake are incapable of accommodating high volumes of water, and the Lake frequently floods during periods of heavy rainfall. Figure 7.10 shows the flood prone regions within the watershed marked in red. As the Figure shows, portions of the City are prone to flooding.
Clear Lake Integrated Watershed Management Plan, 2010
Figure 7.10 Clear Lake Floodplain
Clearlake General Plan Background Report
Chapter 7- Conservation 146
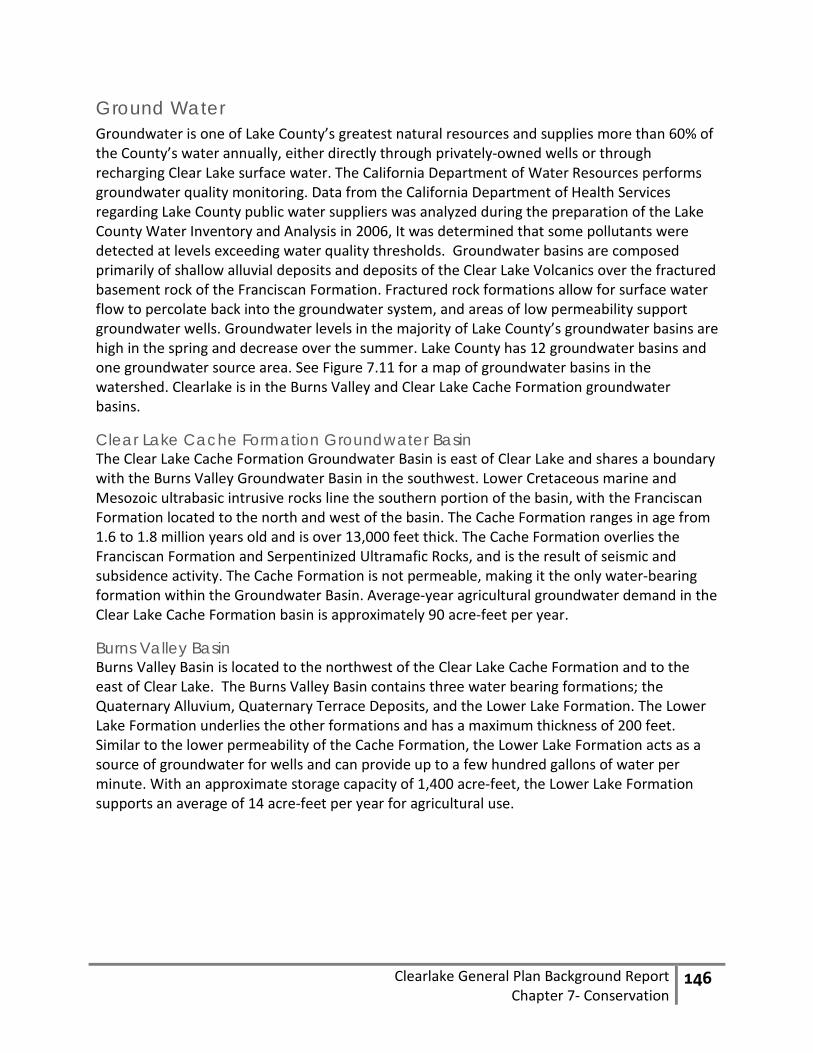
Ground Water Groundwater is one of Lake County’s greatest natural resources and supplies more than 60% of the County’s water annually, either directly through privately-owned wells or through recharging Clear Lake surface water. The California Department of Water Resources performs groundwater quality monitoring. Data from the California Department of Health Services regarding Lake County public water suppliers was analyzed during the preparation of the Lake County Water Inventory and Analysis in 2006, It was determined that some pollutants were detected at levels exceeding water quality thresholds. Groundwater basins are composed primarily of shallow alluvial deposits and deposits of the Clear Lake Volcanics over the fractured basement rock of the Franciscan Formation. Fractured rock formations allow for surface water flow to percolate back into the groundwater system, and areas of low permeability support groundwater wells. Groundwater levels in the majority of Lake County’s groundwater basins are high in the spring and decrease over the summer. Lake County has 12 groundwater basins and one groundwater source area. See Figure 7.11 for a map of groundwater basins in the watershed. Clearlake is in the Burns Valley and Clear Lake Cache Formation groundwater basins.
Clear Lake Cache Formation Groundwater Basin The Clear Lake Cache Formation Groundwater Basin is east of Clear Lake and shares a boundary with the Burns Valley Groundwater Basin in the southwest. Lower Cretaceous marine and Mesozoic ultrabasic intrusive rocks line the southern portion of the basin, with the Franciscan Formation located to the north and west of the basin. The Cache Formation ranges in age from 1.6 to 1.8 million years old and is over 13,000 feet thick. The Cache Formation overlies the Franciscan Formation and Serpentinized Ultramafic Rocks, and is the result of seismic and subsidence activity. The Cache Formation is not permeable, making it the only water-bearing formation within the Groundwater Basin. Average-year agricultural groundwater demand in the Clear Lake Cache Formation basin is approximately 90 acre-feet per year.
Burns Valley Basin Burns Valley Basin is located to the northwest of the Clear Lake Cache Formation and to the east of Clear Lake. The Burns Valley Basin contains three water bearing formations; the Quaternary Alluvium, Quaternary Terrace Deposits, and the Lower Lake Formation. The Lower Lake Formation underlies the other formations and has a maximum thickness of 200 feet. Similar to the lower permeability of the Cache Formation, the Lower Lake Formation acts as a source of groundwater for wells and can provide up to a few hundred gallons of water per minute. With an approximate storage capacity of 1,400 acre-feet, the Lower Lake Formation supports an average of 14 acre-feet per year for agricultural use.
Clearlake General Plan Background Report
Chapter 7- Conservation 147
Lake County Water Inventory and Analysis, 2006
Figure 7.11 Groundwater Basins within the Clear Lake Watershed

Clearlake General Plan Background Report
Chapter 7- Conservation 148
5. Water Quality In a 2002 report to the California Department of Health Services (DHS), Clear Lake water utilities assessed the state of the Clear Lake watershed, including the water quality of Clear Lake, the affect of the watershed on Clear Lake source water quality, and the ability of Clear Lake water utilities to successfully treat source water to meet water regulation standards. Seventeen utilities participated in the assessment of the impact of the following contamination activities on water quality:
• Erosion • Agriculture • Aquatic Species • Lake Recreation • Septic Tank Systems • Municipal Wastewater • Mining and Sulphur Bank Mercury Mine
The following sections discuss the major findings of the 2002 report, as well as additional information regarding water quality of Clear Lake, the Clear Lake watershed, and water for the City of Clearlake.
Sediment and Nutrient Loading Clear Lake is a naturally nutrient-rich (eutrophic) lake with blue-green algal blooms occurring in the spring and summer months. As availability of nutrients varies, so does the intensity of the blooms. Agricultural practices, mining, and wildfires contribute to the increased nutrient levels of the lake, as loss of wetland habitat in the watershed has reduced the capacity for natural sediment filtration. Erosion provides nutrients, specifically phosphorus, to the Lake, which is utilized by the algae during periods of growth. Sediments also contribute to high turbidities (cloudiness of water resulting from presence of particulate matter), which make it difficult to effectively treat and disinfect drinking water. The increased occurrence of blue-green algae (cyanobacteria; not a true algae but an eubacteria) caused from sediment erosion, mainly in the upper portion of the watershed, contributes to the degradation of the lakeshore and surface environment of Clear Lake and the City during the summer and fall. Cyanobacteria, as well as true algae problems, are most serious at the eastern end of the Lake, near the City of Clearlake, where winds push algae into huge mats that rot along the shores and produce strong and unpleasant odors. Cyanobacteria are extremely resistant to environmental change, more so than true algae, making it difficult to eliminate. Clearlake water utilities traditional filtration eliminates the bacteria, as well as GAC filtration and ozonation to eliminate toxins.
Agriculture Over the past ten years, agricultural processes have shifted from the historic walnut and pear production to favor grapes and viticulture. As seen in Figure 7.12, there are no major agricultural production areas in the City of Clearlake, however, agricultural processes within the

Clearlake General Plan Background Report
Chapter 7- Conservation 149
County and the Clear Lake watershed affect the quality of water for Clearlake residents. Agricultural drainage is regulated by the Regional Water Board, and Waste Discharge Requirement (WDR) waivers are issued and reviewed every five years. Based on the results of the 2002 analysis, pesticides are effectively filtered from drinking water and do not pose a significant threat to drinking water quality in Lake County. The report does suggest changes to the WDR permitting process and increased promotion of best management practices to reduce the impact of agricultural grading on sediment erosion into the lake.
Clear Lake Watershed Sanitation Survey, 2002
Figure 7.12 Agricultural Areas within the Clear Lake Watershed
Clearlake
Clearlake General Plan Background Report
Chapter 7- Conservation 150
Invasive Species Clear Lake supports a considerable number of native plants, as well as exotic invasive species such as the Hydrilla, which forms dense mats that choke off fish habitat. Native Clear Lake fish have been largely replaced by introduced warm-water species, including the black bass, catfish, carp, and large-mouth bass.
Aquatic Plants Aquatic plants and animals are located within Clear Lake and found along adjacent shores. Overgrowth of aquatic plants has prompted residents and visitors to use herbicides to control the plant growth, which can influence water quality. State law dictates the regulation of herbicide use even on non-agricultural lands, and requires a permit for residents or shoreline business owners to pursue chemical or mechanical means of aquatic weed abatement. The permitting process is frequently overlooked, and in 2000 the County Board of Supervisors formed the Aquatic Plant Managing Task Force to address illegal activity and to ensure that the activities do not contribute to the spread of the invasive Hydrilla.
Mussels Lake County Vessel Inspection Ordinance No. 2936 regulates the spread of invasive mussel species in Clear Lake. All vessels launched in Lake County, under penalty of fine, must undergo inspection for presence of Dreissenid mussels, including Quagga and Zebra mussels. These mussels reproduce at rapid rates, interfere with native aquatic species and water distribution infrastructure, and are considered a threat to healthy lake ecosystem functioning.
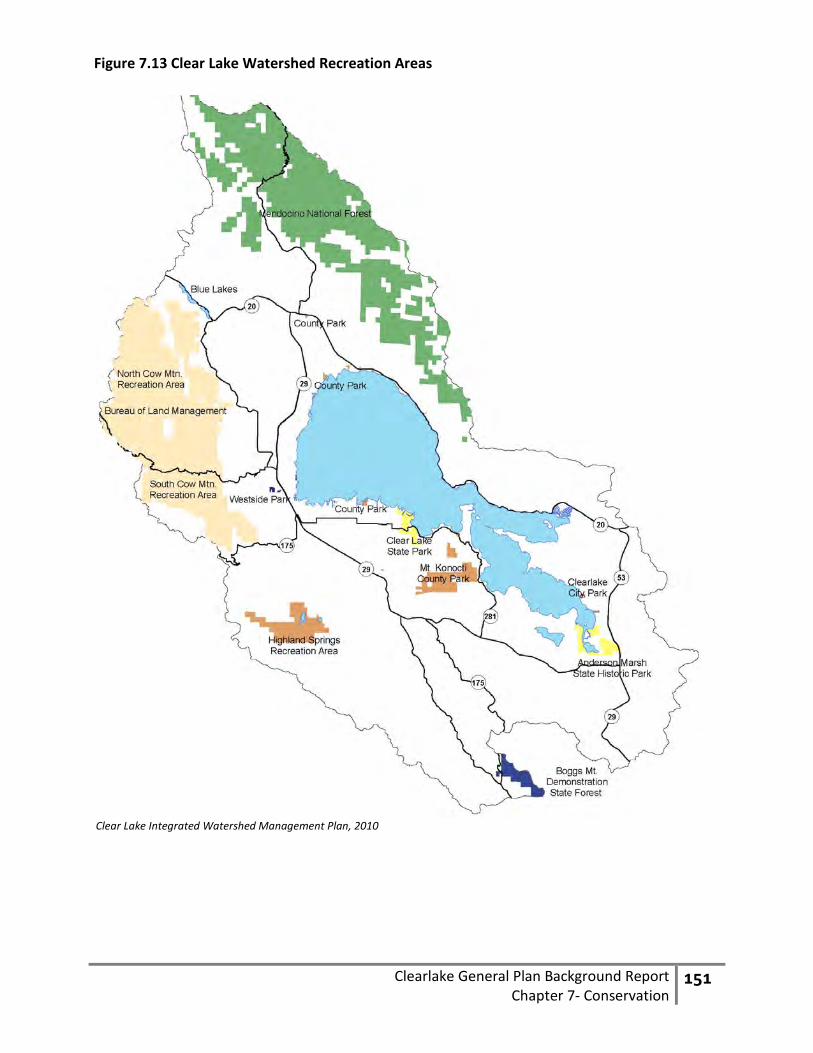
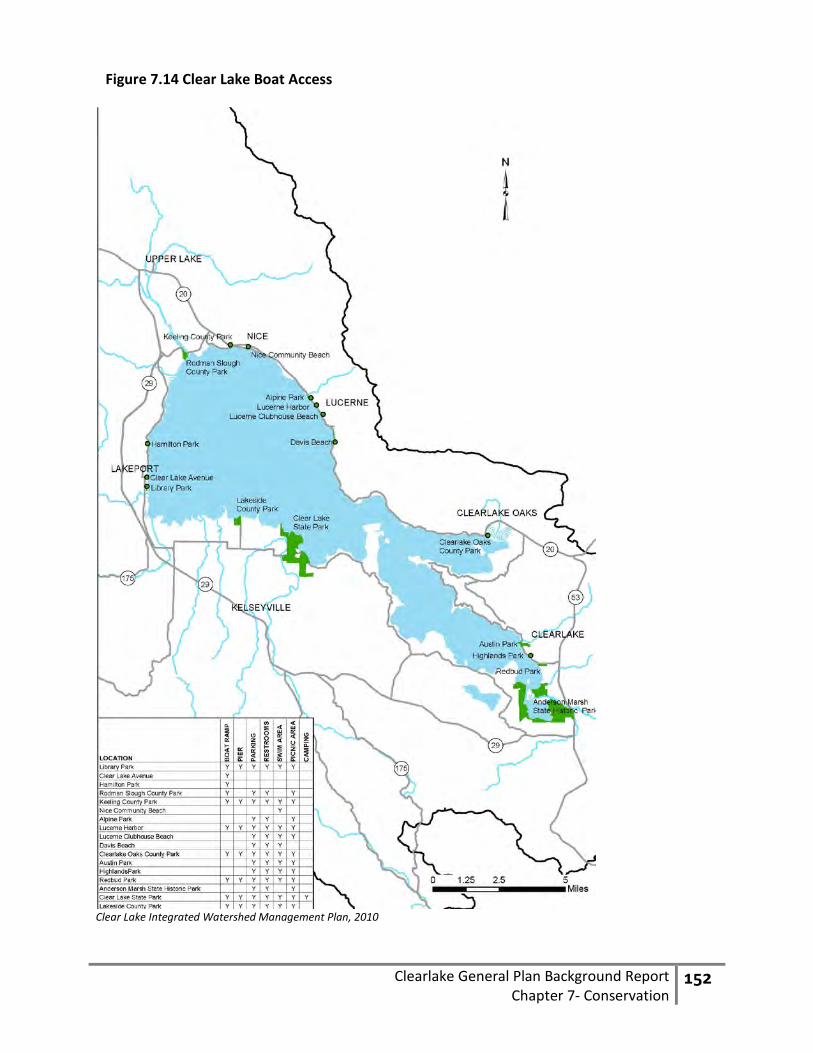
Recreation Clear Lake is a destination for lake and watershed recreational activities and serves as a destination for travelers and a source of revenue for the City of Clearlake and for Lake County. Algal blooms and resulting odors affect the appeal of Clear Lake and the City of Clearlake as travel destinations. Fishing is popular on Clear Lake, yet state health advisories warn of mercury contamination and suggest reducing consumption of Clear Lake fish species. Water recreation and related activities while affected by Clear Lake water quality, also impact quality due to motorized boating, spread of invasive species transported by boat, and improper disposal of visitor trash and waste. Figures 7.13 and Figure 7.14 show the location of major recreation facilities and points of Clear Lake boat access within the watershed. Figure 7.14 shows the three access points in the City of Clearlake, with Redbud Park the location of the only boat ramp access to the Lower Arm of Clear Lake.
Clearlake General Plan Background Report
Chapter 7- Conservation 151
Clear Lake Integrated Watershed Management Plan, 2010
Figure 7.13 Clear Lake Watershed Recreation Areas
Clearlake General Plan Background Report
Chapter 7- Conservation 152
Clear Lake Integrated Watershed Management Plan, 2010
Figure 7.14 Clear Lake Boat Access

Clearlake General Plan Background Report
Chapter 7- Conservation 153
Wastewater Wastewater consists of human sewage, gray water, and water from commercial and industrial facilities. Sewage contains micro-organisms, some of which can contribute to health problems in humans. Clearlake wastewater is dealt with in two ways: for areas without sewers waste and wastewater are collected in septic tanks, or wastewater is collected and subsequently treated in a municipal wastewater treatment plant.
Septic Systems A large portion of Clearlake residents utilize septic systems for waste disposal. Septic systems have the potential to contaminate groundwater and Clear Lake when placed in close proximity to the lake, in unsuitable soils for septic filtration, or when not managed properly. Lake County has a septic system ordinance that sets design criteria for new and repaired septic systems. Specifically, it requires that a site evaluation report be approved by Lake County prior to construction; allows for the use of specific alternative system designs; and requires approval of an area adequate for complete replacement. The ordinance was first adopted in 1985, was modified in 1993, and was modified again in 1999. Proper operation and maintenance, which is the responsibility of the homeowner, has a significant impact on how well a septic system works and for how long. As is the case with most California counties, there is no maintenance inspection program. There have been no major changes in the County inspection program since the mid-1990s.
Municipal Treatment Clearlake is served by the Lake County Sanitation District (LACOSAN), which operates the Southeast Regional wastewater treatment plant in the Clearlake area. This is one of two wastewater treatment facilities operated by LACOSAN. The other is the Northwest Regional wastewater treatment plant located near the Upper Arm of Clear Lake. There are two main causes of concern for wastewater treatment: raw sewage overflow from the collection system or treated effluent spills at the treatment plant. During periods of wet weather, groundwater levels rise and the soils become inundated, decreasing the capacity of the municipal wastewater system to collect and treat wastewater. Infiltration and Inflow is a common problem for the Southeast Regional wastewater treatment plant, resulting from infrastructure and capacity problems leading to the inflow of storm, ground, and lake water into the sewer system. The Regional Water Board also allocates WDR permits for wastewater disposal either into the ground or for transport outside of the watershed to the Geysers for geothermal injection. No permits are allocated for direct discharge into the lake. Transport to the Geysers should help improve system functioning by reducing wet weather pressure on system capacity, however; the effect of, or capacity of Geyser injection to meet prolonged wastewater disposal needs was not assessed. Wastewater collection and treatment is regulated by Federal, State and local water quality standards. LACOSAN must comply with U.S. Environmental Protection Agency (USEPA) regulations, as well as the requirements of California Water Code Section 13000, the Porter-Cologne Water Quality Control Act of 1969, which charges the State Water Resources Control Board with protecting the quality of all state waters for beneficial uses and enjoyment. To
Clearlake General Plan Background Report
Chapter 7- Conservation 154
enforce the State regulations the Regional Water Board issues WDR waivers for wastewater disposal, similar to agricultural processes. LACOSAN is also subject to hazardous materials storage permits and Risk Management Plans required by the Lake County Department of Environmental Health. The District also has Air Quality Permits issued by the Lake County Air Quality Management District, Streambed Alteration Permits issued by the California State Department of Fish and Game, and NPDES permits issued by the U.S. Army Corps of Engineers. Currently LACOSAN is not completely compliant with applicable State and Federal regulations. LACOSAN received a Notice of Violation on August 21, 2003 regarding spills and sewer overflows at the southeast wastewater treatment facility when untreated wastewater was discharged into surface water which led to Clear Lake, a Cease and Desist Order on March 24, 2003 where inundation and periods of high groundwater historically lead to a direct discharge of wastewater into Clear Lake, and another Cease and Desist Order in February 2005 in Kelseyville for violating the terms of a WDR.
Mining Activities There is a rich history of mining activities in Lake County, within the Clear Lake watershed. Sand and gravel mining are the only ongoing mining activities, which have led to lakebed erosion and contributed to nutrient loading into the lake. Previous mining activities, namely the Sulphur Bank Mine located along the Oaks Arm north of the City, have a continued impact on water quality in the lake. The Sulphur Bank Mercury Mine is a USEPA Superfund Site, and leaches mercury and arsenic into Clear Lake, which leads to mercury contamination of fish and wildlife. Borax mining also occurred along the lake, including Borax Lake located between the Oak and Lower Arm of Clear Lake.
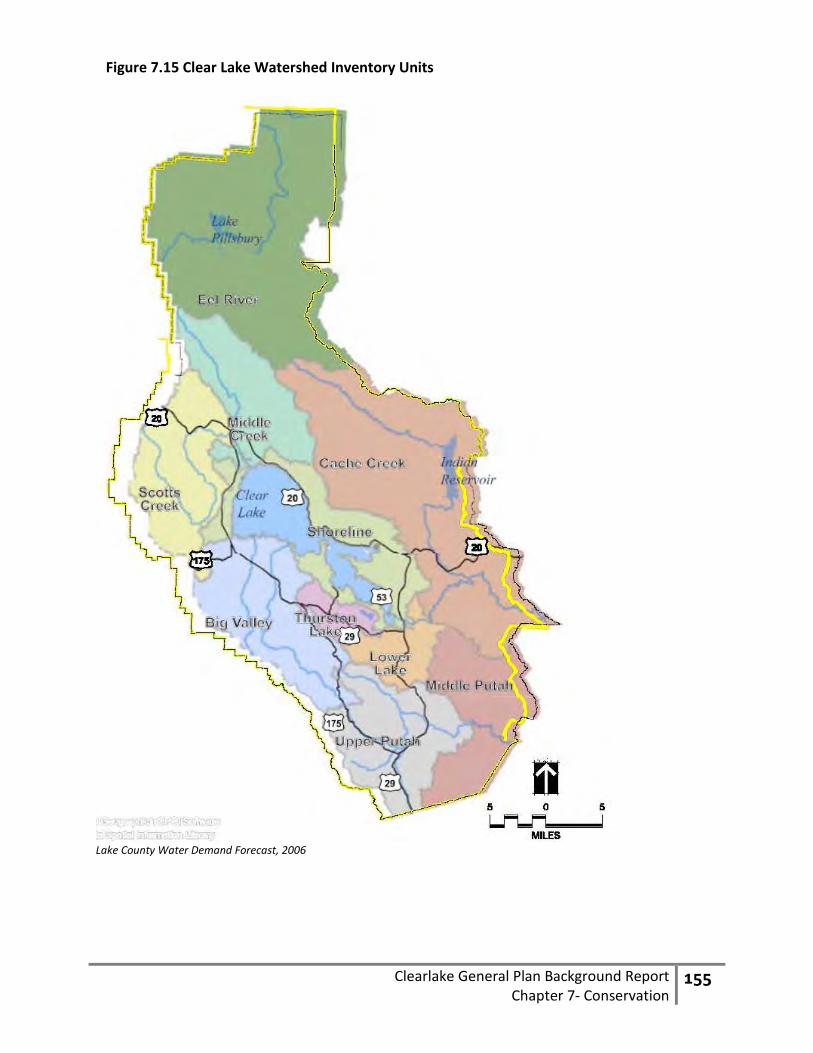
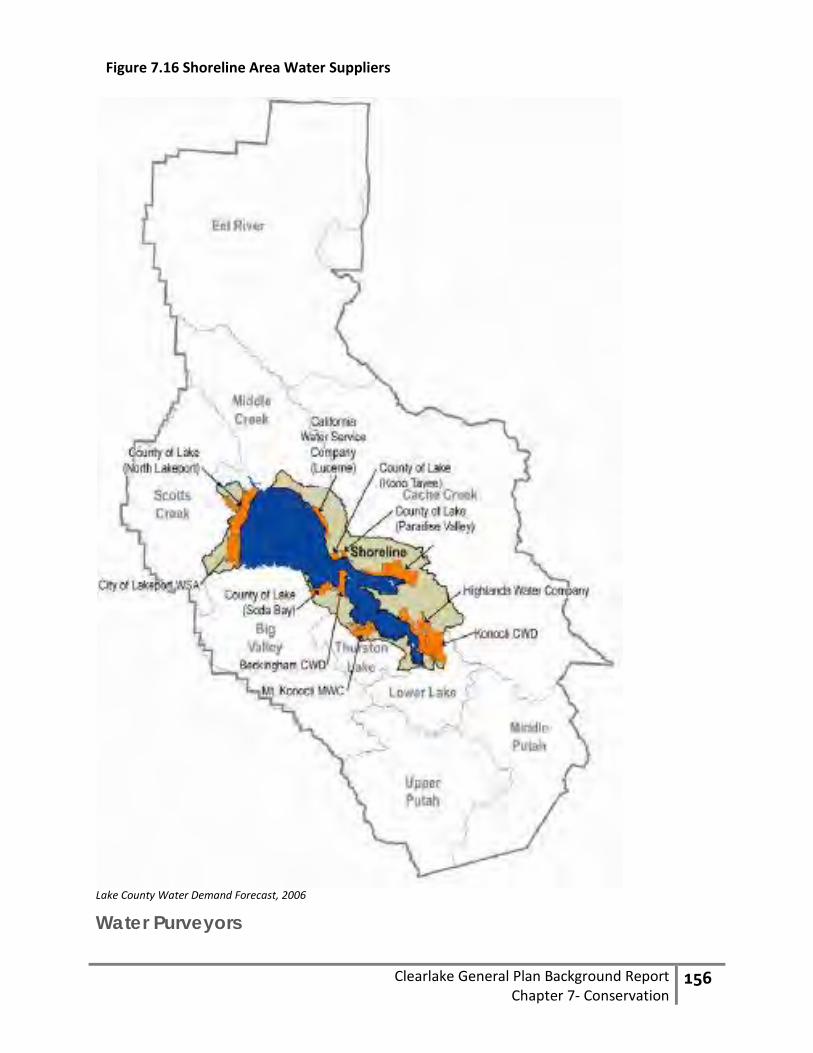
6. Water Supply and Demand This section provides a brief overview of the institutional issues regarding water supply sources, uses, water-related issues and concerns for agencies in Lake County. Lake County is divided into ten Inventory Units used by the County to develop a detailed water supply and use analysis. The Inventory Units have similar geologic, topographic, and political characteristics. As shown in Figure 7.15, The City of Clearlake is inventoried under the Shoreline inventory Unit. The Shoreline Inventory Unit is located in the center of Lake County. It includes approximately 55,618 acres. The Shoreline Unit follows the shores of Clear Lake and includes the communities of Nice, Lucerne, Glenhaven, Clearlake Oaks, City of Clearlake, Buckingham, Soda Bay, and the City of Lakeport, Shown in Figure 7.16. Multiple municipal water purveyors serve Shoreline Unit communities. The municipal systems use a combination of ground and surface water supplies from the Clear Lake watershed and tributaries.
Clearlake General Plan Background Report
Chapter 7- Conservation 155
Lake County Water Demand Forecast, 2006
Figure 7.15 Clear Lake Watershed Inventory Units
Clearlake General Plan Background Report
Chapter 7- Conservation 156
Lake County Water Demand Forecast, 2006
Water Purveyors
Figure 7.16 Shoreline Area Water Suppliers
Clearlake General Plan Background Report
Chapter 7- Conservation 157
Water is not a service provided by the City. Water is provided instead by four separate entities and three types of water service providers in the area:
California Cities Water Company The California Cities Water Company is a Public Utility operating along the Northeast shore of the Lower Arm. According to the Lake County General Plan Background Report in February 2003, the CAL Cities Water Company serves a population of approximately 5,195 people and approximately 2,171 total service connections, including households and businesses.
Highlands Mutual Water Company The Highlands Mutual Water Company provides potable water to the central portion of the City of Clearlake between the southeastern shore of Clear Lake on the west and Highway 53 on the east. The Company is located along the East shore of the Lower Arm. According to the Lake County General Plan Background Report, in February 2003, the Highlands Mutual Water Company served a population of approximately 4,452 and approximately 2,470 total service connections, including households and businesses.
Konocti County Water District Located along the East shore of the Lower Arm, The Konocti County Water District is a Lake County Water District that provides potable water to the eastern portion of the City of Clearlake between Highway 53 on the west and roughly the eastern edge of the City of Clearlake. According to the Lake County General Plan Background Report in February 2003, the Konocti County Water District serves a population of approximately 4,500 and approximately 1,474 total service connections, including households and businesses.
Groundwater Well Distribution and Extraction Urban water users can also be self-supplied with individually operated groundwater wells, as is common for agricultural uses. Independent groundwater wells supply a population of approximately 10,000 people in the Shoreline Inventory Unit. Lake County has approximately 5,300 wells: 3,596 wells are domestic, 813 wells are irrigation, 108 wells are municipal wells, 220 wells are monitoring wells, and 596 wells are listed as “other”. The majority of wells are located in the northern portion of the watershed, with the Clear Lake Cache Formation and the Burns Valley Cache Formation only hosting 97 and 111 wells, respectively. Groundwater levels typically decline during the summer period because of the higher extraction rates required to meet increased demands. Groundwater levels recover during the winter when demands are much lower. During drought periods, the groundwater basins do not fully recover, possibly leading to short-term overdraft, yet long term trends in the hydrographs in Lake County appear to indicate that annual groundwater extractions are not exceeding annual groundwater recharge in groundwater basins.
Clearlake General Plan Background Report
Chapter 7- Conservation 158
Additional Information The City of Clearlake provides no water service directly, thus water quality, supply, and demand are managed at the County level. As discussed above, The Yolo County Flood Control and Water Conservation District (Yolo District) owns the rights to surface water from Clear Lake and sells water to water purveyors who supply water for uses in both Yolo and Lake Counties. The information available for water supply and demand for the City is extrapolated from the 2006 Lake County Water Inventory and Analysis, the 2006 Lake County Water Demand Forecast, and the 2005 LAFCO Municipal Service Review (MSR). According to the reports, most water for residential users is drawn from Clear Lake, and the water districts have indicated that there are sufficient entitlements available to accommodate projected growth. Developers are required to install water lines that connect to the applicable water system, unless site conditions and the proposed project permit the use of a private well. Distribution capacity also appears sufficient to accommodate planned growth in the majority of areas, although increases in distribution line sizes may be necessary in areas with inadequate capacity. Insufficient water supplies or overly burdensome infrastructure requirements have not constrained development in the past, and it is not anticipated that this will serve as a constraint in the near future. For a complete discussion of water distribution, see Chapter 8, Public Facilities.
Future Demand In conjunction with the development of the Countywide Groundwater Management Plan, the Lake County Watershed Protection District developed the 2006 Water Demand Forecast based on information provided in the Water Inventory and Analysis report on water resources within the County. The demand for water in Lake County will increase as population grows and agricultural production increases. Water demand is based on population increases as well as employment projections, landscaping needs based on residential growth, and climate changes which alter evaporation rates. Urban water demand is anticipated to increase 81% from an average of 10,900-acre-feet per year to 19,738 acre-feet per year by the year 2040. Depending on the type and rate of agricultural development, the current average agricultural water demand of 39,817 acre-feet per year may be as much as 48,387 acre-feet per year by the year 2040. Demand has been estimated for urban and agricultural uses, as urban and agricultural development are changing within the County, and projected water demand depends on the type, location, and intensity of both types of land uses.
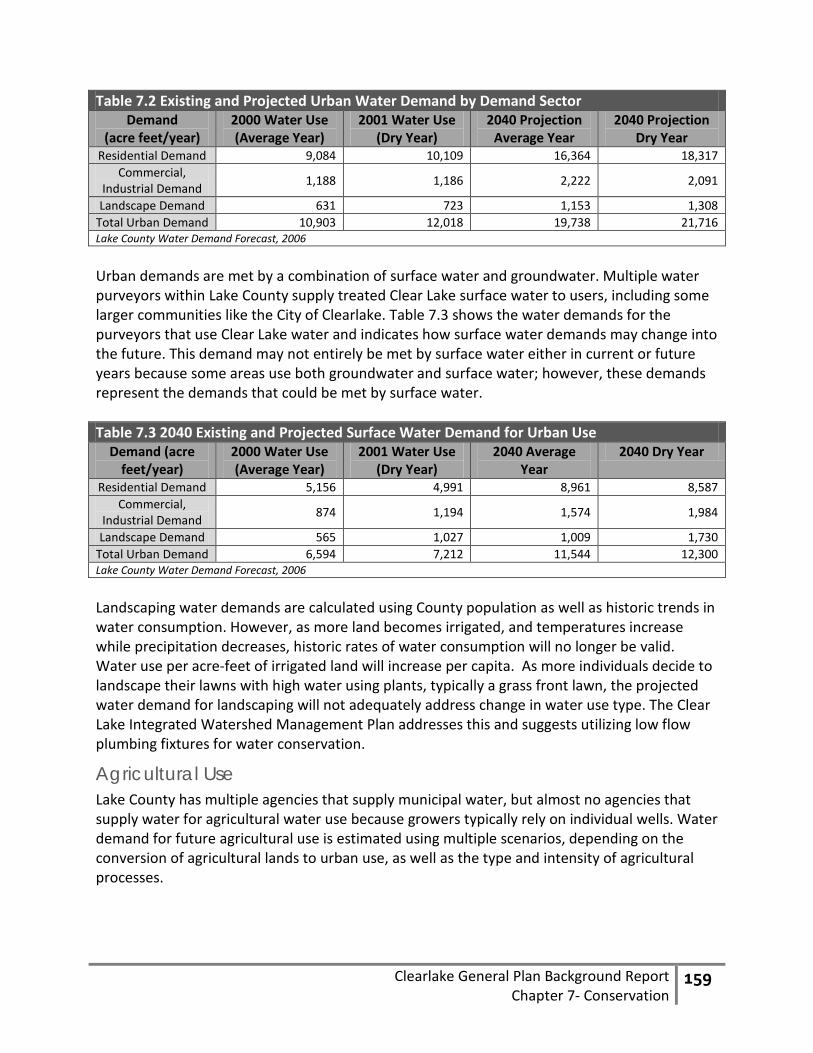
Urban Use Table 7.2 shows the 2040 urban water demand projections by demand type. These projections are based on estimated population growth rates and current dry year and average year water demand per capita as established in the Lake County Water Inventory and Analysis report. The results show that average year urban water use would increase by 8,835 acre-feet, and that dry year urban water use would increase by 9,698 acre-feet in 2040.
Clearlake General Plan Background Report
Chapter 7- Conservation 159
Urban demands are met by a combination of surface water and groundwater. Multiple water purveyors within Lake County supply treated Clear Lake surface water to users, including some larger communities like the City of Clearlake. Table 7.3 shows the water demands for the purveyors that use Clear Lake water and indicates how surface water demands may change into the future. This demand may not entirely be met by surface water either in current or future years because some areas use both groundwater and surface water; however, these demands represent the demands that could be met by surface water. Table 7.3 2040 Existing and Projected Surface Water Demand for Urban Use
Demand (acre feet/year)
2000 Water Use (Average Year)
2001 Water Use (Dry Year)
2040 Average Year
2040 Dry Year
Residential Demand 5,156 4,991 8,961 8,587 Commercial,
Industrial Demand 874 1,194 1,574 1,984
Landscape Demand 565 1,027 1,009 1,730 Total Urban Demand 6,594 7,212 11,544 12,300 Lake County Water Demand Forecast, 2006 Landscaping water demands are calculated using County population as well as historic trends in water consumption. However, as more land becomes irrigated, and temperatures increase while precipitation decreases, historic rates of water consumption will no longer be valid. Water use per acre-feet of irrigated land will increase per capita. As more individuals decide to landscape their lawns with high water using plants, typically a grass front lawn, the projected water demand for landscaping will not adequately address change in water use type. The Clear Lake Integrated Watershed Management Plan addresses this and suggests utilizing low flow plumbing fixtures for water conservation.
Agricultural Use Lake County has multiple agencies that supply municipal water, but almost no agencies that supply water for agricultural water use because growers typically rely on individual wells. Water demand for future agricultural use is estimated using multiple scenarios, depending on the conversion of agricultural lands to urban use, as well as the type and intensity of agricultural processes.
Table 7.2 Existing and Projected Urban Water Demand by Demand Sector Demand
(acre feet/year) 2000 Water Use (Average Year)
2001 Water Use (Dry Year)
2040 Projection Average Year
2040 Projection Dry Year
Residential Demand 9,084 10,109 16,364 18,317 Commercial,
Industrial Demand 1,188 1,186 2,222 2,091
Landscape Demand 631 723 1,153 1,308 Total Urban Demand 10,903 12,018 19,738 21,716 Lake County Water Demand Forecast, 2006
Clearlake General Plan Background Report
Chapter 7- Conservation 160
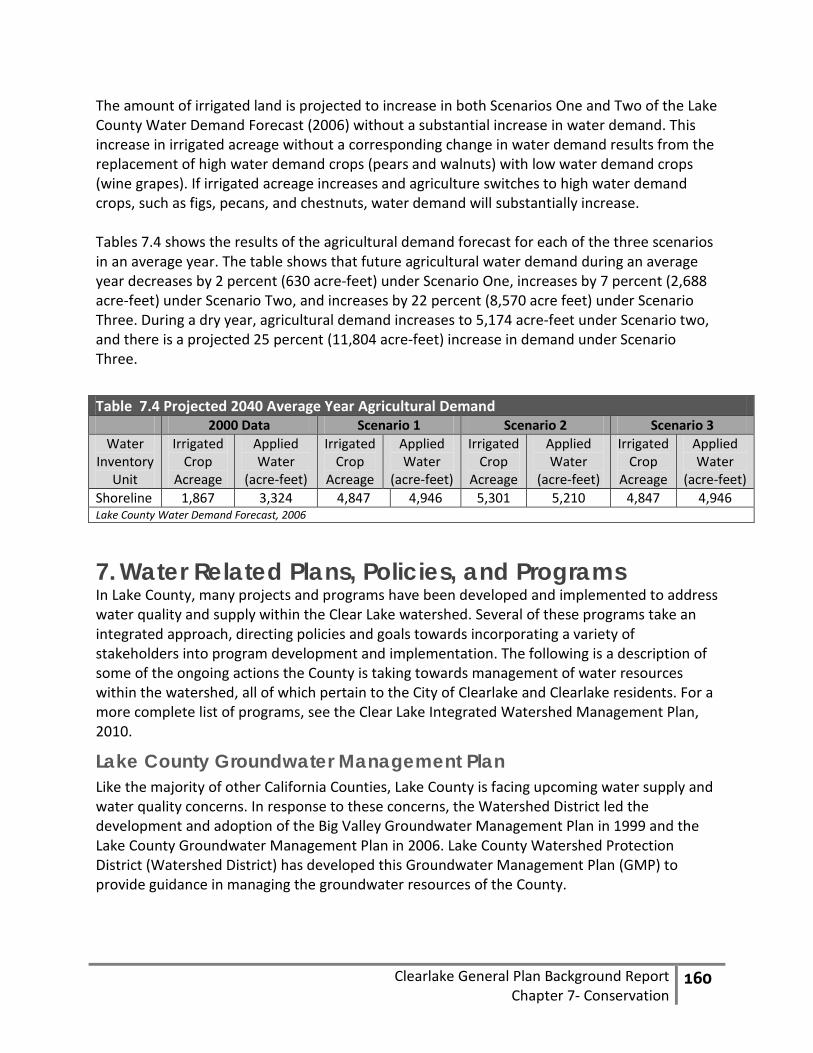
The amount of irrigated land is projected to increase in both Scenarios One and Two of the Lake County Water Demand Forecast (2006) without a substantial increase in water demand. This increase in irrigated acreage without a corresponding change in water demand results from the replacement of high water demand crops (pears and walnuts) with low water demand crops (wine grapes). If irrigated acreage increases and agriculture switches to high water demand crops, such as figs, pecans, and chestnuts, water demand will substantially increase. Tables 7.4 shows the results of the agricultural demand forecast for each of the three scenarios in an average year. The table shows that future agricultural water demand during an average year decreases by 2 percent (630 acre-feet) under Scenario One, increases by 7 percent (2,688 acre-feet) under Scenario Two, and increases by 22 percent (8,570 acre feet) under Scenario Three. During a dry year, agricultural demand increases to 5,174 acre-feet under Scenario two, and there is a projected 25 percent (11,804 acre-feet) increase in demand under Scenario Three.
7. Water Related Plans, Policies, and Programs In Lake County, many projects and programs have been developed and implemented to address water quality and supply within the Clear Lake watershed. Several of these programs take an integrated approach, directing policies and goals towards incorporating a variety of stakeholders into program development and implementation. The following is a description of some of the ongoing actions the County is taking towards management of water resources within the watershed, all of which pertain to the City of Clearlake and Clearlake residents. For a more complete list of programs, see the Clear Lake Integrated Watershed Management Plan, 2010.
Lake County Groundwater Management Plan Like the majority of other California Counties, Lake County is facing upcoming water supply and water quality concerns. In response to these concerns, the Watershed District led the development and adoption of the Big Valley Groundwater Management Plan in 1999 and the Lake County Groundwater Management Plan in 2006. Lake County Watershed Protection District (Watershed District) has developed this Groundwater Management Plan (GMP) to provide guidance in managing the groundwater resources of the County.
Table 7.4 Projected 2040 Average Year Agricultural Demand 2000 Data Scenario 1 Scenario 2 Scenario 3
Water Inventory
Unit
Irrigated Crop
Acreage
Applied Water
(acre-feet)
Irrigated Crop
Acreage
Applied Water
(acre-feet)
Irrigated Crop
Acreage
Applied Water
(acre-feet)
Irrigated Crop
Acreage
Applied Water
(acre-feet) Shoreline 1,867 3,324 4,847 4,946 5,301 5,210 4,847 4,946 Lake County Water Demand Forecast, 2006
Clearlake General Plan Background Report
Chapter 7- Conservation 161
In recent years, the Watershed District initiated a number of efforts to proactively address water resource issues, including documenting the current status of water use and supply, identifying areas of need, and developing recommendations to ensure a supply of high quality water into the future. This GMP, together with the Lake County Water Inventory and Analysis (CDM, 2006) and the Lake County Water Demand Forecast (CDM, 2006), increase understanding of the water resources in Lake County and provide a framework for the County and other water users to implement effective water resource management programs.
Total Maximum Daily Load Monitoring and Implementation Plan Clear Lake is listed as an impaired water body on the State Water Resources Control Board’s 303(d) list due to high nutrient levels. As a result, the State developed a nutrient total maximum daily load (TMDL) for Clear Lake. The TMDL, adopted by the Central Valley Regional Water Quality Control Board (Regional Water Board) in 2006, recommends a 40% reduction in phosphorous levels of the Lake to reduce algae and increase water clarity. As required by the TMDL, Lake County and Clear Lake TMDL stakeholders developed a monitoring program in 2008 to measure the source and quantity of nutrients entering the lake and a subsequent Monitoring and Implementation Plan (2009) which identifies past, present, and proposed actions to reduce the nutrient loading of Clear Lake, including mercury levels from the Sulphur Bank Mercury Mine and other mercury hotspots within the watershed.
Clear Lake Integrated Watershed Management Plan Groundwater, surface water, storm water and wastewater come from a variety of sources and do not adhere to city or county boundaries. The Clear Lake Integrated Watershed Management Plan (CLIWMP) is an effort to coordinate an approach to watershed management, describe current watershed conditions, and develop a comprehensive set of strategies and programs to manage the Clear Lake watershed on a larger scale, beyond individual stakeholder, city or county efforts. The CLIWMP was prepared by the Lake County Department of Public Works under a CALFED Watershed Program grant and adopted by the Lake County Board of Supervisors in March 2010. The CLIWMP identifies areas of concern for watershed management including, but not limited to: agriculture, residential and commercial uses, erosion and sedimentation, fire hazards, wildlife and habitat, and recreation and aesthetics. As defined in the CLIWMP, the purpose of the plan is to
“describe the existing conditions of the watershed based on findings and conclusions of previous studies, to describe past and current watershed management, and to use this information to identify opportunities to improve and/or protect the health and quality of conditions in the watershed and provide a guidance document useful in future watershed planning efforts. The Management Plan is both programmatic and project-based in nature and sets the stage for future implementation actions.” (CLIWMP, p.11)
Lake County Clean Water Program The Lake County Clean Water Program (LCCWP, previously the Storm Water Management Plan) is a joint effort between Lake County, the City of Clearlake and the City of Lakeport to

Clearlake General Plan Background Report
Chapter 7- Conservation 162
reduce the damage caused by polluted storm water runoff and impacts of increases in peak flows from development. In 2003, the County and two cities submitted a Storm Water Management Plan to comply with State Clean Water Act regulations for State Waste Discharge Requirements from Municipal Separate Storm Sewer Systems (MS4). In 2004 the County and two cities were authorized under a National Pollutant Discharge Elimination System (NPDES) General Permit to discharge from the sewer systems provided that they implement and monitor the SWMP and comply with the terms of the permit. The General Permit requires the Counties and Cities to implement the six best management practices to manage storm water runoff.
Full Circle Project The Full Circle Wastewater Collection System Project in Lake County is described as a “long-term clean water initiative encircling Clear Lake” (Lake County, Special Districts Administrator information handout). This project has many proposed objectives, though its purpose is to sustain Clear Lake as one of California’s premier water bodies through maximization of water reuse projects and integration with economic development and environmental restoration programs. The project calls for the collection of treated wastewater from around Clear Lake and then injection into the nearby geothermal Geysers for disposal. The first two phases of the project pipeline were completed by 2002, serving the City of Clearlake as well as Lower Lake, Clearlake Oaks, Upper Lake, and North Lakeport. As of 2010, the third phase to complete the ‘circle’ and link the remaining watershed communities to the disposal system is still in progress.
8. Air Quality This section discusses the status of the City of Clearlake in meeting all Federal, State, and local air quality standards. The City of Clearlake is located in the Lake County Air Basin, which is regulated by the Lake County Air Quality Management District (LCAQMD). LCAQMD reports to the California Air Resource Board which monitors the status of Air Basins in meeting Federal and State air standards.
Air Quality Standards Federal Regulation Under the rules established in the Federal Clean Air Act, the United States Environmental Protection Agency (USEPA) is required to establish a set of National Ambient Air Quality Standards (NAAQS) for six principal pollutants. These six pollutants are called ‘criteria’ pollutants and are regulated for both health and welfare protection of individuals, sensitive populations, animals, vegetation and crops. Table 7.5 shows the six federal criteria pollutants, the maximum allowed concentration level, and the standard of regulation. These pollutants are measured periodically, and Air Basins are given a status of attainment (within regulated limit), non-attainment (exceed Federal standard), or unclassified (due to limited information) .
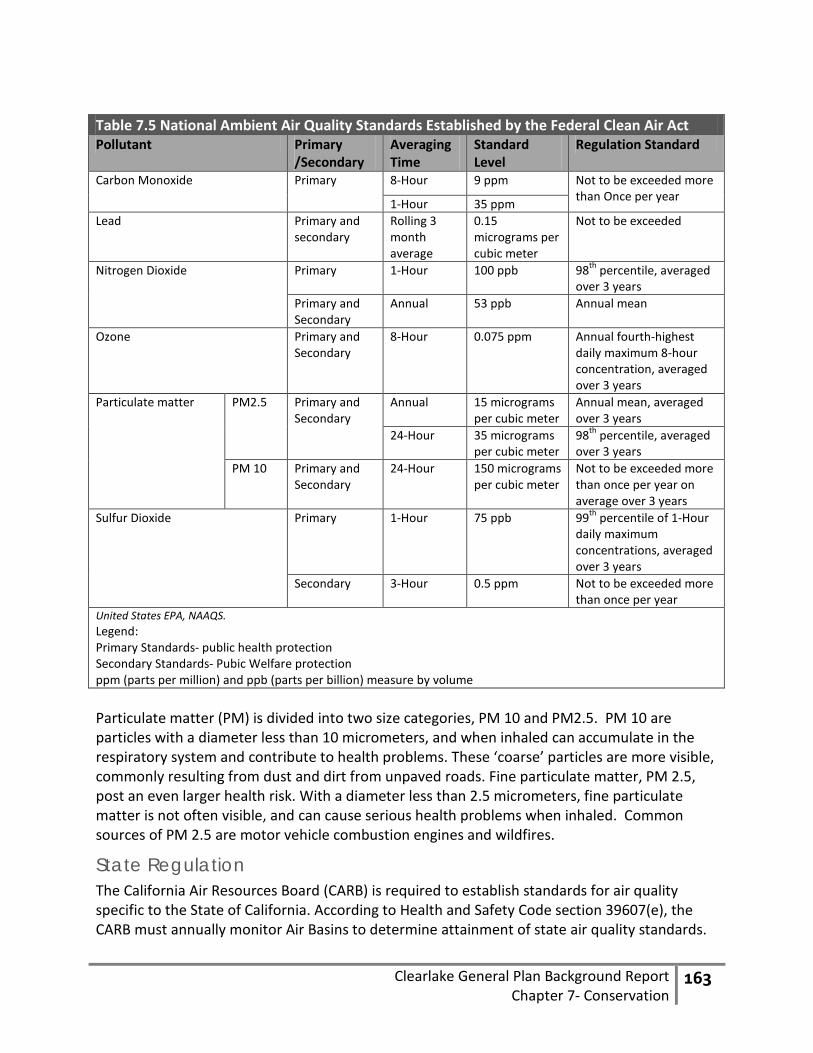
Clearlake General Plan Background Report
Chapter 7- Conservation 163
Particulate matter (PM) is divided into two size categories, PM 10 and PM2.5. PM 10 are particles with a diameter less than 10 micrometers, and when inhaled can accumulate in the respiratory system and contribute to health problems. These ‘coarse’ particles are more visible, commonly resulting from dust and dirt from unpaved roads. Fine particulate matter, PM 2.5, post an even larger health risk. With a diameter less than 2.5 micrometers, fine particulate matter is not often visible, and can cause serious health problems when inhaled. Common sources of PM 2.5 are motor vehicle combustion engines and wildfires.
State Regulation The California Air Resources Board (CARB) is required to establish standards for air quality specific to the State of California. According to Health and Safety Code section 39607(e), the CARB must annually monitor Air Basins to determine attainment of state air quality standards.
Table 7.5 National Ambient Air Quality Standards Established by the Federal Clean Air Act Pollutant Primary
/Secondary Averaging Time
Standard Level
Regulation Standard
Carbon Monoxide Primary 8-Hour 9 ppm Not to be exceeded more than Once per year 1-Hour 35 ppm
Lead Primary and secondary
Rolling 3 month average
0.15 micrograms per cubic meter
Not to be exceeded
Nitrogen Dioxide Primary 1-Hour 100 ppb 98th percentile, averaged over 3 years
Primary and Secondary
Annual 53 ppb Annual mean
Ozone Primary and Secondary
8-Hour 0.075 ppm Annual fourth-highest daily maximum 8-hour concentration, averaged over 3 years
Particulate matter PM2.5 Primary and Secondary
Annual 15 micrograms per cubic meter
Annual mean, averaged over 3 years
24-Hour 35 micrograms per cubic meter
98th percentile, averaged over 3 years
PM 10 Primary and Secondary
24-Hour 150 micrograms per cubic meter
Not to be exceeded more than once per year on average over 3 years
Sulfur Dioxide Primary 1-Hour 75 ppb 99th percentile of 1-Hour daily maximum concentrations, averaged over 3 years
Secondary 3-Hour 0.5 ppm Not to be exceeded more than once per year
United States EPA, NAAQS. Legend: Primary Standards- public health protection Secondary Standards- Pubic Welfare protection ppm (parts per million) and ppb (parts per billion) measure by volume
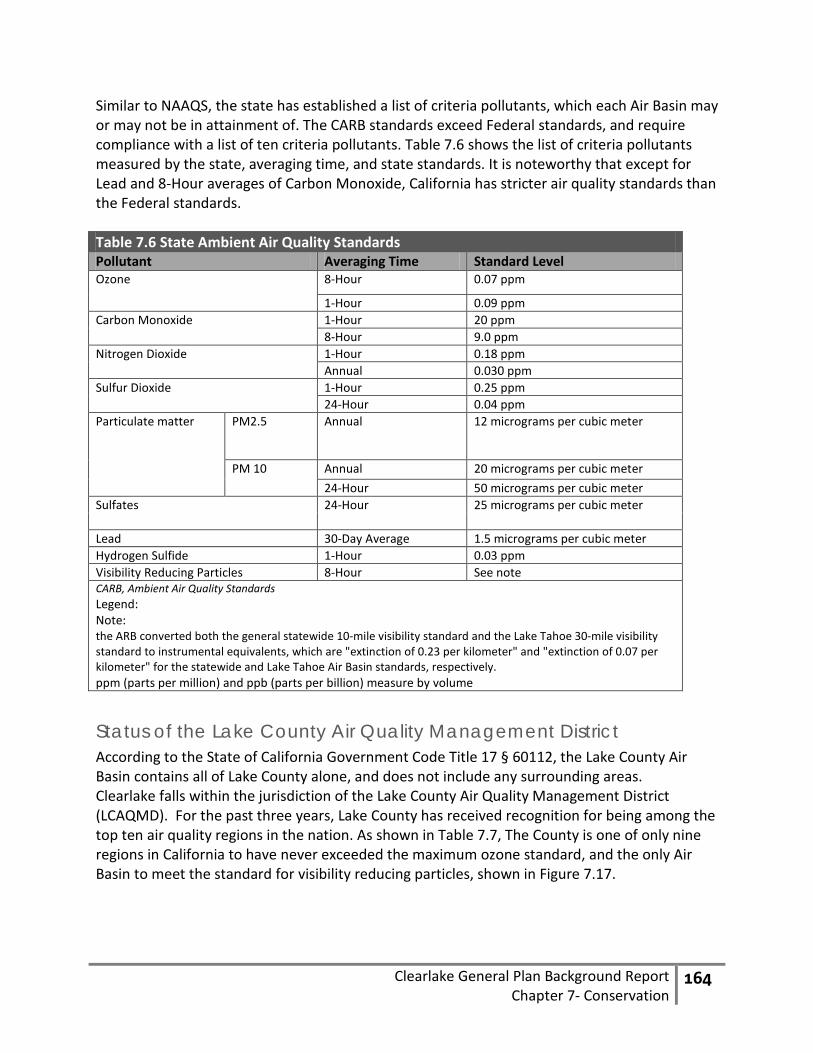
Clearlake General Plan Background Report
Chapter 7- Conservation 164
Similar to NAAQS, the state has established a list of criteria pollutants, which each Air Basin may or may not be in attainment of. The CARB standards exceed Federal standards, and require compliance with a list of ten criteria pollutants. Table 7.6 shows the list of criteria pollutants measured by the state, averaging time, and state standards. It is noteworthy that except for Lead and 8-Hour averages of Carbon Monoxide, California has stricter air quality standards than the Federal standards.
Status of the Lake County Air Quality Management District According to the State of California Government Code Title 17 § 60112, the Lake County Air Basin contains all of Lake County alone, and does not include any surrounding areas. Clearlake falls within the jurisdiction of the Lake County Air Quality Management District (LCAQMD). For the past three years, Lake County has received recognition for being among the top ten air quality regions in the nation. As shown in Table 7.7, The County is one of only nine regions in California to have never exceeded the maximum ozone standard, and the only Air Basin to meet the standard for visibility reducing particles, shown in Figure 7.17.
Table 7.6 State Ambient Air Quality Standards Pollutant Averaging Time Standard Level Ozone 8-Hour 0.07 ppm
1-Hour 0.09 ppm Carbon Monoxide 1-Hour 20 ppm
8-Hour 9.0 ppm Nitrogen Dioxide 1-Hour 0.18 ppm
Annual 0.030 ppm Sulfur Dioxide 1-Hour 0.25 ppm
24-Hour 0.04 ppm Particulate matter PM2.5 Annual 12 micrograms per cubic meter
PM 10 Annual 20 micrograms per cubic meter 24-Hour 50 micrograms per cubic meter
Sulfates 24-Hour 25 micrograms per cubic meter
Lead 30-Day Average 1.5 micrograms per cubic meter Hydrogen Sulfide 1-Hour 0.03 ppm Visibility Reducing Particles 8-Hour See note CARB, Ambient Air Quality Standards Legend: Note: the ARB converted both the general statewide 10-mile visibility standard and the Lake Tahoe 30-mile visibility standard to instrumental equivalents, which are "extinction of 0.23 per kilometer" and "extinction of 0.07 per kilometer" for the statewide and Lake Tahoe Air Basin standards, respectively. ppm (parts per million) and ppb (parts per billion) measure by volume

Clearlake General Plan Background Report
Chapter 7- Conservation 165
Table 7.7 City of Clearlake Federal and State Air Quality Standards Attainment Status, 2011 Pollutant State Standard Federal Standard Ozone Attainment Unclassified/Attainment PM10 Attainment Unclassified PM2.5 Attainment Unclassified/Attainment Carbon Monoxide Attainment Unclassified/Attainment Nitrogen Dioxide Attainment Unclassified/Attainment Sulfur Dioxide Attainment Unclassified/Attainment Sulfates Attainment Lead Attainment Unclassified/Attainment Hydrogen Sulfide Attainment Visibility Reducing particles Attainment (only one in CA) CARB website, accessed 2012
In 2008 the California Air Resource Board released estimated annual average emissions rates for stationary, area wide, and mobile source emitters for the Lake County Air Basin. Table 7.8 shows a summary of Lake County Air Basin Emissions by source category. According to the report, main sources of total organic gas (TOG) emissions are Electric fuel combustion (stationary) and recreational boats (Mobile). Total organic gases are organic compounds excluding carbon monoxide, carbon dioxide, carbonic acid, metallic carbides, and ammonium carbonate. Reactive Organic Gases (ROG) are compounds which readily vaporize and pose health risks, including reaction with nitrogen oxides (NOX) to produce smog. Carbon Monoxide (CO) is mostly coming from mobile emissions sources. Motorized boats and light duty passenger vehicles and trucks make up two-thirds of the mobile source CO emissions, and one half of the total CO emissions in the Air Basin. Finally, unpaved roads were the largest source of particulate matter (PM) in the County. More than one-half of area wide PM emissions resulted from unpaved road dust.
Table 7.8 2008 Lake County Air Basin Emissions Summary
Emissions Source
Average Criteria Pollutant Emissions (Tons/day)
TOG ROG CO NOX SOX PM PM10 PM2.5
STATIONARY EMISSIONS 6.29 1.11 8.96 0.45 0.25 1.61 1 0.41
AREA WIDE EMISSIONS 5.7 2.61 12.87 0.42 0.13 17.47 10.62 2.94
MOBILE SOURCE EMISSIONS 8.48 7.89 55.58 6.15 0.02 0.44 0.42 0.32
TOTAL 20.47 11.61 77.41 7.02 0.4 19.52 12.04 3.67
California Air Resource Board, 2008
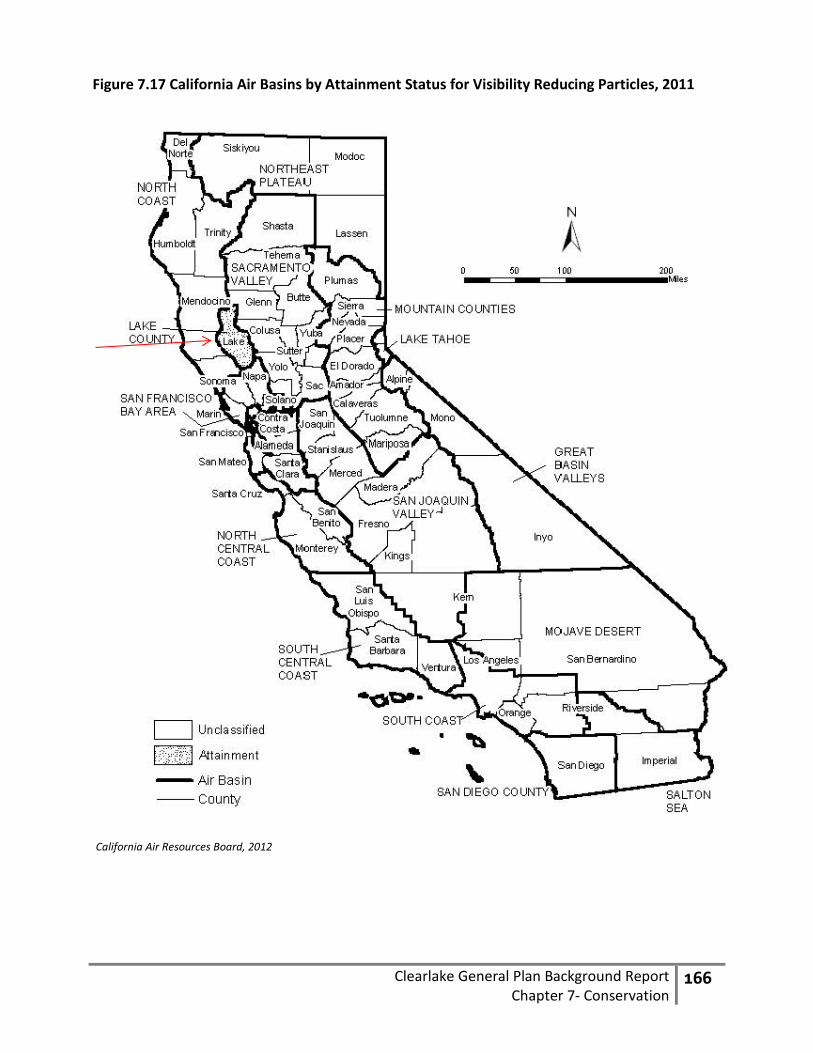
Clearlake General Plan Background Report
Chapter 7- Conservation 166
California Air Resources Board, 2012
Figure 7.17 California Air Basins by Attainment Status for Visibility Reducing Particles, 2011

Clearlake General Plan Background Report
Chapter 7- Conservation 167
Climate Change Climate change is a global issue with local implications for transportation, energy production, air quality, and resource conservation. Greenhouse gases occur naturally within the Earth’s atmosphere, yet human activities have increased the level of greenhouse gases through combustion of fossil fuels, deforestation, and other industrialized processes. Increased levels of greenhouse gases have led to an increase in the temperature of Earth’s surface, with the potential to cause significant harm to human populations on a global scale. International leaders have recognized the threat of climate change, with several countries developing an international treaty to reduce greenhouse gas emissions. The United States has yet to become involved in any international agreement; however, climate change is being addressed within California.
State Regulation Assembly Bill 4420 (AB 4420) Directs the California Energy Commission (CEC) to prepare and maintain the State’s inventory of greenhouse gas (GHG) emissions. AB 4420 was adopted in 1988 and was the first time greenhouse gases were inventoried and assessed in the State of California. The results from this assessment were reported in two documents: “The Impacts of Global Warming on California” and “Climate Change Potential Impacts and Policy Recommendations” (California Energy Commission, 2008).
Assembly Bill 32 (AB 32), The California Global Warming Solutions Act of 2006 Under AB 32, the California Air Resources Board (CARB) must establish a state-wide greenhouse gas emissions target.
Assembly Bill 1493 (AB 1493), the Pavley Bill AB 1493 supersedes Federal corporate average fuel economy standards for greenhouse gas emission from motor vehicles. AB 1493, adopted in 2002, does not mandate any particular technology for meeting emissions standards.
Senate Bill 375 (SB 375), the Sustainable Communities and Climate Protection Act of 2008 According to AB 32 CARB must establish a framework to meet the goals established in AB 32. SB 375 is the implementation tool for AB 32, and establishes individualized greenhouse gas emissions targets for regional and metropolitan planning organizations (MPOs). CARB mandates MPOs to develop a sustainable communities strategy (SCS), which details how the MPO will meet the emissions target established by CARB. (California Air Resources Board, 2011)
Local Efforts The City of Clearlake is under the jurisdiction of the Lake County Area Planning Council. Figure 7.18 shows that Lake APC is considered a non-MPO Rural Regional Transportation Planning Agency, not required by state law to develop a SCS. However, the 2030 Lake County Regional Blueprint Plan (2010), does identify energy conservation and maintenance of clean air quality as

Clearlake General Plan Background Report
Chapter 7- Conservation 168
driving principles for the future of Lake County. The City does not have any green building or energy conservation strategies in place to address greenhouse gas emissions.
California Air Resource Board. 2009
Figure 7.18 California Metropolitan Planning Organizations by Region
Clearlake General Plan Background Report
Chapter 7- Conservation 169
9. Biological Resources This section provides an overview of the existing conditions of biological resources in Clearlake, California. A list of the regulatory framework and general standards relating to biological resources are included, followed by descriptions of those resources located in Clearlake, California.
Regulatory Framework The City of Clearlake, situated on the southern shore of Clear Lake in Lake County, has historically supported a wide variety of plant and animal species. The condition of the Lake and surrounding environments has been significantly altered by urban development, agriculture and mining activities. Federal, State, and local regulations address the biological habitat as well as the species within these habitats. As environmental quality degrades, these regulations help protect the natural biological resources within the City.
Federal Regulation
Federal Endangered Species Act of 1773 The Act provides for the conservation of ecosystems upon which threatened and endangered species of fish, wildlife, and plants depend by authorizing the determination and listing of species as endangered or threatened and by prohibiting the unauthorized taking, possession, sale, and transport of endangered species. (U.S. Fish and Wildlife Services)
Migratory Bird Treaty Act of 1918 The Act federally prohibits the pursuit or attempt to hunt, take, capture, kill, poses, sell, ship, transport, carry or export any migratory bird, nest or egg of those included in the Act (U.S. Fish and Wildlife Services)
State Regulation
California Endangered Species Act (CESA) of 1984 The California Department of Fish and Game (CDFG) administers the California Endangered Species Act of 1984, which regulates the listing and “taking” of endangered and threatened species. The definition of “take” includes the harassment, pursuit or harm of a species. State laws authorize the CDFG to review projects for their potential impacts to listed species and their habitats.
California Fish and Game Code 1600-1616 The California Fish and Game Code regulates development to avoid and mitigate impacts or modification to rivers, streams, or lakes. Modification is defined as diverting or obstructing the natural flow of, or substantially changing or using any material from the bed, channel, or bank of, any river, stream or lake.
California Fish and Game Code 3503.5 Section 3503.5 states that it is unlawful to “take”, possess, or destroy any raptor (bird of prey species in the orders Falconiformes and Strigiformes), including their nests or eggs. Violations

Clearlake General Plan Background Report
Chapter 7- Conservation 170
include destruction of active raptor nests as a result of tree removal and disturbance to nesting pairs by nearby human activity that causes nest abandonment and reproductive failure.
Anderson Marsh State Historical Park Anderson Marsh State Historical Park is located on the southeast corner of Clearlake. The park protects several habitats, including freshwater marsh, oak woodland, grasslands, and riparian woodland.
Redbud Audubon Society The Redbud Audubon Society is a nonprofit California corporation that operates under the National Audubon Society. It was founded in 1975 by a group of conservation-minded Lake County Citizens.
Local Regulation
Clear Lake Integrated Aquatic Plant Management Plan, 2004 The Clear Lake Integrated Aquatic Plant Management Plan compiles rationale, issues, scientific data, and a recommended implementation plan to eradicate invasive plant species and ensure a sustainable and healthy aquatic plant community in Clear Lake.
McVicar Wildlife Sanctuary Located just west of the Anderson Marsh State Historical Park, the McVicar Wildlife Sanctuary is home to various species of fish and wildlife including the northwestern pond turtle, bats, gray fox, frogs, garter snakes, mink, muskrats, opossums, raccoons, river otters, skunks, and toads.
Habitats Habitats are characterized by particular species of plants and animals that influence and utilize the physical environment. The following descriptions provide details on existing habitats located in and around the City of Clearlake:
Lacustrine habitats Lacustrine habitats are aquatic habitats containing standing water, which include ponds, lakes, and reservoirs. Clear Lake is considered a lacustrine habitat. Today, an estimated 11 native and 19 introduced fish species are found in Clear Lake, and three native species are now presumed extinct. Several birds such as the American white pelican, osprey, western and Clark’s grebes, and great blue herons live off this habitat (CLIWMP, 2010).
Wetlands Wetlands are areas that are saturated by surface water or groundwater at a frequency and duration sufficient to support a prevalence of vegetation typically adapted for life in such conditions. Wetland plants filter nutrients and sediments before they enter the lake. Wetlands include freshwater marshes and vernal pools. (CLIWMP, 2010). Prior to European settlement, the total area of freshwater wetlands in Lake County estimated over 9,000 acres. In 2002, 1,920 acres, or 21 percent of this area remained. Wetland loss has
Clearlake General Plan Background Report
Chapter 7- Conservation 171
occurred in the City of Clearlake and in areas around the Lake because of reclamation for agriculture, housing development, and to extend shoreline and waterfront property. The largest and most viable remaining wetlands, within proximity to Clearlake are the Anderson Marsh State Park and the area between Clearlake Oaks and the Sulphur Bank Mercury Mine.
Freshwater Marshes Freshwater Marshes include wet meadows and vernal pools. Fresh water plants include sedges, rushes, cattails and tules. These plants provide nesting and protection for species like the tricolored and yellow headed blackbirds, the western pond turtle, and Western and Clark’s grebes. These plants also provide food, cover and spawning habitat for fish like the largemouth bass, bluegill, black crappie, green sunfish, brown bullhead, white catfish, Sacramento blackfish, tule perch, and prickly sculpin (CLIWMP, 2010). Most freshwater marshes in the Clear Lake Watershed are adjacent to Clear Lake (CLIWMP, 2010).
Vernal Pools Vernal pools are seasonally flooded depressions found on soils with an impermeable layer such as hardpan, claypan, or volcanic basalt. Vernal pool species include, freshwater crustaceans, insects, and amphibians (CLIWMP, 2010). The Department of Fish and Game estimates that 28 vernal pools comprise of 1,640 acres and are located on mostly private lands in the Clear Lake Watershed (CLIWMP, 2010).
Riparian Habitats Riparian Habitats are relatively narrow strips of land bordering streams, rivers, lakes and other water bodies. Riparian vegetation is adapted to periodic flooding and provides shade, food, and nutrients to aquatic ecosystems, land mammals, migrant birds, reptiles and amphibians. Some common tree species may include, willow, ash, alder, and maple. Shrubs and vines include, wild grape, wild rose, blackberry, and poison oak. The Clear Lake hitch, plittail, and Sacramento pike minnow use riparian habitats for spawning. (CLIWMP, 2010). Riparian habitats border Clearlake creeks and tributaries.
Upland Habitats Upland Habitat in Clearlake consists of blue oak and interior live oak woodlands and grasslands in low elevation, chaparral and oak-foothill pine woodlands on slopes and middle elevations, and mixed conifer and conifer hardwood forests and woodlands at higher elevations. Common annual grasses include wild oats, ripgut brome, red brome, wild barley and foxtail fescue. Common forbs include filarees, turkey mullein, clovers, and popcorn flower. (CLIWMP, 2010).
Vegetation Figure 7.19 shows the vegetation within the Clear Lake watershed. More than 40 percent of the area within the Clear Lake watershed is designated as chaparral, occurring at all elevations. The higher elevations of the watershed support various gradations of coniferous and hardwood forest which are prone to wildfire. Oak savannah communities and open annual grasslands are common at the lower elevations, with narrow strips of riparian habitat located along the banks
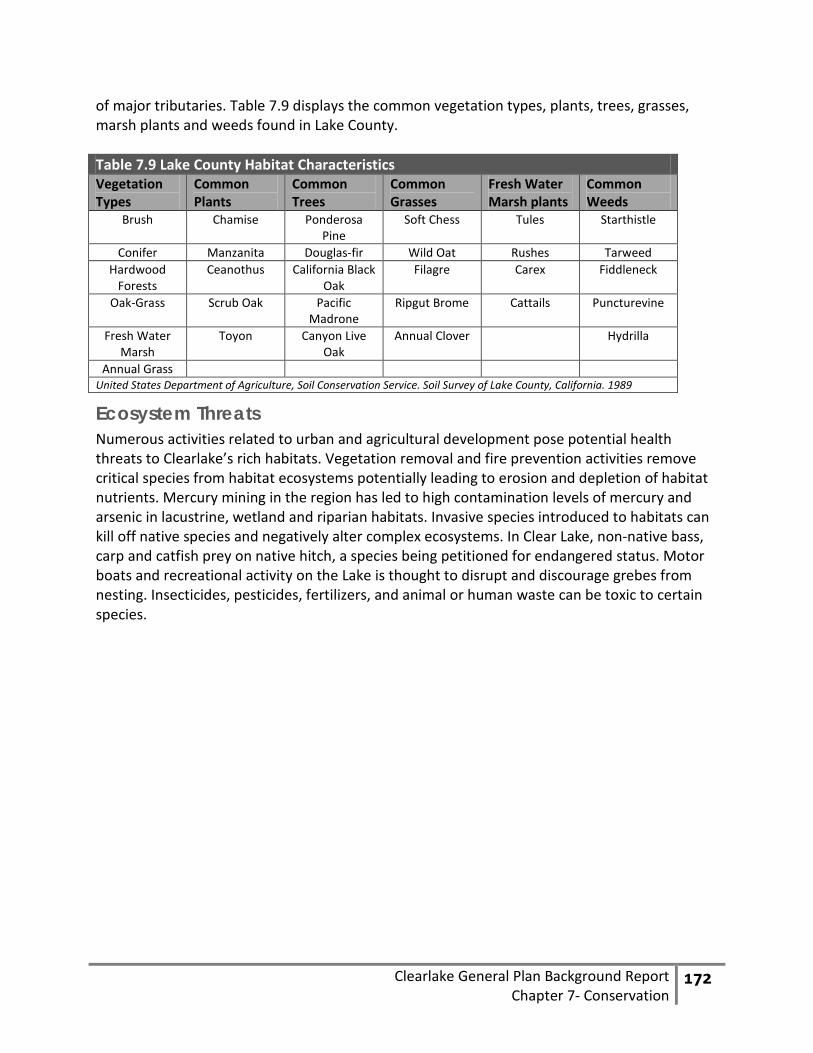
Clearlake General Plan Background Report
Chapter 7- Conservation 172
of major tributaries. Table 7.9 displays the common vegetation types, plants, trees, grasses, marsh plants and weeds found in Lake County. Table 7.9 Lake County Habitat Characteristics Vegetation Types
Common Plants
Common Trees
Common Grasses
Fresh Water Marsh plants
Common Weeds
Brush Chamise Ponderosa Pine
Soft Chess Tules Starthistle
Conifer Manzanita Douglas-fir Wild Oat Rushes Tarweed Hardwood
Forests Ceanothus California Black
Oak Filagre Carex Fiddleneck
Oak-Grass Scrub Oak Pacific Madrone
Ripgut Brome Cattails Puncturevine
Fresh Water Marsh
Toyon Canyon Live Oak
Annual Clover Hydrilla
Annual Grass United States Department of Agriculture, Soil Conservation Service. Soil Survey of Lake County, California. 1989
Ecosystem Threats Numerous activities related to urban and agricultural development pose potential health threats to Clearlake’s rich habitats. Vegetation removal and fire prevention activities remove critical species from habitat ecosystems potentially leading to erosion and depletion of habitat nutrients. Mercury mining in the region has led to high contamination levels of mercury and arsenic in lacustrine, wetland and riparian habitats. Invasive species introduced to habitats can kill off native species and negatively alter complex ecosystems. In Clear Lake, non-native bass, carp and catfish prey on native hitch, a species being petitioned for endangered status. Motor boats and recreational activity on the Lake is thought to disrupt and discourage grebes from nesting. Insecticides, pesticides, fertilizers, and animal or human waste can be toxic to certain species.

Clearlake General Plan Background Report
Chapter 7- Conservation 173
Clear Lake Integrated Watershed Management Plan, 2010
Figure 7.19 Clear Lake Watershed Vegetation
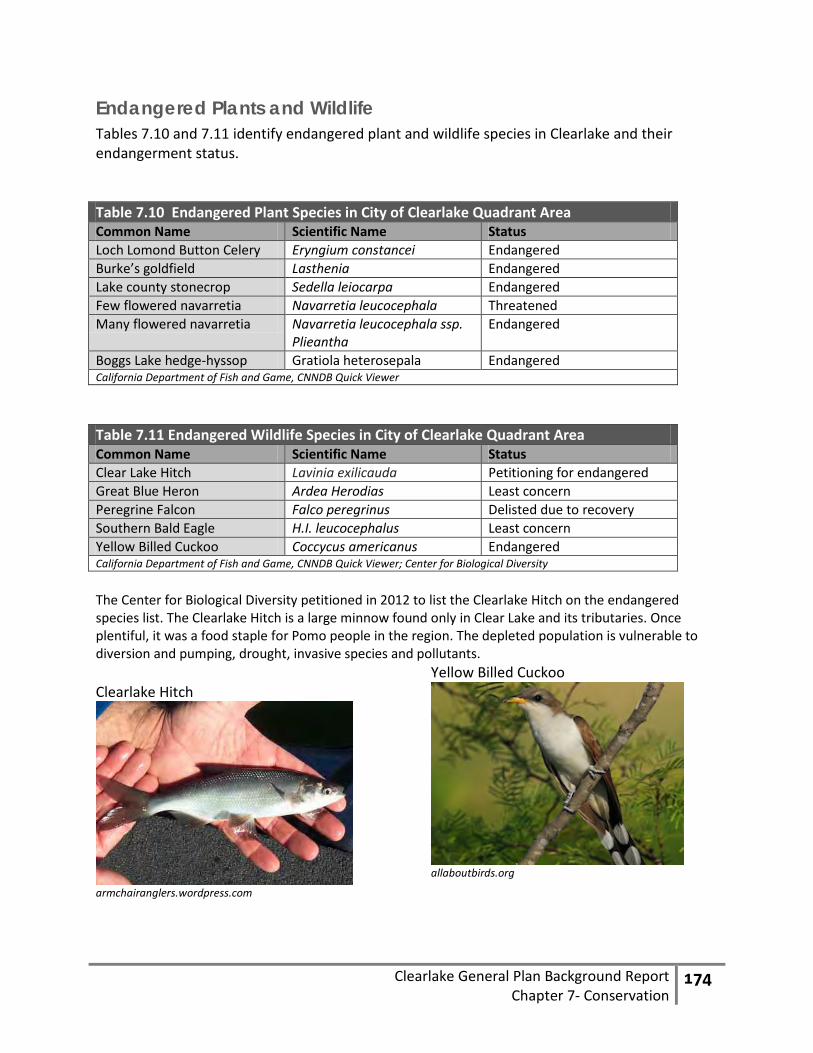
Clearlake General Plan Background Report
Chapter 7- Conservation 174
Endangered Plants and Wildlife Tables 7.10 and 7.11 identify endangered plant and wildlife species in Clearlake and their endangerment status. Table 7.10 Endangered Plant Species in City of Clearlake Quadrant Area Common Name Scientific Name Status Loch Lomond Button Celery Eryngium constancei Endangered Burke’s goldfield Lasthenia Endangered Lake county stonecrop Sedella leiocarpa Endangered Few flowered navarretia Navarretia leucocephala Threatened Many flowered navarretia Navarretia leucocephala ssp.
Plieantha Endangered
Boggs Lake hedge-hyssop Gratiola heterosepala Endangered California Department of Fish and Game, CNNDB Quick Viewer
Table 7.11 Endangered Wildlife Species in City of Clearlake Quadrant Area Common Name Scientific Name Status Clear Lake Hitch Lavinia exilicauda Petitioning for endangered Great Blue Heron Ardea Herodias Least concern Peregrine Falcon Falco peregrinus Delisted due to recovery Southern Bald Eagle H.I. leucocephalus Least concern Yellow Billed Cuckoo Coccycus americanus Endangered California Department of Fish and Game, CNNDB Quick Viewer; Center for Biological Diversity
The Center for Biological Diversity petitioned in 2012 to list the Clearlake Hitch on the endangered species list. The Clearlake Hitch is a large minnow found only in Clear Lake and its tributaries. Once plentiful, it was a food staple for Pomo people in the region. The depleted population is vulnerable to diversion and pumping, drought, invasive species and pollutants. Clearlake Hitch
armchairanglers.wordpress.com
Yellow Billed Cuckoo
allaboutbirds.org
Clearlake General Plan Background Report
Chapter 7- Conservation 175
Great Blue Heron
allaboutbirds.org
Peregrine Falcon
nationalgeographic.com
C. EMERGING DIRECTIONS Geology and Minerals Contamination from the sulfur mercury mine and other mining activities have left long lasting contamination problems in Clearlake’s waterways, water resources, and the ecosystems that depend on them. The community should consider both the costs and benefits of continued mining activities, and continue to focus efforts on cleaning up contaminated areas. Geologic history should also be considered when determining appropriate places for development while attention should be given to seismic activity and areas within proximity to other hazards.
Soils Soils are a critical component to the ecological function of a habitat, providing nutrients to plants and wildlife, and the foundation for future growth and development. The City of Clearlake should pay particular attention to the condition of soils and manage erosion and lake sedimentation. Additionally, the City should identify soil typologies suitable for particular development types, and work to locate appropriate land uses on soils, which can support the designated land use. Issues of concern include septic tank ground water infiltration, sediment erosion, ambient air quality due to excess dust, and soil stability. All future development should consider soil capacity to manage and mitigate potential risks.
Clearlake General Plan Background Report
Chapter 7- Conservation 176
Water Water was one of the biggest concerns for residents during both the first and second community meeting. Issues of water quality due to nutrient contamination and storm water runoff remain a problem in Clearlake and Lake County. The City should continue to focus efforts on regional watershed management, as the health of Clear Lake is affected by activities outside of the City. A regional approach to watershed management will help coordinate local efforts to manage runoff, address inadequate wastewater disposal, and continue to measure and monitor nutrient levels contributing to algae growth. As the City decides the future of growth and development, water supply will also be a topic of concern. Landscaping, road paving, and new development put stress on water resources. The supply of water is sufficient, but as population grows and land use patterns shift, it will be necessary to consider the added stress that new development will put on water demand and quality.
Air While air quality is not a problem for the City presently, good air quality is one of the community’s favorite aspects of living in Clearlake. This high standard of air quality should be maintained and the City should continue to provide air quality warnings during periods of wildfire to ensure that individuals avoid exposure to harmful particulate matter. As climate change regulations are developing within the state, the City will need to consider performing a greenhouse gas emissions inventory and adopting a greenhouse gas emissions reduction target. This will place the city on par with state efforts to reduce greenhouse gas emissions and help mitigate the human impact on climate change.
Biological Resources The City is fortunate to have such an abundant source of biodiversity within its city limits and nearby surrounding areas. Being within close proximity to the Anderson Marsh State Historical Park and McVicar Wildlife Sanctuary, the City should explore ways in which to complement these wildlife protection areas and increase public awareness of the surrounding ecosystem. Several community members mentioned the need for eco-tourism and environmental education centers which would act as a source of informational recreation for residents and visitors. Urban development can pose a threat to habitat and wildlife health. The City should work with local residents and business owners to address health issues affecting the community and to develop strategies to maintain a healthy ecosystem into the future.
Clearlake General Plan Background Report
Chapter 7- Conservation 177
D. REFERENCES Archibald & Wallberg Consultants. (2002). Clear Lake watershed sanitary survey: Update report. Retrieved from http://www.cityoflakeport.com/docs/Watershed-Survey-2002-727200643803PM.pdf California Air Resources Board. (2009). California ambient air quality standards. Retrieved from http://www.arb.ca.gov/research/aaqs/aaqs2.pdf California Air Resources Board. (2008). 2008 Estimated annual average emissions: Lake County Air Basin. Almanac Emission Projection Data. Retrieved from http://www.arb.ca.gov/app/emsinv//emseic1_query.php?F_DIV=-4&F_YR=2008&F_AREA=AB&F_AB=LC&F_SEASON=A&SP=2009&F_DD=Y California Air Resources Board. (2011). 2011 State area designations. Retrieved from http://www.arb.ca.gov/desig/adm/adm.htm California Department of Fish and Game (2010). Fish and Game Code in the California Public Resources Code. Retrieved from http://www.leginfo.ca.gov/cgibin/calawquery?codesection=fgc&codebody=&hits=20 California Department of Fish and Game. California Endangered Species Act. Retrieved from http://www.dfg.ca.gov/habcon/cesa/ California Department of Fish and Game. (2010). CNNDB Quick Viewer Retrieved from http://imaps.dfg.ca.gov/viewers/cnddb_quickviewer/app.asp California Department of Parks and Recreation. (2012). Anderson Marsh State Historic Park. http://www.parks.ca.gov/?page_id=483 California Department of Toxic Substances Control. (2010). Retrieved from http://www.dtsc.ca.gov/ California Department of Water Resources. (2009). California water plan update 2009. Retrieved from http://www.waterplan.water.ca.gov/docs/cwpu2009/0310final/v1_all_cwp2009.pdf Calpine Corporation. (2012). The Geysers. Retrieved from www.geysers.com Center for Biological Diversity. (2012). Petition to List the Clear Lake Hitch As Endangered or Threatened Under the Endangered Species Act. Retrieved from http://www.fgc.ca.gov/regulations/2012/Clear%20Lake%20hitch%20state%20petition%209-25-12.pdf Lake County. (2010). Regional blueprint plan. Lake County Air Quality Management District. (2012). Air pollution laws. Retrieved from http://www.lcaqmd.net/
Clearlake General Plan Background Report
Chapter 7- Conservation 178
Lake County Board of Supervisors. (2011). Ordinance No. 2936. Article IX, water vessel inspection program. Retrieved from http://www.nomussels.com/Assets/WaterResources/Mussels/Documents/Ordinance+2936.pdf Lake County Clean Water Program. (2004). Storm water management plan: Fiscal years 2003-2004 through 2007-2008. Retrieved from http://www.co.lake.ca.us/Assets/CDD/Stormwater+Mgt/Clean+Water+PDFs/Stormwater+Management+Plan.pdf Lake County Department of Public Works. (2010). Clear Lake integrated watershed management plan. Retrieved from ftp://ftp.co.lake.ca.us/Clear%20Lake%20WS%20Management%20Plan/ Lake County Department of Water Resources. (2004). Clear Lake integrated aquatic plant management plan. Retrieved from http://www.co.lake.ca.us/Assets/WaterResources/Aquatic+Plant+Management+Areas/Aquatic+Plant+Management+Plan.pdf Lake County Department of Water Resources. (2012). Quick guide to aquatic plant management permits. Retrieved from http://www.co.lake.ca.us/Government/Directory/Water_Resources/Aquatic_Plant_Management.htm Lake County Watershed Protection District. (2009). Clear Lake watershed TMDL monitoring program: Final report. Retrieved from http://www.co.lake.ca.us/Assets/WaterResources/Algae/Clear+Lake+Watershed+TMDL+Monitoring+Program.pdf Lake County Watershed Protection District. (2006). Lake County groundwater management plan. Retrieved from http://www.co.lake.ca.us/Assets/WaterResources/IRWMP/GWMP+Cover+TOC+Intro.pdf Lake County Watershed Protection District. (2006). Lake County water demand forecast. Retrieved from http://www.co.lake.ca.us/Assets/WaterResources/IRWMP/Demand+Forecast.pdf Lake County Watershed Protection District. (2006). Lake County water inventory and analysis. Retrieved from http://www.co.lake.ca.us/Assets/WaterResources/IRWMP/I$!26A+Cover+TOC+Intro.pdf Lake County Watershed Protection District. (2008). Monitoring and implementation plan: Clear Lake mercury and nutrient TMDL’s. Retrieved from http://www.co.lake.ca.us/Assets/WaterResources/Algae/Clear+Lake+TMDL+Monitoring+and+Implementation+Plan.pdf O’Haire, K. (2010). Overview of Clean Water Act and Porter-Cologne Water Control Act. State Water Resources Control Board presentation. Retrieved from http://www.co.lake.ca.us/Assets/CDD/Stormwater+Mgt/Clean+Water+PDFs/WaterLaw.pdf

Clearlake General Plan Background Report
Chapter 7- Conservation 179
Redbud Audubon Society of Lake County California. (2012). Retrieved from http://www.redbudaudubon.org/ Richerson, P.J., Suchanek, T.H., & Why, S.J. (1994). The causes and control of algal blooms in Clear Lake: Clean lakes diagnostic/feasibility study for Clear Lake, California. University of California, Davis Division of Environmental Studies. Retrieved from http://www.co.lake.ca.us/Assets/WaterResources/Algae/Clean+Lakes+Report$!2c+1994.pdf Smithsonian Institute. (2004). Clear Lake. Global Volcanism Program. Retrieved from http://www.volcano.si.edu/world/volcano.cfm?vnum=1203-10- Soil Survey Staff. (n.d.) Natural resources conservation service: Web soil survey.United States Department of Agriculture. Retrieved from http://websoilsurvey.nrcs.usda.gov/ State of California Department of Conservation. (2007) State Mining and Geology Board. Retrieved from http://www.conservation.ca.gov/SMGB/Pages/Index.aspx State of California Department of Conservation. (2007). Surface Mining and Reclamation Act of 1975. Retrieved from http://www.conservation.ca.gov/omr/smara/Pages/index.aspx United States Department of Agriculture. Soil Conservation Service. (1989). Soil survey of Lake County, California. Retrieved from http://soildatamart.nrcs.usda.gov/manuscripts/CA033/0/lake.pdf United States Department of Agriculture Natural Resources Conservation Service. (1996) Soil quality resource concerns: Soil erosion. Retrieved from http://soils.usda.gov/sqi/publications/files/sq_two_1.pdf United States Department of Agriculture, Natural Resources Conservation Service. http://websoilsurvey.nrcs.usda.gov/app/WebSoilSurvey.aspx United States Environmental Protection Agency. (2012). National ambient air quality standards. Retrieved from http://www.epa.gov/air/criteria.html United States Environmental Protection Agency. (2012). Summary of the Resource Conservation and Recovery Act of 1976. Retrieved from http://www.epa.gov/lawsregs/laws/rcra.html United States Environmental Protection Agency. (2012). Sulfur Bank Mercury Mine. Pacific Southwest, Region 9: Superfund. Retrieved from http://yosemite.epa.gov/r9/sfund/r9sfdocw.nsf/3dec8ba3252368428825742600743733/08592ed1469e8bd188257007005e9469!OpenDocument United States Fish and Wildlife Service. Endangered Species Act of 1973. Digest of Federal Resource Laws of Interest to the U.S. Fish and Wildlife Service. Retrieved from http://www.fws.gov/laws/lawsdigest/esact.html
Clearlake General Plan Background Report
Chapter 7- Conservation 180
United States Fish and Wildlife Service. Migratory Bird Treaty Act of 1918. Digest of Federal Resource Laws of Interest. Retrieved from http://www.fws.gov/laws/lawsdigest/migtrea.htmlt to the U.S. Fish and Wildlife Service. United States Geological Survey. (2012) http://www.usgs.gov/