
6/26/2006David Gerstle1 Muon Cosmic Ray Flux Study David Gerstle LArTPC – Yale University...
27
6/26/2006 David Gerstle 1 Muon Cosmic Ray Flux Study David Gerstle LArTPC – Yale University Undergraduate
-
Upload
irma-houston -
Category
Documents
-
view
215 -
download
0
Transcript of 6/26/2006David Gerstle1 Muon Cosmic Ray Flux Study David Gerstle LArTPC – Yale University...

6/26/2006 David Gerstle 1
Muon Cosmic Ray Flux Study
David Gerstle
LArTPC – Yale University Undergraduate

6/26/2006 David Gerstle 2
Contents• CAPRICE 94 & 97 data and calculations
– Includes comparison of data to other trials and– an attempt at correcting for atmospheric depth
differences• Muon track length in LAr and calculations
related to CAPRICE 94 & 97 data.• The above applied to the Soudan, MN
atmospheric depth and (sort of) geomagnetic cutoff
• Conclusions• Other plots

6/26/2006 David Gerstle 3
What are the data?• Data are taken from Kremer et al., "Measurements of Ground-Level Muons at
Two Geomagnetic Locations," PRL 1999, Vol 83, No. 21, pp. 4241• CAPRICE is a spectrometer including:
– A ring imaging Cherenkov (RICH) detector– A time-of-flight system– A superconducting magnet spectrometer – A 7 rad length silicon-tungsten imaging calorimeter.
• Data were taken twice [“Data” tab of Cosmic Rays.xls; see DocDb]:– CAPRICE94: In 1994 at Lynn Lake, Manitoba, Canada (56.5° N, 101.0° W), 360m
altitude, a vertical geomagnetic cutoff of 0.5GeV, and atmospheric depth of 1000 g/cm^2.
– CAPRICE97: In 1997 at Fort Summer, New Mexico (34.4 ° N, 104.1° W), 1270m altitude, a cutoff of 4.2GeV, and depth of 886 g/cm^2.
• The data are given as dN/dp (including uncertainty) as a function of momentum. Data are provided in bins of varying width. A mean momentum for each bin is provided.– mu_+ and mu_- data are provided for each study.– The 97 mu_+ 1.6-2.1 GeV/c point was added by linear interpolation.

6/26/2006 David Gerstle 4
What did I do with them?• I copied them into Excel and then reorganized
them so they were graphable [“Multiplied Out”], etc. (no longer w/ scaling factors).
• Using a rectangular method over each bin I calculated the integral of (dN/dp)*dp [“Integral”], giving us N.– This is the ‘best’ method as data were collected and
provided in bins of varying width.• I plotted dN/dp as a function of p and N (from the
integral) as a function of p on the same plot for each data set AND summed the mu_+/mu_- data for each dataset into one plot.

6/26/2006 David Gerstle 5
CAPRICE94 mu_+
0.001
0.01
0.1
1
10
100
0.1 1 10 100 1000
p; GeV/c
dN
/dp
; (G
eV
/c m
^2
sr
s)^
-1
0
5
10
15
20
25
30
35
40
45
50
N (
as
inte
gra
l fro
m ~
0 t
o p
) (m
^2
sr
s)^
-1
[“95 mu_+”]
Integral curve is value from 0 GeV/c to plotted p
Blue is differential flux (left logarithmic y-axis)
Pink is integral flux from 0 GeV/c to p (right linear y-axis)

6/26/2006 David Gerstle 6
CAPRICE94 mu_-
0.001
0.01
0.1
1
10
100
0.1 1 10 100 1000
p; GeV/c
dN
/dp
; (G
eV
/c m
^2
sr
s)^
-1
0
5
10
15
20
25
30
35
40
45
50
N (
as
inte
gra
l fro
m ~
0 t
o p
) (m
^2
sr
s)^
-1
More mu_+ than mu_-
[“94 mu_-”]
Blue is differential flux
Pink is integral flux from 0 GeV/c to p

6/26/2006 David Gerstle 7
CAPRICE97 mu_+
0.001
0.01
0.1
1
10
100
0.1 1 10 100 1000
p; GeV/c
dN
/dp
; (G
eV
/c m
^2
sr
s)^
-1
0
6
12
18
24
30
36
42
48
54
60
N (
as
inte
gra
l fro
m ~
0 t
o p
) (m
^2
sr
s)^
-1
[“97 mu_+”]
Blue is differential flux
Pink is integral flux from 0 GeV/c to p
These are 97 data…
6/26/2006 David Gerstle 8
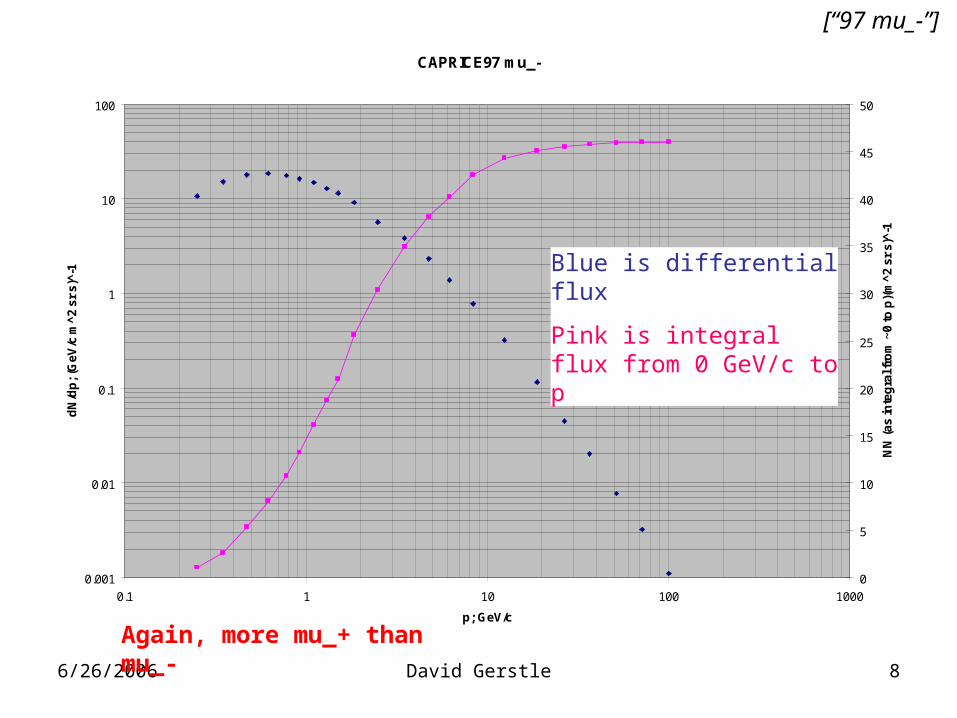
CAPRICE97 mu_-
0.001
0.01
0.1
1
10
100
0.1 1 10 100 1000
p; GeV/c
dN
/dp
; (G
eV
/c m
^2
sr
s)^
-1
0
5
10
15
20
25
30
35
40
45
50
NN
(a
s in
teg
ral f
rom
~0
to
p)(
m^
2 s
r s
)^-1
[“97 mu_-”]
Blue is differential flux
Pink is integral flux from 0 GeV/c to p
Again, more mu_+ than mu_-

6/26/2006 David Gerstle 9
CAPRICE 94&97 all data
0.001
0.01
0.1
1
10
100
0.1 1 10 100 1000
p; GeV/c
dN
/dp
; (G
eV/c
m^2
sr
s)^-
1
0
22
44
66
88
110
N (
as in
teg
ral f
rom
~0
to p
) (m
^2 s
r s)
^-1
94 data
97 data
94 integral
97 integral
Summing mu_+ and mu_- data, 97 appear higher than 94
[“94&97”]
6/26/2006 David Gerstle 10
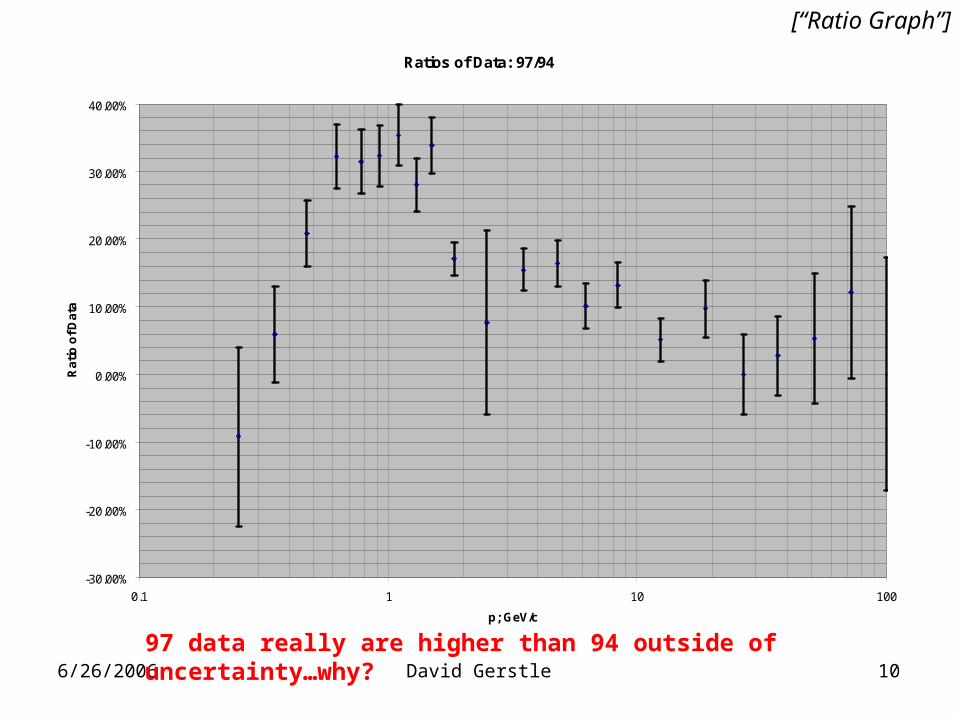
Ratios of Data: 97/94
-30.00%
-20.00%
-10.00%
0.00%
10.00%
20.00%
30.00%
40.00%
0.1 1 10 100
p; GeV/c
Ra
tio
of
Da
ta
97 data really are higher than 94 outside of uncertainty…why?
[“Ratio Graph”]
6/26/2006 David Gerstle 11
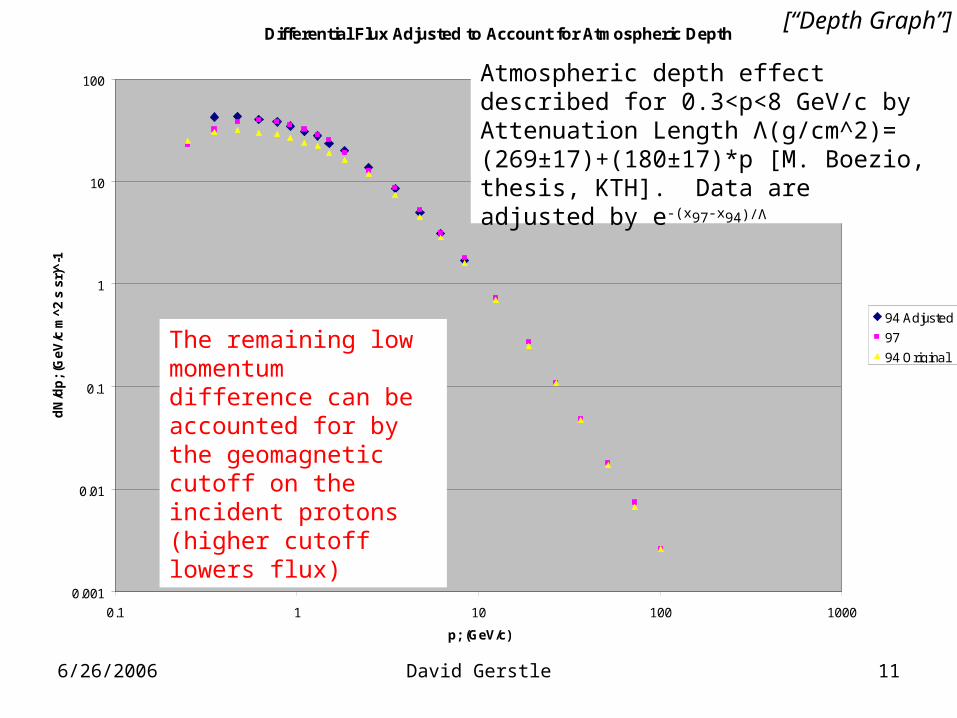
Differential Flux Adjusted to Account for Atmospheric Depth
0.001
0.01
0.1
1
10
100
0.1 1 10 100 1000
p; (GeV/c)
dN
/dp
; (G
eV
/c m
^2
s s
r)^
-1
94 Adjusted
97
94 Original
Atmospheric depth effect described for 0.3<p<8 GeV/c by Attenuation Length Λ(g/cm^2)= (269±17)+(180±17)*p [M. Boezio, thesis, KTH]. Data are adjusted by e-(x97-x94)/Λ
The remaining low momentum difference can be accounted for by the geomagnetic cutoff on the incident protons (higher cutoff lowers flux)
[“Depth Graph”]

6/26/2006 David Gerstle 12
Data do match other studies
CAPRICE94&97 data compaired with PDG data
0.001
0.01
0.1
1 10 100 1000
p (GeV/c)
p^
2.7
dN
/dp
(c
m^
2 s
sr)
^-1
(Ge
V/c
)^1
.7
Blue is 94 differential flux
Pink is 97 differential flux
Yellow is from PDG cosmics plot

6/26/2006 David Gerstle 13
What are the track lengths in LAr?
• From “Atomic Nuclear Properties: Table 289: Muons in liquid argon” [“Track Length”]– Given as a density dependent -dE/dx (MeV cm^2/g) at various
energy/momentum values; converted into pure dE/dx.– Integrated (-dx/dE)*dE by a trapezoidal approximation to find the
distance traveled between energy points given by the chart.– Summed these to find the integral (-dx/dE)*dE from 0 GeV to a
given GeV (which is easily converted to p rather than E).• Put these data into the momentum bins of the CAPRICE
data.– Interpolated data for CAPRICE momentum bins without Table
289 data by a least-squares quadratic approximation (w/ four points) in relation to Table 289 data already in CAPRICE bins.
– Interpolated one point linearly from the Table 289 data.– The curve looks smooth (so I think I interpolated correctly):

6/26/2006 David Gerstle 14
Mean Track Length Over Bin (m)
0
10
20
30
40
50
60
0.1 1 10 100
p; (GeV/c)
Len
gth
; (m
)
•End plateau accounts for finite detector size
•Some data are interpolated, and it is good that you cannot tell which
[“Length”]

6/26/2006 David Gerstle 15
•Length at each momentum is multiplied by the differential flux; pink is 97, blue is 94.
•Yellow and Teal are the areas under the blue and pink curves (rectangular over each bin) from zero to p.
[“Length and Flux”]
Product of Differential Flux and Length AND Total Length through an Area, both as a function of Momentum
0
20
40
60
80
100
120
140
160
180
0.1 1 10 100
p; (GeV/c)
(dN
*x(p
))/d
p;
(GeV
/c m
s s
r)^-
1
0
200
400
600
800
1000
1200
1400
1600
N*x
(p)
fro
m z
ero
to
p;
(m s
sr)
^-1
94 (dN*x(p))/dp
97 (dN*x(p))/dp
94 N*x(p) from zero to p
97 N*x(p) from zero to p
Bumps must be results of flux data

6/26/2006 David Gerstle 16
What is the Bottom Line?
• By averaging the values from the data sets [“BOTTOM LINE”] :– The choice of 4 sig figs is arbitrary– Total N = 93.77 (m^2 s sr)^-1– Total N*x(p) = 1267.5 m*(m s sr)^-1– Average x = 13.54 m*(m^2 s sr)^-1
• Photons next…

6/26/2006 David Gerstle 17
Atmospheric Depth and Geomagnetic Cutoff Corrections
• Atmospheric depth of Soudan, MN was interpolated by a linear fit of atmospheric depth as a function of altitude between the CAPRICE 94&97 data.
• Calculations are in “Soudan.xls”• Atmospheric Depth was corrected for as outlined in M.
Boezio, thesis, KTH– Attenuation Length Λ(g/cm^2)= (269±17)+(180±17)*p– Data are adjusted by e-(xSoudan-x94)/Λ and e-(xSoudan-x97)/Λ
• Geomagnetic cutoff corrected for by a simple average between the two sets of corrected CAPRICE data.– The latitude of Soudan (47.8°) is nearly halfway between the
CAPRICE latitudes (56.5° and 34.3°).– There is a direct correlation between latitude and
geomagnetic cutoff, but I do not know exactly what it is. Read: this is a very crude correction.

6/26/2006 David Gerstle 18
CAPRICE differential flux adjusted to Soudan Atmospheric Depth
1
10
100
0.1 1 10
p; (GeV/c)
dN
/dp
; (G
eV
/c m
^2
s s
r)^
-1
Blue is 94 to Soudan
Pink is 97 to Soudan
Yellow is 94
Black is 97
Looks like a good correction; there is some discrepancy below .5 GeV/c, but this is likely because of the different geomagnetic cutoffs of 94&97

6/26/2006 David Gerstle 19
Soudan Differential and Integral Flux as a function of Momentum
0.001
0.01
0.1
1
10
100
0.1 1 10 100 1000
p; (GeV/c)
dN
/dp
; (G
eV
/c m
^2
s s
r)^
-1
0
10
20
30
40
50
60
70
80
90
100
N f
rom
0 t
o p
; (m
^2
s s
r)^
-1
Looks like a nice curve; probably a good correction.
Note that integral flux is from 0 to p and is on the right-hand linear y-axis
Blue is differential flux
Pink is integral flux

6/26/2006 David Gerstle 20
Mean Track Length Over Bin (m)
0
10
20
30
40
50
60
0.1 1 10 100
p; (GeV/c)
Len
gth
; (m
)
Please recall this track length (referred to as x(p)) calculation as I apply it to Soudan…

6/26/2006 David Gerstle 21
(dN*x(p))/dp and N*x(p) as a function of p
0
20
40
60
80
100
120
140
0.1 1 10 100 1000
p; (GeV/c)
(dN
*x(p
))/d
p;
(Ge
V/c
m s
sr)
^-1
0
200
400
600
800
1000
1200
1400
N*x
(p);
(m
s s
r)^
-1
Blue is differential
Pink is integral
6/26/2006 David Gerstle 22
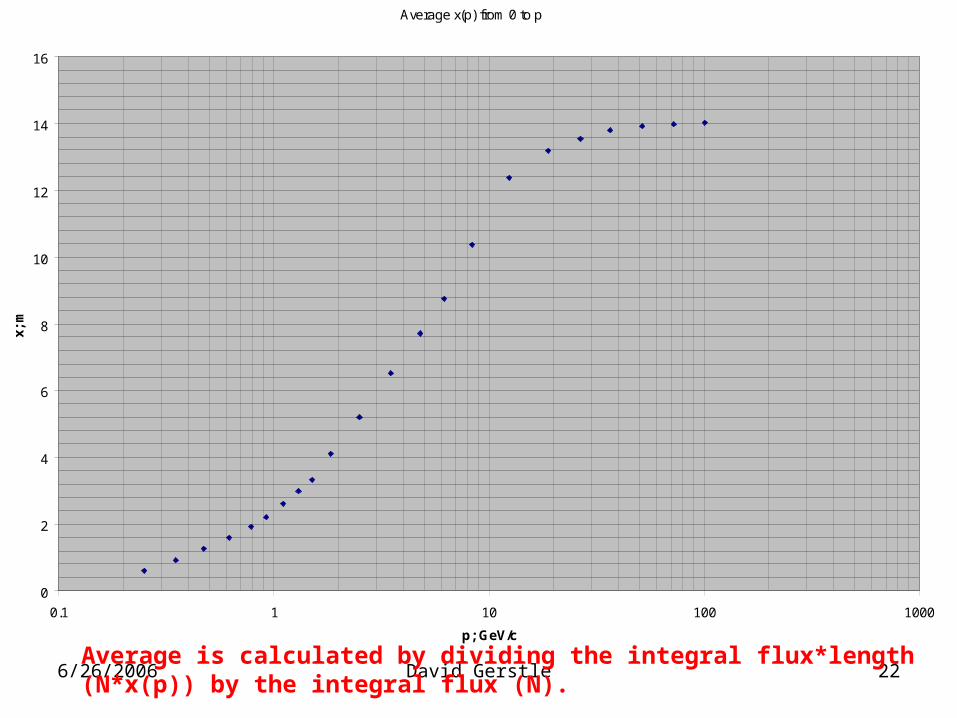
Average x(p) from 0 to p
0
2
4
6
8
10
12
14
16
0.1 1 10 100 1000
p; GeV/c
x;
m
Average is calculated by dividing the integral flux*length (N*x(p)) by the integral flux (N).

6/26/2006 David Gerstle 23
Soudan (sort of) BOTTOM LINE
• Integral (dN/dp)*dp = N from 0.2 GeV/c to 120 GeV/c = 86.92 (m^2 s sr)^-1
• Integral ((dN*x(p))/dp)*dp = N*x(p) from 0.2 GeV/c to 120 GeV/c = 1218.62 (m s sr)^-1
• N*x(p)/N = average x(p) = 14.02 m.• It would be good to find out the exact
atmospheric depth and geomagnetic cutoff.

6/26/2006 David Gerstle 24

6/26/2006 David Gerstle 25
Other plots:

6/26/2006 David Gerstle 26
CAPRICE94 Combined
0.001
0.01
0.1
1
10
100
0.1 1 10 100 1000
p; GeV/c
dN
/dp
; (G
eV
/c m
^2
sr
s)^
-1
0
5
10
15
20
25
30
35
40
45
50
55
60
65
70
75
80
85
90
95
100
N (
as
inte
gra
l fro
m ~
0 t
o p
)(m
^2
sr
s)^
-1
[“94”]

6/26/2006 David Gerstle 27
CAPRICE97 Combined
0.001
0.01
0.1
1
10
100
0.1 1 10 100 1000
p; GeV/c
dN
/dp
; (G
eV
/c m
^2
sr
s)^
-1
0
10
20
30
40
50
60
70
80
90
100
110
120
130
140
150
N (
as
inte
gra
l fro
m ~
0 t
o p
) (m
^2
sr
s)^
-1
[“97”]


![]978002]25-26]...H. Gerstle, "EBCAP: A ComputerProgram to Analyze Rotor Fragment Gerstle, "EBCAP: A ComputerProgram to Analyze Rotor Fragment Impact on Plate/Shell ContainmentShields,"](https://static.fdocuments.us/doc/165x107/610cf66f633ff43bff0d891e/97800225-26-h-gerstle-ebcap-a-computerprogram-to-analyze-rotor-fragment.jpg)

