
620Project_Report ThisSimpleUML
32
2015 ThisSimpleUML.com FINAL PROJECT REPORT MIS 620 (FALL 2015) RAM ADITHYA CIMSEE MAMTANI CHRISTOPHER NEVILLE YUXIANG QU SUSHMA HANUMANTHE GOWDA
-
Upload
chris-neville -
Category
Documents
-
view
111 -
download
0
Transcript of 620Project_Report ThisSimpleUML
2015
ThisSimpleUML.com
Final project report MIS 620 (fall 2015)
RAM ADITHYACIMSEE MAMTANICHRISTOPHER NEVILLEYUXIANG QUSUSHMA HANUMANTHE GOWDA

Table of Contents
Introduction.................................................................................................................................................................2
Project Description......................................................................................................................................................3
Project formula of success..........................................................................................................................................4
Functional Diagrams...................................................................................................................................................5
Structural Model.......................................................................................................................................................10
Behavioral Models....................................................................................................................................................13
Database....................................................................................................................................................................18
ER Diagram of WordPress Database........................................................................................................................20
ER Diagram Continued.............................................................................................................................................21
User Interface (UI) & Design Strategy.....................................................................................................................22
Future Scope.............................................................................................................................................................23
References.................................................................................................................................................................24
1

Introduction
ThisSimpleUML is a website created by us with the objective to make learning concepts of UML, an
easy and simple task. It is a platform where students can register and learn UML language.
The website provides the following functionalities to the student.
They have the option to either go through all the chapters sequential or just select the chapter they are
interested in. Our website provides students with detailed knowledge about what UML language is and
how to go about creating the different diagrams which are a part of UML language like the functional
and structural diagram. Along with learning we will also provide our students with an option to take quiz
based on each chapter to help them test their learning.
Also the website has a feedback page for the users to help us assess how we can improve the website
and serve better.
2
Project Description
A software project of any size whether from small to large is rarely built by a single person. Most often
many different people, with various skills work together to build a solution. It is very uncommon to have
the technology not being the most challenging part of the project, but rather it often lacks clear
communication between the project team members. The Unified Modelling Language (UML) helps the
team members to communicate clearly and precisely. The UML includes several diagrams and models
that support design of different aspects of the solution. If each member of the team is able to understand
those models that are useful to them they are more likely to overcome challenges and risks associated
with different aspects. During the course we understood the need for this clear communication. We
discussed several of the commonly used diagrams. UML is very large and there is much to be learnt and
done which is way beyond the scope of the course. But having the basic understanding provided in
ThisSimpleUML can reduce many of the challenges.
ThisSimpleUML is an online training platform for technical professionals and students alike who seek to
gain knowledge quickly. The course is provided 24x7. Traditional classroom courses have a retention
rate as low as 20% 30 days following the training. Online learning reverses the scale and increases
retention rates as much as 40 to 60% in the same time period leaving the student with a retention rate of
60 to 80%. This mini-course introduces the data-modeling component of UML, and describes different
UML diagrams, helps in learning them at a fast pace. ThisSimpleUML differentiates itself from other
online learning providers by offering content which is understandable by laymen with a simple example
throughout the course to avoid confusion. We have created 8 chapters that are arranged in a logical
manner to learn different aspects of UML diagrams and at the end of each chapter, a quiz consisting of
10 to 15 questions. The course duration is self-paced and there is no course price.
By the end of the course, the student will be able to learn the below mentioned points
How to identify and design objects, classes, and their relationships to each other
Use links, associations, and inheritance
Use diagram notation for use cases, class and object representation, links and associations, and
object messages
Gain a working knowledge UML 2.0
3

Apply knowledge of OOAD to design an object-oriented system which can be implemented in an
object-oriented language
Project formula of success
ThisSimpleUML is an excellent resource for everyone at the click of a mouse. The course platform
offers knowledge to anyone with an internet connection, the opportunity to learn. Knowledge provides
the foundation to create the future. And, when you spark the creative process you light the idea that
might change the world.
4
Functional Diagrams
The functional or the external view describes the behavior of the system from the perspective of the
user. It is a means to understand and document the requirements of the systems
USE CASE DIAGRAM
A Use case is a formal way of representing the way a business system interacts with its environment. Hence, it
represents in a very simple way the main functions of the system and the different kinds of users that will interact
with it.
Pre Use Case Diagram
5
Post Use Case Diagram
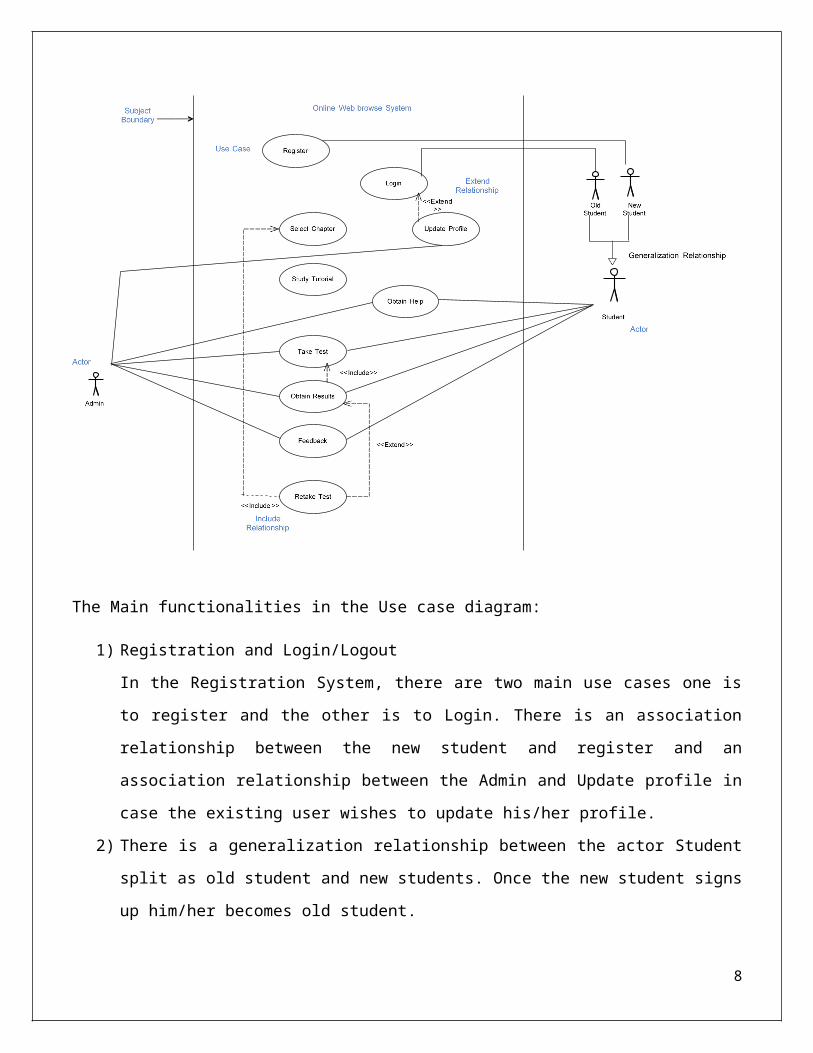
The Main functionalities in the Use case diagram:
1) Registration and Login/Logout
In the Registration System, there are two main use cases one is to register and the other is to
Login. There is an association relationship between the new student and register and an
association relationship between the Admin and Update profile in case the existing user wishes
to update his/her profile.
2) There is a generalization relationship between the actor Student split as old student and new
students. Once the new student signs up him/her becomes old student.
3) In this diagram there are 7 main use cases, Select Chapter, Study Tutorial, Obtain help, Take test,
Obtain results, feedback, retake test.
6
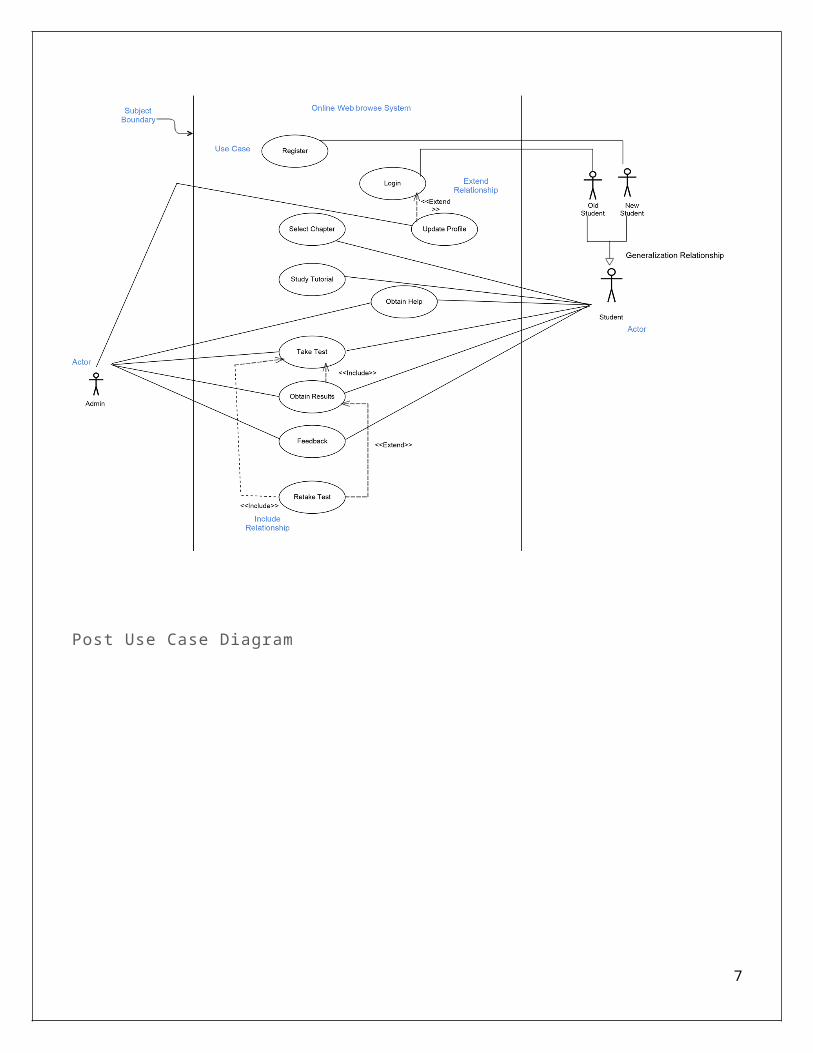
The Student can select the chapter he/she wants to study, take help from the admin in case of any
doubts, Take the test, obtain results and provide the website with feedback. If the student is not
satisfied with the score they can even retake the test.
4) The diagram has a few Extend and Include relationship as well.
Extend relationship:
The Login use case has a extend relationship with the Update profile use case, which
states if the students wants he/she can update its profile info and the Admin will help in
doing so.
Extend relationship between retake test and obtain results. It is the students wish to take
the test again after obtaining their results.
Include Relationship:
One is between take test and obtain results, To get a score the student first needs to the
take the quiz.
The other between Select chapter and retake test, this means if the student wants to retake
the test they need to go back and select the chapter for which they want to retake the test.
The Difference between our PRE Use case diagram and POST Use diagram is
Earlier when the use case diagram was created if the student wanted to retake the test they were
just required to go back to the take test option in the website. But once the website was actually
setup the functionality changed and now the user needs to first select the chapter and then only
they can retake the test.
7
ACTIVITY DIAGRAMActivity diagrams are developed from the use cases. They are used to model the business processes or
how a business operates. It models behavior independent of objects.
Pre Activity Diagram Post Activity Diagram
The Main functionalities in the Activity diagram:
1) The activity diagram begins with a decision node, depending on the student whether he/she is a new
student or old student. New students decide to register and old students decide to login, Post which the
nodes merge.
2) The main use case in the diagram being Select chapter, study tutorial, take test, obtain results and
feedback.
3) Once the students have given the test they have the option to retake the test. Here the decision node
comes into the picture again. Depending on the score the student can decide whether to retake the test or
not.
If the score is good and student is satisfied the process moves to the next use case Feedback.
8

In case the student is not satisfied the student chooses to retake the test, where in he/she gives the test
again post which the process comes to an end.
The Difference between our Pre and Post Activity Diagram is
Earlier it was decided the Student wants to retake the test, then they only have to go back to the
take test use case. But when the website was built the process got changed and now if the student
wants to retake the test they have to first select the chapter and then only they can take the test
again.
9

Structural Model
Structural models describe the underlying data structure of an object-oriented system. Whereas use-case
models provide an external functional view of the evolving system (i.e., what the system does),
structural models provide an internal static view of the evolving system (i.e., how the objects are
organized in the system). At this point in the development of the system, the structural model represents
only a logical model of the underlying problem domain. One of the primary purposes of the structural
model is to create a vocabulary that allows the users and developers to communicate effectively about
the problem under investigation. Structural models comprise classes, attributes, operations, and
relationships. There are three basic types of relationships that normally are depicted on structural
models: aggregation, generalization, and association.
CRC Cards
CRC cards model the classes, their responsibilities, and their collaborations. There are two different
types of responsibilities: knowing and doing. Knowing responsibilities are associated mostly with
attributes of instances of the class, whereas doing responsibilities is associated mostly with operations of
instances of the class.
Collaborations support the concepts of clients, servers, and contracts between objects. CRC cards
capture all the essential elements of the instances of a class. The front of the card allows the recording of
the class’s name, ID, type, description, list of associated use cases, responsibilities, and collaborators,
whereas the back of the card contains the attributes and relationships.
10

CRC Card
Class diagrams
A class diagram is a graphical description of the information contained on the CRC cards. It shows the
classes and the relationships between the classes. The class diagram portrays additional information, not
included on the CRC cards: the visibility of the attributes and operations and the multiplicity of the
relationships. Also, there are times that a relationship itself contains information. In this case, an
associated class is created. There are special arcs for each of the relationships (aggregation,
generalization, and association) contained in the diagram.
In real-world systems that can have over 100 classes, the class diagram can become overly complicated.
To allow for the simplification of the diagram, a view mechanism can be used. A view restricts the
amount of information portrayed on the diagram. Some useful views are: hiding all information about
the class except for its name and relationships; showing only the classes that are associated with a
11
particular use case; and limiting the relationships included to only one specific type (aggregation,
generalization, and association).
Class Diagram
The Enter class has two attributes: user id, password and two operations: login, register.
The Admin class and the Student class are the subclass of the Participant class. The participant class has
several attributes such as last name, first name, address, phone and birthdate. The Admin class has an
attribute admin and three operations: update profile, evaluate test and feedback. The Student class has
three attributes: student id, chapter studied, test taken and two operations: select chapter, take test.
The Study Material class has one attribute: chapter name and one operation: assign chapter. The Test
class has two attributes: student id, test id and one operation: take test. The Evaluation class has two
attributes: score, test id and one operation: give result.
When a visitor comes to the UML study website, he can choose login in if he is an old user or register if
he is a new user. The admin will update the profile if someone registers a new account. Then the user
can select chapter and take test in the website. There are several chapters for users to choose such as
activity diagram, use case diagram and class diagram. To study the UML, the user has to read the study
materials at first then he can take the test. The tests are combined with multiple choice questions. When
the user finishes the test, the website will give him the score and the right answers of each question. The
user can choose give feedback or retake test according to his score.
12
Behavioral Models
Behavior models describe the internal dynamic aspects of an information system that supports the business
processes in the organization. There are two types of behavioral models. First, there are behavioral models used
to represent the underlying details of a business process portrayed by a use-case model. In UML, interaction
diagrams, both sequence and communication diagrams are used for this type of behavioral model. In this way, we
can easily see how actors and objects collaborate to provide the functionality defined in the use-case. Second,
Behavioral State Machines represent the changes that occur in the underlying data.
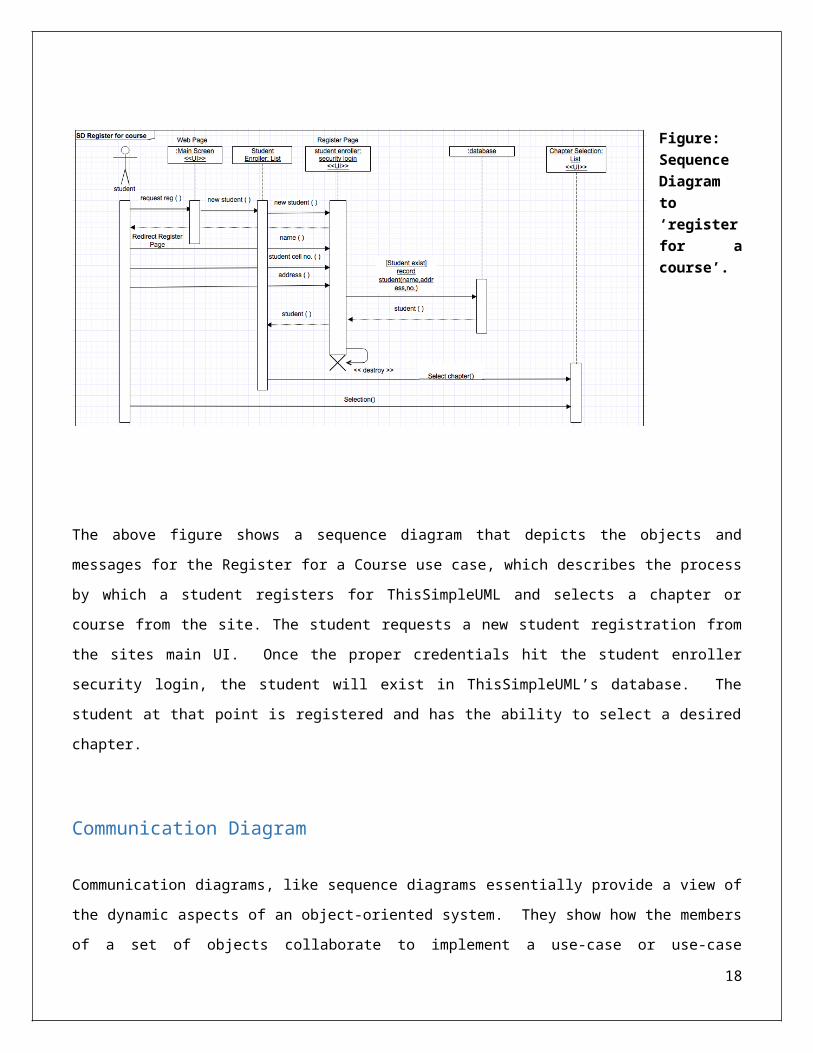
Sequence Diagram
Sequence diagrams are one of two types of interaction diagrams. They illustrate the objects that participate in a
use case and the messages that pass between them over time for one use case. A sequence diagram is a dynamic
model that shows the explicit sequence of messages that are passed between objects in a defined interaction.
Figure: Sequence Diagram to ‘register for a course’.
The above figure shows a sequence diagram that depicts the objects and messages for the Register for a Course
use case, which describes the process by which a student registers for ThisSimpleUML and selects a chapter or
course from the site. The student requests a new student registration from the sites main UI. Once the proper
credentials hit the student enroller security login, the student will exist in ThisSimpleUML’s database. The
student at that point is registered and has the ability to select a desired chapter.
13

Communication Diagram
Communication diagrams, like sequence diagrams essentially provide a view of the dynamic aspects of an object-
oriented system. They show how the members of a set of objects collaborate to implement a use-case or use-case
scenario. They can also be used to model all the interactions among a set of collaborating objects and emphasize
the flow of messages through a set of objects.
Communication Diagram to ‘register for a course’.
The above figure shows a communication diagram that depicts the objects and messages for the Register For a
Course use case. Notice that just like the prior sequence diagram, this communication diagram has the same actor
and objects. The process in the communication diagram above shows a student register for ThisSimpleUML
through the main UI, once enrolled properly the student is redirected and given the ability to select a chapter or
course from the site.
14

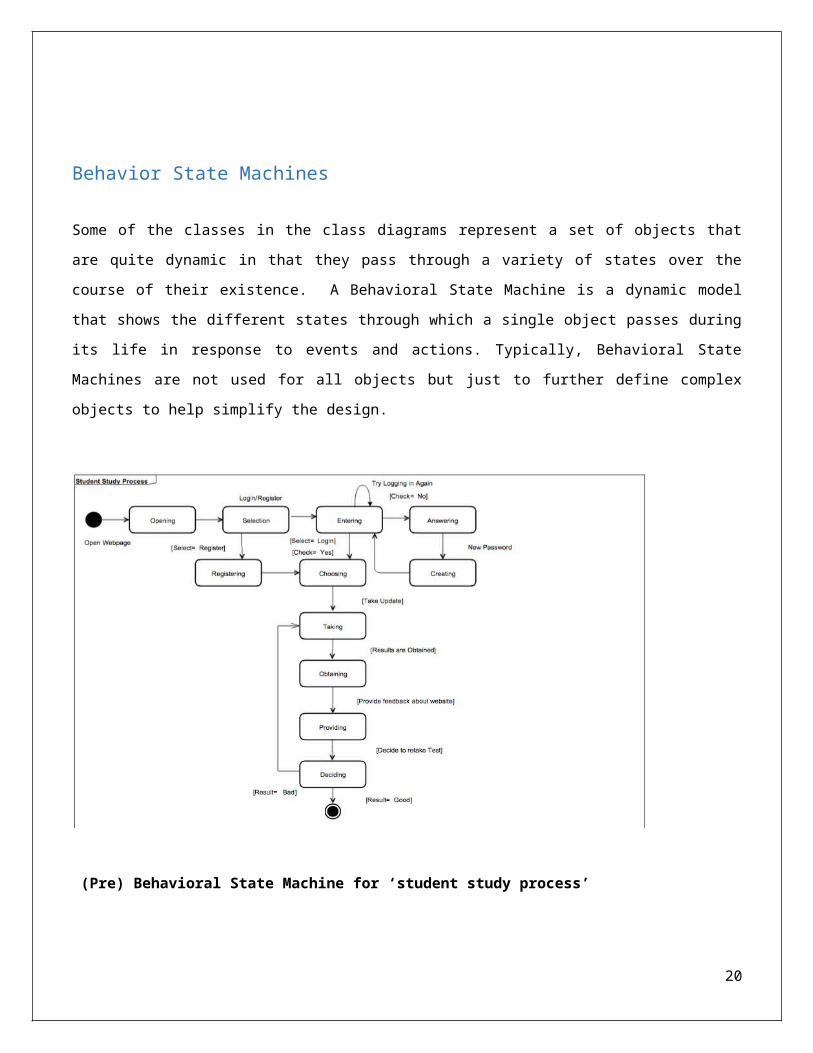
Behavior State Machines
Some of the classes in the class diagrams represent a set of objects that are quite dynamic in that they pass
through a variety of states over the course of their existence. A Behavioral State Machine is a dynamic model that
shows the different states through which a single object passes during its life in response to events and actions.
Typically, Behavioral State Machines are not used for all objects but just to further define complex objects to help
simplify the design.
(Pre) Behavioral State Machine for ‘student study process’
15

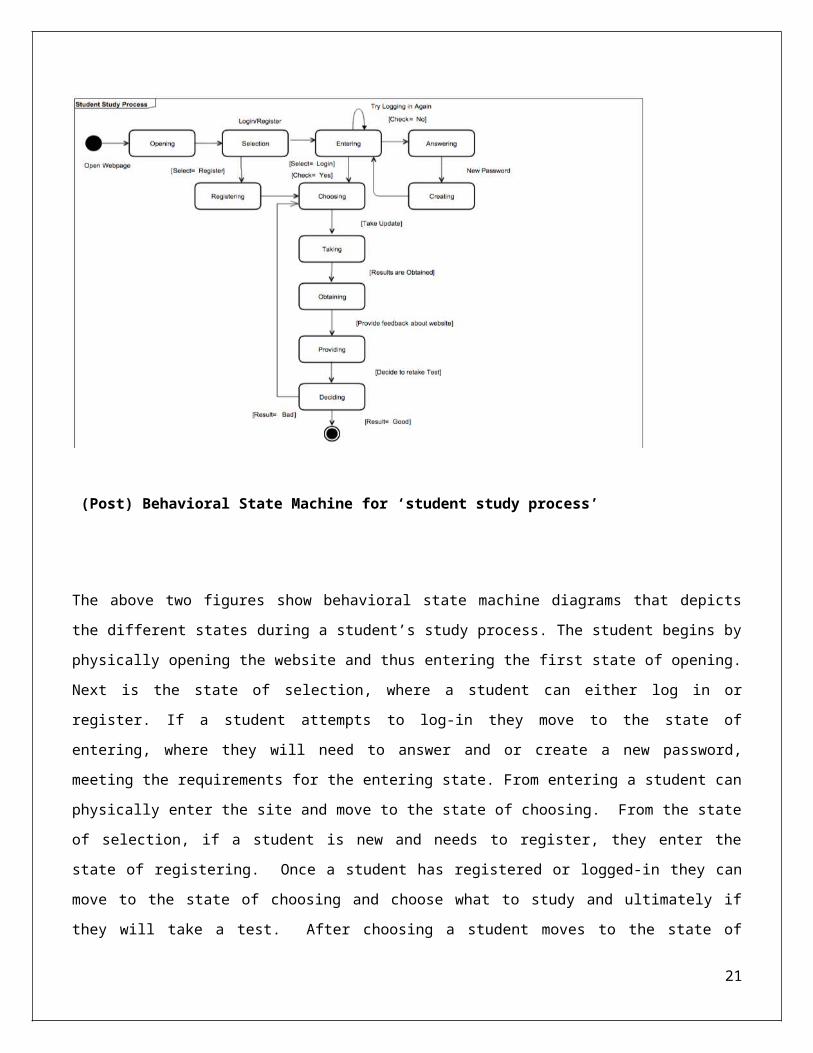
(Post) Behavioral State Machine for ‘student study process’
The above two figures show behavioral state machine diagrams that depicts the different states during a student’s
study process. The student begins by physically opening the website and thus entering the first state of opening.
Next is the state of selection, where a student can either log in or register. If a student attempts to log-in they
move to the state of entering, where they will need to answer and or create a new password, meeting the
requirements for the entering state. From entering a student can physically enter the site and move to the state of
choosing. From the state of selection, if a student is new and needs to register, they enter the state of registering.
Once a student has registered or logged-in they can move to the state of choosing and choose what to study and
ultimately if they will take a test. After choosing a student moves to the state of taking, where they can physically
take the latest course and exam. From the state of taking the student moves to obtaining where results are obtained
about the course exam they took. The next state is providing, where a student provides feedback about the
material and the website. The potential final state is deciding, where a student physically decides if the results
obtained are good or bad, if good the states have ended and if bad the student moves to the state of taking again,
where they may retake the exam. During ThisSimpleUMLs lifecycle one major aspect had changed in the
behavioral state machine, this can be observed in the Post diagram versus the Pre diagram. The major change is
that from the deciding state, if a student’s result is bad they may enter the state of choosing, not taking. In the Post
16

diagram, moving to the state of choosing allows the student to choose to review the course material again, instead
of just retaking the exam. This change should help students improve their knowledge of the course and earn a
better result on the exam when retaking it.
17
Database
Database in computing terms is software used to manage information in an organized fashion. We have used the
MySQL relational database management system (RDMS) for storing and retrieving the content of the site.
No integrity is enforced between the tables and everything is generated dynamically. This is why database
backups on a regular basis can be a lifesaver if something happens to your site
The diagram below provides a visual overview of the database and the relations between the tables created. The
Table Overview below includes additional details on the tables and columns.
Example:
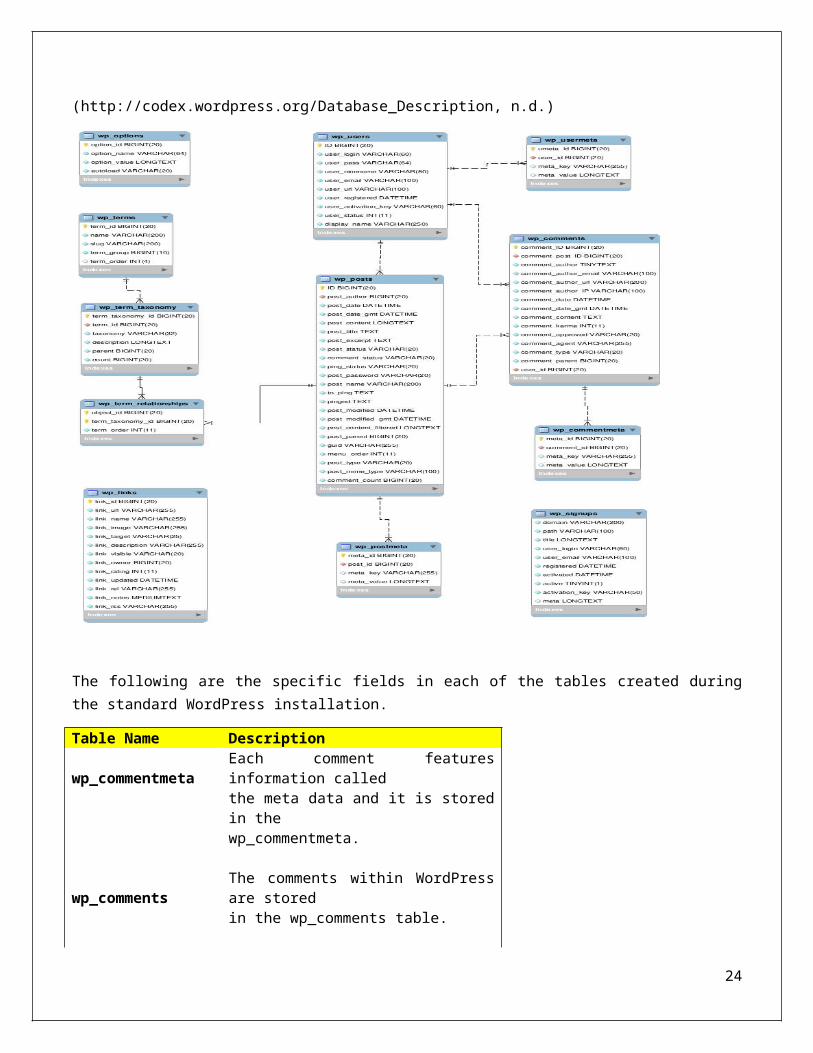
(http://codex.wordpress.org/Database_Description, n.d.)
The following are the specific fields in each of the tables created during the standard WordPress installation.
18
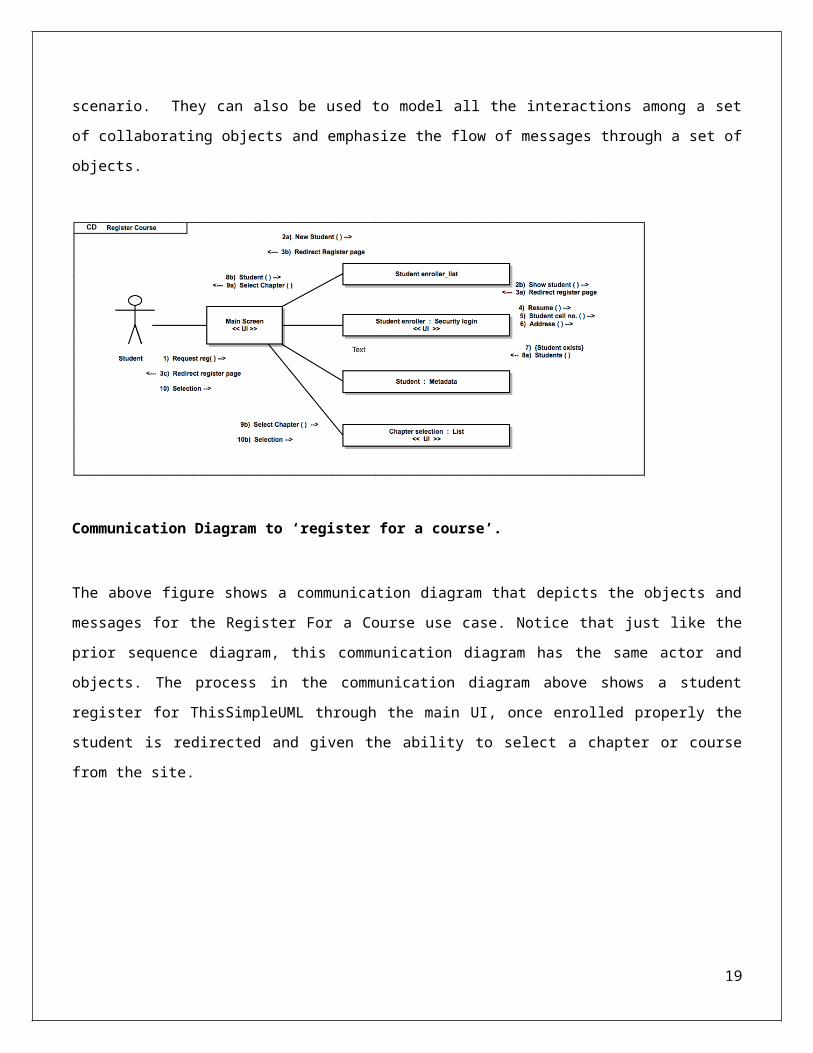
Table Name Descriptionwp_commentmeta Each comment features information called
the meta data and it is stored in thewp_commentmeta.
wp_comments The comments within WordPress are storedin the wp_comments table.
wp_links The wp_links holds information related tothe links entered into the Links feature of
wp_postmeta Each post features information called themeta data and it is stored in thewp_postmeta.
wp_posts The core of the WordPress data is theposts. It is stored in the wp_posts table.Also Pages and navigation menu items arestored in this table.
wp_terms The categories for both posts and links andthe tags for posts are found within thewp_terms table.
wp_term_relationships Posts are associated with categories and
tags from the wp_terms table and thisassociation is maintained in thewp_term_relationships table. Theassociation of links to their respectivecategories are also kept in this table.
wp_term_taxonomy This table describes the taxonomy(category, link, or tag) for the entries in thewp_terms table.
wp_usermeta Each user features information called themeta data and it is stored in wp_usermeta.
wp_users The list of users is maintained in tablewp_users
19
ER Diagram of WordPress Database
(http://creately.com/diagram/example/hnd2x0a91/ER%20Diagram%20for%20WordPress%20Tables, n.d.)
20
ER Diagram Continued
1. $wpdb->posts - basic posts, pages and other post types info;
2. $wpdb->postmeta - extra posts, pages and other post types info;
3. $wpdb->comments - basic comments info;
4. $wpdb->commentmeta - extra comments info;
5. $wpdb->links - links info;
6. $wpdb->users - basic user info;
7. $wpdb->usermeta - extra user info;
8. $wpdb->terms - categories and tags
9. $wpdb->term_relationships - relationship between posts and categories or tags;
10. $wpdb->term_taxonomy - relationship for categories or tags;
21
User Interface (UI) & Design Strategy
Our User Interface (UI) Design focuses on anticipating what users might need to do and ensuring that the
interface has elements that are easy to access, understand, and use to facilitate those actions.
We have ensured to consider the following when designing our interface:
Keep the Interface simple (Garrett’s)
We have avoided unnecessary elements and are clear in the language used on labels and in messaging.
Create consistency and use common UI elements (Garrett’s)
Ensure users feel more comfortable and are able to get things done more quickly. Once the user learns
how to perform something, they should be able to put use that skill to other parts of the site.
Be purposeful in page layout (Garrett’s)
Careful placement of items aid in effective scanning and readability.
Minimalistic use of color and texture (Garrett’s)
Direct attention to your advantage using minimal color, light, contrast, and texture.
Create hierarchy and clarity (Garrett’s)
Arrangement of labels to help increase scalability, legibility and readability.
22
Future Scope1. Instructional videos
2. A personalized learning dashboard
3. Provision of compiler/editor/IDE
4. Going beyond UML and add other programming and design courses.
23
References
Garrett’s, J. J. (n.d.). The Elements of User Experience: User-Centered Design for the Web and Beyond (2nd Edition).
http://codex.wordpress.org/Database_Description. (n.d.).
http://creately.com/diagram/example/hnd2x0a91/ER%20Diagram%20for%20WordPress%20Tables. (n.d.). Retrieved from http://creately.com/diagram/example/hnd2x0a91/ER%20Diagram%20for%20WordPress%20Tables.
24


