5 – ENERGYPRO MODEL - SmartReFlex · 5 – ENERGYPRO MODEL Presented by: Joana ... – There is...
46
Smart and flexible 100% renewable district heating and cooling systems for European cities 5 – ENERGYPRO MODEL Presented by: Joana Tarrés Font IREC 13 May 2015
-
Upload
nguyenkhuong -
Category
Documents
-
view
214 -
download
0
Transcript of 5 – ENERGYPRO MODEL - SmartReFlex · 5 – ENERGYPRO MODEL Presented by: Joana ... – There is...

Smart and flexible 100% renewable district heatingand cooling systems for European cities
5 – ENERGYPRO MODEL
Presented by:
Joana Tarrés FontIREC
13 May 2015
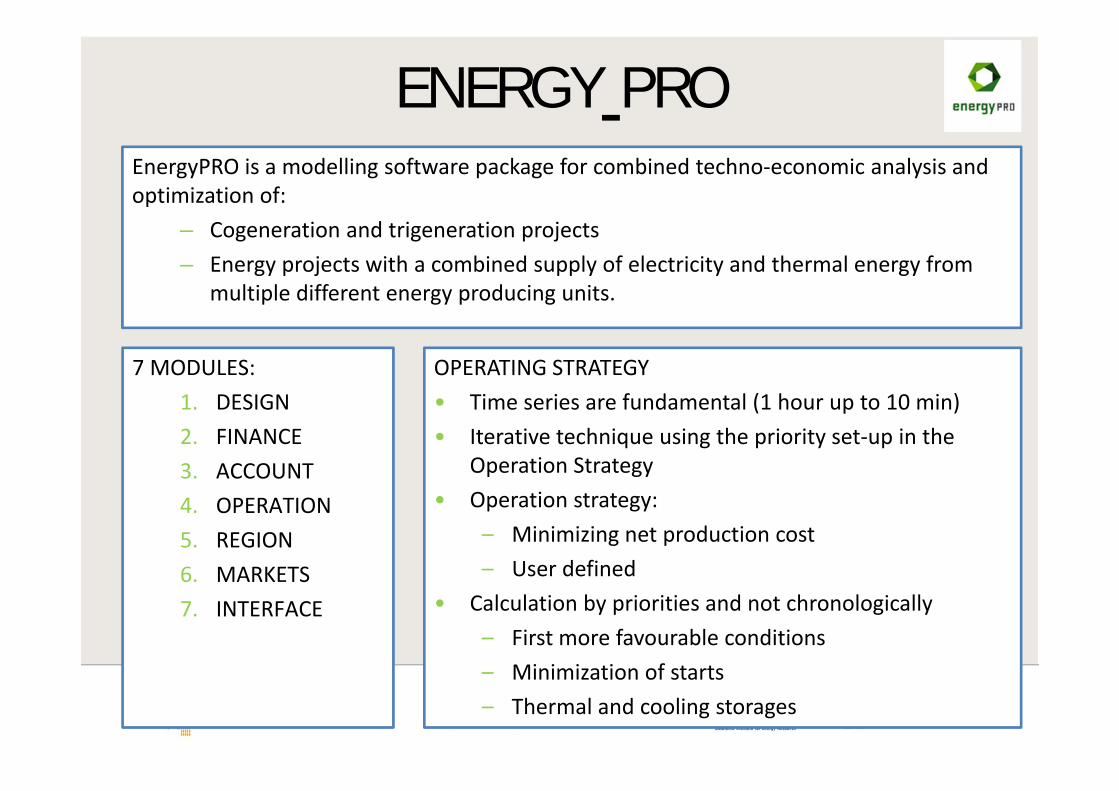
ENERGY PROEnergyPRO is a modelling software package for combined techno‐economic analysis and optimization of:
– Cogeneration and trigeneration projects– Energy projects with a combined supply of electricity and thermal energy from
multiple different energy producing units.
7 MODULES:1. DESIGN 2. FINANCE 3. ACCOUNT4. OPERATION 5. REGION6. MARKETS7. INTERFACE
OPERATING STRATEGY• Time series are fundamental (1 hour up to 10 min)• Iterative technique using the priority set‐up in the
Operation Strategy• Operation strategy:
– Minimizing net production cost– User defined
• Calculation by priorities and not chronologically– First more favourable conditions– Minimization of starts– Thermal and cooling storages
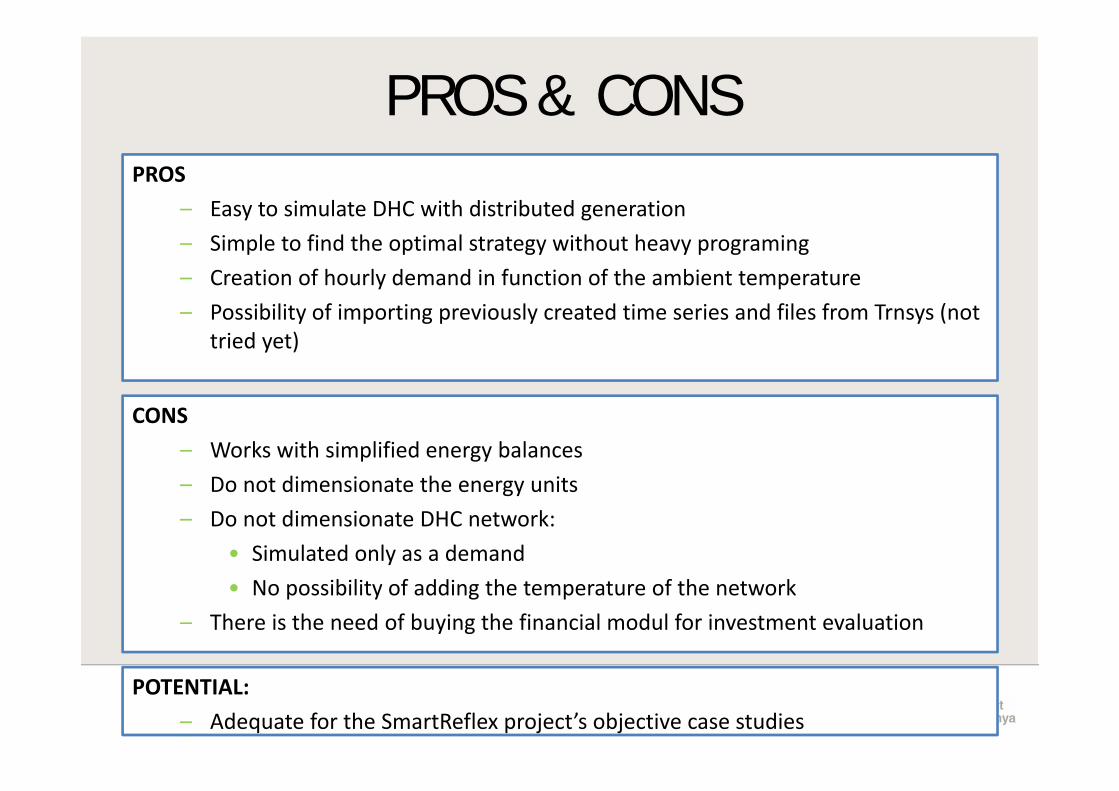
PROS & CONSPROS
– Easy to simulate DHC with distributed generation– Simple to find the optimal strategy without heavy programing– Creation of hourly demand in function of the ambient temperature– Possibility of importing previously created time series and files from Trnsys (not
tried yet)
CONS– Works with simplified energy balances– Do not dimensionate the energy units– Do not dimensionate DHC network:
• Simulated only as a demand• No possibility of adding the temperature of the network
– There is the need of buying the financial modul for investment evaluation
POTENTIAL:– Adequate for the SmartReflex project’s objective case studies

ANALYSIS OF L’ESTRELLABADALONA

BADALONA _ L’Estrella1Urban Planning Proposal
Urban Planning Area: 38,359’20 m²
Urban Information
Residential Surface: 9,624’15 m² Floor Area: 26,856’23 m² Hoses Units: 269
EquipmentSurface: 5,184’79 m² Floor Area: 8,952’08 m²
Green Area Surface: 9,941’60m²
Road networkSurface: 13,608’66m²

EXTERNAL CONDITIONSWEATHER
• Badalona Climatic zone C2 (CTE 2013)
ENERGYPRO:
• Possibility to load weather information as time series from anonline database– Searching by location– Ambient Ta, Wind, Solar radiation, Humidity, Precipitation
• Difficulties to load files from other programs like Meteonorm– Copy the time series with the information directly from excel
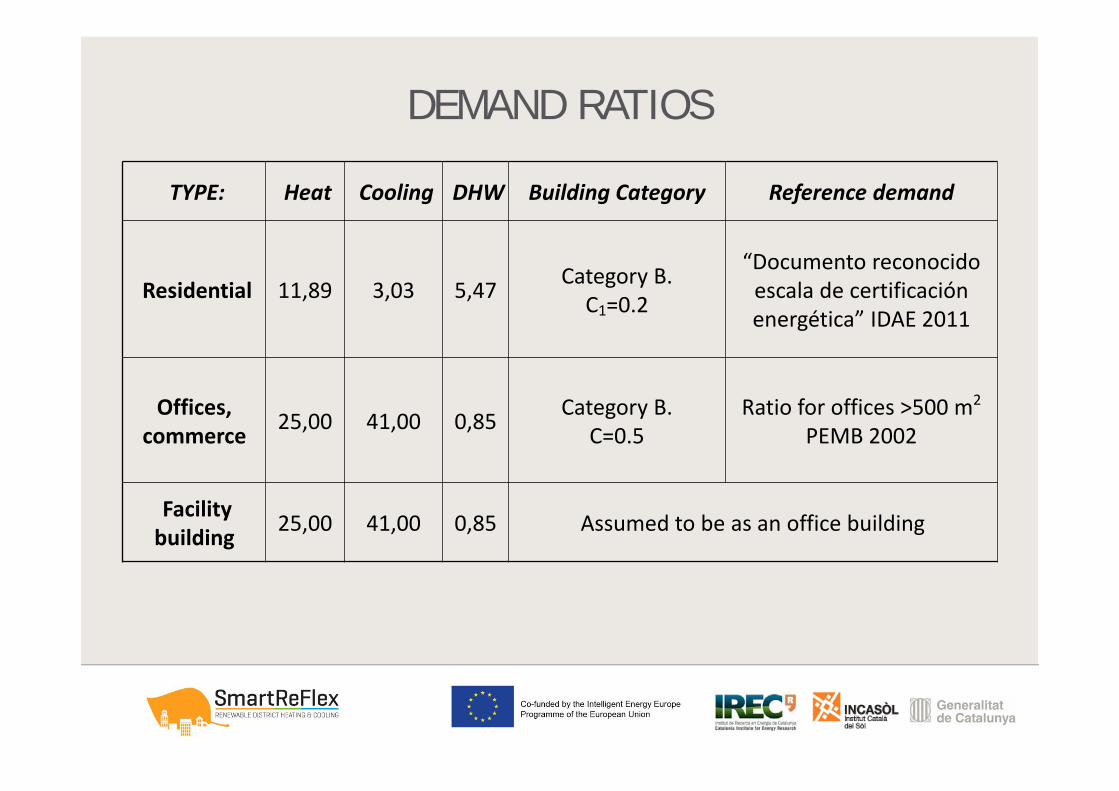
TYPE: Heat Cooling DHW Building Category Reference demand
Residential 11,89 3,03 5,47 Category B. C1=0.2
“Documento reconocido escala de certificación energética” IDAE 2011
Offices, commerce 25,00 41,00 0,85 Category B.
C=0.5Ratio for offices >500 m2
PEMB 2002
Facilitybuilding 25,00 41,00 0,85 Assumed to be as an office building
DEMAND RATIOS
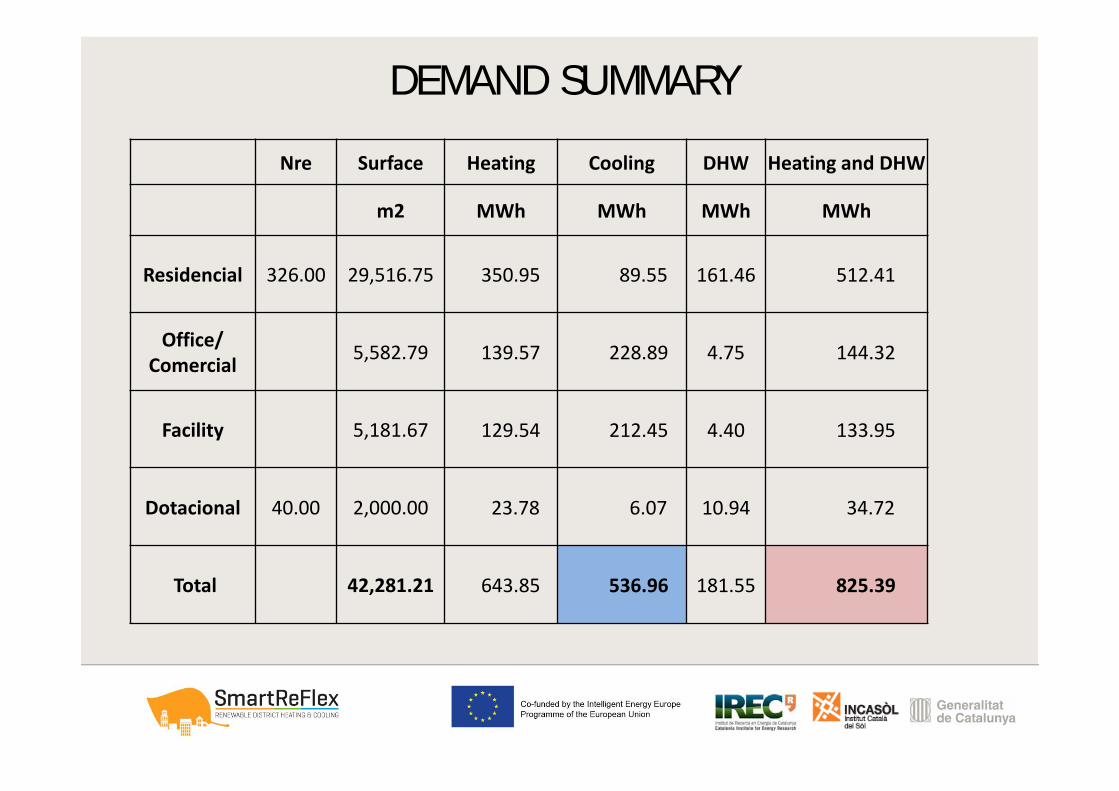
DEMAND SUMMARY
Nre Surface Heating Cooling DHW Heating and DHW
m2 MWh MWh MWh MWh
Residencial 326.00 29,516.75 350.95 89.55 161.46 512.41
Office/Comercial 5,582.79 139.57 228.89 4.75 144.32
Facility 5,181.67 129.54 212.45 4.40 133.95
Dotacional 40.00 2,000.00 23.78 6.07 10.94 34.72
Total 42,281.21 643.85 536.96 181.55 825.39

• HDD 18/18 and CDD 21/21
• Profile schedule according CTE 2013


QUESTIONS OF DEMAND
• How to introduce Factor of simultaneity
• Is it better to introduce the total heat demand total or to separate for different type of consumers (p.ex. residential, comercial and facilities)
• How to introduce ratios of demand W/m2?

TECHNICAL OPTIONS
1. DISTRICT HEATING AND COOLING1. BIOMASS BOILER, NATURAL GAS BOILER AND ELECTRIC CHILLER2. BIOMASS BOILER AND ELECTRIC CHILLER
2. DISTRICT HEATING1. BIOMASS BOILER, NATURAL GAS BOILER AND ELECTRIC CHILLER2. BIOMASS BOILER AND ELECTRIC CHILLER

FUELS• How to use fuel storages in EnergyPro?


ENERGY UNITS
BIOMASS BOILER ELECTRIC CHILLER

SOLAR COLLECTOR

THERMAL STORAGE

ENERGY UNITS & THERMAL STORAGE
• Loading units previously saved– Sometimes the connection between fuel and demand is not
automatically created– I only can solve it creating a new unit or a new electric market.
• Problem with the thermal storage

SALE OF HEAT AND COLD• There is the need of creating a payment for the sale of heat/cold
or can it be introduced once and linked to all the demands?
• How to put the fix term in the sale of heat? – I only could put a total yearly fix price

FUELS AND O&M COSTS• How to enter €/kW : formula not found in the database

OPERATION STRATEGY
• The Operation strategy is basically a decision table used to describe the priority between energy production units
– Minimizing Net Production Cost (Automatic)
– User Defined Operation Strategy
• How to work with the user defined operation strategy?

REPORT GENERATION

CASE STUDIES

TECHNICAL OPTIONS
1. DISTRICT HEATING AND COOLING1. BIOMASS BOILER, NATURAL GAS BOILER AND ELECTRIC CHILLER2. BIOMASS BOILER AND ELECTRIC CHILLER
2. DISTRICT HEATING1. BIOMASS BOILER, NATURAL GAS BOILER AND ELECTRIC CHILLER2. BIOMASS BOILER AND ELECTRIC CHILLER

1.1.DHC: ECONOMIC ANALYSIS
• Evaluation of the Net Present Value over 20 years• Calculation of the Internal Rate of Return• Calculation of the Simple Payback
Economic data usedInflation index 2%Market interest rate 4.5%Real Interest Rate 2.39%Biomass price yearly increase 2%NG price yearly increase 2%Heat price yearly increase 2%

1.1.DHC: SYSTEM

1.1.DHC: HEAT PRODUCTION

1.1.DHC: COLD PRODUCTION

1.1.INVESTMENT COSTS

1.1.SCENARIOS
Base scenario Flat rate individual price Individual prices
Heat price €/MWh 48.95 67.00 134.00
Cold price €/MWh 113.48 70.00 125.00
NPV € ‐ 817,206.71 ‐ 976,365.07 621,724.21
IRR ‐ 0.04 ‐ 0.05 0.06
Simple payback y 37.02 45.58 13.71
Revenues € 101,337.69 92,888.80 177,723.12
Fuel costs € 47,259.21 47,259.21 47,259.21
Maintenance € 9,124.60 9,124.60 9,124.60
Net cash fromoperation € 44,953.89 36,504.99 121,339.31
Investments 1,664,037.54 1,664,037.54 1,664,037.54

1.2.DHC: SYSTEM

1.2.DHC: HEAT PRODUCTION

1.2.DHC: COLD PRODUCTION

1.2.INVESTMENT COSTS

1.2.SCENARIOS
Base scenario Flat rate individual price Individual prices
Heat price €/MWh 48.95 67.00 134.00
Cold price €/MWh 113.48 70.00 125.00 NPV € ‐958,950.10 ‐1,118,263.95 479,825.33 IRR ‐0.04 ‐0.06 0.05 Simple payback y 40.45 49.98 14.86 Revenues € 101,345.95 92,888.80 177,723.12 Fuel costs € 46,977.28 46,977.28 46,977.28 Maintenance € 10,005.00 10,005.00 10,005.00 Net cash from operation € 44,363.67 35,906.52 120,740.84 Investments 1,794,662.54 1,794,662.54 1,794,662.54

DISTRICT HEATING

2.1.DH: SYSTEM

2.1.DHC: HEAT PRODUCTION

2.1.INVESTMENT COSTS

2.1.SCENARIOS
Base scenario Flat rate individual price Individual pricesHeat price €/MWh 48.95 67.00 134.00 NPV € ‐558,508.73 ‐277,857.51 763,894.91 IRR ‐0.10 ‐0.02 0.11
Simple payback y 93.03 31.23 9.01 Revenues € 40,402.94 55,301.27 110,602.54 Fuel costs € 28,370.31 28,370.31 28,370.31
Maintenance € 4,505.00 4,505.00 4,505.00
Net cash from operation € 7,527.63 22,425.96 77,727.23
Investments 700,312.54 700,312.54 700,312.54

2.2.DHC: SYSTEM
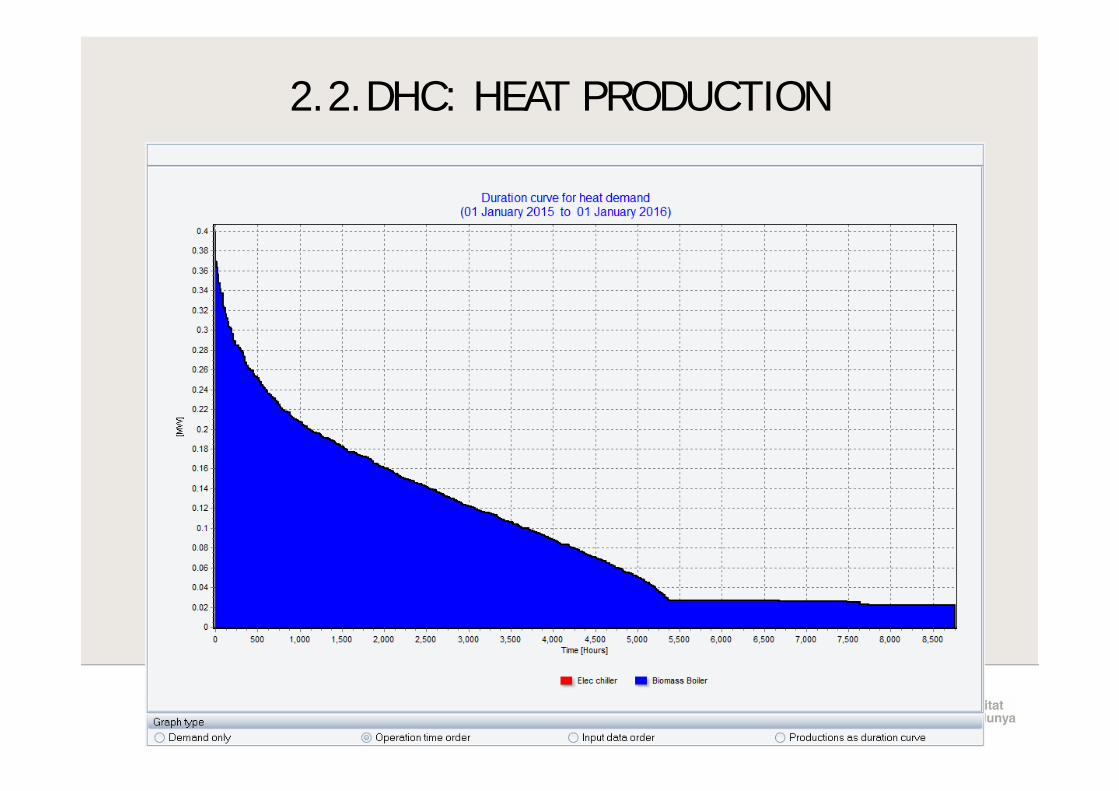
2.2.DHC: HEAT PRODUCTION

2.2.INVESTMENT COSTS

2.2.SCENARIOS
Base scenario Flat rate individual price Individual pricesHeat price €/MWh 48.95 67.00 134.00 NPV € ‐631,144.16 ‐350,648.43 691,103.99 IRR ‐0.11 ‐0.03 0.10 Simple payback y 113.64 35.11 9.84 Revenues € 40,411.20 55,301.27 110,602.54 Fuel costs € 28,088.38 28,088.38 28,088.38 Maintenance € 5,665.00 5,665.00 5,665.00 Net cash from operation € 6,657.82 21,547.89 76,849.16 Investments 756,562.54 756,562.54 756,562.54

MOLTES GRÀCIES
Joana Tarrés [email protected]
Grup d’Energia Tèrmica i EdificacióInstitut de Recerca en Energia de Catalunya
T. 933 562 615www.irec.cat

ANNEX
![Joana d'arc #02 [centurions]](https://static.fdocuments.us/doc/165x107/568bbca41a28ab777e8bfdb4/joana-darc-02-centurions.jpg)


![Prezi joana caiado[smallpdf.com]](https://static.fdocuments.us/doc/165x107/58eedd0e1a28ab37118b463d/prezi-joana-caiadosmallpdfcom.jpg)