5 CRAM Applications May 2 2011 (3)
11
5/31/2011 1 California Rapid Assessment Method for Wetlands and Riparian Areas Meaning of CRAM Scores Example Applications and Interpretations Scientific Meaning of CRAM Scores • CRAM Index Score represents overall condition, functional capacity, or “health.” – It does not represent any particular function or set of functions (that’s Level 3) • Analogous to: – Apgar Scores (new born infant health) – Dow Jones Industrial Average (DOW) – Gross National Product (GNP) – Grade Point Average (GPA) • Identical Index or Overall Scores can be derived from different Attribute Scores Scientific Meaning of CRAM Scores – Must refer to Attribute Scores and sometimes Metric Scores to interpret Index Scores 50 35 72 68 56 68 50 35 72 56 Landscape - Buffer Hydrology Physical Structure Biotic Structure Index Score – 10-point precision target
Transcript of 5 CRAM Applications May 2 2011 (3)

5/31/2011
1
California Rapid Assessment Method for Wetlands and Riparian Areas
Meaning of CRAM ScoresExample Applications and Interpretations
Scientific Meaning of CRAM Scores
• CRAM Index Score represents overall condition, functional capacity, or “health.”
– It does not represent any particular function or set of functions (that’s Level 3)
• Analogous to:– Apgar Scores (new born infant health)– Dow Jones Industrial Average (DOW)– Gross National Product (GNP)– Grade Point Average (GPA)
• Identical Index or Overall Scores can be derived from different Attribute Scores
Scientific Meaning of CRAM Scores
– Must refer to Attribute Scores and sometimes Metric Scores to interpret Index Scores
50 35 72 68 56
68 50 35 72 56
Land
scap
e-
Buff
er
Hyd
rolo
gy
Phys
ical
Stru
ctur
e
Biot
icSt
ruct
ure
Inde
xSc
ore
– 10-point precision target

5/31/2011
2
Index Landscape/ Buffer Hydrology Physical
StructureBiotic
Structure70 58 58 66 89
Index Landscape/ Buffer Hydrology Physical
StructureBiotic
Structure
72 83 100 50 53
• Each Attribute Score represents a suite of expected functions
– e.g., Landscape and Buffer Attribute represents ecological connectivity at landscape scale, ability of buffer to mediate external stressors, etc.
– e.g., Hydrology Attribute for riverine wetlands represents recharge, peak stage reduction, water quality maintenance, etc.
Scientific Meaning of CRAM Scores

5/31/2011
3
• As Attribute Scores decrease, associated functional capacity is expected to also decrease.
– Stressor checklist plus Metric Scores helps identify possible causes for low Attribute Scores
– Level 3 is required to validate relationship between Attribute scores and function or stress
Scientific Meaning of CRAM Scores
Examples: Applications and Interpretations
How is CRAM being Used?
• Statewide Assessments– Perennially tidal estuaries– Perennial Stream Ambient Assessment
• Watershed Assessments– Morro Bay Watershed Monitoring Program
• Program Assessments– Wetland Mitigation Program
• Project Assessments– Development Projects– Restoration Project Success
5/31/2011
4
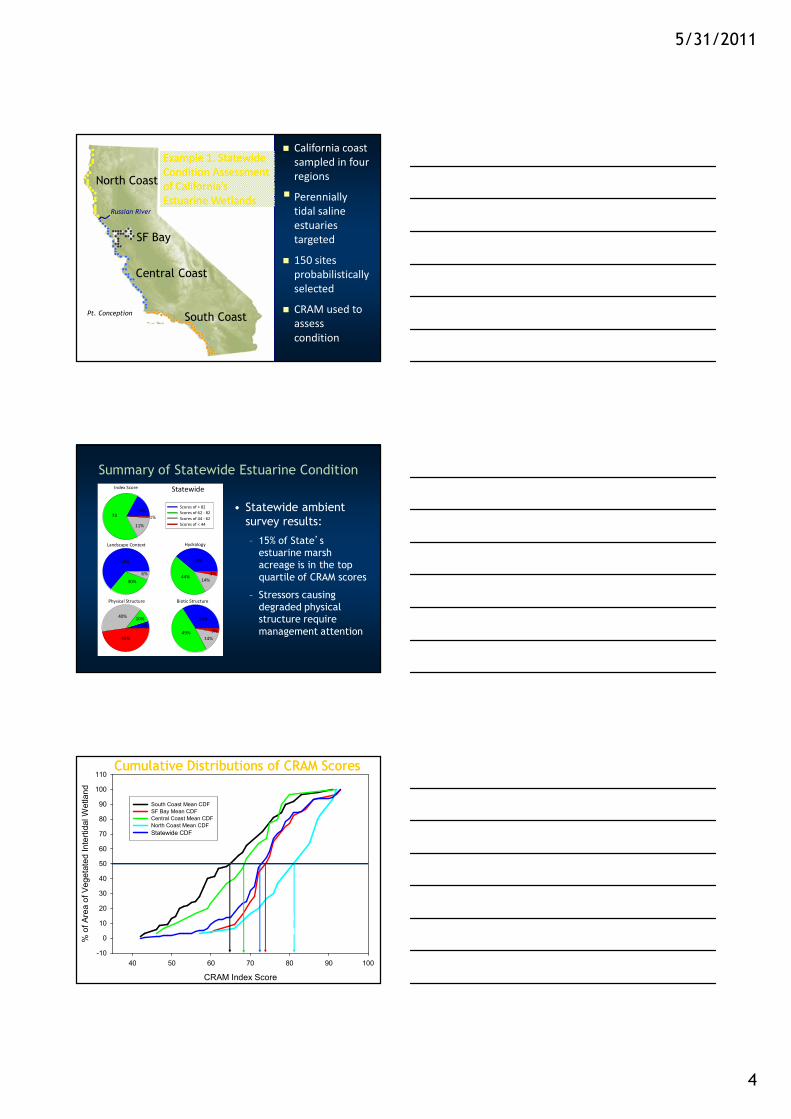
� California coast sampled in four regions
� Perennially tidal saline estuaries targeted
� 150 sites probabilistically selected
� CRAM used to assess condition
Pt. Conception
Russian River
South Coast
Central Coast
North Coast
SF Bay
Example 1. Statewide Example 1. Statewide Condition AssessmentCondition Assessmentof Californiaof California’’ssEstuarine WetlandsEstuarine Wetlands
Summary of Statewide Estuarine Condition
• Statewide ambient survey results:
– 15% of State’sestuarine marsh acreage is in the top quartile of CRAM scores
– Stressors causing degraded physical structure require management attention
15%
11%
1%73
Index Score
Scores of > 82Scores of 62 - 82 Scores of 44 - 62 Scores of < 44
30%
6%
64%
Statewide
Landscape Context
CRAM Index Scores of > 82
CRAM Index Scores of 62 - 82 CRAM Index Scores of 44 - 62 CRAM Index Scores of < 44
39%
3%44%
14%
Biotic StructurePhysical Structure
Hydrology
40% 10%5%
45%
34%
14%
3%49%
CRAM Index Score
40 50 60 70 80 90 100
%of
Area
ofVe
geta
ted
Inte
rtida
lWet
land
-10
0
10
20
30
40
50
60
70
80
90
100
110
South Coast Mean CDFSF Bay Mean CDFCentral Coast Mean CDFNorth Coast Mean CDFStatewide CDF
Cumulative Distributions of CRAM ScoresCumulative Distributions of CRAM Scores
Condition improves from South to North

5/31/2011
5
30 CMAP sites sampled between 2004-2007 CRAM assessment added in 2007
Multiple Metrics:
CRAM
IBI• Benthic macroinvertebrates
Physical Habitat• Riparian Human Disturbance
Index (RHDI)
• Embeddedness (% Sands & Fines)
• Canopy Cover
Example 2. CMAP/CRAM Statewide Assessment
AA
Buffer
Joint CRAM and IBI Assessments
Cumulative Frequency Distribution of CRAM and CMAP
CDF for CRAM and IBI
0
20
40
60
80
100
0 20 40 60 80 100
% posssible score
%of
srea
mm
iles
IBI (n=28)CRAM (n=30)

5/31/2011
6
CRAM index score20 30 40 50 60 70 80 90 100
Ben
thic
-IBIs
core
0
20
40
60
80
100
120
CRAM / IBI CorrelationsCRAM Index
(p<0.0001, R2=0.471)
Physical Structure
(p<0.0001, R2=0.433)
Biotic Structure
(p<0.0001, R2=0.434).
CRAm index score20 30 40 50 60 70 80 90 100
Hum
anR
ipar
ian
Dis
turb
ance
Inde
x
0
1
2
3
4
5
6
CRAM / Riparian DisturbanceCRAM index
(p<0.0001; R2=0.480)
Physical structure (p<0.0001; R2=0.526)Biotic structure (p<0.0001, R2=0.505)
Example 3. Ambient RiverineExample 3. Ambient Riverine--Riparian Surveys at Riparian Surveys at Watershed ScaleWatershed Scale
2007 Morro Bay Watershed 2007 Morro Bay Watershed Ambient AssessmentAmbient Assessment
• Probabilistic sampling of 30 “ambient sites”
• Targeted sampling at restoration projects
•• Major Issue: Access to Major Issue: Access to private landprivate land
•• Los Osos >90% privateLos Osos >90% private•• Chorro Creek ~40% Chorro Creek ~40%
privateprivate

5/31/2011
7
3.2%6.5%
61.3%
13.1%
23.8%
29.0%34.5%
28.6%
0%
10%
20%
30%
40%
50%
60%
70%
25-43 44-62 63-81 82-100
CRAM score
%of
tota
lsite
s
% of total (Morro Bay n=31)
% of total (all s tate n=84)
2007 Morro Bay Ambient Condition 2007 Morro Bay Ambient Condition compared to Statewide CRAMcompared to Statewide CRAM
Condition CRAM Index Score Range
Excellent 82-100
Good 63-81
Fair 44-62
Poor 25-43
2007 Morro Bay Watershed 2007 Morro Bay Watershed Project sitesProject sites
Morro Bay Watershed
010
20
30
40
50
60
70
80
90100
25 30 35 40 45 50 55 60 65 70 75 80 85 90 95 100
CRAM Scores
Perc
ent
ofC
ases
Morro Bay Riverine-Riparian Projects of Statewide and Local Ambient Condition
Statewide ambient riverine-riparian condition

5/31/2011
8
Example 4. Program Evaluation
Focus: Evaluate the compliance and wetland condition of compensatory wetland mitigation projects associated with Section 401 Water Quality Certifications throughout California
• 204 mitigation sites
• Review permit files for compliance
• Evaluate condition using CRAM
Successful Mitigation??

5/31/2011
9
Condition of Mitigation Sites
Example 5. Project Impact Assessment Using CRAM
� Approach depends on objective of project� Approaches include:
o Assess all impactso Sequential comparisono Probabilistic surveyo Targeted surveyo Hybrid
Example 5A. Elverta SP Project Assessment
Elverta Specific Plan Project Site Elverta Specific Plan Project Site (Impact Site) and Sampled (Impact Site) and Sampled Assessment Areas (AAs)Assessment Areas (AAs)

5/31/2011
10
Elverta Project Assessment (2)
The Orchard Creek The Orchard Creek Preservation Bank, Preservation Bank, a reference site a reference site for ambient for ambient conditions in the conditions in the Elverta Project Elverta Project area, with area, with sampled AAssampled AAs
Elverta Project Assessment (3)
Empire Ranch, a development site with Empire Ranch, a development site with conditions identified by the applicant as conditions identified by the applicant as representing future conditions on the representing future conditions on the Elverta Project site, with sampled AAsElverta Project site, with sampled AAs
Elverta Project Assessment (4)
0
20
40
60
80
100
CRAMInde
x
Buffer/
Landsc
ape
Hydro
logy
Physica
l Stru
cture
BioticStr
ucture
Elverta SP Riverine
Orchard Creek Riverine
Empire Ranch Riverine0
20
40
60
80
100
CRAMInde
x
Buffer/
Landsc
ape
Hydro
logy
Physica
l Stru
cture
BioticSt
ructu
re
Elverta SP Depress ional
Orchard CreekDepressional
Empire RanchDepressional
0
20
40
60
80
100
CRAMInde
x
Buffer/
Landsc
ape
Hydro
logy
Physica
l Stru
cture
BioticStru
cture
Elverta SP Single VP
Orchard Creek Singl e VP
Empi re Ranch Single VP 0
20
40
60
80
100
CRAMInde
x
Buffer/
Landsc
ape
Hydro
logy
Physica
l Stru
cture
BioticStr
ucture
Elverta SP VP Systems
Orchard Creek VP Systems
Empire Ranch VP Systems
5/31/2011
11
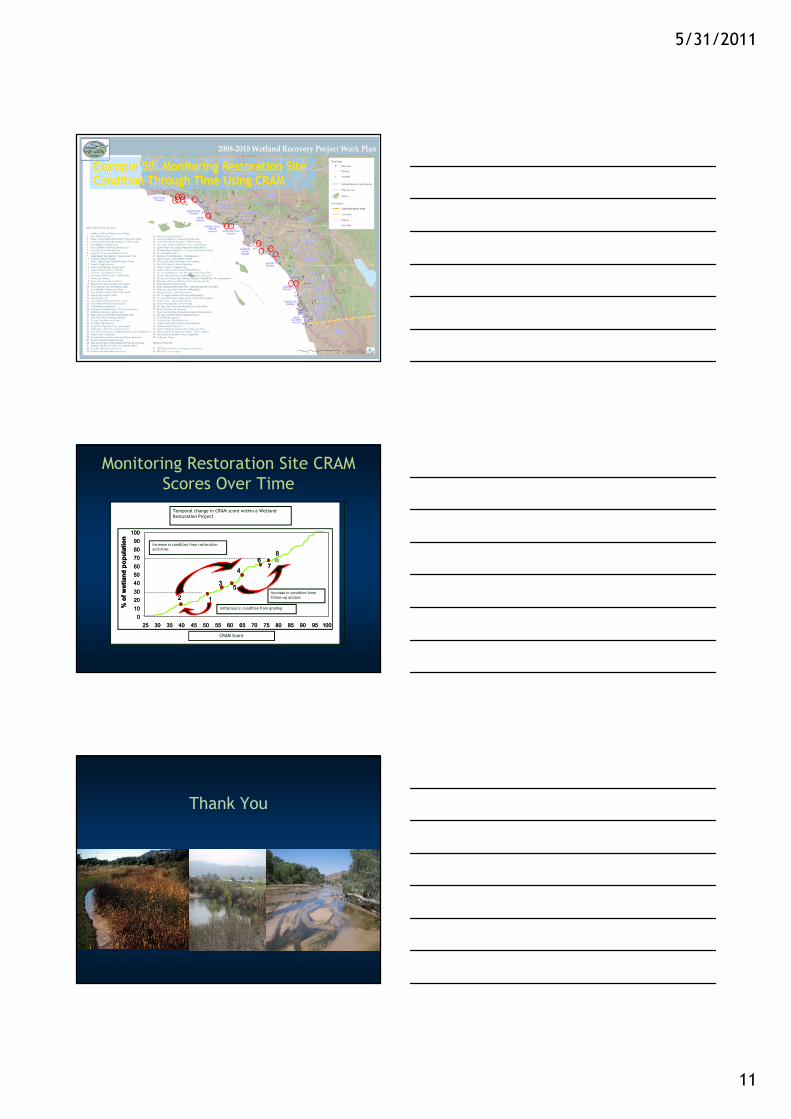
Example 5B. Monitoring Restoration Site Example 5B. Monitoring Restoration Site Condition Through Time Using CRAMCondition Through Time Using CRAM
Monitoring Restoration Site CRAM Scores Over Time
010203040
607080
100
25 30 35 40 45 50 55 60 65 70 75 80 85 90 95 100
90
50
12
3
4
5
67
8
%of
wet
land
popu
latio
n
010203040
607080
100
25 30 35 40 45 50 55 60 65 70 75 80 85 90 95 100
90
50
12
3
4
5
67
8
%of
wet
land
popu
latio
n
Initial loss in condition from grading
Increase in condition from restoration activities
Increase in condition from follow-up actions
Temporal change in CRAM score within a Wetland Restoration Project
CRAM Score
Thank You