5 CASE STUDIES - World Bankpubdocs.worldbank.org/pubdocs/publicdoc/2015/7/... · Colombia’s cut...
19
43 5 CASE STUDIES As discussed in Chapter 1, there are four general categories of air freight: emergency cargo of spare parts, medicines, and so on, as well as courier shipments of documents and samples; high-value, low density shipments, for example gold, jewelry, currency, artworks, electronic components, fashion garments and luxury vehicles; perishable cargoes including seafood, fruits and vegetables, and cut flowers; and rapid replenishment shipments of consumer goods especially garments and inputs for JIT manufacturing. This chapter examines more specific examples of trade in perishables, garments and electronics, which are most relevant to developing countries. In addition, it considered some of the hybrid shipments that will end up being rush shipments and courier shipments. Trade in perishables The composition of trade in fresh agro-food products has shifted towards horticultural products, fish, and spices (Figure 5-1), which has led to an increase in demand for airfreight to meet the delivery times. Growing fresh produce is not as scale-dependent as traditional agricultural export crops. While larger producers continue to have advantages in the introduction of new technology, maintenance of cool/cold chains and general logistics, small shareholders can often provide better performance in terms of traceability and environmental standards. They can also provide the additional attention required for growing the high value goods and produce the required volumes since the air shipments of high value goods tend to be a few tons. Cut flowers The supply of cut flowers to major markets in Europe and North America has shifted from the traditional sources in developed countries to lower cost producers in climates that allow continuous production without high-energy costs (see Box 5-1). This production has been concentrated in Colombia, Israel and Kenya, but new competitors such as Yunnan in China and Ecuador are increasing their market share. At the same time, new market destinations are being developed in East Asia and the Middle East. The traditional distribution channel, the Dutch flower auctions, are facing stiff competition from direct imports to EU countries, as well as competing auction markets being developed in Dubai and Kunming. As a result, the market appears to be going through significant restructuring. Figure 5-1. Changing composition of agro-food exports Source: High-Value Food Trade And Standards, Chicago, 2005
Transcript of 5 CASE STUDIES - World Bankpubdocs.worldbank.org/pubdocs/publicdoc/2015/7/... · Colombia’s cut...

43
5 CASE STUDIES
As discussed in Chapter 1, there are four general categories of air freight: emergency cargo of spare parts, medicines, and so on, as well as courier shipments of documents and samples; high-value, low density shipments, for example gold, jewelry, currency, artworks, electronic components, fashion garments and luxury vehicles; perishable cargoes including seafood, fruits and vegetables, and cut flowers; and rapid replenishment
shipments of consumer goods especially garments and inputs for JIT manufacturing. This chapter examines more specific examples of trade in perishables, garments and electronics, which are most relevant to developing countries. In addition, it considered some of the hybrid shipments that will end up being rush shipments and courier shipments.
Trade in perishables
The composition of trade in fresh agro-food products has shifted towards horticultural products, fish, and spices (Figure 5-1), which has led to an increase in demand for airfreight to meet the delivery times. Growing fresh produce is not as scale-dependent as traditional agricultural export crops. While larger producers continue to have advantages in the introduction of new technology, maintenance of cool/cold chains and general logistics, small shareholders can often provide better performance in terms of traceability and environmental standards. They can also provide the additional attention required for growing the high value goods and produce the required volumes since the air shipments of high value goods tend to be a few tons. Cut flowers
The supply of cut flowers to major markets in Europe and North America has shifted from the traditional sources in developed countries to lower cost producers in climates that allow continuous production without high-energy costs (see Box 5-1). This production has been concentrated in Colombia, Israel and Kenya, but new competitors such as Yunnan in China and Ecuador are increasing their market share. At the same time, new market destinations are being developed in East Asia and the Middle East. The traditional distribution channel, the Dutch flower auctions, are facing stiff competition from direct imports to EU countries, as well as competing auction markets being developed in Dubai and Kunming. As a result, the market appears to be going through significant restructuring.
Figure 5-1. Changing composition of agro-food exports
Source: High-Value Food Trade And Standards, Chicago, 2005

44 AIR FREIGHT: A MARKET STUDY WITH IMPLICATIONS FOR LANDLOCKED COUNTRIES
A critical element in the export of cut flowers is the management of the supply chain. From harvest to final delivery, the moisture and temperature must be controlled, as well as the overall transit time.29
The quality of logistics is an essential element of competitive advantage. Cost is equally important and provides an advantage for countries that already have well-developed air freight routes, whether through scheduled freighters or space on passenger flights. The latter suggest synergies with a tourism-oriented economy.
29 After cutting, roses last 3 to 5 days, carnations 7 to 10 days, standard chrysanthemums 7 to 12 days, and
pompon chrysanthemums 10 to 14 days.
Box 5-1. Evolution of cut flower market
In the 1960’s, demand for cut flowers from consumers around the world was met by local production in both Europe and North America. In Europe, which has the largest per capita consumption in the world, about eight times that of the US, production was initially concentrated in the Netherlands. With expedited movements within the EU, it became possible to produce cut flowers in Southern Europe. The energy crisis in 1973 put producers in Netherlands and elsewhere in northern Europe under further competitive pressure because of the increase in cost for operating temperature-controlled greenhouses during the winter. The competition intensified when Israel began to sell cut flowers in the Dutch flower auction. Although further from the market, they could produce cut flowers throughout the year in open fields or plastic tunnels. In order to offset higher costs for transport to Europe and for water, the government provided transport subsidies and funded research on more efficient irrigation systems. Subsequently, African producers, especially from Kenya, entered the market often with production equipment and varieties from Israel.
In the US, production was initially concentrated near the major markets in the Northeast but with improvements in transport and cool chain technology, production shifted to California, Florida and Colorado where there were year-round growing conditions and lower labor costs. During the 1970’s, the European flower industry operating through the Dutch flower auctions gained a share of the United States market through air shipments via New York. At the same time, Miami was developed as a distribution center for cut flowers from Colombia. South American cut flower growers purchased varieties from Europe while US growers purchased the more efficient European production systems. The Israeli flower industry also expanded into the US using New York and Miami as gateways. This significantly reduced the market share of the more costly American producers. Currently, California produces only about 15 percent of the flowers sold in the US. These are primarily varieties like sunflowers that are not easily shipped long distances.
The European flower industry has retained its position as a leader in commercial horticulture but this time through improvements in post-harvest handling and storage technology; marketing strategies; establishment of grades and standards; and development of transportation systems. In the 1980s, the European flower industry expanded into Asia supplying the growing consumer demand first in Japan and then in Korea, Taiwan, and Hong Kong. This was followed by sales to regional producers of flower varieties, production equipment, and technology for new production operations European flower traders also turned to Southeast Asia as a supplier of cut flowers but unlike Africa and South and Latin America, the production is not for Europe but for the regional market with its growing prosperity.

Case studies 45
Colombia Colombia’s cut flower industry started in the early 1970s in the Sabana de Bogotá, which had a favorable environment, available fertile land and low labor costs. It began with the establishment of Florámerica, a flower exporting company formed by U.S. businessmen. There followed other firms involving Colombian entrepreneurs. By 1978, Colombia had captured 90 percent of the U.S. import market. In 2005, Colombia exported almost $1 billion of cut flowers, with the U.S. buying $742 million. Of the U.S. imports from Colombia, 40 percent are roses, 10 percent each carnations and chrysanthemums.30
The major markets other than the USA are Russia and Japan. About 10 percent of the exports are shipped to Europe under GSP arrangements.
This rapid growth was accomplished despite difficulties with both the roads and airfreight services by taking advantage of trade preference schemes under the ATPA. Initially shipments were made as belly cargo on the scheduled flights of the national carrier, Avianca. However, Avianca’s refused to make special provisions for this cargo and mixed the flowers with passenger luggage. The result was significant loss from heat while waiting for customs inspection and loading onto planes. This led to the introduction of a new carrier, Aerocosta, which though it eventually failed, raised the quality of service and caused Avianca to change its procedures and load the flowers at night. It also led to the introduction of scheduled air cargo services. Currently these include Martinair serving Europe and TAMPA, Arrow, Cielos de Peru and Lineas Aéreas Sudamerican serving the USA. For their part, the exporters acquired refrigerated trucks and provided a complete cold chain that uses the same U.S. distribution network as for flowers grown in Florida. The latter provided 2-day delivery to most East coast and Midwest destinations as shown in Figure 5-2. Currently there are nearly 6000 hectares under cultivation on about 500 farms, selling cut flowers to over 300 exporters. About 75 percent of the flowers are grown in Bogotá – the remaining in Cali and Medellin. The most critical export route is Bogotá-Miami. Cut flowers account for about 84 percent of the approximately 0.25 million tons of airfreight from Colombia to the United States. At a current wholesale price of about $0.25 per stem, the value of a kilogram of roses (19 stems) would come to $4.75. Assuming an airfreight rate of about $1.30 per kilogram, this accounts for more than 1/4 of their wholesale price. The proportion is slightly higher for carnations, which have both a lower wholesale price and about twice the number of stems per kilogram.
30 According to the USDA Economic Research Service; http://www.ers.usda.gov/Briefing/Floriculture/Trade.htm
Figure 5-2. Flow chart for Colombian flowers
Source: Interviews
Farm Post-Harvest Collection
Point
El Dorado Airport
4-8 hours
Miami Airport
2-4 hours Retailer
Farm Truck
Refrigerated Truck 1 hour
Airfreight 6 hours
Refrigerated Truck
12-24 hours

46 AIR FREIGHT: A MARKET STUDY WITH IMPLICATIONS FOR LANDLOCKED COUNTRIES
Kenya Horticulture has been Kenya’s fastest growing sector and is ranked third after tourism and tea as a foreign exchange earner. The country is the largest single supplier in the European flower market with a 31 percent market share. Its major competitors, Colombia, Ecuador, and Israel each have only about ½ this market share. About 69 percent of the exports are shipped to the wholesale markets in the Netherlands31 where they are sold to the EU countries. While Dutch flower auctions have historically been the most important channel, changes in consumption patterns and supermarket supply chain rationalizations have lead to more direct contracts. Currently, about ¼ of the exports to Europe are sold directly to UK and Germany, as shown in Figure 5-3. Part of this is the result of a 2005 agreement with Germany to bypass the Dutch auction market.32
Kenya’s competitive advantage derives from its climate, lower labor costs, less stringent environmental regulation, and lower trade barriers. Exports grew from about 3,000 tons in 1978 to 30,000 tons in 1998 and currently exceed 60,000 tons (Figure 5-4). The industry, which directly employs about ½ million workers, 33
is well organized. In 1996, the Kenya Flower Council was established to coordinate the efforts of independent growers and exporters and ensure implementation of acceptable local and international standards. Although there are now some 500 commercial flower growers, approximately 75 percent of the cut flower exports are produced by a few dozen large and medium producers.
About 3/4 of the flowers exported in 2005 were roses (Table 5-1). The average value of Kenya’s cut flowers has varied and is now approaching $4 per kilogram, though there are wide variations. Demand for Kenyan flowers in Europe is still experiencing strong growth even while the delivered price has been increasing (Figure 5-5). This has
31 Though Kenya supplies directly to markets in the UK and other countries, shipments to the Netherlands may
appear elsewhere – Dutch flower auction houses present the largest flower market in the world. 32 This auction, which has existed since the early 1900s, acts as a grower’s cooperative, obliging growers to sell all
of their production through the auction. 33 http://environment.guardian.co.uk/conservation/story/0,,2012674,00.html
Figure 5-4. Kilograms of flowers shipped from Kenya
Source: HCDA
-10.0020.0030.0040.0050.0060.0070.0080.0090.00
2000 2001 2002 2003 2004 2005
Mill
ions
Year
Kilo
gram
s
Figure 5-3. Kenya export of cut flowers to Europe
Source: International Trade Center
Kenya Export of Cut Flowers to Europe
$-
$50
$100
$150
$200
$250
$300
$350
$400
2001 2002 2003 2004 2005
Mill
ion
US$ Other
SwitzerlandGermanyUKNetherlands

Case studies 47
encouraged new entrants including Rwanda, and Uganda. The latter has not only rich and fertile soil but also sufficient cargo capacity utilizing both passenger and freighter services (DAS Cargo). Cut flower exports began in the late 1960’s when wide-bodied jets were introduced to transport tourists and the airlines offered the additional cargo capacity to the fresh produce industry. Currently, over 90 percent of fresh horticultural products are air freighted, which makes securing air cargo space a priority. Large exporters have been able to exercise some control over space through joint ventures with freight forwarders. As much as 90 percent of the shipments to the U.K. are carried as belly cargo on Kenyan Airways. Air cargo carriers, such as Lufthansa Cargo and Cargolux, provide dedicated cargo space from Nairobi to Frankfurt and Maastricht. An estimated 70 percent of the flowers are grown at the rim of Lake Naivasha, northwest of Nairobi. 34 There are good road network connections between the Lake Naivasha growing area and Nairobi’s Jomo Kenyatta International Airport, a distance of about 80-100 kilometers. 35
Flowers picked in the morning reach markets in Amsterdam by evening.
Ecuador Ecuador’s flower production covers over 2,000 hectares. It has the advantages of a variety of climates and geography, which ranges from the low coastal highlands to the high Andes (Sierra) plus the lower tropical Oriente and Amazon areas. There are around 60 varieties of roses grown for export. To improve competitiveness, there is a program of diversification from roses
34 An excellent draft paper summarizing the Kenyan flower industry can be found in Knowledge, Technology and
Growth: The Case Study of Lake Naivasha Cut Flower Cluster in Kenya, April 2006, by Maurice Bolo of the World Bank Institute. 35 Distance as measured via Google Earth is 82 kilometers straight line, 100 kilometers following road.
Figure 5-6. Growth in Ecuador flower export
Source: Prepared by: Corporación Financiera Nacional, Strategic Planning Division, 1997
0
10
20
30
40
50
60
70
80
90
100
1986 1987 1988 1989 1990 1991 1992 1993 1994 1995 1996
000
Met
ric to
ns
Table 5-1. Kenya’s principal greenhouse exports, 2005
Commodity US$ million
Amount million ton
Value US$ per kg
Roses 199.0 61,072 3.26
Mixed Flowers 29.0 7,043 4.12
Carnations, Std 9.7 2,603 3.73
Cuttings 9.1 469 19.33
Hypericum 5.9 1,781 3.33
Lisianthus 4.6 408 11.25
Carn. Cutting unroot 3.5 171 20.62
Gypsophilla 3.2 793 4.01
Source: HCDA
Figure 5-5. Average value per kg of Kenya’s cut flowers
Source: HCDA, Year End Exchange Rates
$-
$0.50
$1.00
$1.50
$2.00
$2.50
$3.00
$3.50
$4.00
$4.50
2000 2001 2002 2003 2004 2005
Year
Pric
e
48 AIR FREIGHT: A MARKET STUDY WITH IMPLICATIONS FOR LANDLOCKED COUNTRIES
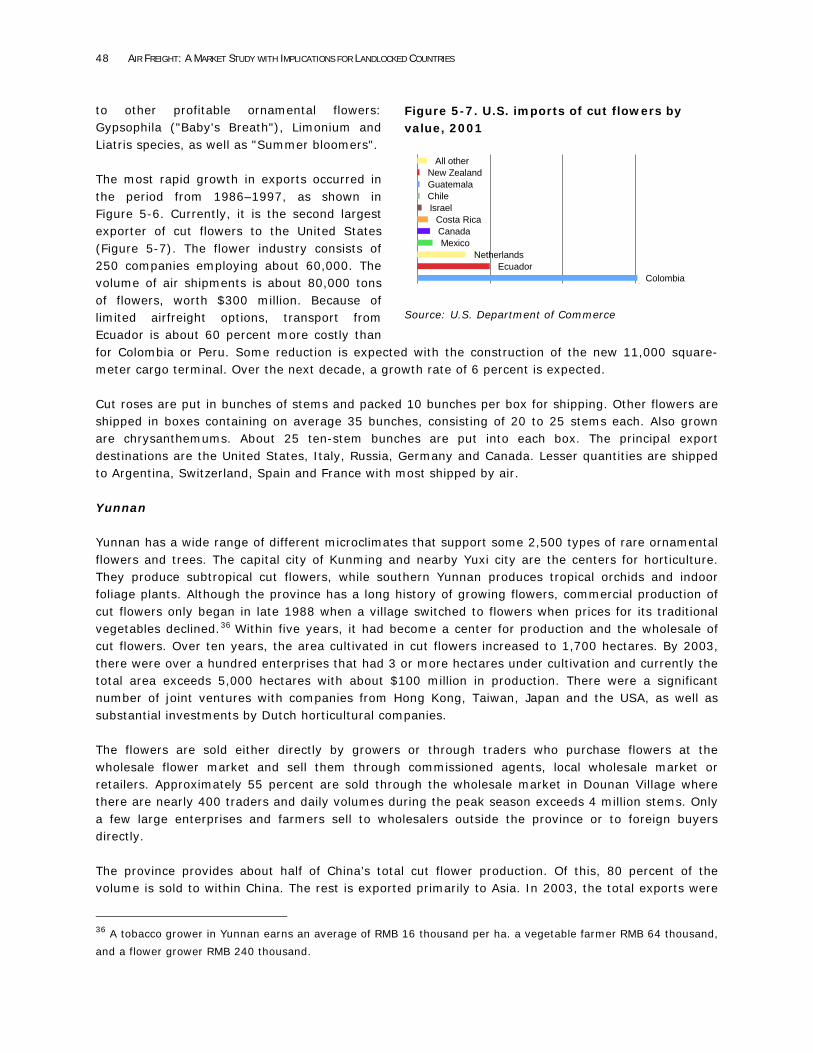
Figure 5-7. U.S. imports of cut flowers by value, 2001
Source: U.S. Department of Commerce
Colombia Ecuador
Netherlands Mexico
Canada Costa Rica
Israel Chile Guatemala New Zealand
All other
to other profitable ornamental flowers: Gypsophila ("Baby's Breath"), Limonium and Liatris species, as well as "Summer bloomers". The most rapid growth in exports occurred in the period from 1986–1997, as shown in Figure 5-6. Currently, it is the second largest exporter of cut flowers to the United States (Figure 5-7). The flower industry consists of 250 companies employing about 60,000. The volume of air shipments is about 80,000 tons of flowers, worth $300 million. Because of limited airfreight options, transport from Ecuador is about 60 percent more costly than for Colombia or Peru. Some reduction is expected with the construction of the new 11,000 square-meter cargo terminal. Over the next decade, a growth rate of 6 percent is expected. Cut roses are put in bunches of stems and packed 10 bunches per box for shipping. Other flowers are shipped in boxes containing on average 35 bunches, consisting of 20 to 25 stems each. Also grown are chrysanthemums. About 25 ten-stem bunches are put into each box. The principal export destinations are the United States, Italy, Russia, Germany and Canada. Lesser quantities are shipped to Argentina, Switzerland, Spain and France with most shipped by air. Yunnan Yunnan has a wide range of different microclimates that support some 2,500 types of rare ornamental flowers and trees. The capital city of Kunming and nearby Yuxi city are the centers for horticulture. They produce subtropical cut flowers, while southern Yunnan produces tropical orchids and indoor foliage plants. Although the province has a long history of growing flowers, commercial production of cut flowers only began in late 1988 when a village switched to flowers when prices for its traditional vegetables declined.36
Within five years, it had become a center for production and the wholesale of cut flowers. Over ten years, the area cultivated in cut flowers increased to 1,700 hectares. By 2003, there were over a hundred enterprises that had 3 or more hectares under cultivation and currently the total area exceeds 5,000 hectares with about $100 million in production. There were a significant number of joint ventures with companies from Hong Kong, Taiwan, Japan and the USA, as well as substantial investments by Dutch horticultural companies.
The flowers are sold either directly by growers or through traders who purchase flowers at the wholesale flower market and sell them through commissioned agents, local wholesale market or retailers. Approximately 55 percent are sold through the wholesale market in Dounan Village where there are nearly 400 traders and daily volumes during the peak season exceeds 4 million stems. Only a few large enterprises and farmers sell to wholesalers outside the province or to foreign buyers directly. The province provides about half of China’s total cut flower production. Of this, 80 percent of the volume is sold to within China. The rest is exported primarily to Asia. In 2003, the total exports were
36 A tobacco grower in Yunnan earns an average of RMB 16 thousand per ha. a vegetable farmer RMB 64 thousand,
and a flower grower RMB 240 thousand.

Case studies 49
valued at $30 million. Although production is projected to reach about $250 million in 15 years, exports are not expected to increase significantly. The exports are primarily roses because they have a high value per pound and are easy to transport long distances with limited damage. However exports have been constrained by disputes over the evasion of royalty payments.37
Other flowers are less attractive for exports. Carnations can withstand air shipment but have a low value per pound. Tulips have a high value but must be packed very loosely and are therefore costly to ship.
With no direct flight from Kunming to the international cut-flower distribution centers, guaranteeing the essential “cool chain” is a major problem. Inadequate capacity of air transport and high airfreight rates as well as difficult export licensing and high fees for quarantine and customs create additional problems. Opportunities for expanding production of cut flowers in Asia require improvements in post-harvest handling, storage technology, transport, grades and standards and marketing strategies for the unique demands of Asian market. Most of the flowers are exported to Japan, South Korea, Hong Kong and Thailand, since they are relatively near, and requirements in terms of post-harvest storage are minimal. However, most of the shipments to Bangkok and Hong Kong are re-exported to other Asian countries, to Russia, the Middle East, Europe, and to a limited extent to the United States. The cost of air shipping works out to about 30 cents per long-stemmed rose. By comparison, farms in Yunnan sell their flowers at wholesale for $0.04 to $0.16 cents apiece, ($0.28 each just before Valentine’s Day). Fruits and vegetables
In the late 1980s and early 1990s, high-value agricultural exports were typically produced by smallholders and exported by locally owned companies to independent importers in Europe. Since then, the evolution of supermarket and large retail chains, such as Royal Ahold, Carrefour and Wal-Mart, caused increasing consolidation among exporters in order to meet the demands for quantity and consistency. Also these chains working through their major distributors extended their role in the supply chains connecting directly to growers in order to ensure greater consistency in quality. They improved storage, cooling and field-to-packing plant logistics so as meet the higher standards for SPS, traceability and social compliance.38
This also allowed a shift to table-ready products such as mixed salads that required that ingredients be picked, prepared, fully-labeled and transported to the supermarket shelves within 48 hours. For their part, the exporters sought to differentiate themselves through value-added processing (pre-preparation and pre-packing) as well as developing products that involve more complex handling, for example "baby" vegetables and fruits.
The demand for fresh produce led to increased investment in post-harvest processing and cool/cold chains, which places increasing emphasis on the role of the packinghouses or consolidation facilities for smallholder production. These various factors, together with higher product standards and traceability requirements, led to simpler, more integrated supply chains for which airfreight is well suited.
37 Growers in Yunnan have produced a few new varieties and registered them with Chinese authorities. They have made few efforts to register them abroad, because they would be subject to questions about whether the new varieties are derived from ones that are already registered, in which case royalties would be owed.
38 Public grades and standards are being overtaken by the private grades and standards imposed by the large supermarkets and processors, which introduce sophisticated quality assurance systems to document seed procurement, planting schedules, agrochemical and fertilizer use/storage, personal hygiene practices, and so on.

50 AIR FREIGHT: A MARKET STUDY WITH IMPLICATIONS FOR LANDLOCKED COUNTRIES
Kenya has a well-established trade in fruit and vegetable. It has a strong trade in off-season vegetables such as peppers, especially to the UK and all-season exports of green beans and specialty Asian vegetables to the EU. Exports grew at 9 percent per year in the first decade following independence, then at 17 percent per year from 1974-1983 but then slowed to about 4 percent during the 1980s and 1990s. In 2003, exports totaled $260 million, or 15 percent of Kenya’s total exports. In recent years, there has been increasing competition for the market for tropical and sub-tropical fruits in Europe and the Middle East from suppliers in North Africa, especially Egypt and Morocco. Most of their exports are shipped by ocean with shorter transit times than Kenya. Because of difficulties in organizing timely shipments by sea, has been unable to secure a significant share of this market. Even in its traditional trade in green beans, exports from Morocco, Egypt, Senegal and Zambia have gained market share. All but Zambia have lower freight rates, either by air which is about $0.75/kg for Morocco or sea which is about $0.20/kg for Egypt. Since Kenya already enjoys highly competitive airfreight services, the competitive situation in unlikely to change. In order to improve margins, Kenya has focused on UK markets, where there is less competition from North African suppliers. It also sought to maintain competitive advantage by focusing on products that have higher standards, SPS and others, by increasing variety and product differentiation, and by shipping direct to the major supermarket chains. This meant introducing a wide range of chilled, prepared food products and a diversity of fruits and vegetables. It also meant exporting vegetables as higher value products including mixed salads and cut vegetables for stir-fry mixes. This value-added processing contrasts with fruits and cut-flower export sectors, which have relatively little processing other than grading, packing, and labeling. This resulted in a change from trading operations to integrated food processing. 39
This required investments in facilities and systems to produce higher value pre-packed produce. The top five exporters in Kenya now control more than ¾ of fresh vegetable shipments. Kenya's largest horticultural exporter, Homegrown, is vertically integrated with 90 percent of its crops grown on its own farms. It controls the logistics from farm to market including the packing plant, airfreight (through a joint venture) and a dedicated distributor based in the UK. It has recently completed a factory for prepared salads.
These strategies tripled the average FOB value of Kenya’s vegetable exports (2003 $2.9 per kg versus 1993 $1.0 per kg). They also shortened shelf life requiring a dramatic increase in the use of airfreight. By specializing in premium end of the market, the proportion of costs associated with transport has declined. By combining the processed fresh vegetables with the higher value beans, Kenyan exporters were able to get better airfreight rates. The cost of airfreight for green beans and Asian vegetables from Kenya to European market is between $1.50 and $1.60/kg. Kenya's development has been enhanced by an open and competitive market for airfreight, duty free inputs and outputs, and liberalized foreign exchange markets. Kenyan Airways is important in maintaining competitiveness because other carriers operating in North Africa, most notably Egypt Air, have spare capacity on the northbound routes and can offer lower airfreight rates.
39 The remaining option for improving competitiveness is improving the logistics associated with retailing but this is unlikely since a major of the exports are already sold direct to large food chains.

Case studies 51
Fish Exports
Exports of seafood have many of the competitive affecting air transport of perishables. The first is the improvements in freezing technology, which has led to a redefinition of what is fresh fish. The second is improvements in cold chains including refrigerated containers, which allow shipment of frozen goods by ocean without deterioration. The third is the competition for smaller airfreight shipments of fresh seafood between scheduled air freighter services and passenger services which offer services to the final destinations but with transfer through hub airports. The trade in seafood has changed significantly with the development of cold chains from boat to processing plant, freezer and then refrigerated containers. Improved techniques for freezing seafood allows processing plants to prepare the seafood in a form that is ready for display at the supermarkets and also ready for cooking. These changes have allowed exporters to extend their markets for frozen fish, which continues to be shipped by sea because of price competition. Airfreight is used primarily for fresh seafood (chilled or live). For these, perishability requires less than one day from the processing plant to the wholesale market and another day to the restaurant or dinner table. The major markets for fresh fish are the OECD countries. Because of the short transit times, Latin America is the main supplier for North America; Africa and the Middle East are the principal sources for the EU countries; and Southeast Asia is the primary source for Japan and Korea. Some longer supply chains have been introduced as a result of the introduction of long-haul flights between Asia and Europe and North America. These supply restaurants, which have become major buyers of the more “exotic” species. In order to maintain cold chains, air shipments of fresh seafood need to be delivered close to time of departure. Where the seafood is carried on passenger aircraft, there is the additional problem to ensure that the aircraft is not delayed in taking off. If the route involves a change in aircraft or significant time on the ground at an intermediate stop, this can also compromise the cold chain. In
Figure 5-8. Kenya horticultural/floricultural exports by product category
Source: From Challenge to Opportunity, IBRD

52 AIR FREIGHT: A MARKET STUDY WITH IMPLICATIONS FOR LANDLOCKED COUNTRIES
order to minimize this problem, airlines now offer “tail to tail” service where cargo is moved directly from one plane to another. This also improves transit times and reduces handling costs. Tanzania Tanzania exports seafood to the E.U. This is predominantly West Nile Perch, which was introduced into Lake Victoria in the 1950s and 1960s. 40 About 2/3 of the West Nile perch are shipped fresh by air. Tanzania exports about 22,000 tons of fresh and frozen fillets worth $77 million. About 80 percent is sold to Europe and the rest to the Asian market. 41
The volume shipped has fluctuated (Figure 5-9) due to problems of supply, which requires the government to set quotas. There have also been problems with cholera outbreaks. In spite of these setbacks, the industry has flourished, and seven large-scale fish factories have been established. The two main competitors are Uganda and Kenya, which are also located on the lake. Tanzania has about 60 percent market share for this trade.
The fish are caught by individual fisherman as well as commercial fishing operations. Air shipments of 3–5 tons shipments are transported either to Mwanza or Nairobi. The cargo is driven from the factories and loaded at night for next morning delivery. For Mwanza, chartered aircraft are used. These are costly because the short runway restricts operations to older, smaller aircraft. Shipments through Kenyatta International Airport incur a higher land transport cost but the airfreight rates are lower. However, there is competition for the space on passenger aircraft especially during the peak seasons for shipments of flowers and vegetables. There are scheduled airfreight services but they are destined to Brussels, Liege, and Ostend and require transshipment for the final destinations in Spain, Italy and Germany. There are relatively few shipments large enough to justify chartering a larger airfreighter. The overall cost of transport to the market is estimated to be about $1 per kilogram.42
Ecuador The Ecuadorian seafood trade is well established. It is a major exporter to North America shipping around 90,000 tons per year. Its location at the northwestern tip of South America near the intersection of the cold Humboldt with the warmer El Nino currents provides large amounts of Skipjack, Albacore, and Yellow Fin Tuna. In the late 1980s Ecuador modernized it fleets and nets.43 In addition to ocean fish, there are shrimp farms in the warm waters of the Bay of Guayaquil. The latter have made Ecuador the world’s biggest shrimp exporter, after overtaking Mexico in 1986,44
40
and fresh
http://www.globefish.org/index.php?id=2405&easysitestatid=87650286. This site has an extensive analysis of
East African exports of Wes Nile Perch to Europe, and is used widely in this summary. 41 General Overview 2004/2005 at http://www.mwanza.de/mwanza/Mwanza%20CITY%20PROFILE%202004%20en.html 42 Globefish.org http://www.globefish.org/index.php?id=2405&easysitestatid=87650286 43 http://www.mongabay.com/reference/country_studies/ecuador/ECONOMY.html 44 Ibid.
Figure 5-9. Tanzania seafood export to EU
Source: ITC
$-
$10
$20
$30
$40
$50
$60
$70
$80
2001 2002 2003 2004 2005
Mill
ions
US
$
Case studies 53
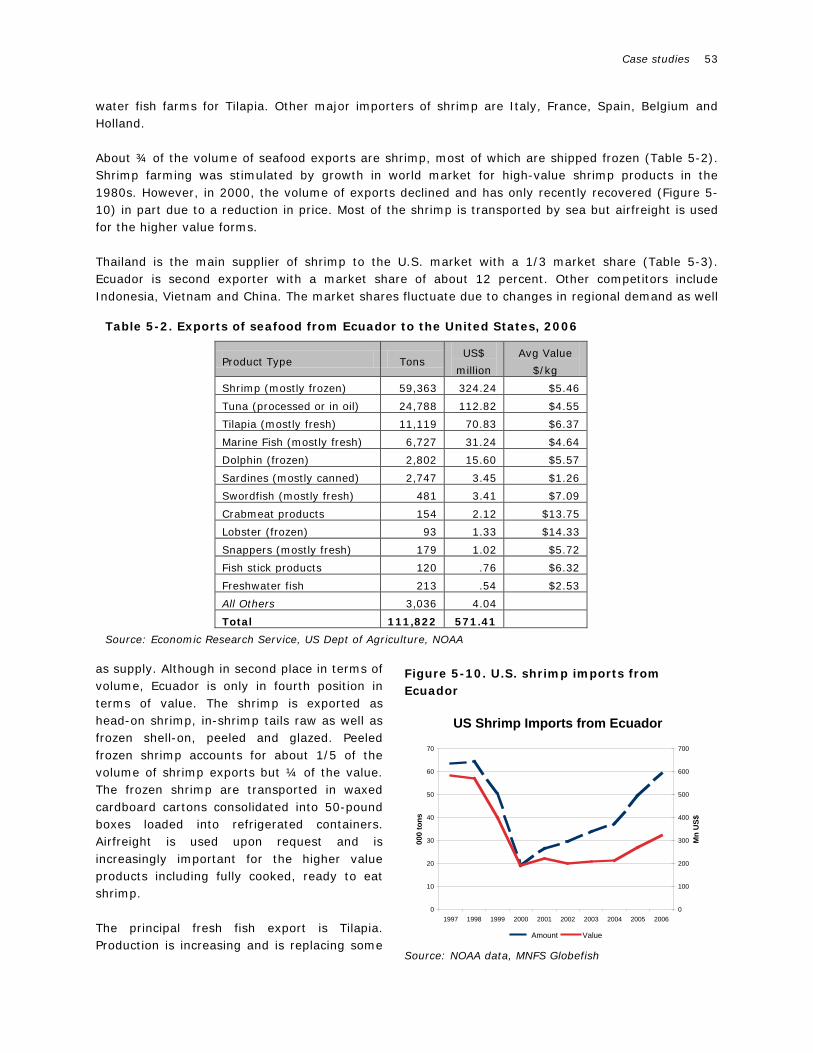
Figure 5-10. U.S. shrimp imports from Ecuador
Source: NOAA data, MNFS Globefish
US Shrimp Imports from Ecuador
0
10
20
30
40
50
60
70
1997 1998 1999 2000 2001 2002 2003 2004 2005 2006
000
tons
0
100
200
300
400
500
600
700
Mn
US$
Amount Value
water fish farms for Tilapia. Other major importers of shrimp are Italy, France, Spain, Belgium and Holland. About ¾ of the volume of seafood exports are shrimp, most of which are shipped frozen (Table 5-2). Shrimp farming was stimulated by growth in world market for high-value shrimp products in the 1980s. However, in 2000, the volume of exports declined and has only recently recovered (Figure 5-10) in part due to a reduction in price. Most of the shrimp is transported by sea but airfreight is used for the higher value forms. Thailand is the main supplier of shrimp to the U.S. market with a 1/3 market share (Table 5-3). Ecuador is second exporter with a market share of about 12 percent. Other competitors include Indonesia, Vietnam and China. The market shares fluctuate due to changes in regional demand as well
as supply. Although in second place in terms of volume, Ecuador is only in fourth position in terms of value. The shrimp is exported as head-on shrimp, in-shrimp tails raw as well as frozen shell-on, peeled and glazed. Peeled frozen shrimp accounts for about 1/5 of the volume of shrimp exports but ¼ of the value. The frozen shrimp are transported in waxed cardboard cartons consolidated into 50-pound boxes loaded into refrigerated containers. Airfreight is used upon request and is increasingly important for the higher value products including fully cooked, ready to eat shrimp. The principal fresh fish export is Tilapia. Production is increasing and is replacing some
Table 5-2. Exports of seafood from Ecuador to the United States, 2006
Product Type Tons US$
million Avg Value
$/kg
Shrimp (mostly frozen) 59,363 324.24 $5.46
Tuna (processed or in oil) 24,788 112.82 $4.55
Tilapia (mostly fresh) 11,119 70.83 $6.37
Marine Fish (mostly fresh) 6,727 31.24 $4.64
Dolphin (frozen) 2,802 15.60 $5.57
Sardines (mostly canned) 2,747 3.45 $1.26
Swordfish (mostly fresh) 481 3.41 $7.09
Crabmeat products 154 2.12 $13.75
Lobster (frozen) 93 1.33 $14.33
Snappers (mostly fresh) 179 1.02 $5.72
Fish stick products 120 .76 $6.32
Freshwater fish 213 .54 $2.53
All Others 3,036 4.04
Total 111,822 571.41
Source: Economic Research Service, US Dept of Agriculture, NOAA

54 AIR FREIGHT: A MARKET STUDY WITH IMPLICATIONS FOR LANDLOCKED COUNTRIES
of the shrimp production. Ecuador produces around 2 percent of the world’s tilapia, about 30,000 tons. About 95 percent of this is sold to the U.S. market and the rest to Colombia and other smaller markets. The exports account for about 12 percent of total seafood exports but faces stiff competition from China, which has about a 70 percent market share.
Table 5-3. United States shrimp imports by source
January-Sept 2006 January-Sept 2007
tons US$ tons US$
Thailand 130,444 840 132,347 855
Ecuador 45,491 251 46,532 239
Indonesia 45,938 335 44,281 338
China 45,343 214 34,372 164
Vietnam 25,373 298 27,665 335
Mexico 10,600 107 17,014 147
India 20,624 187 15,623 146
Bangladesh 14,188 133 12,268 126
Other 63,385 391 61,857 339
Total 401,386 2,756 391,959 2709
Source: NMFS Globefish
Electronics Exports
Much of the modern electronics manufacturing industry is built around supply chains that use airfreight to move intermediate goods between the points of manufacture, assembly, and customization, and to distribute final goods and provide after-sales service. This is especially true for the just-in-time logistics that typify the production of semiconductors, computer equipment, measuring devices and high value consumer electronics. The ASEAN region has developed a regional electronics industry. Singapore was a major production center for the semiconductor industry up until the 1980s when it shifted out of lower value-added assembly operations. It remains an important center for wafer fabrication but otherwise focuses on sales, distribution, and after-sales service taking advantage of its role as an airfreight hub.45
45 The complexity of air cargo services in the electronics industry has been academically researched. Of note is an
article written for the Journal of Economic Geography in 2002 by Thomas R. Leinbach of the University of Kentucky and John T. Brown, Jr. of University of Wisconsin at Oshkosh, titled “Air cargo services and the electronics industry in Southeast Asia.” The paper will be cited extensively in this section.
Figure 5-11: Southeast Asia air cargo hubs
Source: Air Cargo: Growth and Issues, Thomas R. Leinbach, Department of Geography, University of Kentucky

Case studies 55
Malaysia’s electronics industry is dominated by semiconductor manufacturing, followed by some component manufacturing for computer parts and peripherals. Many of the semi-conductor companies originally went to Malaysia in the 1970s to take advantage of a low-cost labor force. They remained and as labor costs rose moved into both large wafer fabrication and cutting and processing of chips. The industrialization of Penang began in the 1960s. After Singapore, it was the obvious site for operations of American technology firms. The Penang Development Corporation, formed in November 1969, established a Free Zone in Bayan Lepas, which attracted Advanced Micro Devices, Agilent Technologies, Clarion, Fairchild Semiconductor, Hitachi Semiconductor, Intel, Osram Opto Semiconductors and Robert Bosch. In the 1980s, small and medium-sized industries were established to support these companies. In the 1990s there was a surge in research and development enterprises. The choice of Bayan Lepas for the free zone development was dictated by three key factors:
• proximity to the air cargo terminal to reduce trucking time/distances from the factory (for security reasons as the cargo was mostly classified as sensitive),
• integrated development with the free zone to accommodate the housing and commercial development, and
• proximity to the proposed Penang bridge which would provide ready access to the container port on the mainland (Butterworth).
With the expansion of the free zone, there was a parallel growth in the air freighter services and warehousing. Bayan Lepas airport became an international freight hub. The air cargo facility was expanded into a modern air cargo complex managed by the national airline (MAS). After 20 years, the demand grew to justify a second air cargo terminal operated by a private operator. A significant portion of the cargo is carried as belly cargo but there are scheduled freight services with FedEx providing direct connections to U.S. West Coast and the Asia Pacific region. In addition, MASkargo offers direct freight flights from Penang to key markets such as Europe, Japan and China. Initially MAS operated the ground handling services and air cargo facilities but this was transferred to the Malaysian Airport Company. The growth in electronics was, in many ways, the beginning of the rapid growth in Malaysia’s exports of manufactured goods. These continue to be moved primarily by sea through the regional transshipment ports including Port Kelang. Higher value exports to Europe and North America, as well as the re-export trade with East Asia tend to be moved through air transport (Table 5-4). Sea-air services
The integration of air and sea transport for cargo movements was developed as a means to balance transit time and cost for shipments from Asia to Europe and North America. It began in the 1960s when Air Canada sought to fill spare capacity on its West Coast flights. It transported cargo arriving by sea in Vancouver from Yokohama and continuing on by air to Montreal and Toronto and from there to Europe. This attracted cargoes that required shorter transit times than offered by westbound all-water routes, such as photographic equipment. The success of this route led other west coast ports,
Table 5-4. Malaysian exports by destination
Country 000 tons
(2005)
Share of Total
World 48,159 100.0%
USA 11,352 23.6%
Singapore 9,207 19.1%
Hong Kong 5,919 12.3%
Japan 3,591 7.5%
China 3,101 6.4%
Netherlands 1,539 3.2%
Taiwan 1,384 2.9%
Others 12,066 22.1%
Source: Department of Statistics, Malaysia, External Trade Division

56 AIR FREIGHT: A MARKET STUDY WITH IMPLICATIONS FOR LANDLOCKED COUNTRIES
including Seattle and Los Angeles, to compete for cargo, especially from Korea. Traffic on this route eventually reached about 50,000 tons but began to decline in the mid 1980s when new routes were developed through Dubai. The westbound sea-air service through Dubai utilizes Singapore as the shipping hub for goods shipped from East and South Asia. Containerized cargo is transported by sea to Dubai in 11–12 days. The containers are then removed from the vessel, the cargo stripped from the boxes, transported to the airport and loaded onto palettes for shipment by air to Europe. This transfer can be done in as little as 4 hours from the time the vessel arrives until the plane took off. The result is that cargo from Singapore can be at its final European destination within 14 days, effectively providing a two week delivery time for goods stored in Singapore and a 1½–2 month order cycle for reorders of goods from the manufacturer. At the same time, the cost is about ½ that of all-air shipments. This service attracts garments, electronics and other consumer goods that do not have the high-value, short shelf life of air freighted cargo. This traffic had already reached at 50,000 TEU (about 0.4 million tons) by the early 1990s. The frequency of air and ocean services and simplified administrative procedures have also allowed Dubai to attract sea-air traffic from the Far East (mainland China and Taiwan) and the Indian subcontinent (India and Sri Lanka) for shipments to Europe, Africa and the states of the former USSR. The success of Dubai led to competition from other airports in the United Arab Emirates, most notably from the airport in neighboring Sharjah. However, Dubai retains its dominant position because of the frequency of both air and sea services. At the end of the 1990s, Korean Air launched a new sea-air service together with Hanjin Shipping for goods originating in China. This service utilizes container feeder services linking Tianjin, Shanghai, Qingdao, Dalian, and Weihai with the transshipment ports of Busan and Incheon. From there, the cargo is transported in bond to the nearby Incheon International Airport for both eastbound and westbound flights. However, the benefits of this service are gradually being eclipsed as the ports and airports in China develop faster direct services. The Sea-Air services remain a niche business providing an attractive balance of time and cost for mid-value cargoes. At the same time, they are under constant competitive pressure from faster ocean services, such as the express services between China and Europe, and from improved management of supply chains. So far, the successful examples have been those serving major east-west trade routes, but there is potential for introducing this service on lower volume routes, especially between Africa and North America utilizing Dakar or a similar hub for the intermodal transfer. Similar opportunities exist for connections between Central Asia and Africa via the Gulf, as well as connections between South America and Europe. The greatest challenge is not to establish the airfreight services but to develop the efficient transfer operations, which, like air courier services, have simplified administrative and customs procedures. A variation on the Sea-Air service is Air-Sea combinations operating over shorter distances. These are often informal intermodal connections used to overcome specific shipping problems. In the case of South and Southeast Asia, this arrangement is used to compensate for delays in production that cause the normal shipping date to be missed. The air component is used to catch up with the scheduled vessel at a subsequent point on its route. Another option is the use of air to overcome unreliable land transport including cross-border movements used to reach gateway ports.

Case studies 57
Air express services
The activity of air courier services has grown rapidly over the last few decades. They began as express services carrying small packages and taking market share away from traditional postal and road-based courier services. However, as their volumes grew, they increased the size of shipments that they carried. The larger carriers such as DHL and FedEx acquired road haulage and airfreight companies allowing them to expand their presence in the traditional air cargo market. As the same time they expanded into multimodal transport and integrated logistics. These efforts have resulted in a quadrupling of volume over the last 15 years (Figure 5-12) and a doubling of market share (Figure 5-13). The growth of these companies was supported by a rapid expansion in both the range of services offered and the geographical areas served. Their success led to the development of national courier services, which replicated their business model. Some, such as EMS in Southeast Asia, developed through a consortium of national postal services, but in larger markets such India and China multiple private services developed combining road and air transport. In this regard, the histories of DHL and Blue Dart are informative. DHL was established in 1969 in San Francisco primarily as a forwarding company providing express services for documents sent from the U.S. West Coast to Far East and Pacific Rim countries. After ten years, it expanded its services to include packages and extended its service area to the Middle East and Africa. It continued to focus on logistics and utilized space on commercial airlines, especially scheduled passenger services. By 1985 it had established a major sorting hub in Brussels handling more than 165,000 shipments daily. In the 1990s, it expanded its presence in the Middle East by establishing a hub in Bahrain and obtaining contracts for shipment of essential goods. This traffic grew rapidly as a result of regional conflict and subsequent reconstruction. Currently, DHL serves this region through two hubs, Dubai and Bahrain, offering more than 30 flights per day, operating a large fleet of trucks and maintaining strategic parts centers in Bahrain, Dubai, Abu Dhabi, Kuwait, Riyadh, Jeddah and Dhahran. It operates its own aircraft but continues to rely on scheduled services for most of its traffic so that its fleet is much smaller than that of its competitors.
Figure 5-12. Volume of air express traffic
Source: International Air Freight and express Industry Performance Analysis, ACMG 2006
Volume of Air Express Traffic
150
250
350
450
550
650
750
850
1992 1994 1996 1998 2000 2002 2004 2006
Ann
ual V
olum
e (m
illio
n sh
ipm
ents
Figure 5-13. Market share of air couriers
Source: Boeing
Market Share of Air Couriers
0.0%
2.0%
4.0%
6.0%
8.0%
10.0%
12.0%
14.0%
1991
1992
1993
1994
1995
1996
1997
1998
1999
2000
2001
2002
2003
2004
2005
% o
f RTK
s
58 AIR FREIGHT: A MARKET STUDY WITH IMPLICATIONS FOR LANDLOCKED COUNTRIES
Like the other major integrators, DHL’s rapid growth has been through a series of acquisitions. These include major freight and contract logistics companies such as:
• Air Express International – U.S. international forwarder (1999, $1.14 billion), • Danzas – international freight forwarder (1999), • ASG – Swedish Logistics (1999), • Nedlloyd Logistics – European express services (2000), • Airborne express – U.S. trucking operations (2003, €983 million), • Exel – international logistics (2005, €5.5 billion).
DHL itself was acquired by Deutsche Post in 2002. The brand name has been maintained with the other services being integrated into DHL Global. In 2005, DHL acquired an 81 percent stake in the Indian courier service Blue Dart though its subsidiary DHL Express (Singapore) Pte for Rs.5.56 billion ($128 million). Blue Dart was established in 1983 to provide both domestic and international shipments using available airline services. In 1994, the company became Blue Dart Aviation through an IPO, which allowed it to acquire its own aircraft. By 2001, the company’s turnover exceeded Rs1 billion. Though acquired by DHL, it continues to operate as an independent brand.46
In 2006, it expanded its air cargo capacity by 50 percent through the acquisition of two Boeing 757 airfreighters (Figure 5-14) to complement its fleet of four Boeing 737’s. An additional 757 was added in 2007. The fleet continues to operate with load factors in excess of 90 percent and transports up to 250 tons per day on a total of 60 routes. It operates out of six hubs: Delhi, Mumbai, Chennai, Kolkata, Bangalore and Ahmedabad. In its larger hubs, the company has 15-30 thousand square meters of warehousing for sorting and storage
The company operates a few international flights but relies primarily on connections through DHL and other commercial airlines. It also outsources a small portion of its shipments, most notably those to Sri Lanka, Bangladesh and the Maldives. The company’s market share of the domestic air courier business is about 42 percent but only about 6 percent for ground express services where it faces formable competition.47
Its current plans are to dramatically improve its ground transport capacity through a $250 million investment to expand its network, upgrade its vehicle fleet, acquire additional warehousing and ground handling equipment for the airports and add to its 15,000 service centers
At present, the major of shipments are documents and samples, but with the improved capacity and network, the company will have opportunities for handling larger shipments of air cargo. For this purpose it will target the organized retail sector as well as the growing number of SEZs and IT parks. The company has substantial potential for growth as the volume of airfreight in India is in excess of ½ million tons of freight handled at domestic airports and almost 1 million tons at its international airports. The traffic at the major airports has shown steady growth over the last decade (Figure 5-15) and is likely to accelerate with the growth in the economy and reform in the transport sector.
46 There are similar tie-ups between UPS and Jet Airways and FedEx and Prakash Airfreight. 47 For ground express services, Blue Dart faces formidable competition from two local companies Gati and
Safexpress

Case studies 59
Viracopos Airport (VCL)
The Viracopos Airport in Brazil is a single runway facility located about 90 kilometers northwest of Sao Paulo in the Campinas area. The second-largest airport in terms of air cargo, it handled about 172,000 tons in 2004, a third of Brazil’s airfreight imports and nearly 40 percent of its exports.48
The airport is open all but 5–8 days a year. Originally an international passenger airport, it was converted to a cargo airport in 1985, when the passenger flights were rerouted to Guarulhos Airport which is nearer to Sao Paulo, Brazil’s busiest airport.
The conversion to a cargo airport was possible because of the demand from the surrounding electronics industry. As much as 90 percent of inputs for these companies was brought in by air. There was also a concentration of instrumentation manufacturers, including aircraft instruments. The airport participated in a successful pilot program for streamlining customs clearances in the late 1990s. The improved efficiency of customs was important for the local industries and also was a factor in attracting UPS to serve the airport. Infraero, the government-owned airport holding company, has made extensive investments in the airport ($87 million from 2002–2007) in order to develop a regional cargo hub not just for Brazil but also for all of Latin America. A second, longer runway is planned for the airport. The rise of the electronics industry in Brazil, just as in Southeast Asia, is linked to the existence of the airport. Campinas is a center for both semiconductor and electronic data processing manufacturing. The industry, developed in the 1970s, relied heavily on imported materials and components. While final products were targeted primarily for domestic consumption, the infrastructure for the logistics supply chain limited imports and therefore production. In 1998, Customs introduced a special line that allowed accredited firms to declare goods prior to arrival and to reduce the number of inspections. In the same year, UPS introduced a dedicated five-day-a-week express delivery service to and from the Mercosur region via Viracopos Airport in partnership with Challenge Air Cargo. In 2003, FedEx
48 In 2003, the airport handled 21 thousand tons of domestic cargo, 63 thousand tons of exports and 75 thousand
tons of imports
Figure 5-15. Air cargo tonnage
Source:
Air Cargo Tonnage
-
200
400
600
800
1,000
1,200
1,400
1996 1997 1998 1999 2000 2001 2002 2003 2004 2005Fiscal Year
International Domestic
Figure 5-14. Blue Dart 757 airfreighter
Source: Blue Dart website

60 AIR FREIGHT: A MARKET STUDY WITH IMPLICATIONS FOR LANDLOCKED COUNTRIES
expanded its bonded sorting facilities in the airport to 2,000 sq. m. In 2007 Infraero invested about $67 million to build a new express cargo terminal. Dubai Cargo Handling Facilities
Dubai International Airport is one of the fastest growing passenger and cargo airports in the world. Since the establishment of its cargo village (Figure 5-16) in 1991, it has experienced double-digit growth in import, export and transshipment cargo. In 2007, it handled a total of 1.66 million tons. The cargo village occupies some 30 ha and has seven terminals as well as an office building for the airlines and 17 aircraft parking stands. Among its facilities are the Main Cargo Terminal with ground area of about 25,000 sq. m. and 56 truck docks and an annual capacity in excess of 400,000 tons, and the Emirates Sky terminal with 28 truck docks and an annual capacity of 350,000 tons. The most recent addition is the multi-storey Cargo Mega Terminal (Figure 5-17) with capacity of 1.2 million tons and footprint of about 36,000 sq. m. The building has three levels: the ground floor has a clearance of 12 meters for processing export and import cargo, the second floor has a clearance of 8 meters to be used for transshipment cargo, and the third level has a 4.5 meters for a ULD repair workshop and storage for empty ULDs (unit load device), wooden pallets, timber spreaders. There are plans to expand the Mega terminal by adding two additional buildings. Another addition to Dubai’s cargo handling facilities is the recently constructed flower center with a 10,000 sq. m. footprint and 3 levels modeled on a similar facility in Amsterdam. The target market was producers from East and West Africa but efforts are now being made to attract shipments from South and Central Asia. It was built to handle both imports and transshipment. The warehouse also provides facilities for preparation of floral arrangements. In order to make better use of its 150,000 ton annual capacity, the facility can also be used for handling other perishables. Among the activities that are supported are consolidation/repackaging for transshipment; pre-assembly of product lines sourced from around the world; pack house for fruit and vegetable and value-added services, for example bouquet making. The DFC has specialized facilities including laboratories, quality control operations, customs inspection, break and build areas and specialized cool-storage chambers. There are refrigerated dollies to transfer palettes between the DFC and
Figure 5-16. Dubai Cargo Village
Source: Google Earth
Figure 5-17. Mega Cargo Terminal
Source: Dubai Airport website

Case studies 61
aircraft, automated X-ray scanners for perishable cargoes and temperature- controlled air locks to the storage area. Customs, phytosanitary inspections and clearance services are performed on the main floor in the central handling area for import, export and transit. By 2010, the Dubai International Airport’s turnover is expected to increase to more than three million tons. Capacity will be increased to five million tons when the Cargo Mega Terminal is completed as part of the current development program. These facilities will be supplemented by the new cargo facilities at Al Maktoum International Airport adjoining the Jebel Ali Free Zone (Figure 5-18). While the first phase is only planned to handle 200,000 tons, the fully developed facility will have an annual capacity of 12 million tons.
Figure 5-18. Jebel Ali Airport layout