4_PEV Panel - Watson Collins, Eversource Energy.pdf
7
Electricity Advisory Committee Meeting: Grid Impacts of High Penetration of Plug-in Electric Vehicles Watson Collins Eversource September 29, 2016 CONFIDENTIAL & PRELIMINARY – FOR INTERNAL USE ONLY
Transcript of 4_PEV Panel - Watson Collins, Eversource Energy.pdf

Electricity Advisory Committee Meeting:Grid Impacts of High Penetration of Plug-in Electric Vehicles
Watson Collins
Eversource
September 29, 2016
CONFIDENTIAL & PRELIMINARY – FOR INTERNAL USE ONLY
CONFIDENTIAL & PRELIMINARY – FOR INTERNAL USE ONLY 2
About Eversource
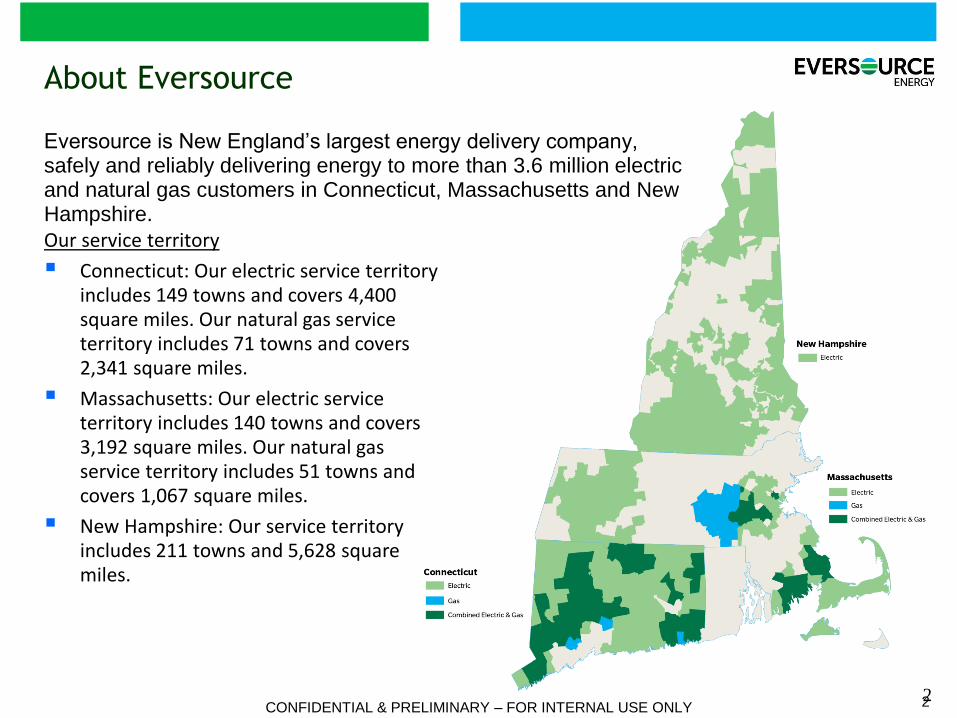
Eversource is New England’s largest energy delivery company, safely and reliably delivering energy to more than 3.6 million electric and natural gas customers in Connecticut, Massachusetts and New Hampshire.
2
Our service territory
Connecticut: Our electric service territory includes 149 towns and covers 4,400 square miles. Our natural gas service territory includes 71 towns and covers 2,341 square miles.
Massachusetts: Our electric service territory includes 140 towns and covers 3,192 square miles. Our natural gas service territory includes 51 towns and covers 1,067 square miles.
New Hampshire: Our service territory includes 211 towns and 5,628 square miles.
CONFIDENTIAL & PRELIMINARY – FOR INTERNAL USE ONLY 3
Eversource’s approach to addressing the grid
impacts of high penetration Plug-in Electric Vehicles
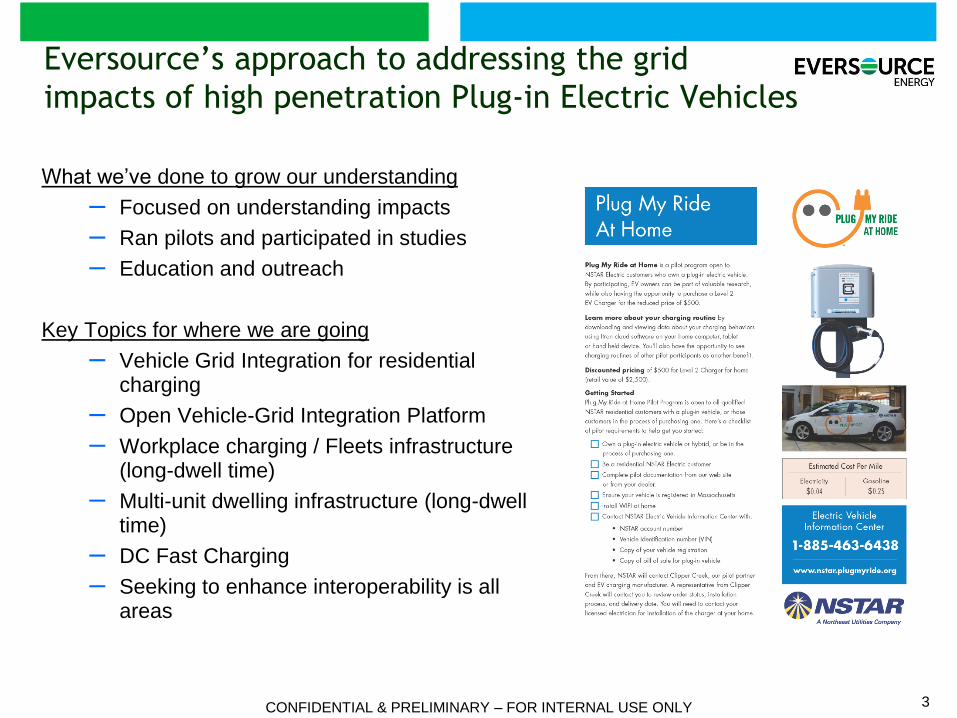
What we’ve done to grow our understanding
– Focused on understanding impacts
– Ran pilots and participated in studies
– Education and outreach
Key Topics for where we are going
– Vehicle Grid Integration for residential charging
– Open Vehicle-Grid Integration Platform
– Workplace charging / Fleets infrastructure (long-dwell time)
– Multi-unit dwelling infrastructure (long-dwell time)
– DC Fast Charging
– Seeking to enhance interoperability is all areas
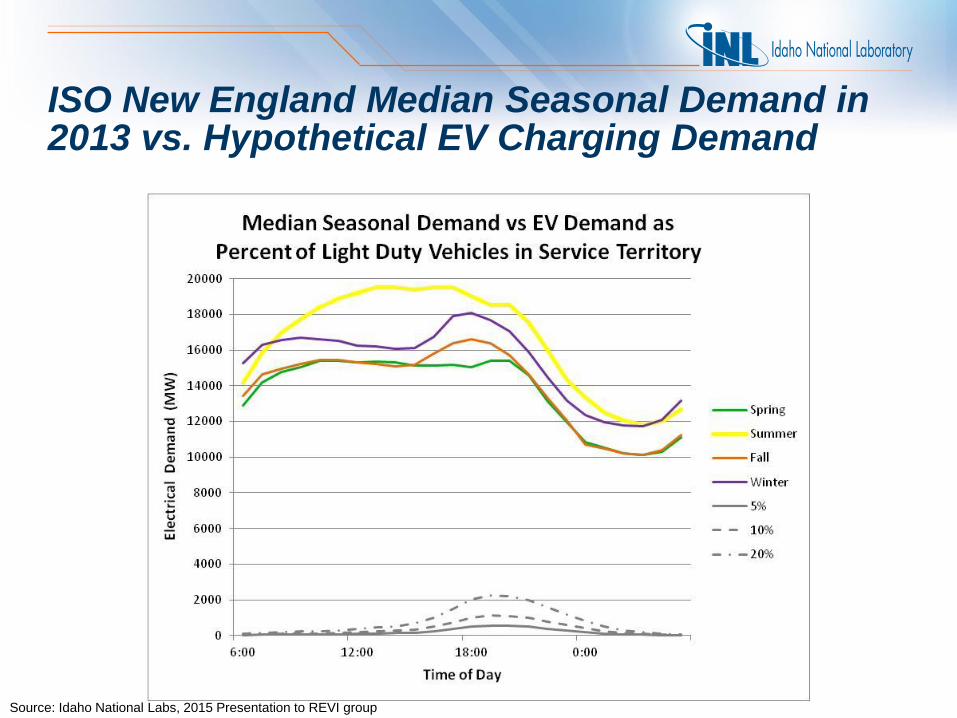
ISO New England Median Seasonal Demand in 2013 vs. Hypothetical EV Charging Demand
Source: Idaho National Labs, 2015 Presentation to REVI group
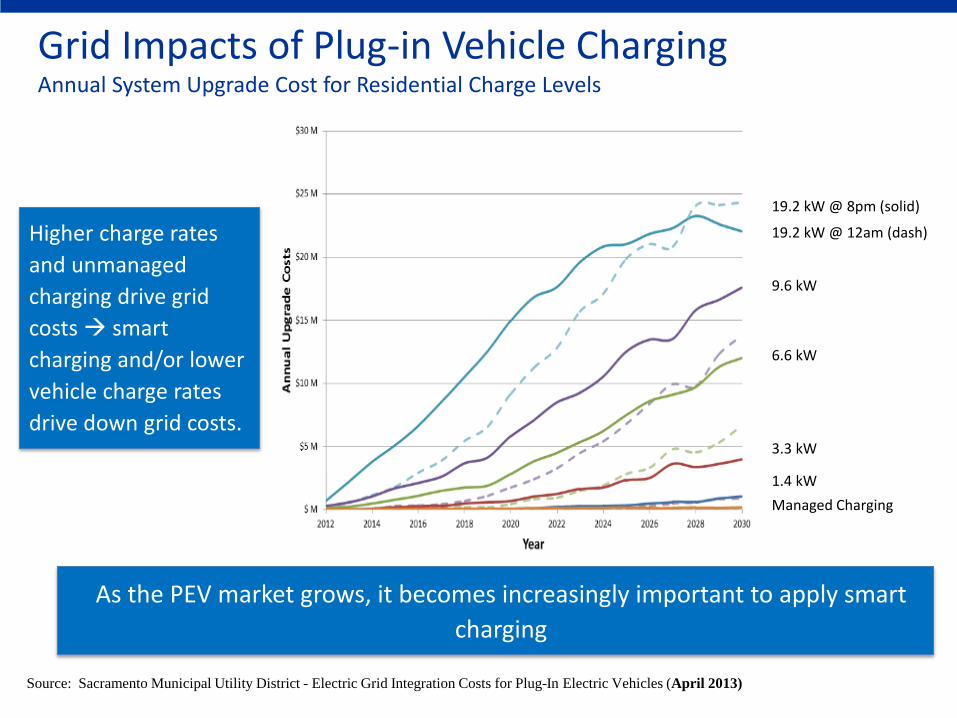
Grid Impacts of Plug-in Vehicle ChargingAnnual System Upgrade Cost for Residential Charge Levels
19.2 kW @ 8pm (solid)
19.2 kW @ 12am (dash)
Managed Charging
9.6 kW
6.6 kW
3.3 kW
1.4 kW
Higher charge rates
and unmanaged
charging drive grid
costs smart
charging and/or lower
vehicle charge rates
drive down grid costs.
As the PEV market grows, it becomes increasingly important to apply smart
charging
Source: Sacramento Municipal Utility District - Electric Grid Integration Costs for Plug-In Electric Vehicles (April 2013)
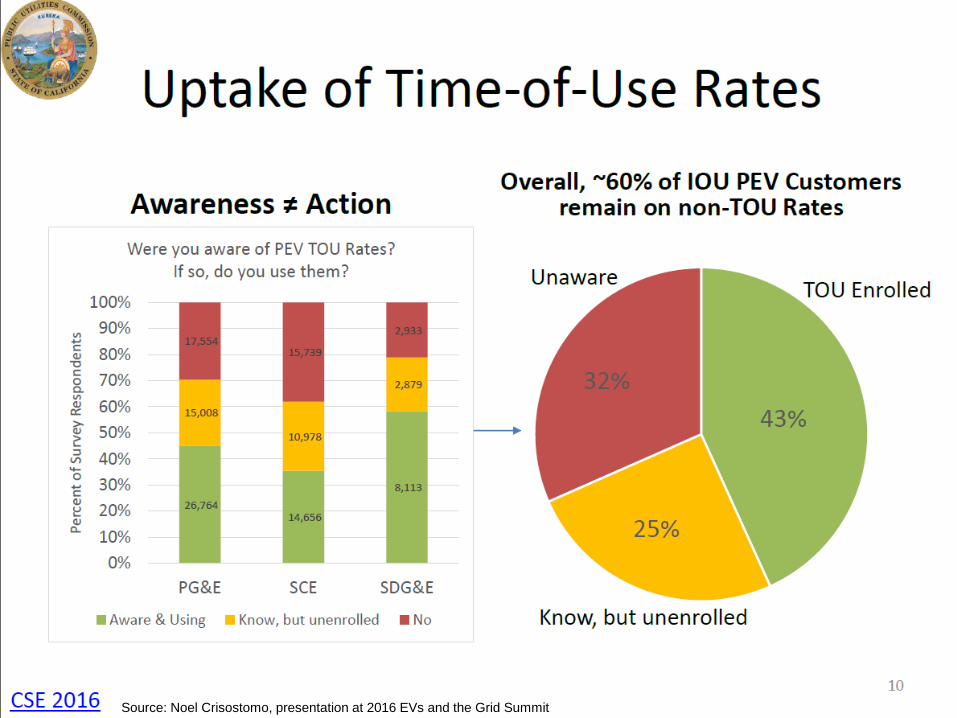
Source: Noel Crisostomo, presentation at 2016 EVs and the Grid Summit
CONFIDENTIAL & PRELIMINARY – FOR INTERNAL USE ONLY 7
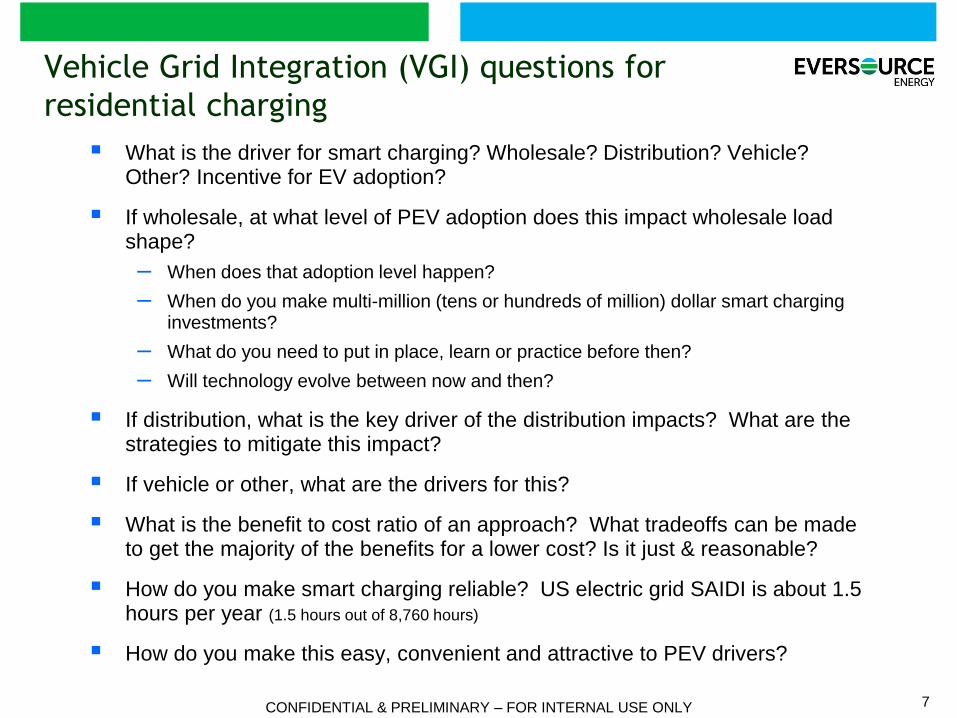
Vehicle Grid Integration (VGI) questions for
residential charging
What is the driver for smart charging? Wholesale? Distribution? Vehicle? Other? Incentive for EV adoption?
If wholesale, at what level of PEV adoption does this impact wholesale load shape?
– When does that adoption level happen?
– When do you make multi-million (tens or hundreds of million) dollar smart charging investments?
– What do you need to put in place, learn or practice before then?
– Will technology evolve between now and then?
If distribution, what is the key driver of the distribution impacts? What are the strategies to mitigate this impact?
If vehicle or other, what are the drivers for this?
What is the benefit to cost ratio of an approach? What tradeoffs can be made to get the majority of the benefits for a lower cost? Is it just & reasonable?
How do you make smart charging reliable? US electric grid SAIDI is about 1.5 hours per year (1.5 hours out of 8,760 hours)
How do you make this easy, convenient and attractive to PEV drivers?