EEI 2016 slides - Eversource
29
Eversource Energy EEI Financial Conference November 5-9, 2016
Transcript of EEI 2016 slides - Eversource
Eversource Energy
EEI Financial Conference
November 5-9, 2016
EEI FINANCIAL CONFERENCE
Safe Harbor
1
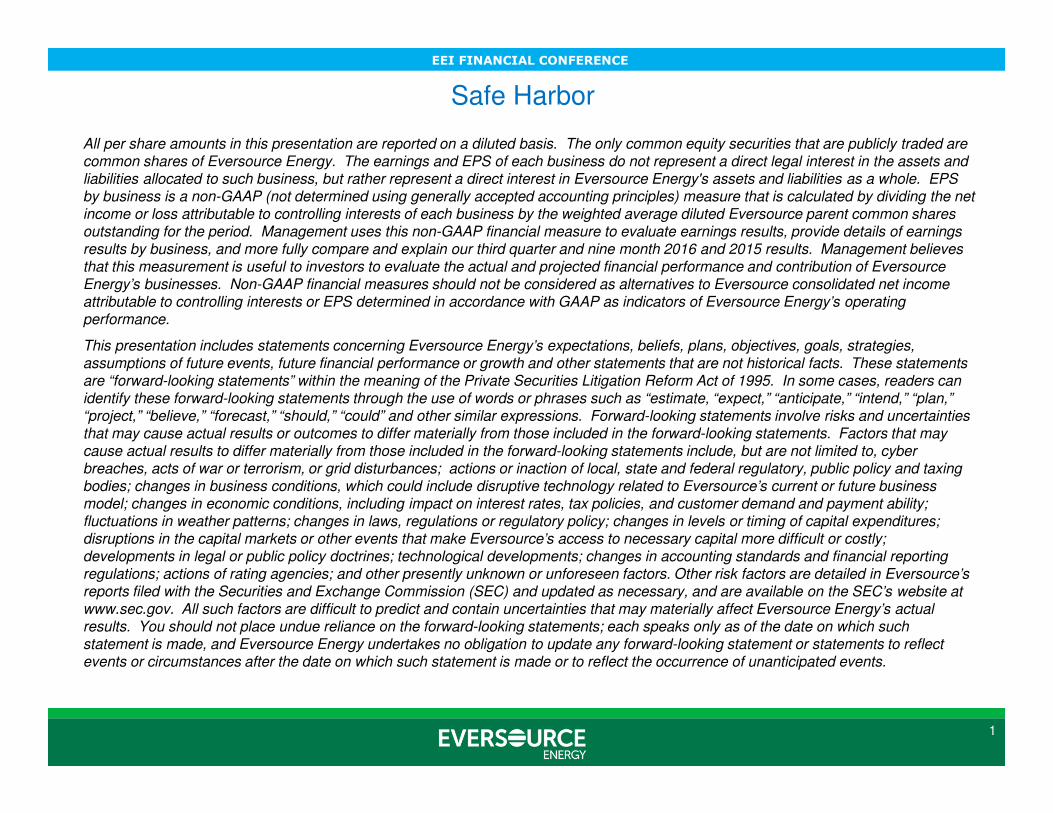
All per share amounts in this presentation are reported on a diluted basis. The only common equity securities that are publicly traded are common shares of Eversource Energy. The earnings and EPS of each business do not represent a direct legal interest in the assets and liabilities allocated to such business, but rather represent a direct interest in Eversource Energy's assets and liabilities as a whole. EPS by business is a non-GAAP (not determined using generally accepted accounting principles) measure that is calculated by dividing the net income or loss attributable to controlling interests of each business by the weighted average diluted Eversource parent common shares outstanding for the period. Management uses this non-GAAP financial measure to evaluate earnings results, provide details of earnings results by business, and more fully compare and explain our third quarter and nine month 2016 and 2015 results. Management believes that this measurement is useful to investors to evaluate the actual and projected financial performance and contribution of Eversource Energy’s businesses. Non-GAAP financial measures should not be considered as alternatives to Eversource consolidated net incomeattributable to controlling interests or EPS determined in accordance with GAAP as indicators of Eversource Energy’s operating performance.
This presentation includes statements concerning Eversource Energy’s expectations, beliefs, plans, objectives, goals, strategies, assumptions of future events, future financial performance or growth and other statements that are not historical facts. These statements are “forward-looking statements” within the meaning of the Private Securities Litigation Reform Act of 1995. In some cases, readers can identify these forward-looking statements through the use of words or phrases such as “estimate, “expect,” “anticipate,” “intend,” “plan,” “project,” “believe,” “forecast,” “should,” “could” and other similar expressions. Forward-looking statements involve risks and uncertainties that may cause actual results or outcomes to differ materially from those included in the forward-looking statements. Factors that may cause actual results to differ materially from those included in the forward-looking statements include, but are not limited to, cyber breaches, acts of war or terrorism, or grid disturbances; actions or inaction of local, state and federal regulatory, public policy and taxing bodies; changes in business conditions, which could include disruptive technology related to Eversource’s current or future business model; changes in economic conditions, including impact on interest rates, tax policies, and customer demand and payment ability; fluctuations in weather patterns; changes in laws, regulations or regulatory policy; changes in levels or timing of capital expenditures; disruptions in the capital markets or other events that make Eversource’s access to necessary capital more difficult or costly; developments in legal or public policy doctrines; technological developments; changes in accounting standards and financial reporting regulations; actions of rating agencies; and other presently unknown or unforeseen factors. Other risk factors are detailed in Eversource’s reports filed with the Securities and Exchange Commission (SEC) and updated as necessary, and are available on the SEC’s website at www.sec.gov. All such factors are difficult to predict and contain uncertainties that may materially affect Eversource Energy’s actual results. You should not place undue reliance on the forward-looking statements; each speaks only as of the date on which such statement is made, and Eversource Energy undertakes no obligation to update any forward-looking statement or statements to reflect events or circumstances after the date on which such statement is made or to reflect the occurrence of unanticipated events.
EEI FINANCIAL CONFERENCE
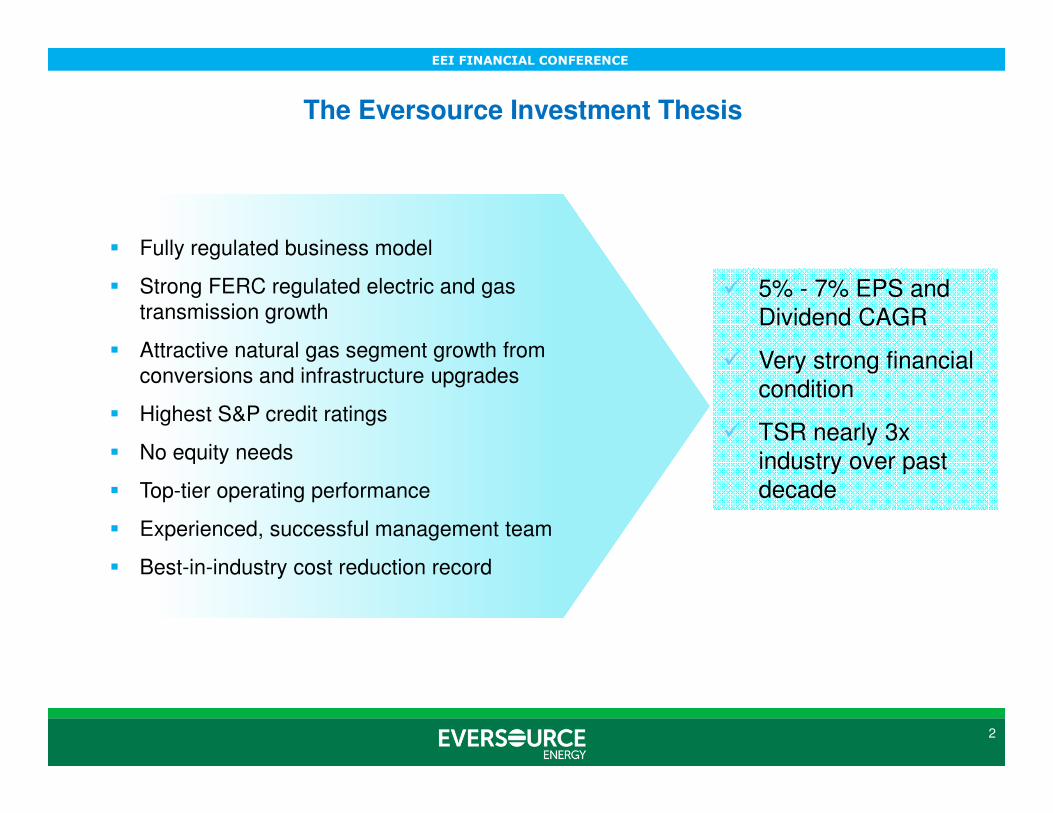
The Eversource Investment Thesis
2
� Fully regulated business model
� Strong FERC regulated electric and gas transmission growth
� Attractive natural gas segment growth from conversions and infrastructure upgrades
� Highest S&P credit ratings
� No equity needs
� Top-tier operating performance
� Experienced, successful management team
� Best-in-industry cost reduction record
� 5% - 7% EPS and Dividend CAGR
� Very strong financial condition
� TSR nearly 3x industry over past decade
EEI FINANCIAL CONFERENCE
3
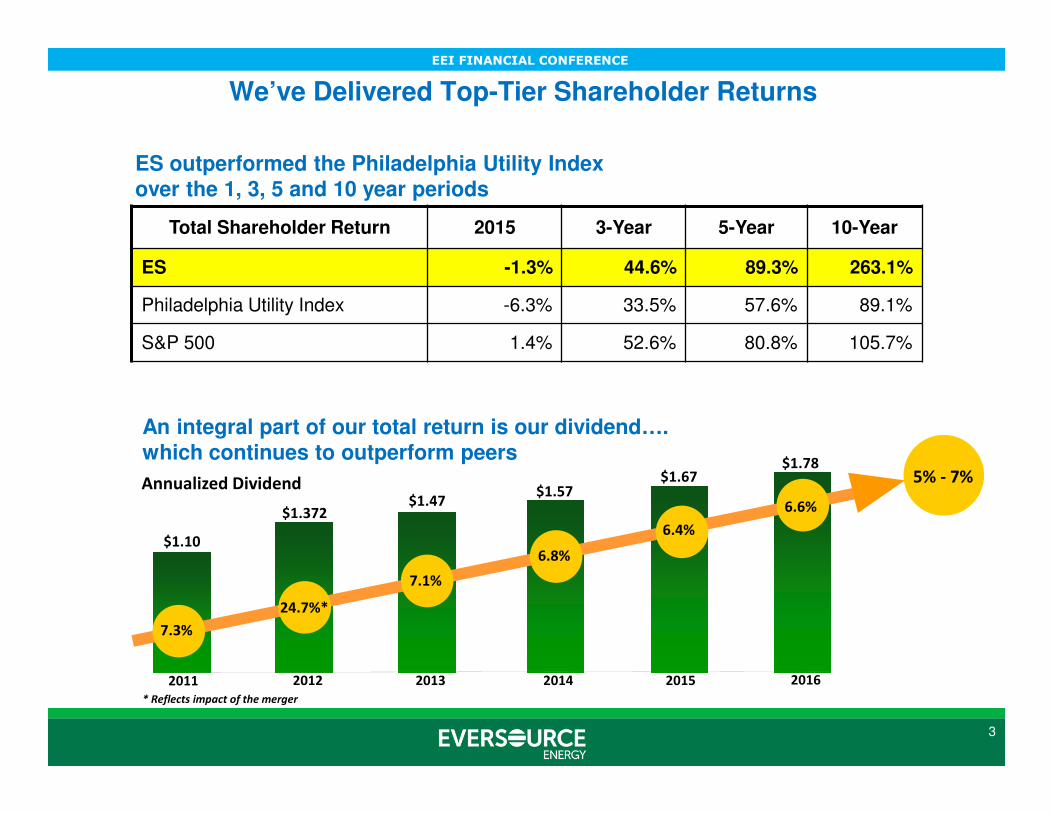
Total Shareholder Return 2015 3-Year 5-Year 10-Year
ES -1.3% 44.6% 89.3% 263.1%
Philadelphia Utility Index -6.3% 33.5% 57.6% 89.1%
S&P 500 1.4% 52.6% 80.8% 105.7%
We’ve Delivered Top-Tier Shareholder Returns
ES outperformed the Philadelphia Utility Index over the 1, 3, 5 and 10 year periods
An integral part of our total return is our dividend…. which continues to outperform peers
$1.10
$1.372
$1.57$1.47
2011 20132012 2014
Annualized Dividend
2015
* Reflects impact of the merger
$1.67 5% - 7%$1.78
2016
7.3%
24.7%*
7.1%
6.8%
6.4%
6.6%
EEI FINANCIAL CONFERENCE
4
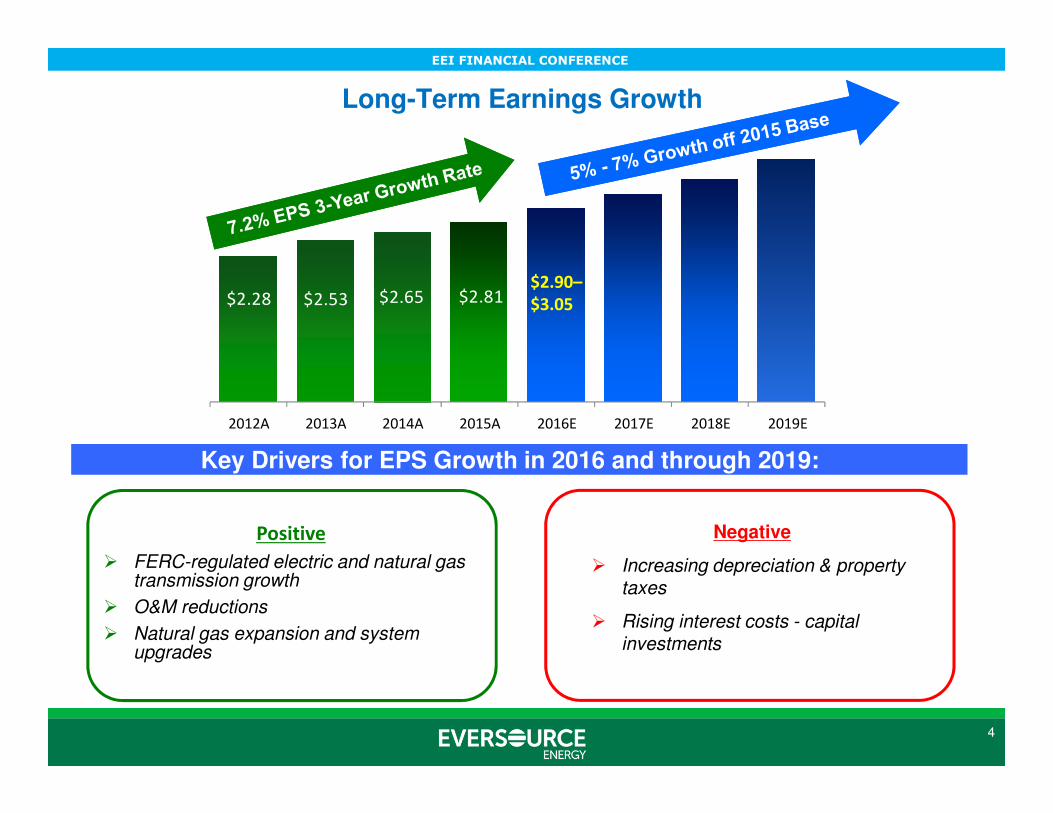
Long-Term Earnings Growth
Key Drivers for EPS Growth in 2016 and through 2019:
Positive
� FERC-regulated electric and natural gas transmission growth
� O&M reductions
� Natural gas expansion and system upgrades
Negative
� Increasing depreciation & property taxes
� Rising interest costs - capital investments
$2.81$2.28 $2.53 $2.65 $2.81
2012A 2013A 2014A 2015A 2016E 2017E 2018E 2019E
$2.90–
$3.05
EEI FINANCIAL CONFERENCE
A Core Eversource Strategy Going Forward is to Develop and Implement Clean Energy Solutions for New England
� New England has aggressive renewable, carbon reduction targets
� Thousands of megawatts of New England’s nuclear, coal and oil units have retired in recent years and thousands more will retire in coming years
� The region will grow increasingly dependent on Class 1 renewables, imported large hydro, and natural gas generation
� Renewables and hydro need to be connected to load; gas generation needs to be fueled
� Nearly 80% of the region’s carbon emissions comes from transportation and building heating
All of the above provide significant opportunities to Eversource
5
EEI FINANCIAL CONFERENCE
6
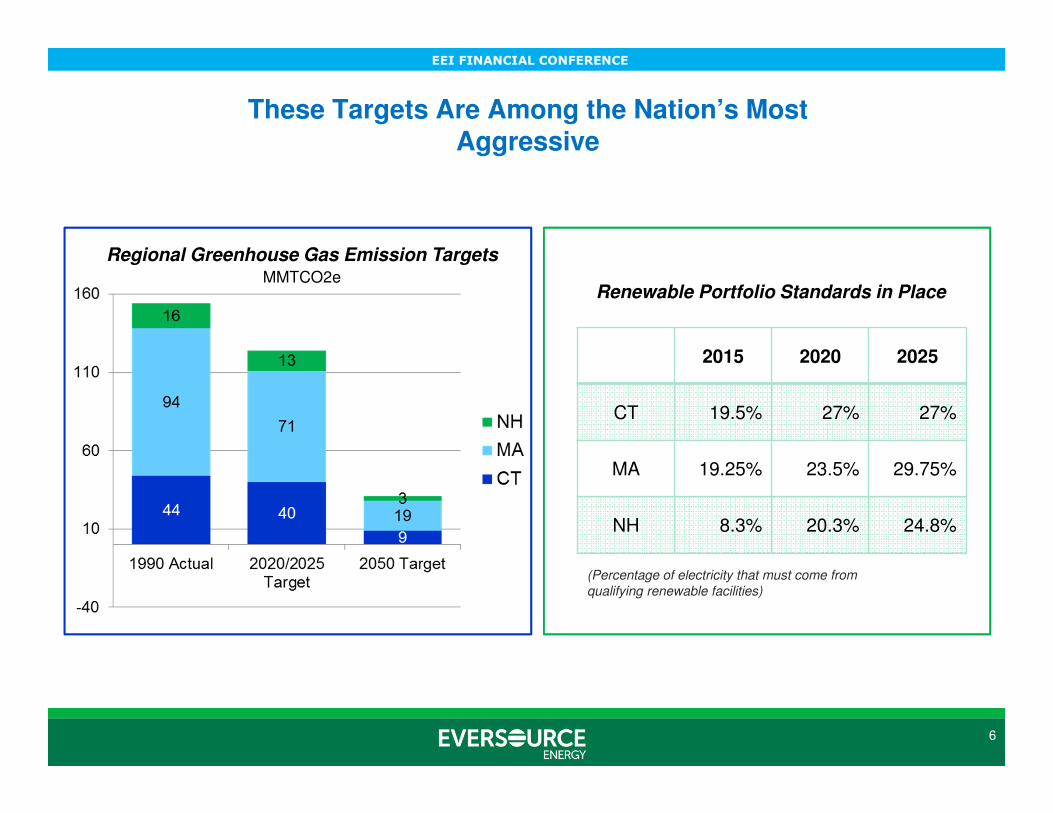
These Targets Are Among the Nation’s Most Aggressive
Regional Greenhouse Gas Emission TargetsMMTCO2e
2015 2020 2025
CT 19.5% 27% 27%
MA 19.25% 23.5% 29.75%
NH 8.3% 20.3% 24.8%
Renewable Portfolio Standards in Place
(Percentage of electricity that must come from
qualifying renewable facilities)
EEI FINANCIAL CONFERENCE
7
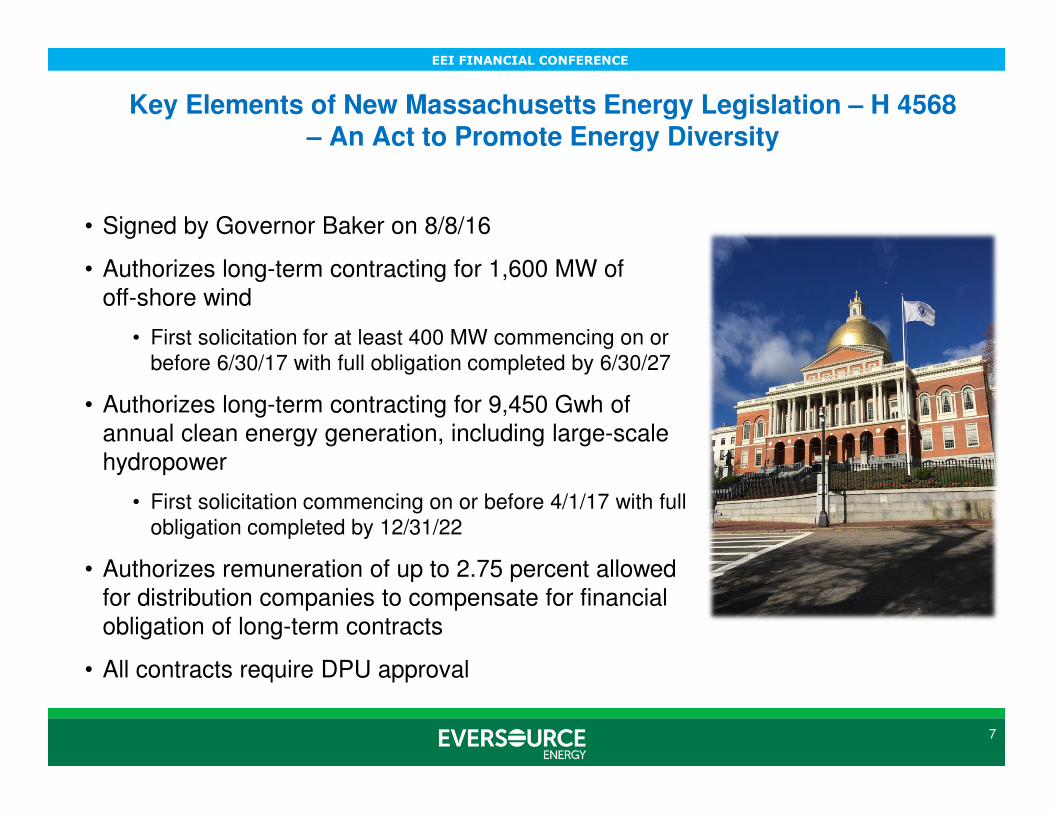
Key Elements of New Massachusetts Energy Legislation – H 4568 – An Act to Promote Energy Diversity
• Signed by Governor Baker on 8/8/16
• Authorizes long-term contracting for 1,600 MW of off-shore wind
• First solicitation for at least 400 MW commencing on or before 6/30/17 with full obligation completed by 6/30/27
• Authorizes long-term contracting for 9,450 Gwh of annual clean energy generation, including large-scale hydropower
• First solicitation commencing on or before 4/1/17 with full obligation completed by 12/31/22
• Authorizes remuneration of up to 2.75 percent allowed for distribution companies to compensate for financial obligation of long-term contracts
• All contracts require DPU approval
EEI FINANCIAL CONFERENCE
8
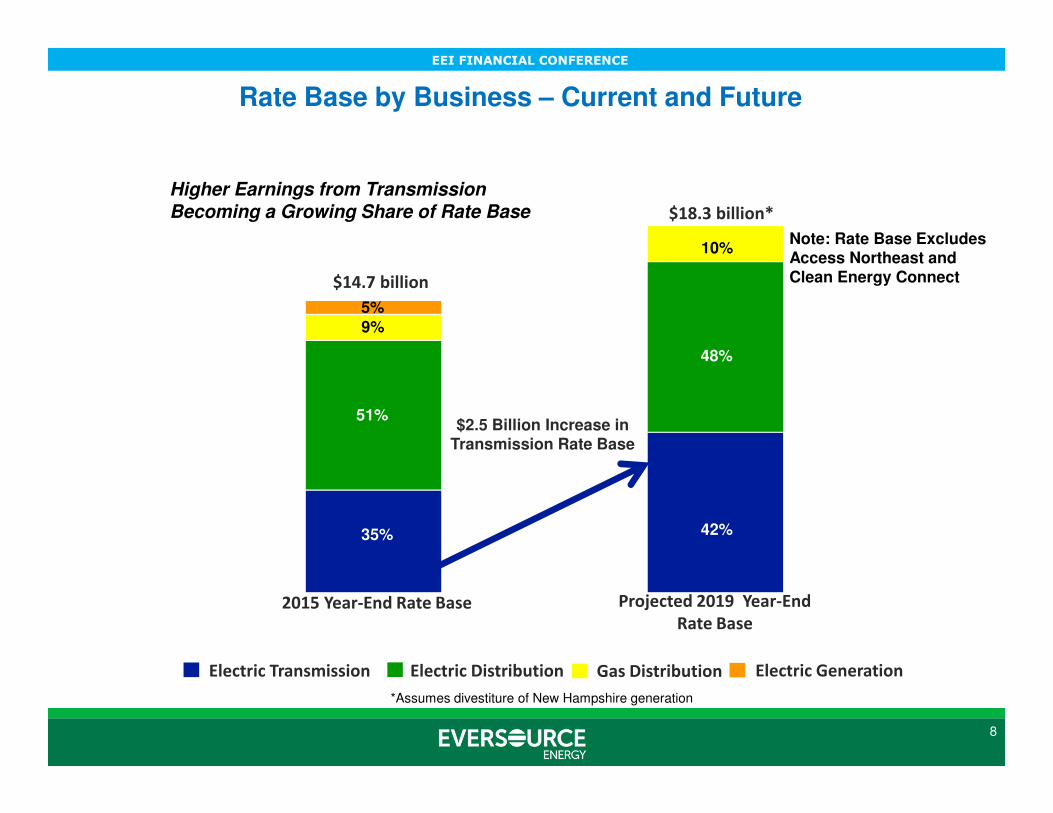
42%35%
48%
51%
10%
9%5%
2015 Year-End Rate Base Projected 2019 Year-End
Rate Base
Higher Earnings from Transmission Becoming a Growing Share of Rate Base
Electric Transmission Electric Distribution Gas Distribution Electric Generation
$14.7 billion
$18.3 billion*
$2.5 Billion Increase in Transmission Rate Base
Rate Base by Business – Current and Future
Note: Rate Base Excludes Access Northeast and Clean Energy Connect
*Assumes divestiture of New Hampshire generation
EEI FINANCIAL CONFERENCE
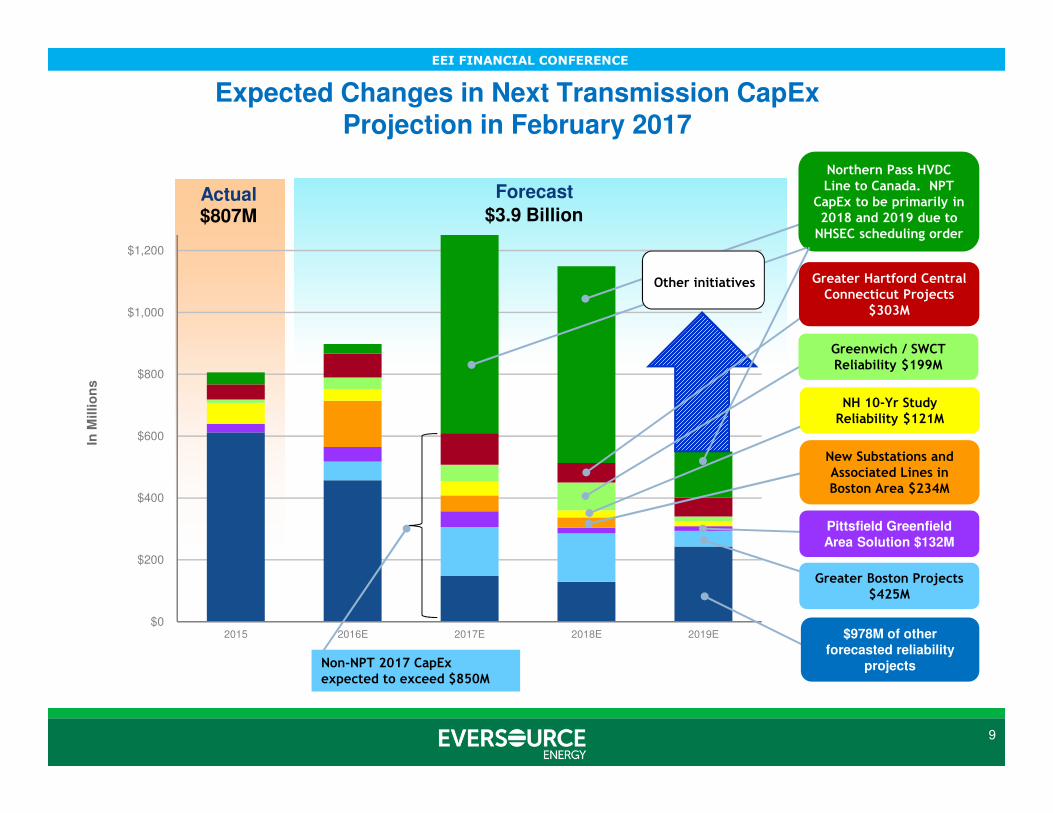
$0
$200
$400
$600
$800
$1,000
$1,200
2015 2016E 2017E 2018E 2019E
9
Forecast
In M
illio
ns
$3.9 Billion Actual$807M
Greater Boston Projects $425M
$978M of other forecasted reliability
projects
Northern Pass HVDC Line to Canada. NPT
CapEx to be primarily in 2018 and 2019 due to NHSEC scheduling order
Pittsfield Greenfield Area Solution $132M
New Substations and Associated Lines in Boston Area $234M
Expected Changes in Next Transmission CapEx Projection in February 2017
Greater Hartford Central Connecticut Projects
$303M
Greenwich / SWCT Reliability $199M
NH 10-Yr Study Reliability $121M
Non-NPT 2017 CapExexpected to exceed $850M
Other initiatives
EEI FINANCIAL CONFERENCE
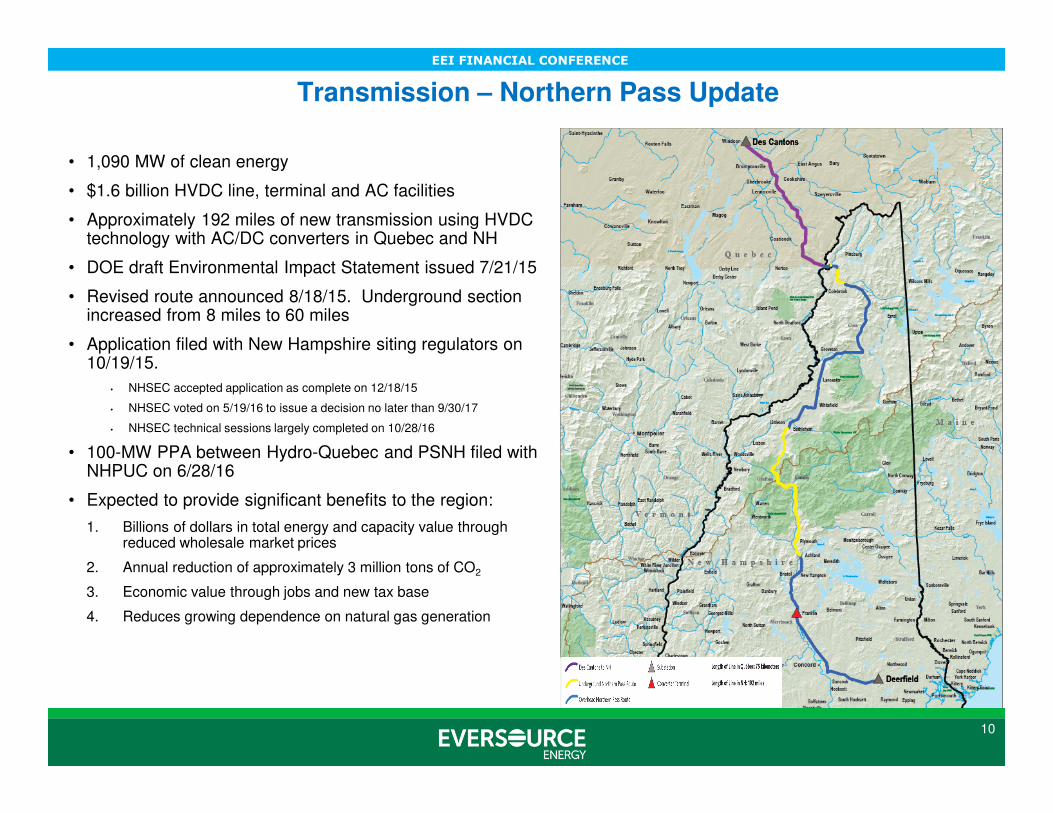
• 1,090 MW of clean energy
• $1.6 billion HVDC line, terminal and AC facilities
• Approximately 192 miles of new transmission using HVDC technology with AC/DC converters in Quebec and NH
• DOE draft Environmental Impact Statement issued 7/21/15
• Revised route announced 8/18/15. Underground section increased from 8 miles to 60 miles
• Application filed with New Hampshire siting regulators on 10/19/15.
• NHSEC accepted application as complete on 12/18/15
• NHSEC voted on 5/19/16 to issue a decision no later than 9/30/17
• NHSEC technical sessions largely completed on 10/28/16
• 100-MW PPA between Hydro-Quebec and PSNH filed with NHPUC on 6/28/16
• Expected to provide significant benefits to the region:
1. Billions of dollars in total energy and capacity value through reduced wholesale market prices
2. Annual reduction of approximately 3 million tons of CO2
3. Economic value through jobs and new tax base
4. Reduces growing dependence on natural gas generation
10
Transmission – Northern Pass Update
EEI FINANCIAL CONFERENCE
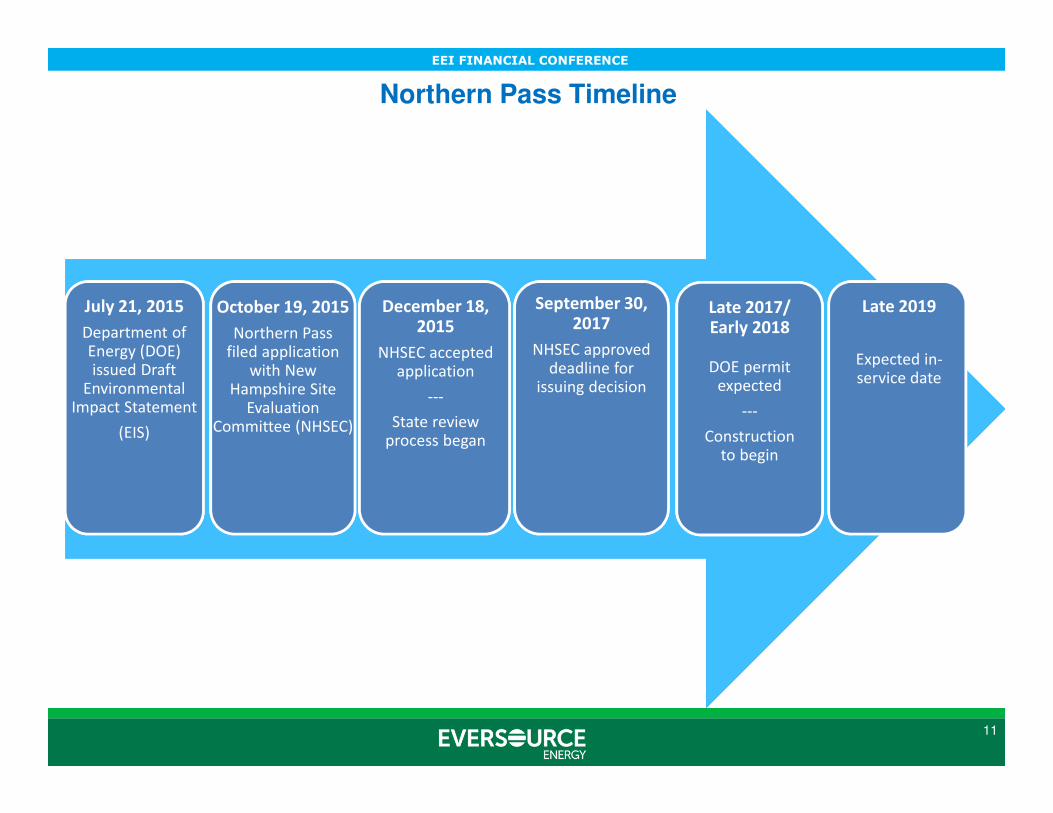
Northern Pass Timeline
11
July 21, 2015
Department of Energy (DOE) issued Draft
Environmental Impact Statement
(EIS)
July 21, 2015
Department of Energy (DOE) issued Draft
Environmental Impact Statement
(EIS)
July 21, 2015
Department of Energy (DOE) issued Draft
Environmental Impact Statement
(EIS)
October 19, 2015
Northern Pass filed application
with New Hampshire Site
Evaluation Committee (NHSEC)
October 19, 2015
Northern Pass filed application
with New Hampshire Site
Evaluation Committee (NHSEC)
October 19, 2015
Northern Pass filed application
with New Hampshire Site
Evaluation Committee (NHSEC)
December 18, 2015
NHSEC accepted application
---
State review process began
December 18, 2015
NHSEC accepted application
---
State review process began
December 18, 2015
NHSEC accepted application
---
State review process began
Late 2017/ Early 2018
DOE permit expected
---
Construction to begin
Late 2017/ Early 2018
DOE permit expected
---
Construction to begin
Late 2017/ Early 2018
DOE permit expected
---
Construction to begin
Late 2019
Expected in-service date
Late 2019
Expected in-service date
Late 2019
Expected in-service date
September 30, 2017
NHSEC approved deadline for
issuing decision
EEI FINANCIAL CONFERENCE
12
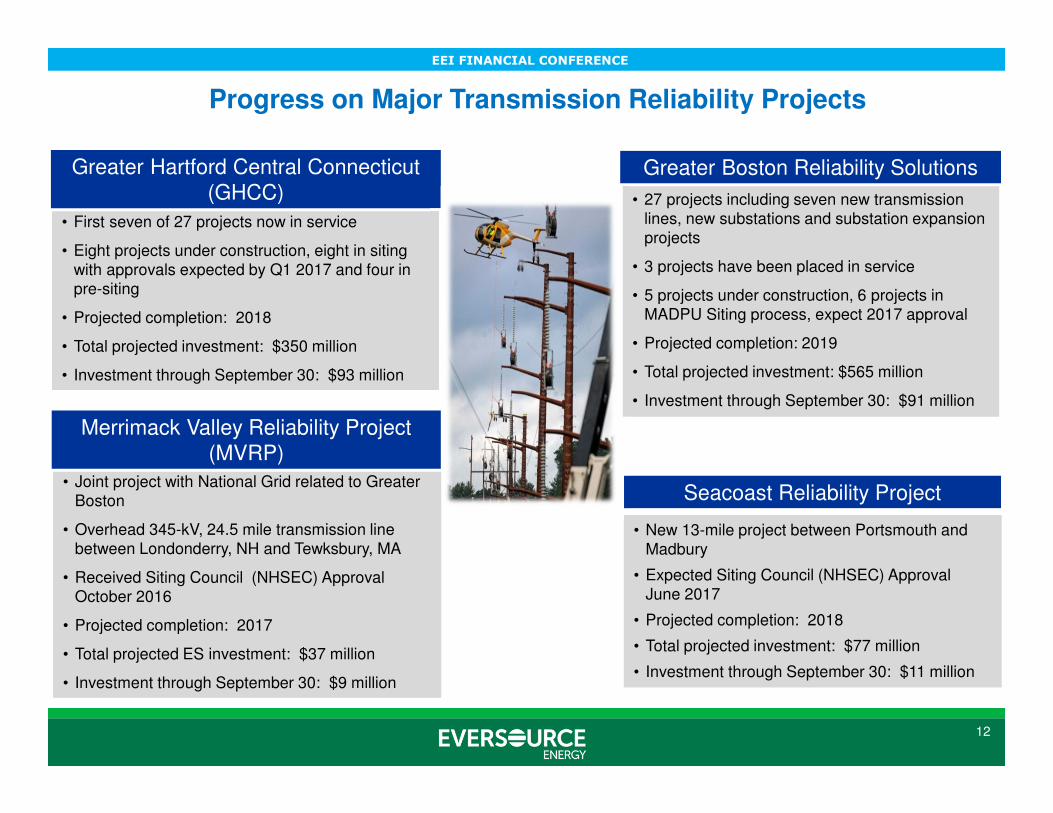
Progress on Major Transmission Reliability Projects
• New 13-mile project between Portsmouth and Madbury
• Expected Siting Council (NHSEC) Approval June 2017
• Projected completion: 2018
• Total projected investment: $77 million
• Investment through September 30: $11 million
• New 13-mile project between Portsmouth and Madbury
• Expected Siting Council (NHSEC) Approval June 2017
• Projected completion: 2018
• Total projected investment: $77 million
• Investment through September 30: $11 million
• 27 projects for Greater Hartford, Manchester, Southington, Middletown and NW CT
• First seven of 27 projects now in service
• Eight projects under construction, eight in siting with approvals expected by Q1 2017 and four in pre-siting
• Projected completion: 2018
• Total projected investment: $350 million
• Investment through September 30: $93 million
Seacoast Reliability Project
Greater Hartford Central Connecticut (GHCC) • 27 projects including seven new transmission
lines, new substations and substation expansion projects
• 3 projects have been placed in service
• 5 projects under construction, 6 projects in MADPU Siting process, expect 2017 approval
• Projected completion: 2019
• Total projected investment: $565 million
• Investment through September 30: $91 million
• 27 projects including seven new transmission lines, new substations and substation expansion projects
• 3 projects have been placed in service
• 5 projects under construction, 6 projects in MADPU Siting process, expect 2017 approval
• Projected completion: 2019
• Total projected investment: $565 million
• Investment through September 30: $91 million
Greater Boston Reliability Solutions
Progress on Major Transmission Reliability Projects
• Joint project with National Grid related to Greater Boston
• Overhead 345-kV, 24.5 mile transmission line between Londonderry, NH and Tewksbury, MA
• Received Siting Council (NHSEC) Approval October 2016
• Projected completion: 2017
• Total projected ES investment: $37 million
• Investment through September 30: $9 million
Merrimack Valley Reliability Project (MVRP)
EEI FINANCIAL CONFERENCE
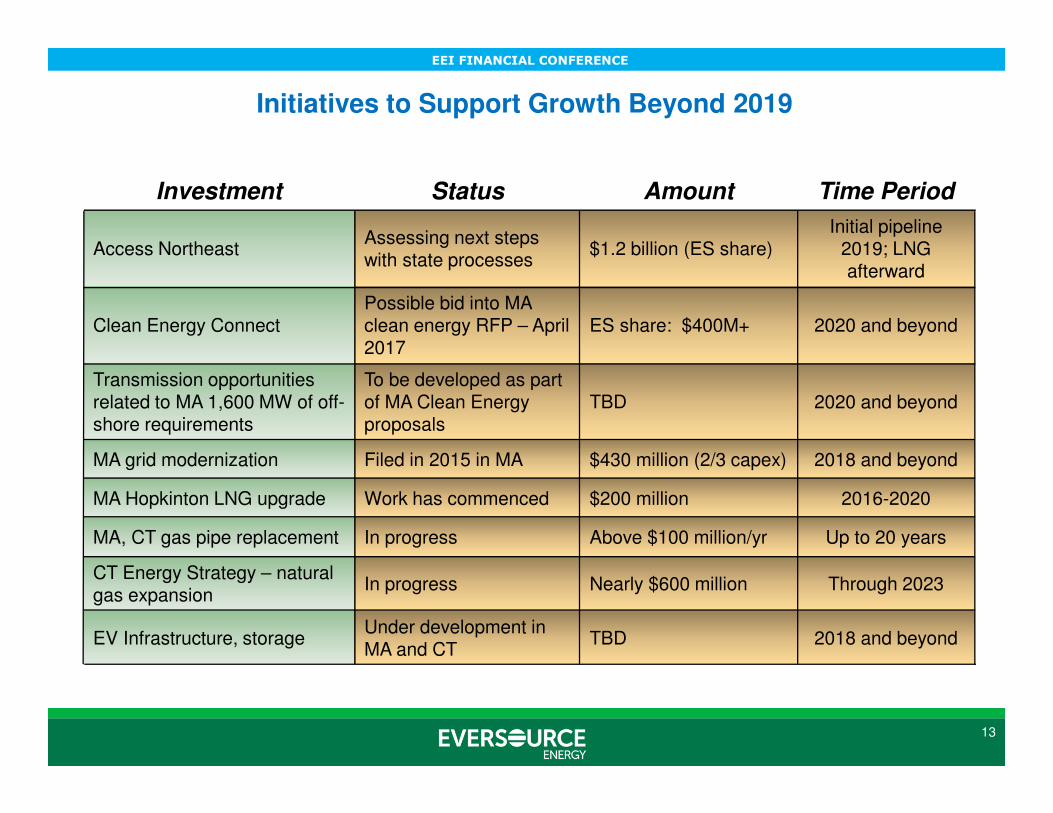
Investment Status Amount Time Period
Access NortheastAssessing next steps with state processes
$1.2 billion (ES share)Initial pipeline
2019; LNG afterward
Clean Energy ConnectPossible bid into MAclean energy RFP – April 2017
ES share: $400M+ 2020 and beyond
Transmission opportunities related to MA 1,600 MW of off-shore requirements
To be developed as part of MA Clean Energy proposals
TBD 2020 and beyond
MA grid modernization Filed in 2015 in MA $430 million (2/3 capex) 2018 and beyond
MA Hopkinton LNG upgrade Work has commenced $200 million 2016-2020
MA, CT gas pipe replacement In progress Above $100 million/yr Up to 20 years
CT Energy Strategy – natural gas expansion
In progress Nearly $600 million Through 2023
EV Infrastructure, storageUnder development in MA and CT
TBD 2018 and beyond
13
Initiatives to Support Growth Beyond 2019
EEI FINANCIAL CONFERENCE
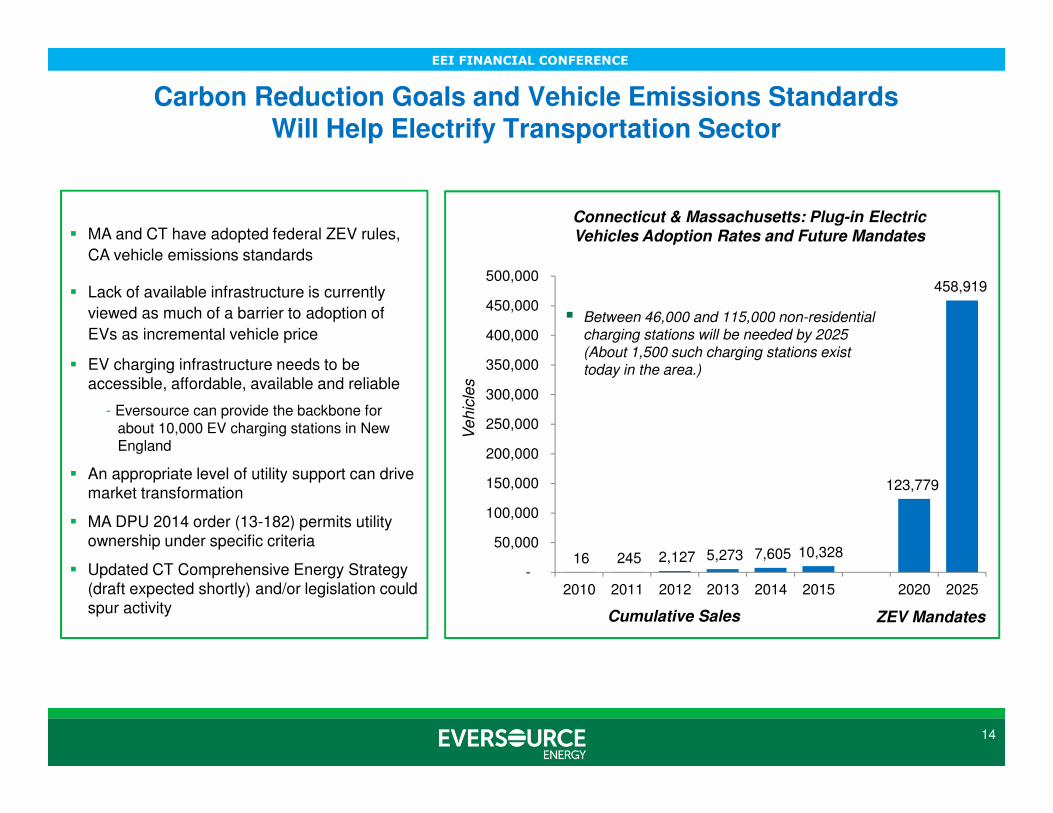
Carbon Reduction Goals and Vehicle Emissions Standards Will Help Electrify Transportation Sector
� Between 46,000 and 115,000 non-residential charging stations will be needed by 2025 (About 1,500 such charging stations exist today in the area.)
16 245 2,127 5,273 7,605 10,328
123,779
458,919
-
50,000
100,000
150,000
200,000
250,000
300,000
350,000
400,000
450,000
500,000
2010 2011 2012 2013 2014 2015 2020 2025
ZEV Mandates
Connecticut & Massachusetts: Plug-in Electric
Vehicles Adoption Rates and Future Mandates
14
Cumulative Sales
� MA and CT have adopted federal ZEV rules,
CA vehicle emissions standards
� Lack of available infrastructure is currently
viewed as much of a barrier to adoption of
EVs as incremental vehicle price
� EV charging infrastructure needs to be accessible, affordable, available and reliable
- Eversource can provide the backbone for about 10,000 EV charging stations in New England
� An appropriate level of utility support can drive market transformation
� MA DPU 2014 order (13-182) permits utility ownership under specific criteria
� Updated CT Comprehensive Energy Strategy (draft expected shortly) and/or legislation could spur activity
Ve
hic
les
EEI FINANCIAL CONFERENCE
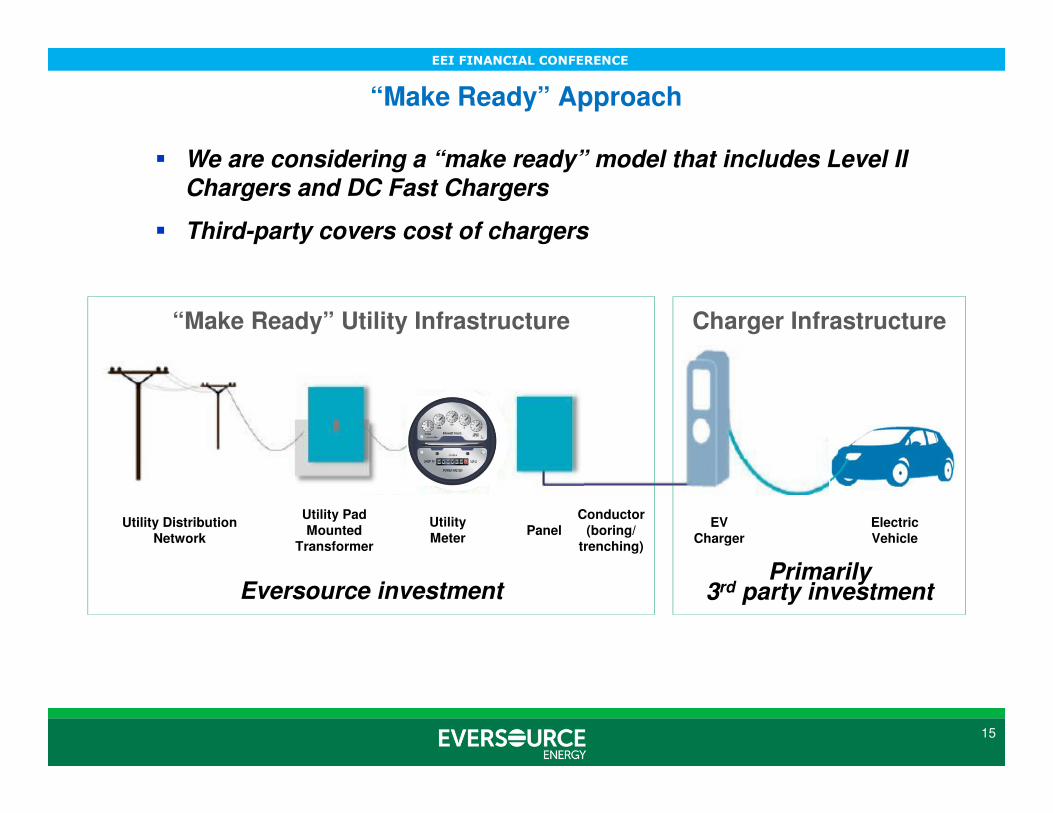
“Make Ready” Approach
Charger Infrastructure
Utility Distribution Network
Utility Pad Mounted
Transformer
Utility Meter
PanelConductor
(boring/trenching)
EV Charger
Electric Vehicle
Eversource investmentPrimarily
3rd party investment
� We are considering a “make ready” model that includes Level II Chargers and DC Fast Chargers
� Third-party covers cost of chargers
“Make Ready” Utility Infrastructure
15
EEI FINANCIAL CONFERENCE
Policy Interest in Energy Storage Within the Region is Growing with Several Avenues for Cost Recovery
� Massachusetts
– DOER / Clean Energy Center recommends Massachusetts develop policies for 600 MW of storage by 2025 in the “State of Charge: Massachusetts Energy Storage Initiative” report
– DOER two-step process. 1) Decide whether to set energy storage procurement targets for electric companies by 12/31/16. 2) If targets are to be set, establish them by 7/1/17
� Connecticut
– In 2015, Legislature amended state budget provisions to require electric distribution companies to submit pilot proposals for grid-side system enhancements which could include energy storage. CL&P submitted $15 million, 3-year proposal on 10/31/16
– In 2015, passed act permitting creation of storage RFPs through competitive bidding
� New Hampshire
– PUC initiated an investigation into grid modernization following an order under the 10-Year State Energy Strategy
16
EEI FINANCIAL CONFERENCE
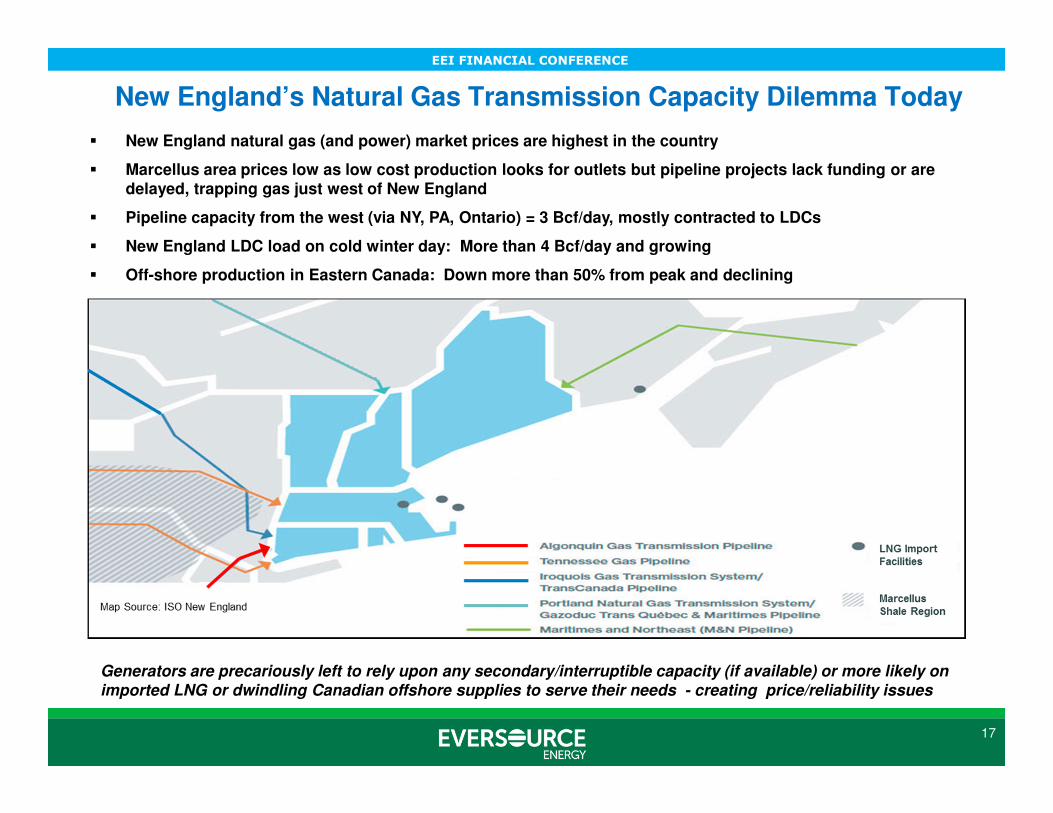
Key Gas Supply Issues� New England natural gas (and power) market prices are highest in the country
� Marcellus area prices low as low cost production looks for outlets but pipeline projects lack funding or are delayed, trapping gas just west of New England
� Pipeline capacity from the west (via NY, PA, Ontario) = 3 Bcf/day, mostly contracted to LDCs
� New England LDC load on cold winter day: More than 4 Bcf/day and growing
� Off-shore production in Eastern Canada: Down more than 50% from peak and declining
New England’s Natural Gas Transmission Capacity Dilemma Today
17
Generators are precariously left to rely upon any secondary/interruptible capacity (if available) or more likely on imported LNG or dwindling Canadian offshore supplies to serve their needs - creating price/reliability issues
EEI FINANCIAL CONFERENCE
Key Gas Supply Issues
18
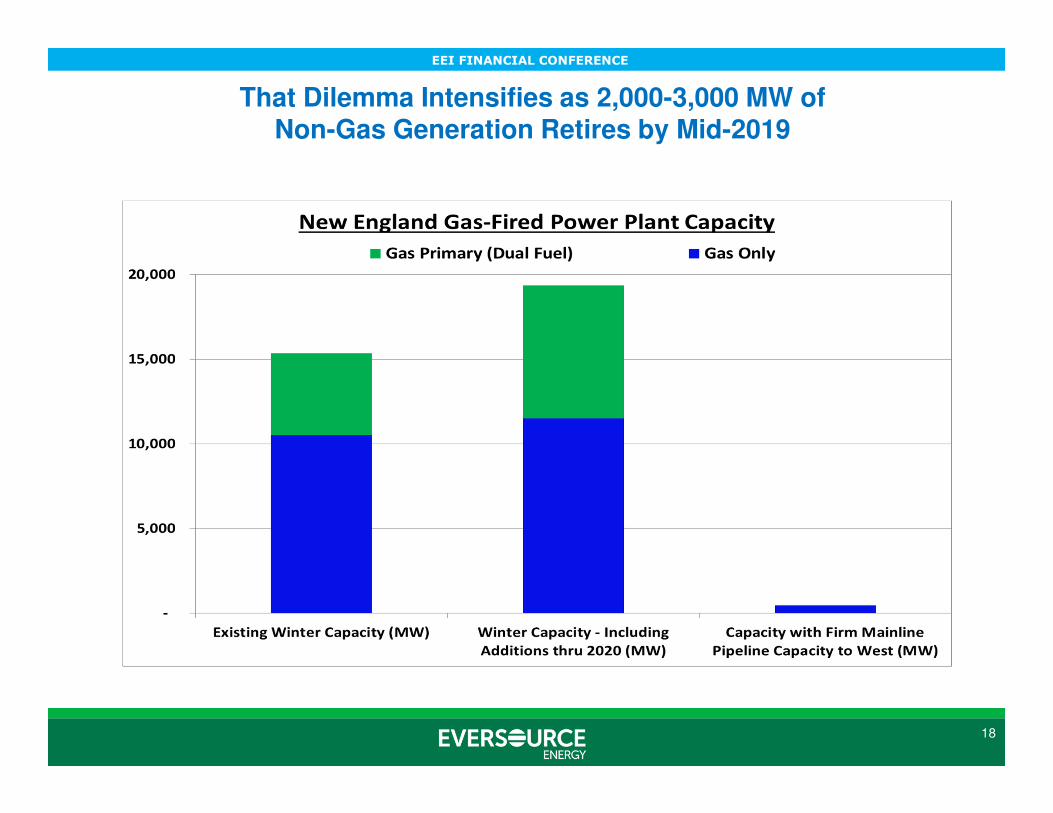
That Dilemma Intensifies as 2,000-3,000 MW of Non-Gas Generation Retires by Mid-2019
EEI FINANCIAL CONFERENCE
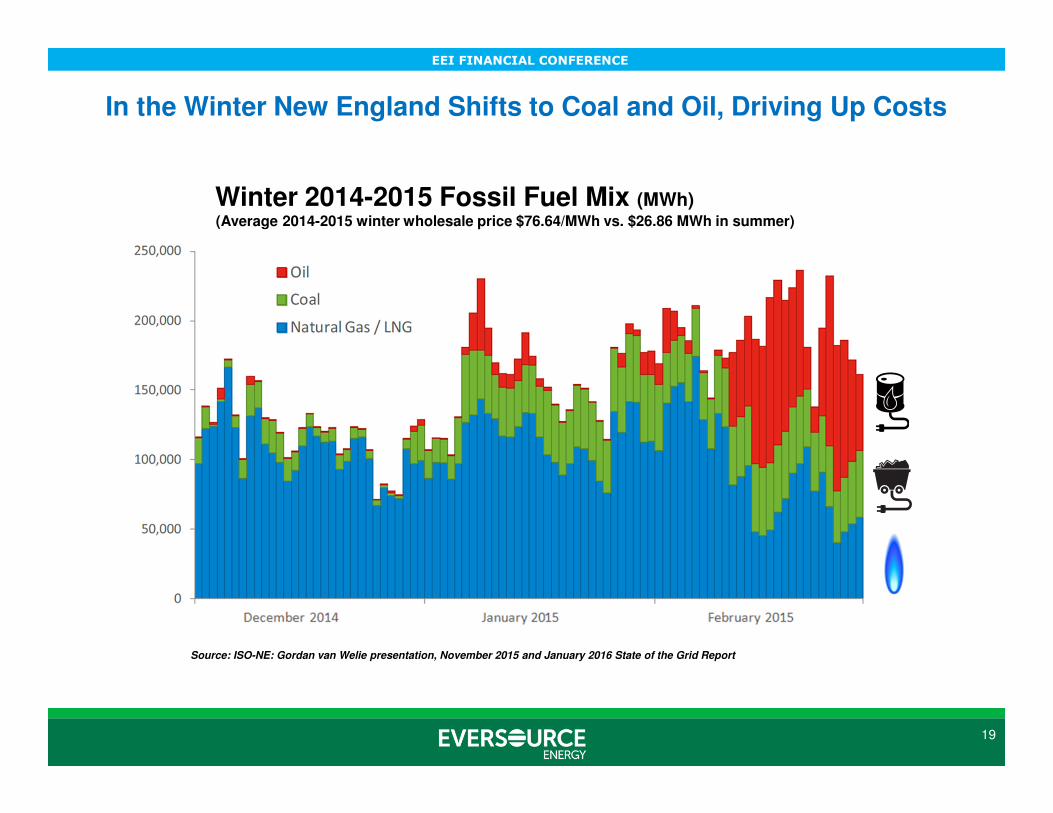
In the Winter New England Shifts to Coal and Oil, Driving Up Costs
19
Source: ISO-NE: Gordan van Welie presentation, November 2015 and January 2016 State of the Grid Report
Winter 2014-2015 Fossil Fuel Mix (MWh)(Average 2014-2015 winter wholesale price $76.64/MWh vs. $26.86 MWh in summer)
EEI FINANCIAL CONFERENCE
20
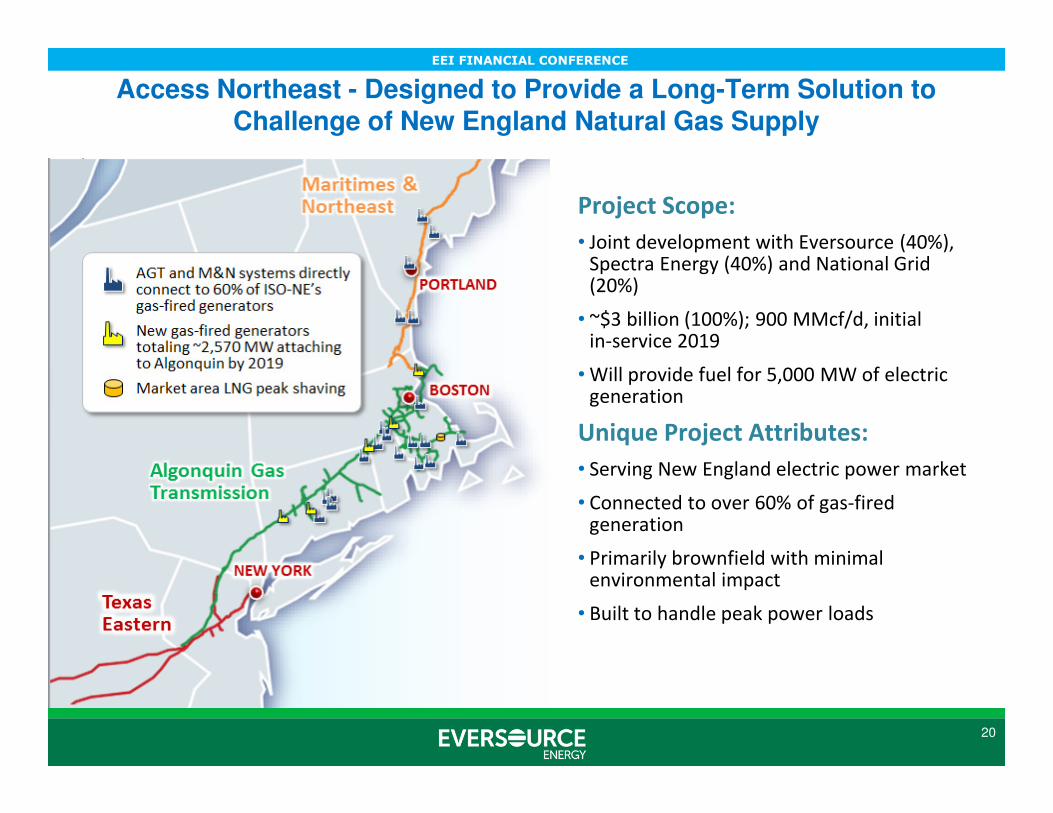
Project Scope:
• Joint development with Eversource (40%), Spectra Energy (40%) and National Grid (20%)
• ~$3 billion (100%); 900 MMcf/d, initial in-service 2019
• Will provide fuel for 5,000 MW of electric generation
Unique Project Attributes:
• Serving New England electric power market
• Connected to over 60% of gas-fired generation
• Primarily brownfield with minimal environmental impact
• Built to handle peak power loads
Access Northeast - Designed to Provide a Long-Term Solution to Challenge of New England Natural Gas Supply
EEI FINANCIAL CONFERENCE
21
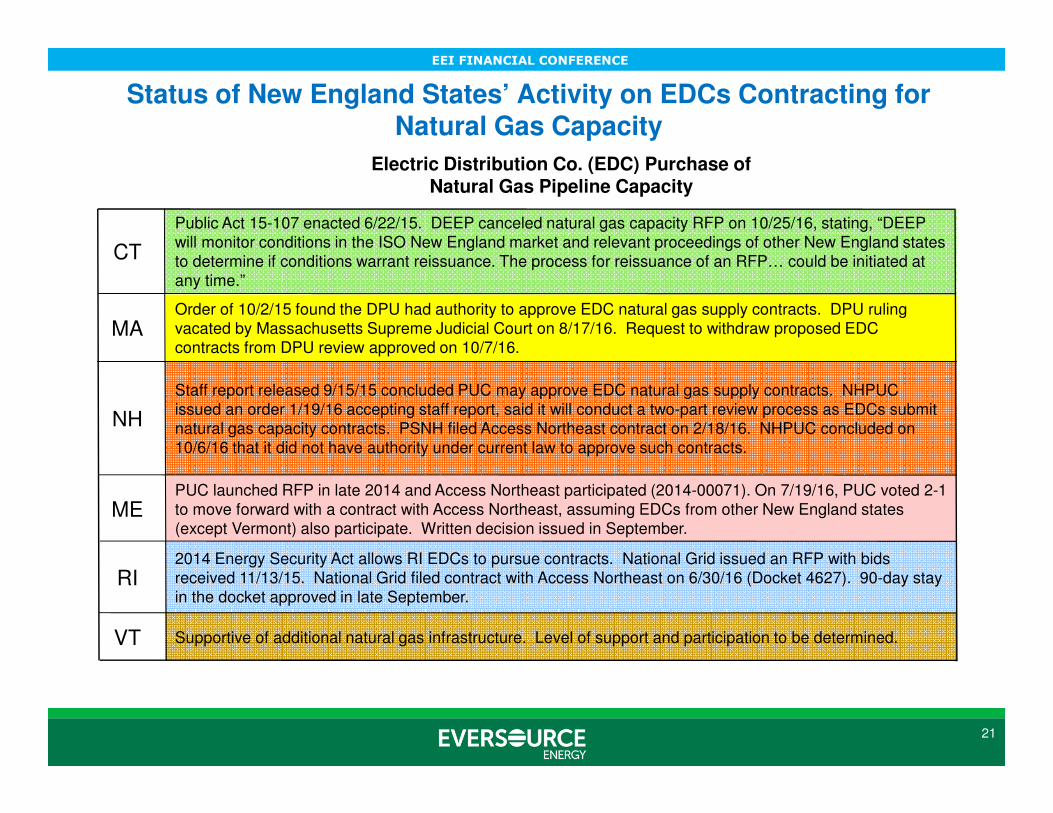
Electric Distribution Co. (EDC) Purchase of Natural Gas Pipeline Capacity
CT
Public Act 15-107 enacted 6/22/15. DEEP canceled natural gas capacity RFP on 10/25/16, stating, “DEEP will monitor conditions in the ISO New England market and relevant proceedings of other New England states to determine if conditions warrant reissuance. The process for reissuance of an RFP… could be initiated at any time.”
MAOrder of 10/2/15 found the DPU had authority to approve EDC natural gas supply contracts. DPU ruling vacated by Massachusetts Supreme Judicial Court on 8/17/16. Request to withdraw proposed EDC contracts from DPU review approved on 10/7/16.
NH
Staff report released 9/15/15 concluded PUC may approve EDC natural gas supply contracts. NHPUC issued an order 1/19/16 accepting staff report, said it will conduct a two-part review process as EDCs submit natural gas capacity contracts. PSNH filed Access Northeast contract on 2/18/16. NHPUC concluded on 10/6/16 that it did not have authority under current law to approve such contracts.
MEPUC launched RFP in late 2014 and Access Northeast participated (2014-00071). On 7/19/16, PUC voted 2-1 to move forward with a contract with Access Northeast, assuming EDCs from other New England states (except Vermont) also participate. Written decision issued in September.
RI2014 Energy Security Act allows RI EDCs to pursue contracts. National Grid issued an RFP with bids received 11/13/15. National Grid filed contract with Access Northeast on 6/30/16 (Docket 4627). 90-day stay in the docket approved in late September.
VT Supportive of additional natural gas infrastructure. Level of support and participation to be determined.
Status of New England States’ Activity on EDCs Contracting for Natural Gas Capacity
EEI FINANCIAL CONFERENCE
22
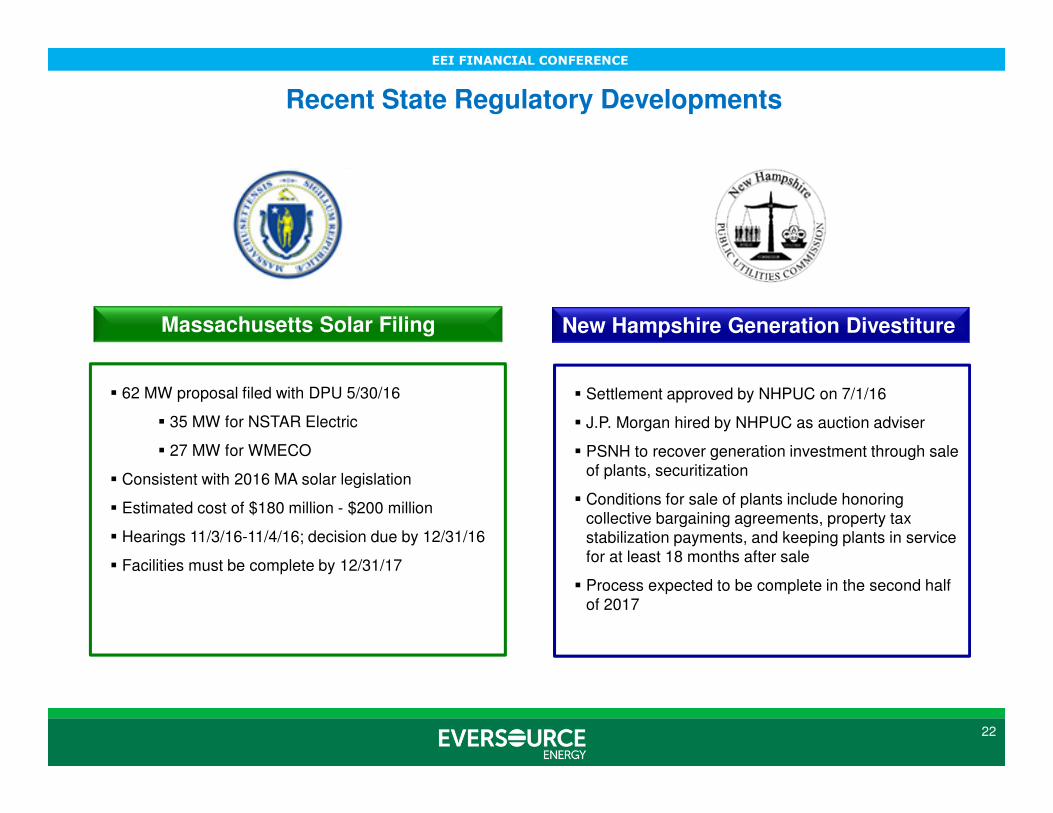
Recent State Regulatory Developments
� Settlement approved by NHPUC on 7/1/16
� J.P. Morgan hired by NHPUC as auction adviser
� PSNH to recover generation investment through sale of plants, securitization
� Conditions for sale of plants include honoring collective bargaining agreements, property tax stabilization payments, and keeping plants in service for at least 18 months after sale
� Process expected to be complete in the second half of 2017
New Hampshire Generation DivestitureMassachusetts Solar Filing
� 62 MW proposal filed with DPU 5/30/16
� 35 MW for NSTAR Electric
� 27 MW for WMECO
� Consistent with 2016 MA solar legislation
� Estimated cost of $180 million - $200 million
� Hearings 11/3/16-11/4/16; decision due by 12/31/16
� Facilities must be complete by 12/31/17
EEI FINANCIAL CONFERENCE
23
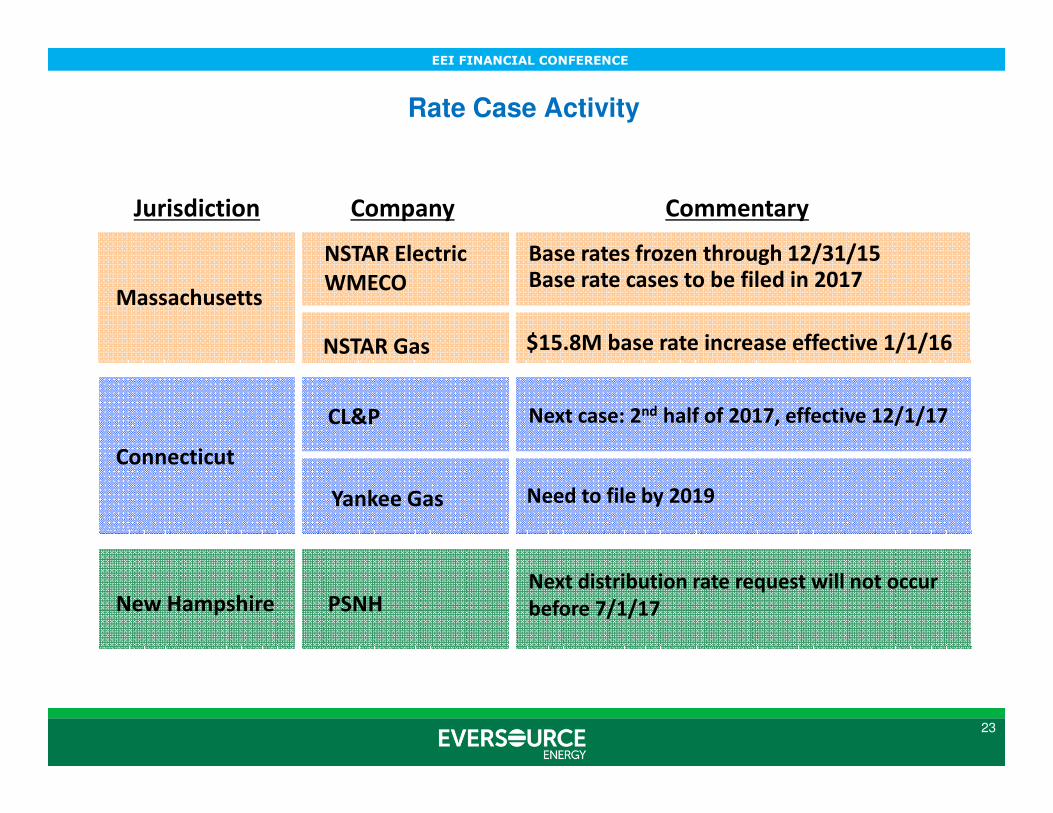
Rate Case Activity
Base rate cases to be filed in 2017
Next case: 2nd half of 2017, effective 12/1/17
Need to file by 2019
Next distribution rate request will not occur
before 7/1/17
Massachusetts
Connecticut
New Hampshire
NSTAR Electric
CL&P
PSNH
Yankee Gas
Jurisdiction Company Commentary
WMECO
NSTAR Gas $15.8M base rate increase effective 1/1/16
Base rates frozen through 12/31/15
EEI FINANCIAL CONFERENCE
24
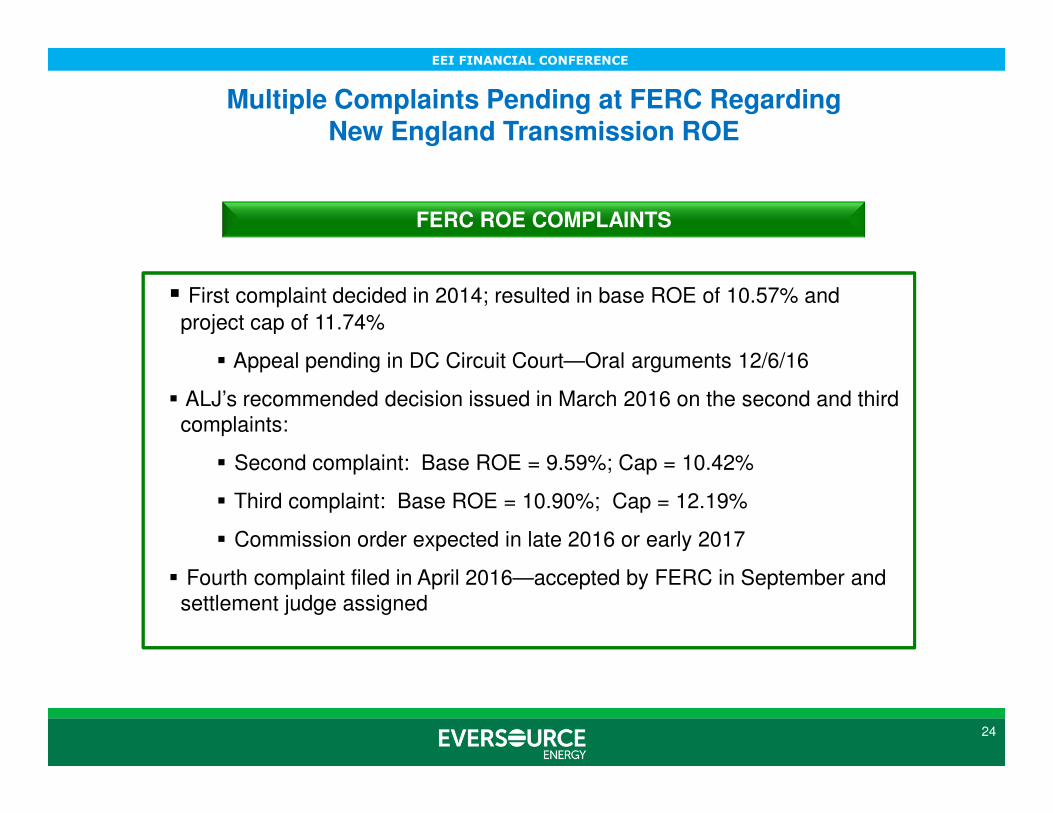
Multiple Complaints Pending at FERC Regarding New England Transmission ROE
FERC ROE COMPLAINTS
� First complaint decided in 2014; resulted in base ROE of 10.57% and
project cap of 11.74%
� Appeal pending in DC Circuit Court—Oral arguments 12/6/16
� ALJ’s recommended decision issued in March 2016 on the second and third complaints:
� Second complaint: Base ROE = 9.59%; Cap = 10.42%
� Third complaint: Base ROE = 10.90%; Cap = 12.19%
� Commission order expected in late 2016 or early 2017
� Fourth complaint filed in April 2016—accepted by FERC in September and settlement judge assigned
EEI FINANCIAL CONFERENCE
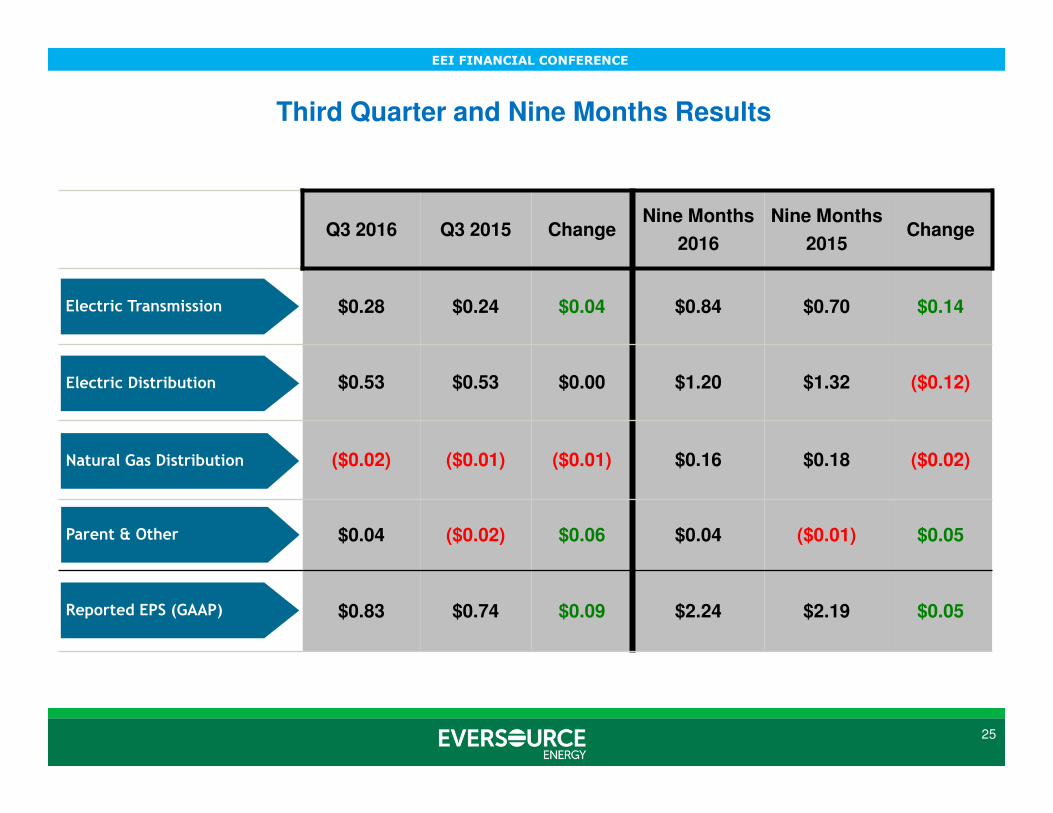
Q3 2016 Q3 2015 ChangeNine Months
2016
Nine Months
2015Change
$0.28 $0.24 $0.04 $0.84 $0.70 $0.14
$0.53 $0.53 $0.00 $1.20 $1.32 ($0.12)
($0.02) ($0.01) ($0.01) $0.16 $0.18 ($0.02)
$0.04 ($0.02) $0.06 $0.04 ($0.01) $0.05
$0.83 $0.74 $0.09 $2.24 $2.19 $0.05
Natural Gas Distribution
Electric Distribution
Electric Transmission
Parent & Other
Reported EPS (GAAP)
25
Third Quarter and Nine Months Results
EEI FINANCIAL CONFERENCE
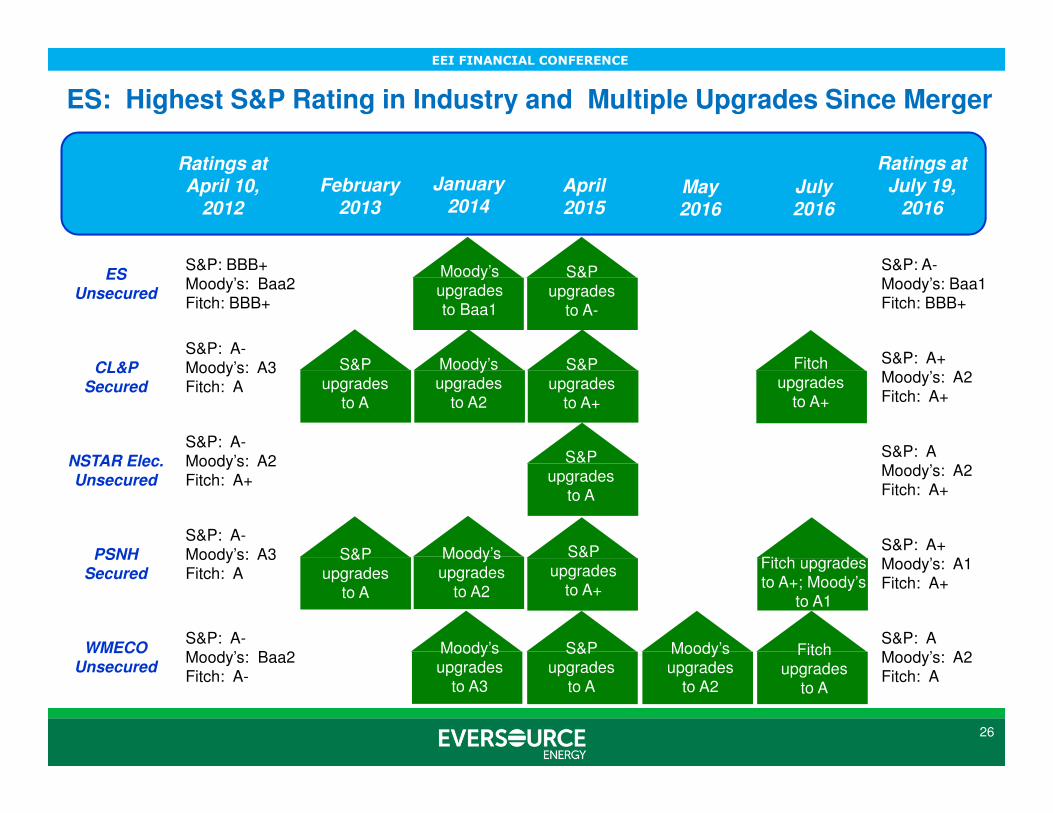
26
ES Unsecured
S&P: BBB+Moody’s: Baa2Fitch: BBB+
S&P: A-Moody’s: Baa1Fitch: BBB+
CL&P Secured
S&P: A-Moody’s: A3Fitch: A
S&P: A+Moody’s: A2Fitch: A+
NSTAR Elec. Unsecured
S&P: A-Moody’s: A2Fitch: A+
S&P: AMoody’s: A2Fitch: A+
PSNH Secured
S&P: A-Moody’s: A3Fitch: A
S&P: A+Moody’s: A1Fitch: A+
WMECOUnsecured
S&P: A-Moody’s: Baa2Fitch: A-
S&P: AMoody’s: A2Fitch: A
Ratings at April 10,
2012
February 2013
January 2014
July 2016
May 2016
April 2015
Ratings at July 19,
2016
S&P upgrades
to A-
Moody’s upgrades to Baa1
S&P upgrades
to A
S&P upgrades
to A+
S&P upgrades
to A
S&P upgrades
to A
S&P upgrades
to A+
S&P upgrades
to A
Moody’s upgrades
to A2
Moody’s upgrades
to A2
Moody’s upgrades
to A3
Moody’s upgrades
to A2
Fitch upgrades
to A+
Fitch upgrades to A+; Moody’s
to A1
Fitch upgrades
to A
ES: Highest S&P Rating in Industry and Multiple Upgrades Since Merger
EEI FINANCIAL CONFERENCE
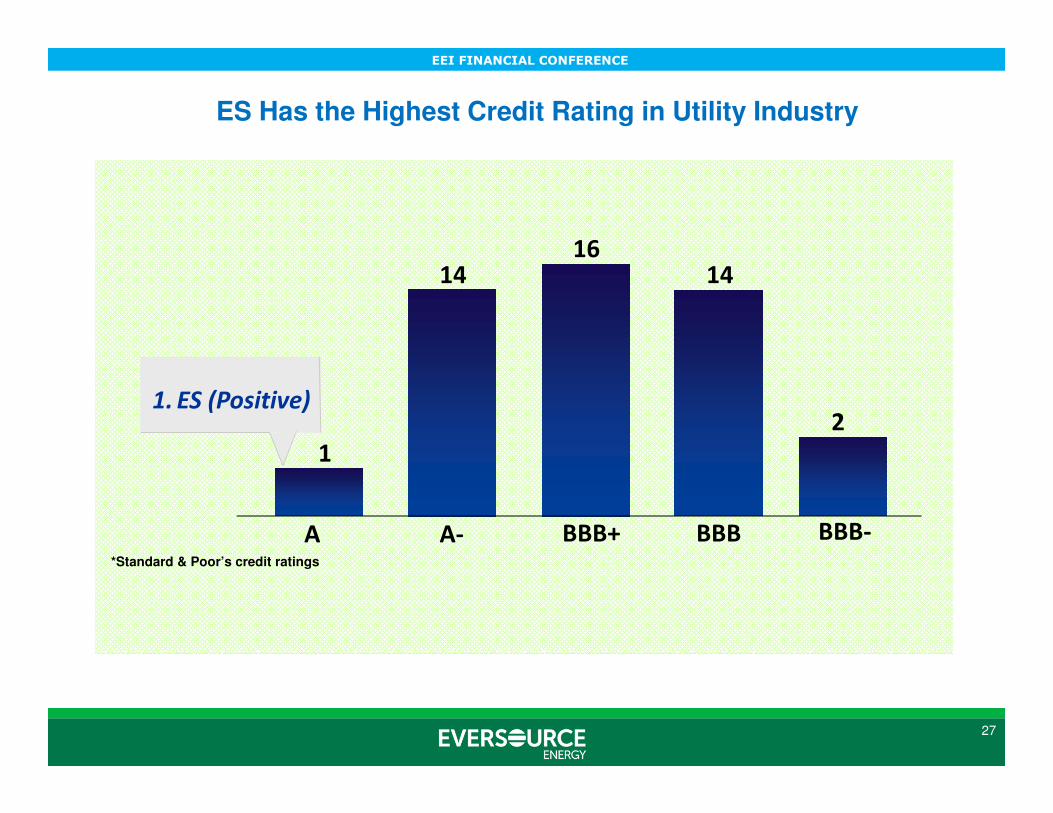
ES Has the Highest Credit Rating in Utility Industry
27
1
1416
14
2
A A- BBB+ BBB BBB-
Number of Issuers1. ES (Positive)
*Standard & Poor’s credit ratings
EEI FINANCIAL CONFERENCE
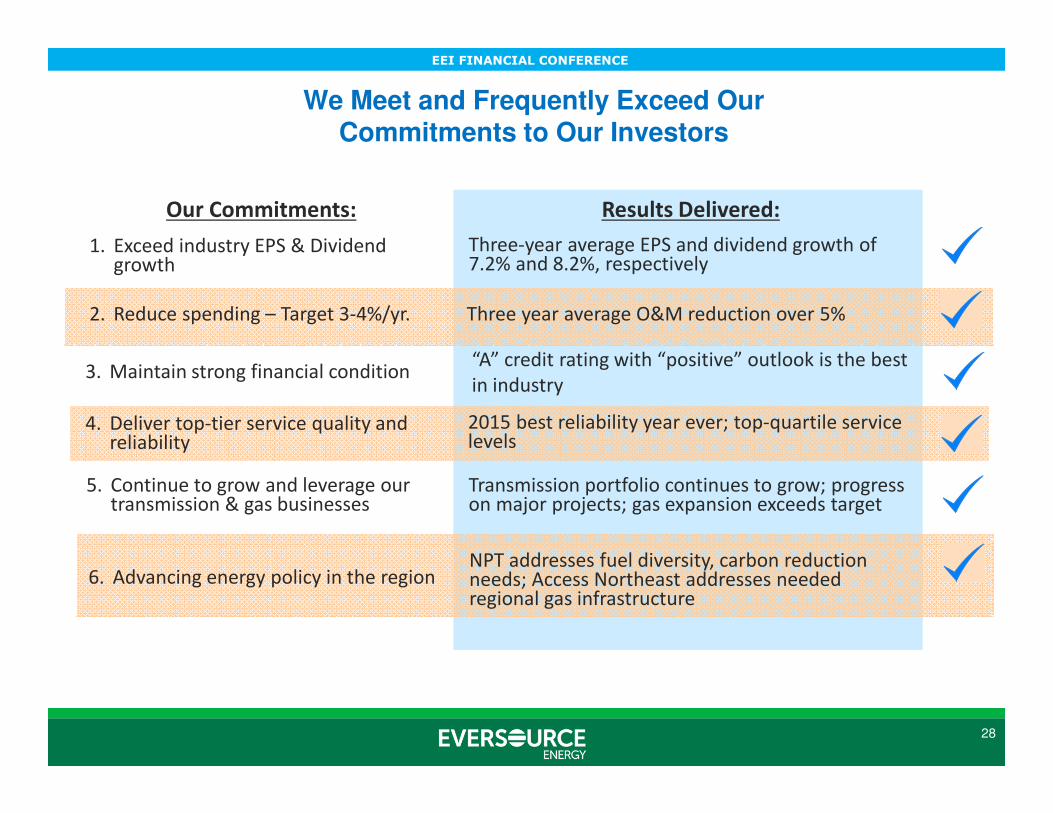
We Meet and Frequently Exceed Our Commitments to Our Investors
Our Commitments: Results Delivered:
2. Reduce spending – Target 3-4%/yr. Three year average O&M reduction over 5%
1. Exceed industry EPS & Dividend growth
Three-year average EPS and dividend growth of 7.2% and 8.2%, respectively
4. Deliver top-tier service quality and reliability
2015 best reliability year ever; top-quartile service levels
5. Continue to grow and leverage our transmission & gas businesses
Transmission portfolio continues to grow; progress on major projects; gas expansion exceeds target
6. Advancing energy policy in the regionNPT addresses fuel diversity, carbon reduction needs; Access Northeast addresses needed regional gas infrastructure
3. Maintain strong financial condition“A” credit rating with “positive” outlook is the best
in industry
28