Advanced Manufacturing Innovation Initiative: Technology ...

`
2020 INTEGRATED REPORT
40 Years of Manufacturing technologY and innovationSteadily Increasing Relevance as a Global Force

ABOUT THE COVER
Surface Technology International, Ltd. (STI, Ltd.), a UK subsidiary of IMI, proudly took part in the Ventilator Challenge UK Consortium. They rose to the challenge from the British government to offer skills, expertise, and scale up production of ventilators in large volumes to save lives.
Integrated Micro-Electronics, Inc. (IMI) marked its 40th anniversary in the midst of an unprecedented global health crisis that has claimed millions of lives and has ravaged the global economy.
The COVID-19 pandemic has left many of us vulnerable. But it has also shown us how people across the globe can rally together to tackle the toughest challenges of our generation.
For IMI, 2020 was once again a year of collaboration and empowerment—of teamwork and action. The cover represents how we stood ready and equipped to respond to the crisis. We heeded to the call of many governments and other organizations for the sourcing and manufacturing of ventilators, as well as low-cost breathing aid solutions in caring for COVID-19 patients. By leveraging our manufacturing flexibility, we have successfully enhanced our capabilities in supporting a wider range of medical devices and equipment.
The end of the crisis is not yet in sight, but our concern for others has been and will be ever present. Our innovative spirit will remain central to our mission of bringing life-changing innovations to the world.

INTEGRATED MICRO-ELECTRONICS, INC.
40 Years of Manufacturing Technology and Innovation2 340 Years of Manufacturing Technology and Innovation

40 Years of Manufacturing Technology and Innovation
2020 INTEGRATED REPORT
540 Years of Manufacturing Technology and Innovation4

Table of ConTenTs8
10
12
14
19
37
49
65
80
oUR VIsIon
The leading INNOVATIVE partner for cusTOmIzEd solutions. Our PEOPLE deliver the highest quality experience.
oUR MIssIonPassionately create a unique product realization experience that our partners love.
oUR CoRe ValUes
Integrity Honesty, trustworthiness, and consistency in words and actions
Customer focus Building a strong partnership with customers by providing excellent and mutually beneficial solutions
Concern for others caring for co-employees, community, and country
excellence doing the best and continuously exceeding expectations
about IMI
Stringent sanitation protocols
aboUT THIs RePoRT
2020 aT a GlanCe
oUR Global fooTPRInT
MessaGe fRoM THe CHaIRMan
RePoRT fRoM THe PResIDenT & Ceo
• oPeRaTInG enVIRonMenT
• PeRfoRManCe HIGHlIGHTs
• bUsIness ReVIew
• oUR Global ResPonse To a Global CRIsIs
oUR leaDeRsHIP
CoRPoRaTe GoVeRnanCe
sUsTaInabIlITY RePoRT
• Our FramewOrk
• Our Integrated Value ChaIn
• hOw we Create and Share Value
• natural CapItal
• human CapItal
• management SyStem
fInanCIal sTaTeMenTs
Integrated mIcro-electronIcs, Inc.
40 Years of manufacturing technology and Innovation 40 Years of manufacturing technology and Innovation
2020 Integrated rePort
6 7

aboUT THIs RePoRT:
bUIlDInG a UnIfIeD CUlTURe TowaRDs sUsTaInable ManUfaCTURInGWith our customers’ products in almost every country in the world, ImI brings cutting-edge technology to our everyday lives.
Founded in 1980 in the Philippines, ImI has been enabling innovative solutions and technology firsts through electronics design, development, and manufacturing.
Today, we operate as a truly global company whose customers are diverse in many ways. The challenges are different. The cultures are different. The risks are different. The end markets are different. more than ever before, customers require guidance in navigating the wide range of complexities and opportunities in our operating environment.
That is why we excel in custom-tailoring our work to fit customer needs. We focus on building a stronger portfolio: one that spans regions and sectors; one that allows customers to benefit from our expertise, scale, and efficiency. And above all, we continue to build a unified culture that is powered by a deep commitment to form strategic partnerships and make positive contributions to our stakeholders.
From 100 employees within a single site, 40 years ago, we have grown to a 15,000-strong workforce across 21 sites, charting a path forward for sustainable technology because the future depends on it.
40 Years of Manufacturing Technology and Innovation
2020 INTEGRATED REPORT
98 40 Years of manufacturing Technology and Innovation

largest in the automotive Ems market**
in the list of top Ems/Odm providers in Europe***
* manufacturing market Insider 2020** New Venture Research 2020
*** in4ma marketresearch & Analyses 2020
Automotive
Aerospace/Defense
Consumer
Multiple Markets
Medical
Industrial
Telecom
46%
2%
4%
3%
6%
8%
31%
in the list of top Ems providers*
20 6 14th th th Company Highlights
Value Distributed Sustainability Impact
Total Employment
Water Consumed
Scope 1
Scope 2
Scope 3
Hazardous WasteRecycled and Recovered
Plastic WasteRecycled and Recovered
*Philippines Only
15,834
1.4MCUBIC METERS (ExClUDIng VIA gERMAny AnD CHInA, AnD VTS JAPAn)
503TOn CO2e
93kTOn CO2e
1.9kTOn CO2e
98.4%*
209k*
Operating Costs
Wages and Benefits Paid
Taxes Paid
Dividends Paid
2020AT A GLANcE
(in US$ millions) 2020 2019 2018 (As Restated)Key Performance Indicators
Revenues 1,135.8 1,250.4 1,349.4 net Income (loss) (3.5) (7.8) 47.2 EBITDA 58.9 41.4 72.2
Financial PositionTotal Assets 1,133.7 1,096.3 1,077.2 Capital Expenditures 18.7 38.8 65.0
Financial RatiosReturn on Equity -0.8% -2.0% 13.9%Current Ratio 1.54 1.49 1.31 Debt-to-Equity Ratio 0.41 0.55 0.79
Stock InformationStock price (year-end) (in PHP) 9.10 7.89 10.60 Issued and outstanding shares 2,217,293,215 2,217,293,215 2,217,293,215 Market capitalization (in PHP) 20,177,368,257 17,494,443,466 23,503,308,079 Earnings/(loss) per Share (US$ 0.002) (US$ 0.004) US$ 0.022 Common Dividend per Share - US$ 0.00201/ US$ 0.00458/
PHP0.10542 PHP0.235
(in US$ millions)
20202019
20202019
20202019
20202019
916.41,027.2
9.410.2
215.6226.8
-4.4
Ventilator manufacturing at STI, ltd.
IMI celebrated 10 years as a publicly listed company
VIA optronics was listed on the new york Stock Exchange (nySE)
IMI Philippines built prototypes of an alternative ventilator solution
Revenues by Market Segment
Integrated mIcro-electronIcs, Inc.
40 Years of manufacturing technology and Innovation 40 Years of manufacturing technology and Innovation
2020 Integrated rePort
10 11

15,834
423,775 M2
TOTAl HEADCOUnT
TOTAl FACTORy SPACE
USA
32
1,184 sqm
Germany
115
4,268 sqm
China
4,095
88,566 sqm
Czech Republic
297
7,740 sqm
Bulgaria
2,068
115,416 sqm
Serbia
243
50,213 sqm
Mexico
1,953
25,800 sqm
Philippines
6,338
108,641 sqm
Japan
124
10,520 sqm
United Kingdom
569
11,427 sqm
Onward to the next 40 years of ImI, from our 21 manufacturing sites across 10 countries, we shall continue to provide technology solutions that push the boundaries of global electronics manufacturing. We will press forward in exploring synergies, partnerships, and ventures in the areas of new technologies and emerging markets.
We are beyond ready to take the next giant leaps into the future.
Global fooTPRInT
1340 Years of manufacturing Technology and Innovation40 Years of manufacturing Technology and Innovation12
2020 INTEGRATEd REPORTINTEGRATEd mIcRO-ELEcTRONIcs, INc.

mEssAGE FROm THe CHaIRManDear shareholders,
Five years ago, we at the Ayala group set ambitious growth plans for 2020, viewing it as the next waypoint in our long-term strategic planning cycle. No one back then could have foreseen the emergence of cOVId-19 and the disruption it would cause across the globe. As of this writing, the virus has claimed over 2.6 million lives globally and caused the global economy to shrink by four percent year over year, demonstrating the vulnerability of our increasingly interconnected world. Almost no industry was spared. unlike previous crises, which tended to affect certain sectors disappropriately, it was a rare business that did not have to contend with the pandemic’s economic, human, and technological impact. In addition, across the global manufacturing sector, the industry continued to face several pre-existing headwinds, such as tightening supply chains, intensified competition, and geopolitical conflicts.
Jaime Augusto zobel de AyalaCHaIRMan
40 Years of Manufacturing Technology and Innovation 40 Years of Manufacturing Technology and Innovation
2020 INTEGRATED REPORT
14 15
INTEGRATEd mIcRO-ELEcTRONIcs, INc.

It was against this unprecedented economic backdrop that ImI proved its resiliency. The company felt the impact of cOVId-19 almost immediately. The factories in china cut back dramatically on production through January as the health issues reached crisis proportions. ImI faced varying levels of disruption in all operating sites across the globe. From the united Kingdom, to serbia, to Japan, and to its global headquarters in the Philippines, the company’s financial, operational, and technological strengths were put to the test.
Despite these remarkable challenges, IMI finished 2020 in a better financial position than the previous year, all while retaining its position as a top 20 electronics manufacturing solutions provider and achieving several key milestones that underscored the company’s operational flexibility and innovative approach. Business performance recovered strongly in the second half as global manufacturing demand returned close to pre-pandemic levels. ImI deployed
First, the relative swiftness of the recovery in global manufacturing, versus other sectors, has illustrated how well organized, globally competitive platforms in the industry can add diversity and economic value to individual business groups and to economies.
second, the uncertainty that permeates the medium term, as the health issues start to be addressed, requires continued prudence as we seek to preserve our gains.
Third, as we gradually move into the new normal, we will continue to rebuild our manufacturing capabilities while remaining aligned with the long-term megatrends of mobility, connectivity, and smart energy that hold the key to the company’s growth and global competitiveness.
And finally, this “reset” now offers a fresh opportunity to accelerate ImI’s ongoing initiatives to integrate sustainability into the fabric of our strategy, operations, and institutional culture.
Jaime Augusto zobel de Ayala
CHaIRMan
its global footprint and suite of capabilities to help mitigate the human and economic impact of the pandemic by leveraging its expertise in high reliability manufacturing to provide leading edge medical technology solutions. Among these products is a commercialized non-invasive ventilator for cOVId-19 patients. A key subsidiary, VIA optronics, also successfully went public in the third quarter of 2020, helping validate ImI’s strategy of creating proprietary platforms to help it remain competitive in an increasingly technology-driven world. And as the core manufacturing platform of Ac Industrials, ImI provided a strong base for the group’s other portfolio companies, in particular the KTm joint venture and our merlin solar startup, to continue to develop and grow through the pandemic.
As IMI embarks on its fifth decade of operations, allow me to offer a few key reflections as we look ahead.
2020 was not an easy year—for ImI, the Ayala group, and the Philippine and global economy. We are eager to move forward and capitalize on the opportunities that have appeared as a result of this economic upheaval. On behalf of the Board, I would like to thank our over 15,000 employees worldwide for their commitment, openness, and collaboration, and to our broader stakeholder community for the trust you continue to show in ImI.
Integrated mIcro-electronIcs, Inc.
40 Years of manufacturing technology and Innovation 17
2020 INTEGRATEd REPORT
40 Years of manufacturing Technology and Innovation16

RePoRT fRoM THe PResIDenT anD Ceo
Operating Environment
Performance Highlights
Business Review
Our Global Response to a Global crisis
22 24 25 30
IMI China
Integrated mIcro-electronIcs, Inc.
40 Years of manufacturing technology and Innovation 40 Years of manufacturing technology and Innovation
2020 Integrated rePort
18 19

Arthur R. Tan
PResIDenT & CHIef eXeCUTIVe offICeR
Dear fellow shareholders, employees, Partners, and other stakeholders,
2020 was a period of sweeping change across the world. Though cOVId-19 has taken its heavy toll on global health and international commerce, we at IMI are fighting back and contributing to society’s rise against this pandemic.
Arthur R. TanPResIDenT &
CHIef eXeCUTIVe offICeR
40 Years of Manufacturing Technology and Innovation 40 Years of Manufacturing Technology and Innovation
2020 INTEGRATED REPORT
20 21
INTEGRATEd mIcRO-ELEcTRONIcs, INc.

oPeRaTInG enVIRonMenT:
a year lIke nO Other
cOVId-19 brought the global economy to its knees, halting mobility, commerce, travel, and manufacturing to an unprecedented scale. coming from a 2.9 percent growth in 2019, the global economy was estimated to grow at 3.3 percent in 2020. By the end of the year, the global GdP contracted by 3.5 percent with hopes of an upswing recovery in 2021 hinged on the rollout of vaccines.
In the context of manufacturing, based on the JPmorgan Global manufacturing PmI (Purchasing manager’s Index) compiled by IHs markit, global output was on a deep contraction mode between February and June when most regions were in heavy lockdowns. The steepest decline was in may with a global index of 39.6. By the third quarter, business activities started to pick up and by the end of december, the index was at 53.8, already in expansion territory. This was also reflected in the global industrial production output which fell by more than 15 basis points in the second quarter, but was able to recover by december to almost the same levels before the pandemic started.
In the same way, worldwide semiconductor sales rebounded in the second half of the year and finished
the year higher by 6.5 percent to us$439 billion according to semiconductor Industry Association. As more employees shifted to work from home and students moved to online classes, the demand for consumer electronics and cloud computing services has surged after six years of decline and despite the negative growth that most economies experienced during the year. Specifically, global shipments of traditional Pcs, including desktops, notebooks, and workstations, grew 13.1 percent year-on-year to 302.6 million units according to International data corporation. This increase in the computing sector balanced the market declines in automotive, consumer, and telecommunications. Growth in the electronics manufacturing services (Ems) industry was estimated to be flat in 2020.
The automotive sector was one of the largest sectors affected by the pandemic with automotive light vehicle unit sales falling by more than 22 percent in the first half. By the third quarter, global sales began to recover, led by china which already exceeded their pre-pandemic demand. The year ended with a global unit sales decrease of 14 percent compared with the previous year with an ongoing recovery that is estimated to be at 8 percent in 2021.
Advanced driver-assistance systems
Electric vehicles (EVs) tell a different story. Global EV sales rose 43 percent to reach 3.24 million units for the first time, and their global market share increased to 4.2 percent in 2020 from 2.5 percent in 2019. Plug-in hybrid and EV accounted for more than 1 in 10 vehicle registrations in 2020, up from 1 in 30 in 2019. consumer demands for EVs were further propped up by the need to be safe and protected while being conscious of the environment.
In other related markets, IT spending and consumer electronics fell by 3 percent and 5 percent, respectively, as global retail sales dropped by 3 percent. There were also upsides in the market such as global E-commerce which went up by 27.6 percent. semiconductors were also up 6.5 percent buoyed by more electrification in automotive, electric vehicle charging, bedside telemetry, remote health monitoring, and smart home networks.
The demand for medical devices continues to increase, but the manufacturing of medical device units declined by 4.4 percent in 2020 as supply chains across all regions were hampered by the lockdowns and protocol changes in shipments. Ventilators are among the only few that experienced an increase in production as governments allocated resources and funding for immediate deployment.
In the energy sector, electricity generated from wind and solar sources has doubled over the last five years coinciding with a steady decrease in global coal production. china continues to be the world’s leader in coal production and power but also leads the world in new renewable power installations. In 2020, the demand for electricity from renewable sources went up by 3 percent. Almost 90 percent of new electricity generation in 2020 will be renewable, with just 10 percent powered by gas and coal. The trend puts green electricity on track to become the largest power source in 2025, displacing coal, which has dominated for the past 50 years. In particular, solar photovoltaic is now the cheapest source of electricity in most countries.
EV charging station
Automotive solar photovoltaic system
Consumer demand for EVs were further
propped up by the need to be safe and protected while being conscious of
the environment.
Integrated mIcro-electronIcs, Inc.
40 Years of manufacturing technology and Innovation 40 Years of manufacturing technology and Innovation
2020 Integrated rePort
22 23

PeRfoRManCe HIGHlIGHTs:
ClImBIng BaCk FrOm the DePTHs of THe CRIsIs
bUsIness ReVIew:
CoMInG oUT sTRonGeR anD beTTeR eQUIPPeD
At ImI, 2020 was a tale of two halves. Between February and June, economies were ravaged and entire countries forced to lockdown. In the face of uncertain futures, we approached the second half of the year as a chance to prove our mettle and rebound stronger. By growing 39 percent between the two halves, ImI delivered full-year revenues of us$1.14 billion compared to us$1.25 billion in 2019. Through streamlining of our operating structure and focusing on manufacturing efficiency, we were able to reduce our net loss to us$3.5 million, an improvement from the prior year’s loss of us$7.8 million.
managed to turn in a net profit of US$5.3 million in Europe and North America as a result of cost-saving measures and rapid recovery of global automotive production. In the Philippines, we recorded a net loss of us$12.8 million due in part to complex logistical and manpower issues stemming from country-wide difficulties.
Subsidiaries Via optronics and STI Ltd. finished the year with us$269 million of combined sales, a nine percent growth from the previous year. Net loss was at us$3.1 million, an improvement against 2019’s loss of us$6.1 million. By nurturing skilled talent and continued to expansion of capabilities, both VIA and sTI were able to execute for emerging demand within the global pandemic.
despite cOVId-19 halting most of global travel throughout the year, our sales teams secured new business wins amounting to us$234 million of annual revenue potential for ImI wholly owned subsidiaries. Through a strategic move to diversify within ImI target segments, project wins in the industrial segment now take up a 39 percent share of total annual revenue potential, up from 22 percent in 2019. meanwhile, sTI Ltd. overcame the continued uncertainty of the Brexit situation and won new manufacturing programs worth us$118 million of total project revenues.
As the cOVId-19 pandemic unfolded with much uncertainty, we implemented an organizational transformation at the start of 2019 to address the fast-changing dynamics in the market and continue delivering value to our stakeholders. Among the initiatives outlined, ImI institutionalized global key functions such as Technology (cTO), Operations (cOO), Procurement (cPO), and commercial (ccO). This also coincided with the expansion of the core support groups’ scope in the areas of finance, human resources, and information and communications technology. These efforts were crucial in helping ImI face an already challenging year, enabling the group to come out stronger and better equipped to succeed in today’s new normal, at the cusp of the age of disruption.
ManaGInG effICIenT oPeRaTIons
With reduced market demand in key sectors like automotive, coupled with government mandated lockdowns in china, the Philippines, and mexico, as well as shutdowns in Europe, the company’s facilities experienced considerable dips in manufacturing activity. To mitigate these constraints, ImI’s regional management teams secured various employee-related government subsidies, thereby reducing operating costs while implementing global cost saving initiatives. Furthermore, our domestic production offices closely worked with local government units to allow production for essential business lines in medical, connectivity, and mobility segments.
Even during difficult situations, overall quality and on-time delivery remain paramount to ImI. manufacturing performance metrics across ImI’s 21 production sites were monitored daily and managed by the global Industrial Excellence group providing management a real-time window for critical and predictive decisions that drive efficiency and profitability.
To seamlessly manage operational compliance to quality standards and directly monitor key statistics, corporate Quality was integrated into the global operations group. In 2020, critical metrics such as global IPB (Incidents Per Billion) have improved
with a 74 percent reduction from previous year, while cONQ (cost of Non-Quality) and csAT (customer satisfaction) were within global targets at 1.01 % (target: <1.2 %) and csAT rating 4.53 (target: 4.50), respectively. These improvements can be attributed to the continued implementation of the Quick Reaction Quality control (QRQc) discipline a proactive risk-based thinking that aims to achieve zero-defect mindset.
With the aim to pursue digitalization of processes within the manufacturing operations, ImI’s Global manufacturing solutions (Gms) group was established. The group spearheads the Industry 4.0 initiatives across all factories to provide speed, control, and visibility through a smart platform that delivers configurable dashboards. Discrete manufacturing data is fed to the dashboards showing real-time key performance indicators accessible on mobile interfaces. Through this platform, ImI team members across the globe are able to remotely contribute to maintaining the company’s principle of LEAN manufacturing across all facilities.
IMI China
IMI Mexico
We implemented an organizational transformation to address the fast-
changing dynamics in the market and continue delivering value to our
stakeholders.
Wholly owned businesses posted us$867 million of revenues led by our focus segments—automotive with us$490 million and industrial with us$262 million. Although first to be affected by the pandemic, our manufacturing teams in china responded swiftly and effectively to minimize major business disruptions, and ended the year with a net income of US$8.8 million, a significant improvement against a net loss of us$3.2 million in 2019. We likewise
Integrated mIcro-electronIcs, Inc.
40 Years of manufacturing technology and Innovation 40 Years of manufacturing technology and Innovation
2020 Integrated rePort
24 25

aMPlIfYInG CUsToMeR foCUs anD GRowTH
With unpredictable demand and varying customer needs, ImI’s commercial group channeled all efforts to sustain momentum and accelerate growth despite a significant reduction in face-to-face meetings, events, and tradeshows caused by the global outbreak. Nevertheless, the group took advantage of the available time and resources to drive more value through programs and initiatives involving new tools, and process redesigns through training and upskilling.
The company’s commercial group is composed of all the regional sales directors and heads of major business units. It was established with a balanced portfolio tapping on horizontal markets for mobility and industrial, and vertical markets for the power module and camera businesses. Apart from shifting sales focus to higher margin segments, part of the strategy was to also achieve shorter gestation periods for revenue generation and to focus on more box build and system assemblies. The group also optimized and expanded the businesses with its key customers through account sharing and key account management to tap regional and global opportunities.
initiative of diversifying within key focus segments, programs in the industrial segment have reached 39 percent of total wins, significantly greater than 2019’s level of 22 percent.
Re-CalIbRaTInG oUR sUPPlY CHaIn sTRaTeGIes
cOVId-19 proved to be a disruptive catalyst for many global organizations like ImI to reassess global supply chain strategies. With the rapid turn of events, we responded to immediate challenges as they happened, while initiating strategic plans to adopt digital supply network models and capabilities.Throughout the year, we endeavored to make our supply chain more resilient without sacrificing competitiveness. We mapped the full extent of our supply network and identified both direct and indirect sources. We addressed vulnerabilities by rallying our suppliers and stockpiling essential materials.
Towards the end of 2020, as the automotive sector moved towards a sharp rebound, we started to feel the impact of a global component shortage particularly with automotive integrated circuits. Based on the ongoing trend, the supply levels are expected to remain critical in the first half of 2021. Our strategy is to plan production based on available key parts and to strengthen our supply reach to ensure delivery of confirmed quantities. We also continuously maintain close communication with customers and suppliers to warrant planned allocations.
PRoVIDInG TeCHnoloGY anD PlaTfoRM solUTIons despite a challenging year, the technology group streamlined its focus to be more accessible to customers and continued to provide innovation and product solutions across all customer-focused units.
Within our mobility segment, we supplied key product solutions for critical and environmentally focused systems including pump electronic control units (Ecus), motor controls as well as full telemetry systems utilizing an internally developed platform that provides automotive grade traceability and system monitoring for vehicles. Our us teams achieved strong development wins and delivered complex electronics, including smart motor sensors, medical devices as well as new technologies for the growing EV market. Our progress in the Internet of Things (IoT) has been extensive with increasing platform solutions we
continue to develop while offering a fast response to customer projects. These include key partnerships with global platform providers that enable and ensure hardware to support platform and service needs, including 4G/5G, NB IoT/cAT m1, GPs/satellite, and a multitude of sensors that provide real-time data solutions. In Asia, our china team continued to provide fast delivery of industrial and Human Interface machine (HmI) solutions supporting our china facilities’ high-volume product lines, while supporting international projects on sensors, communication, and HmI products.
unlOCkIng the Value OF dIgItalIZatIOn
Before the pandemic, ImI had already outlined its plan to undertake a digital transformation journey. It involved a three-fold scalable plan: digitization, digitalization, and digital Transformation. The pace of implementation was effectively hastened when cOVId-19 disrupted business and manufacturing activities.
The company’s Information and communications Technology (IcT) division had the responsibility of the overall vision of ImI’s digital transformation with collaborative help from all the global support groups. The plan focused on building a robust infrastructure to support a broad range of new demands while keeping in mind key strategic priorities—business productivity, infrastructure optimization, security and compliance, and a mature IcT community.
To ensure business productivity, we refined our business continuity plans (BcP) and maintained safety in our manufacturing sites through development of manpower monitoring, contact tracing system, health declaration system, and other directives. most notably, we built a trusted ecosystem for all our online platforms to facilitate remote work arrangements.
At the same time, we eliminated inefficiencies and redundancies, simplified processes, and managed information more proficiently. We continually improved the company’s enterprise resource systems and benchmarked traceability systems and “Poka-yoke” (mistake proofing) across all sites.
Re-calibrating supply chain strategies
Among the key programs implemented by the group are the contract life management program which automates and streamlines contract processes during key stages, enhancement of pipeline deals information report, and improved request for quotation (RFQ) process.
The continuous effort of the group to expand ImI’s customer base resulted to new program wins totaling us$234 million of annual revenue potential from a total of 876 request for quotations. The won business portfolio remains dominated by the mobility segment, taking 55 percent on the total pie. In line with ImI’s
Automotive sensors
At ImI’s core is our automotive customer relationships and we continued to provide vision systems supporting progression into the new era of mobility. The systems provide critical vision solutions, including surround-View, E-mirrors, AdAs, driver monitoring, as well as a technical platform for LidAR and future segment requirements within the camera and vision technologies. With the growth in vehicle electrification and power needs across multiple segments, our power module business carried on to provide high-reliability modules and solutions, while our technology group focused on ensuring that our service offering and capabilities are aligned to provide the new technology requirements in this sector. moving forward, the team will continue to provide exceptional service offerings to our customers across all our segments. We will ensure that our platforms and technology capabilities are at the leading edge of our customer journeys to provide a true collaborative offering.
Our technology group streamlined its focus to be more accessible
to customers and continued to provide
innovation and product solutions across all our customer-focused units.
Integrated mIcro-electronIcs, Inc.
40 Years of manufacturing technology and Innovation 40 Years of manufacturing technology and Innovation
2020 Integrated rePort
26 27

In infrastructure optimization, we saw an increase in quality and speed of service as we took advantage of modern platform technologies. We implemented a cloud adoption strategy (adopt-cloud first), a business practice that aims to utilize cloud service as much as possible, focusing on resiliency and migration to the latest platforms and change management improvement systems.
In the area of security and compliance, we focused on strengthening cybersecurity and privacy by conducting activities to bolster cyber security controls and resource allocation as well as upgrades to ensure the security of the company’s confidential information. Our IcT group also partnered with Internal Audit and Enterprise Risk management (ERm) team in the deployment of Information security management system (Isms), Business contingency Planning (BcP), and Business Impact Analysis (BIA).
IMPRoVInG effICIenCY THRoUGH DIGITal TRansfoRMaTIon
Processing financial data in a timely manner proved to be crucial in formulating action plans to mitigate the effects of the pandemic. Through accurate forecasting and judicious target-setting, IMI’s finance group was able to drive cost rationalization measures and effective cashflow management that preserved the company’s financial strength. Regional finance teams also prioritized staff welfare by coordinating with local government units to secure various forms of employee-related subsidies in Bulgaria, china, czech Republic, France, mexico, serbia, and singapore.
moving forward, the team seeks to accelerate digital transformation to simplify processes, improve efficiency, and increase business value. Among the key activities in 2020 were the successful roll out of a cloud-based consolidation software, implementation of host-to-host payment systems, and other paperless processes to improve efficiency.
CollaboRaTInG foR UnITY anD aCTIon
From the onset of the pandemic in February, our priorities were clearly established to get through the crisis: to protect our employees’ health and safety, to ensure business continuity, and to support our partners and the community around us.
To protect our employees’ physical health and financial security in this period of heightened uncertainty, we focused on monitoring our
employees’ health and implemented measures across the different sites. ImI deployed various instruments for financial support to employees such as advancing 13th month pay, advance use of paid leave credits and hazard fee for the onsite skeleton workforce.
To ensure business continuity, onsite accommodation and transportation for ImI’s skeleton workforces were arranged in many of our sites. We shifted our focus and resources to manufacture components for essential and critical products to fight COVID-19. These not only allowed ImI to resume some level of operations but also helped with the overall efforts to overcome this global pandemic.
To ensure safety of our employees onsite and on work-from-home arrangements, we implemented virtual solutions and enhanced our services through implementation of medical tele-consultations, ImI chatbot, canteen cashless payment system, online separation system, among others.
To further hone and enhance the skills of all employees specially during the pandemic, ImI, through the Learning & development (L&d) group, organized different initiatives and programs, optimizing the use of the company’s Learningmanagement system (Lms) to overcome the limitations of operating without physical and social interactions. different courses and modules were created and offered to the employees through the online E-Learning portal and other platforms to ensure that employees remain competent, well-trained, and skilled in their respective processes.
To further support our partners and the communities around us, the spirit of volunteerism was kept alive and well with employees extending their time
and financial resources to aid the most vulnerable sectors of society. Other programs in the areas of self-reliance and mental health were also conducted ensuring that employees and their families are provided support in these challenging times.
Overall coordination, enhanced cooperation, and unity proved to be crucial in overcoming the crisis not only in terms of our collaboration as a company but also with the private and public sectors. With a culture of purposeful unity and action in mind, we intend to continue these partnerships even beyond this crisis while holding true to our core values of integrity, excellence, customer focus and concern for others.
StI limited (uk)
The aerospace and defense (A&d) segment of ImI is fully within sTI Limited (sTI Ltd.). Within this segment, the company has continued to provide complex radio frequency (RF) and satellite communications products to both existing and new customers. 2021 will provide further growth through business wins in mission critical solutions being provided through our uK subsidiary.
IMI Philippines
STI, ltd. (UK)
VIA optronics (germany)
government assistance to develop and manufacture critical ventilator products including product testing specifically for high-throughput environments. Further development on low oxygen ventilator solutions and next generations testing solutions continued for launch in early 2021.
To capitalize on the latest trends towards 5G and IoT in the automotive industry, sTI Ltd. continued expansion into the development and manufacturing of new automotive telematics systems. Telematics devices connect to the On-Board diagnostics of a vehicle to gain rich data on events, performance, tracking, and internal subsystems. Information collected can then be interpreted and transferred wirelessly to a device management platform for use by companies and drivers.
VIa optronics
In 2020, VIA optronics capitalized on the surge of demand for mobile computing devices that enabled work from home arrangements. While display solutions for consumer and industrial laptops were a significant part of business in 2020, VIA also continued to transition its operations towards the mobility market by partnering with leading manufacturers in both traditional and EV spaces. By leveraging proprietary processes and materials, VIA is able to offer large cold form glass and display assemblies for the cutting-edge automotive market.
cOVId-19 has imposed unprecedented circumstances on the uK’s medical industry throughout 2020 and into Q1 2021. The situation created new demands for agility, resilience, and collaboration to overcome the constant challenge. In spring 2020, the uK’s ability to deal with cOVId-19 was severely tested as an over-reliance on long complex supply chains resulted in inadequate levels of personal protective equipment (PPE) and life-saving medical equipment. sTI Ltd. responded swiftly to the country’s pressing needs in the medical sector, adapting business practices and dedicating resources to contribute in the fight against cOVId-19 by participating in the country’s Ventilator challenge program. This includes activities with
The company raised us$93.75 million of gross proceeds through an initial public offering in september 2020 which listed VIA on the New York Stock Exchange under the ticker symbol “VIAO”. In addition, the company forged a strategic commercial partnership with corning Research & development corporation which purchased shares in the VIAO worth us$20 million in a concurrent private placement.
Integrated mIcro-electronIcs, Inc.
40 Years of manufacturing technology and Innovation 40 Years of manufacturing technology and Innovation
2020 Integrated rePort
28 29

a Global ResPonse To a Global CRIsIs
safeGUaRDInG THe HealTH, safeTY, anD well-beInG of oUR eMPloYees
circulation of relevant cOVId-19 information across the organization through various communication channels
For the first time in history, every business in the world is facing a common threat—cOVId-19. In this period of great uncertainty and complexity, our corporate values have never been more relevant. They define how we are led as a business, and how we respond to people and situations.
In response to this crisis, the health and safety of our employees and all stakeholders remain our primary concern. As the pandemic continues to evolve, we are closely monitoring and strictly implementing the health and safety protocols established by local, national, and global health agencies including the World Health Organization (WHO). We have identified three priorities:
leGenD
A ImI china (Kuichong)B ImI Japanc ImI Philippines (PH)d ImI china (Jiaxing)E ImI china (Pingshan)F ImI china (chengdu)G ImI china (Pingshan)
• Implementation of preventive health and safety standards in compliance with government requirements and other reasonable protocols;
a
e
G
f
D
b
C
• Provision of financial assistance and support to employees affected by the lockdown and quarantine; and the
• Implementation of flexible and alternative work arrangements.
- Travel bans and restrictions to external visitors
- Temperature checking upon entry to any of our facilities
- Health monitoring and declaration checklist (via app)
- Enhanced and regular disinfection of facilities and work areas
- disinfection and other hygiene implements
- constant reminders of physical distancing protocols, signages, and installation of physical barriers in all common areas
- cOVId-19 testing as needed
1
Integrated mIcro-electronIcs, Inc.
40 Years of manufacturing technology and Innovation 40 Years of manufacturing technology and Innovation
2020 Integrated rePort
30 31

ensURInG bUsIness ConTInUITY
• Creation of crisis management teams across all sites;• Upgrading of necessary digital infrastructure to
support remote work, online meetings, video, and teleconferencing;
• Construction of temporary dormitories in IMI Philippines to host skeletal workforce and third party service providers on-site; and
• Continuous employee training and development via E-learning app.
sUPPoRT foR anD CollaboRaTIon wITH PaRTneRs anD CoMMUnITIes
• Collaboration and information-sharing with relevant private and public institutions to minimize the spread of the disease;
• Health and safety protocols extended to all stakeholders; and the
• Participation in site inspections conducted by government authorities as regards implementation of preventive measures.
• Participation in various volunteer initiatives in local communities
leGenD
H ImI Philippines (PH)I ImI serbiaJ ImI czech RepublicK ImI BulgariaL ImI singaporem sTI Ltd. (ventilator
production assembly)N ImI usAO ImI mexico
J
k
H
I
n
o
M
l
- Financial assistance through a donation drive to those affected by “no work, no pay” frontliner employees of ImI partners
- ImI czech employees made reusable face masks for staff and the community
- sTI Ltd. employees participated in a fund-raising cycling event for cOVId-19 prevention
- ImI china employees participated in community volunteer work for monitoring of temperature
2
3
Integrated mIcro-electronIcs, Inc.
40 Years of manufacturing technology and Innovation 40 Years of manufacturing technology and Innovation
2020 Integrated rePort
32 33

StI ltd. reCOgnIZed aS a
“GReaT InsPIRaTIon”
sTI Ltd. received a national recognition for its response to the coronavirus pandemic and named one of UK government’s “GREAT Inspirations” campaign.
* the company was feted for having done extraordinary things above and beyond
what was necessary
* bravely faced the manufacturing scale-up challenge of building ventilators in the large volumes required by the front-line National
Health service (NHs) teams in the uK
In support of the Philippine government’s call for the local sourcing and manufacturing of low-cost ventilators and other breathing aid solutions in caring for cOVId-19 patients, ImI Philippines along with sTI Ltd. organized a virtual consultative and information-sharing session with medical experts, health practitioners, and concerned government agencies to explore non-invasive alternative ventilatory strategies using the continuous positive airway pressure (cPAP) device solution.
• The ventilatory device is a form of breathing aid that applies mild air pressure continuously and effectively supports patients with breathing difficulties.
• Its design is licensed from the University college London Hospital (ucLH) and mercedes-AmG High Performance Powertrains under special conditions particularly for use in cOVId-19 cases. The proponents in the uK granted a license to ImI PH to manufacture the device.
In August last year, ImI PH received certification from the Food and drug Administration (FdA) for the alternative ventilator solution and passed the inspection audit.
• As a key member of the Ventilator Challenge UK consortium, sTI Ltd. was tasked with manufacturing ventilators for the country and did so at record pace.
• The consortium is a group of industrial, technology, and engineering businesses from across various sectors that came together in response to the government’s call for manufacturers to help build ventilators.
• STI Ltd. set up an assembly line at its Hook facility and took on and trained 160 additional staff to work on the project, with the team completing the 11,649 devices by middle of 2020.
IMI PHIlIPPInes InTRoDUCeD an alTeRnaTIVe VenTIlaToRY DeVICe
Integrated mIcro-electronIcs, Inc.
40 Years of manufacturing technology and Innovation 40 Years of manufacturing technology and Innovation
2020 Integrated rePort
34 35

oUR leaDeRsHIP
Arthur R. Tan
PResIDenT & CHIef eXeCUTIVe offICeR - IMIGROuP PREsIdENT ANd cHIEF EXEcuTIVE OFFIcER – Ac INdusTRIALs
ResIlIenT and UnwaVeRInG
cOVId-19 is far from over, but 2020 was a true test to ImI’s resiliency, and I am thrilled to see each of our hard-working teams emerge stronger, wiser, and more united in the face of adversity. Our successes have bolstered our commitment to pushing technological boundaries and driving the world towards the next generation of electronics innovation.
On behalf of the Board and management committee, I would like to thank you for standing by us and persevering through these challenges with us. I want to express my gratitude to our stakeholders for their constant trust, our employees around the world for their commitment, and you, our shareholders, for investing in ImI.
Integrated mIcro-electronIcs, Inc.
40 Years of manufacturing technology and Innovation 40 Years of manufacturing technology and Innovation
2020 Integrated rePort
36 37

boaRD of DIReCToRs
JaIme auguStO ZOBel de ayalachairman
Jaime Augusto zobel de Ayala, Filipino, 61, has served as chairman of the Board of directors of ImI since January 1995. He holds the following positions in publicly listed companies: chairman and cEO of Ayala corporation; chairman of Globe Telecom, Inc. and Bank of the Philippine Islands; and Vice chairman of Ayala Land, Inc., manila Water company, Inc., and Ac Energy corporation (formerly Ac Energy Philippines, Inc.). He is also the chairman of Ayala Retirement Fund Holdings, Inc., Ac Industrial Technology Holdings, Inc., Ac Ventures Holding corp., Ac Infrastructure Holdings corporation, Ac Energy International, Inc. and Asiacom Philippines, Inc.; co-chairman of Ayala Foundation, Inc. and Ayala Group club, Inc.; director of Alabang commercial corporation, Ayala International Pte. Ltd., Ac Energy and Infrastructure corporation (formerly Ac Energy, Inc.), Ayala Healthcare Holdings, Inc., Light Rail manila Holdings, Inc. and AG Holdings Ltd. Outside the Ayala Group, he is a member of various business and socio-civic organizations in the Philippines and abroad, including the JP morgan International Council, JP Morgan Asia Pacific Council, and mitsubishi corporation International Advisory council. He sits on the board of the singapore management university and on various advisory boards of Harvard university, including the Global Advisory council, HBS Board of Dean’s Advisors, and HBS Asia-Pacific Advisory Board, which he chairs. He is chairman Emeritus of the Asia Business council, a member of the Global Board of Adviser of the council on Foreign Relations, and co-Vice chairman of the makati Business club, chairman of Endeavor Philippines, and a board member of Eisenhower Fellowships. He was awarded the Presidential medal of merit in 2009, the Philippine Legion of Honor with rank of Grand commander in 2010, and the Order of mabini with rank of commander in 2015 by the President of the Philippines in recognition of his outstanding public service. In 2017, he was recognized as a united Nations sustainable development Goals Pioneer by the uN Global compact for his work in sustainable business strategy and operations. The first recipient of the award from the Philippines, he was one of 10 individuals recognized for championing sustainability and the pursuit of the 17 sdGs in business. He graduated with B.A. in Economics (cum laude) from Harvard college in 1981 and obtained an mBA from the Harvard Graduate school of Business in 1987.
FernandO ZOBel de ayaladirector
Fernando zobel de Ayala, Filipino, 60, has served as a director of ImI since January 1995. He holds the following positions in publicly listed companies: Director, President, and Chief Operating Officer of Ayala corporation; chairman of Ayala Land, Inc. and manila Water company, Inc., and Ac Energy corporation (formerly Ac Energy Philippines, Inc.); director of Bank of the Philippine Islands and Globe Telecom, Inc.; and Independent director of Pilipinas shell Petroleum corporation. He is the chairman of Ac International Finance Ltd., Liontide Holdings, Inc., Ac Energy and Infrastructure corporation (formerly Ac Energy, Inc.), Ayala Healthcare Holdings, Inc., Automobile central Enterprise, Inc., Alabang commercial corporation, Accendo commercial corp. and Hero Foundation, Inc.; co- chairman of Ayala Foundation, Inc. and Ayala Group club, Inc.; Vice-chairman of Ac Industrial Technology Holdings, Inc., ALI Eton Property development corporation, ceci Realty Inc., Fort Bonifacio development corporation, Bonifacio Land corporation, Emerging city Holdings, Inc., columbus Holdings, Inc., Berkshires Holdings, Inc., AKL Properties, Inc., Ac Ventures Holdings corp., and Bonifacio Art Foundation, Inc.; director of LiveIt Investments, Ltd., AG Holdings Ltd., Ac Infrastructure Holdings corporation, Altaraza development corporation, Asiacom Philippines, Inc., Ayala Retirement Fund Holdings, Inc., Honda cars Philippines, Inc., Isuzu Philippines corporation, and manila Peninsula; member of the Board of INsEAd Business school and Georgetown university; member of the International Advisory Board of Tikehau capital and of the Hispanic society museum & Library International Advisory council; Vice chairman of the Philippine-singapore Business council, member of the World Presidents’ Organization and chief Executives Organization; chairman of Habitat for Humanity International’s Asia-Pacific Capital Campaign Steering committee; and member of the Board of Trustees of caritas manila, Pilipinas shell Foundation, and the National museum. He graduated with B.A. Liberal Arts at Harvard college in 1982 and holds a cIm from INsEAd, France.
Integrated mIcro-electronIcs, Inc.
40 Years of manufacturing technology and Innovation 40 Years of manufacturing technology and Innovation
2020 Integrated rePort
38 39

aRTHUR R. TanPresident & Chief Executive Officer
Arthur R. Tan, Filipino, 61, has been a member of the Board of directors of ImI since July 2001. He has been the Chief Executive Officer of IMI since April 2002 and was re-elected as President effective January 1, 2020. concurrently, he is a senior managing director of Ayala corporation and a member of the Ayala Group management committee. He is also the Group President and Chief Executive Officer of AC Industrial Technology Holdings, Inc. concurrently, he is also the chairman of the Board and Chief Executive Officer of PSi Technologies Inc. and merlin solar Technologies (Phils.), Inc.; President and Chief Executive Officer of speedy-Tech Electronics Ltd.; chairman of the Board of surface Technology International (sTI) Ltd., chairman of the Advisory Board of Via Optronics GmbH and mT Technologies GmbH. He was the President of ImI from July 1, 2001 to June 23, 2016. Prior to ImI, he was the Northeast Area sales manager and Acting design center manager of American microsystems Inc. (massachusetts, usA), from 1994 to 1998, of which he became the Managing Director for Asia Pacific Region/Japan from 1998 to 2001. He graduated with B.s. in Electronics communications Engineering degree from mapua Institute of Technology in 1982 and attended post-graduate programs at the university of Idaho, singapore Institute of management, Imd, and Harvard Business school.
raFael C. rOmualdeZdirector
Rafael c. Romualdez, Filipino, 58, has been a director of ImI since may 1997. He is a director of Resins Incorporated (RI) and sits in the boards of several of its affiliates: RI Chemical Corporation, chemserve Incorporated, claveria Tree Nursery, Incorporated (cTNI), and Bio Renewable Energy Ventures Incorporated (BIOREV); he is also chairman of Philippine Iron construction and marine Works, Incorporated (PICMW), Pacific Resins, Incorporated (PRI), and mc shipping corporation, also subsidiaries of RI. He is a director of Lakpue drug Incorporated and La croesus Pharma Incorporated. He earned a Bachelor of Arts degree in mathematics from Boston college in 1986 and a master in Business Administration from George Washington university in 1991.
Jose IGnaCIo a. CaRlosdirector
Jose Ignacio A. carlos, Filipino, 51, has been a director of ImI since december 2006. concurrently, he is the President of Polymer Products Philippines, Inc. and AVc chemical corporation. He is also a member of the Board of directors of Resins, Inc., Riverbanks development corporation, mindanao Energy systems, Inc., cagayan Electric Power and Light co., and Philippine Iron construction and marine Works, Inc. He is not a director of any publicly listed company in the Philippines other than ImI. He earned a Bs management degree from the Ateneo de Manila University in 1991 and finished master of Business Administration at the Johnson Graduate school of management cornell university in 1999.
Integrated mIcro-electronIcs, Inc.
40 Years of manufacturing technology and Innovation 40 Years of manufacturing technology and Innovation
2020 Integrated rePort
40 41

delFIn l. laZarOdirector
Delfin L. Lazaro, Filipino, 73, has served as member of the Board of ImI since may 2000. He holds the following positions in publicly listed companies: director of Ayala corporation, Ayala Land, Inc., manila Water company, Inc., and Globe Telecom, Inc. His other significant positions include: Chairman of Atlas Fertilizer & chemicals Inc., chairman and President of A.c.s.T. Business Holdings, Inc.; Vice chairman and President of Asiacom Philippines, Inc.; director of Ac Industrial Technology Holdings, Inc., AYc Holdings, Ltd.., Ac International Finance, Ltd., Purefoods International Limited and Probe Productions, Inc. He is an Independent Adviser to the Board of directors of Ayala Land, Inc. He graduated with Bs metallurgical Engineering at the university of the Philippines in 1967 and took his mBA (with distinction) at Harvard Graduate school of Business in 1971.
JOSe teOdOrO k. lImCaOCOdirector
Jose Teodoro K. Limcaoco, Filipino, 57, has been a director of ImI since April 8, 2016. He also holds the following positions in publicly listed companies: chief Finance Officer, Chief Risk Officer, Chief Sustainability Officer and Finance Group Head of Ayala Corporation. He is a director of Globe Telecom, Inc. and Bank of the Philippine Islands, and an Independent director of ssI Group, Inc., all publicly listed companies. He is the chairman of Ac Energy International, Inc. (formerly Presage corporation), darong Agricultural and development corporation and zapfam Inc. He is the President and cEO of Ac Ventures Holding corp., AYc Finance Limited, Ac International Finance Limited. He is the Vice chairman of Lagdigan Land corporation. He is the President of Liontide Holdings, Inc. and of Philwater Holdings company, Inc. He is a director of Ayala Hotels, Inc., Ac Energy and Infrastructure corporation (formerly Ac Energy, Inc.), Ayala Healthcare Holdings, Inc., Ac Infrastructure Holdings corporation, Ayala Aviation corporation, Asiacom Philippines, Inc., Ayala Group Legal, michigan Holdings, Inc., Ac Industrial Technology Holdings, Inc., A.c.s.T Business Holdings, Inc., Bestfull Holdings Limited, Purefoods International Limited, AYc Holdings Limited, AG Holdings Limited, Fine state Group Limited, AG Region Pte. Ltd., Ayala International Holdings Limited, Ayala International Pte.
eDGaR o. CHUaIndependent director
Edgar O. chua, Filipino, 64, has been an Independent director of ImI since April 2014 and its Lead Independent director since August 16, 2017. He is currently an independent director of metropolitan Bank and Trust company, a publicly listed company, Energy development corporation, and Philcement. He is also in the advisory boards of mitsubishi motors Philippines corporation and coca cola Bottlers corp. He is the chairman of the makati Business club, college of saint Benilde, university of st. La salle Bacolod, and the Philippine Eagle Foundation. He is also President of de La salle Philippines. He is also a trustee of various civic and business organizations. He had been the country chairman of the shell companies in the Philippines from september 2003 to October 2016. He had corporate responsibility for the various shell companies in the exploration, manufacturing, and marketing sector of the petroleum business. Likewise, he also oversaw the shared services operations and various shell holding companies. Outside the Philippines, he held senior positions as Transport Analyst in Group Planning in the uK and as General manager of the shell company of cambodia. mr. chua earned his Bachelor of science degree in chemical Engineering from de La salle university in 1978 and attended various international seminar and courses including the senior management course in INsEAd, France.
Ltd., strong Group Limited, Total Jade Group Limited, VIP Infrastructure Holdings Pte. Ltd., AI North America, Inc., LIcA management Inc., and Just For Kids, Inc. He is the Treasurer of Ayala Retirement Fund Holdings, Inc. He joined Ayala corporation as a managing director in 1998. Prior to his appointment as cFO in April 2015, he held various responsibilities including President of BPI Family savings Bank, President of BPI capital Corporation, Officer-in-Charge for Ayala Life Assurance, Inc. and Ayala Plans, Inc., Trustee and Treasurer of Ayala Foundation, Inc., President of myAyala.com, and cFO of Azalea Technology Investments, Inc. He served as the President of the chamber of Thrift Banks from 2013-2015. He was named as the ING-Finex cFO of the Year in 2017. He has held prior positions with JP morgan & co. and with BzW Asia. He graduated from stanford university with a Bs mathematical sciences (Honors Program) in 1984 and from the Wharton school of the university of Pennsylvania with an mBA (Finance and Investment management) in 1988.
Integrated mIcro-electronIcs, Inc.
40 Years of manufacturing technology and Innovation 40 Years of manufacturing technology and Innovation
2020 Integrated rePort
42 43

sHeRIsa P. nUesaIndependent director
sherisa P. Nuesa, Filipino, 66, has been an Independent director of ImI since April 2018. currently, she is the President and director of the ALFm mutual Funds Group and will serve as such until march 31, 2021. Also, she is an Independent director of the following publicly listed companies: manila Water company, Inc., Ac Energy corporation (formerly Ac Energy Philippines, Inc.), Ayala Land, Inc., and Far Eastern university. she is also an Independent director of FERN Realty corporation and East Asia computer center Inc. she is a senior Adviser to the Boards of metro Retail stores Group, Inc. and Vicsal development corporation. she is a member of the boards of trustees of the Institute of corporate directors, the Judicial Reform Initiative, and the Financial Executives (FINEX) Foundation. In addition to her background as a Chief Finance Officer and currently as a Board director, she also held previous positions in management operations and has been active in speaking and lecturing engagements. She had been the Chief Finance Officer and Chief Administration Officer of IMI from January 2009 to July 2010. she was then a managing director of Ayala corporation and served in various capacities in Ayala corporation, Ayala Land, Inc., and manila Water company, Inc. she was awarded the ING-FINEX cFO of the Year for 2008. she received a master in Business Administration degree from the Ateneo Graduate school of Business in manila. she also attended post-graduate courses in Harvard Business school and in stanford university. she graduated summa cum laude with a degree of Bachelor of science in commerce from the Far Eastern university in 1974. She is a Certified Public Accountant.
HIRosHI nIsHIMURaIndependent director
Hiroshi Nishimura, Japanese, 68, has been an Independent director of ImI since June 17, 2020. He had served as an Independent director of the company from April 2010 to April 15, 2020. He is the chairman and President of Linkwest International consultancy services, Inc. He also serves as the Executive Vice President of All Purpose Appliances & multi-Products, Inc. He served as President of Panasonic communications Philippines corporation (PcP), formerly known as Kyushu matsushita Electronics Philippines (PKmE), from 2000-2007. He is not a director of any publicly listed company in the Philippines other than IMI. He finished a degree in Electronics Engineering course at Kurame university in 1976.
DIosDaDo P. banaTaoIndependent director
diosdado P. Banatao, Filipino, 74, has served as an Independent director of the company since April 15, 2020. He had been a director of ImI from 1994 to 2014. He served as managing partner of Tallwood Venture capital and was a venture partner at the Mayfield Fund. He co-founded three technology startups: s3, chips & Technologies, and mostron. He held positions in engineering and general management at National semiconductor, seeq Technologies, Intersil, and commodore International. He pioneered the Pc chip set and graphics acceleration architecture that continue to be two of the foundation technologies in every Pc today. He is honored by stanford university as one of the leaders in the development of Ethernet and was the developer of the first Ethernet chip at sEEQ & Technologies. Ethernet is the standard for moving data around enterprises and homes and is a key component to today’s internet. mr. Banatao is credited with developing several key semiconductor technologies and is regarded as a silicon Valley visionary. He serves as chairman of Blaize, Inc. and is Emeritus chairman at INPHI after serving as chairman for 20 years. He also served as chairman and led investments in siRF Technology, acquired by csR; marvell Technology Group; Acclaim communications, acquired by Level One; Newport communications, acquired by Broadcom; cyras systems, acquired by ciena; stream machine, acquired by cirrus Logic; and Wilocity, acquired by Qualcomm. mr. Banatao holds a B.s.E.E degree, cum laude, from the mapua Institute of Technology in the Philippines and an m.s. in Electrical Engineering from stanford university.
Integrated mIcro-electronIcs, Inc.
40 Years of manufacturing technology and Innovation 40 Years of manufacturing technology and Innovation
2020 Integrated rePort
44 45

ManaGeMenT CoMMITTee
RosalYn o. TesoRoChief Information Officer
nICk daVeyChief Technology Officer
fRanCIsCo RoMeRo MIlánChief Human Resources Officer
aRTHUR R. TanPresident and Chief Executive Officer
JeRoMe s. TanChief Finance Officer
eRnesT anGChief Procurement Officer
MaRY ann s. naTIVIDaDChief Commercial Officer
eRIC De CanDIDoChief Operations Officer
Integrated mIcro-electronIcs, Inc. 2020 Integrated rePort
4740 Years of manufacturing Technology and Innovation40 Years of manufacturing Technology and Innovation46

PsI TeCHnoloGIes, InC.
TeCHnoloGY & InnoVaTIon GRoUP
sUPPoRT GRoUP
oPeRaTIons GRoUP
ManaGeMenT TeaM
PHIlIPPInes Andrew c. carreon (OIc)
CHIna Yeung Hin Wai (Jacky) noRTH aMeRICa Thomas cavaneget
eURoPe Eric de candido (OIc)
Global InDUsTRIal eXCellenCe Lionel clouet Global QUalITY dr. Leonorina cada
Global nPI Paul Tomlinson
Global ManUfaCTURInG solUTIons Jawaharlal K. milanes
sInGaPoRe Jerome s. Tan
Usa Timothy Patterson
bUsIness UnIT Mobility Thibaut de Vaureix
Industrial & others mike Greenlee
Power ModuleJean marc Renard
Camera John Roderick Javate (OIc)
Lucrecio B. mendoza
fInanCe Jaime G. sanchezAnthony Raymond P. Rodriguez
sales Taketoshi Arita dick GlimmerveenGayeLyn Batesma. Alicia carla G. BuencaminoQing cheng Ren
sUPPlY CHaIn zheng Xianlai (Peter)Philippe AntunezJoy A. BondocJiz LingPooh choon Yong (max)Jack Pan faCIlITIes Geronimo B. magsombol
Andrew c. carreonBlesilda L. santiago
Jürgen Eichnerdaniel Juergens
simon Bestdavid Taylor
sTI
VIa oPTRonICs GMbH
CoRPoRaTe GoVeRnanCe RePoRT
Integrated mIcro-electronIcs, Inc.
40 Years of manufacturing technology and Innovation 40 Years of manufacturing technology and Innovation
2020 Integrated rePort
48 49

IMI’s commitment to the principles of good corporate governance demonstrates its continuous advocacy to create and sustain increased value in the Corporation for all of its stockholders and other stakeholders.
The company has clearly set forth the principles of appropriate supervision and good management thereby laying the groundwork for development and implementation of value-creating activities. The company ensures accountability, fairness, and transparency on the agreed principles of governance to all stockholders and other stakeholders concerned, thus, safeguarding their rights as well as promoting their participation in the corporate governance process.
ImI is in full compliance with the code of corporate Governance for Publicly-Listed companies set forth by the securities and Exchange commission (sEc), and supported by an attestation from the company’s cEO, Compliance Officer and the Chief Audit Executive for 2020 on the adequacy of the company’s system of internal controls, risk management, compliance, and governance processes.
The company and its respective directors, management, officers, and employees commit themselves to the principles and best practices on good corporate governance as embodied in its corporate Governance manual. The company makes continuing effort to create awareness of good corporate governance within the organization, at the same time declaring its continuing commitment to the company’s vision and mission.
Reflecting its dedication to continuous improvement, ImI received the Golden Arrow 2 recognition for the 2019 AsEAN corporate Governance scorecard Assessment (one level higher than previous year’s Golden Arrow 1 award) awarded by the Institute of corporate directors through a virtual domestic recognition last February 19, 2021.
boaRD sTRUCTURe anD PRoCess
THe boaRD of DIReCToRs
The Board of directors is the supreme authority in matters governing and managing the business of the corporation. Within their authority under the corporation code and other applicable laws and the By-laws of the corporation, the directors, acting as a Board, have the fullest powers to regulate the concerns of the corporation according to their best judgment.
It is the board’s responsibility to promote and adhere to the principles and best practices of corporate governance, to foster long-term success of the corporation, and to ensure its sustained competitiveness in the global environment in a manner consistent with its corporate objectives and the best interests of its stockholders and other stakeholders.
To ensure good governance, the Board formulates and continuously reviews the corporation’s vision, mission, strategic objectives, policies, and procedures that guide its activities, including the means to effectively monitor management’s performance. The Board reviews the vision and mission statement every year and oversee the implementation of the corporate strategy.
The Board oversees the development of and approves the corporation’s business objectives and strategy, and monitors their implementation to sustain its long-term viability and strength. They adopt effective succession planning programs for Directors, key officers, and management to ensure growth and continued increase in shareholder value.
The Board also reviews and affirms the adequacy of internal controls and risk management practices, accuracy and reliability of financial reporting, and compliance with applicable laws and regulations, together with the implementation of the company’s Code of Ethics. The Board reviews and affirms the true and fair presentation of the annual financial statements.
boaRD CoMPosITIon
The Board is composed of 11 members who are elected by the corporation’s stockholders and shall hold office for one year until their successors are elected in the next annual stockholders’ meeting. Among the board members are four independent non-executive directors.
The corporation is committed to having a diverse Board with the members possessing varied ages, educational backgrounds, nationalities, work experience, expertise, and skills. The corporate Governance and Nomination committee encourages the selection of a mix of competent directors ensuring that female candidates are included for consideration, each of whom can add value and independent judgment in the formulation of sound corporate strategies and policies. The committee also uses professional search firms or other external sources of candidates to search for qualified candidates to the Board. The Board regularly reviews its composition, taking into account the evolving requirements of the corporation and best practices in corporate governance.
leaD InDePenDenT DIReCToR
Edgar O. chua was appointed as Lead Independent director by the Board in its regular meeting held on August 16, 2017. His role includes, among others, acting as an intermediate between the chairman of the Board and other directors, when needed; to convene and chair the periodic meetings of the non-executive and the independent directors with the external auditor and head of internal audit, compliance and risk, as maybe needed; and to contribute to the performance evaluation of the chairman of the Board.
InDePenDenT DIReCToRs
The Board currently includes four independent directors—Edgar O. chua, Hiroshi Nishimura, sherisa P. Nuesa, and diosdado P. Banatao.
Independent directors, apart from their fees and shareholdings, hold no interests or relationship with the corporation that may hinder his independence from the corporation, management, or shareholder which could, or could reasonably perceived to, materially interfere with his exercise of independent judgment in carrying out his responsibilities as a director of the corporation.
Ayala Tower One
Integrated mIcro-electronIcs, Inc.
40 Years of manufacturing technology and Innovation 40 Years of manufacturing technology and Innovation
2020 Integrated rePort
50 51

The corporation has set a term limit of nine years in accordance with the rules set by the sEc. As of 2020, none of the independent directors have served the company for more than nine years, reckoning from 2012, in compliance with sEc memorandum circular No. 9, series of 2011. moreover, none of the directors or senior management have worked for the Corporation’s external auditing firm within the three years immediately preceding the date of their election or appointment.
boaRD DIVeRsITY PolICY
The Board shall adopt a policy on diversity that encourages the selection of an appropriate mix of competent directors, each of whom can add value and independent judgment in the formulation of sound corporate strategies and policies. diversity includes business experience, age, gender, and ethnicity. With respect to gender, the Board adopts the following policy:
The Board shall be comprised of at least 20 percent female directors, or at least two female directors, whichever is lower, by 2023.
The Board shall be comprised of at least 30 percent female directors, or at least three female directors, whichever is lower, by 2025.”
boaRD PeRfoRManCe
boaRD MeeTInG anD aTTenDanCe
The Board meets at least six times each fiscal year, with the schedule of meetings determined before the start of each financial year.
All members of the board, including independent directors, should attend and actively participate in all of the Board, committee, and shareholders in person or through tele-/videoconferencing conducted in accordance with the rules and regulations of the commission. The director should review meeting materials and, if called for, ask the necessary questions or seek clarifications and explanations.
The corporate secretary ensures that the materials are adequate and made available at least five working days in advance of the scheduled meeting to allow the Board with enough time to prepare and make informed decisions.
The Board may, to promote transparency, require at least one independent director in all of its meetings. However, the absence of an independent director shall not affect the quorum requirement if he is duly notified of the meeting but notwithstanding such notice fails to attend.
IMI Headquarters
Chairman Jaime Augusto Zobel de Ayala at IMI Phils
Diversity in Business Experience
IMI Headquarters at the start of the global pandemic
boaRD ReMUneRaTIon
In accordance with the company’s By-Laws, each director is entitled to receive from the corporation fees and other compensation for his services as director. The Personnel and compensation committee’s duties and responsibilities as defined in its charter are to recommend to the Board remuneration package for directors, and provide oversight over remuneration of senior management and other key personnel ensuring that compensation is consistent with the corporation’s culture, strategy and control environment, and aligned with the long-term interests of the company and its stakeholders.
In no case shall the total yearly compensation of directors exceed five percent (5%) of the net income before income tax of the corporation during the preceding year.
Non-executive and independent directors receive a per diem of P100,000 for each Board meeting attended and a per diem of P20,000 for each committee meeting attended.
In 2020, the following directors receive gross remuneration as follows:
Non-Executive and Independent Directors
Gross Remuneration
(in PhP)
Jaime Augusto Zobel de Ayala 600,000
Fernando Zobel de Ayala 600,000
Delfin l. lazaro 700,000
Jose Ignacio A. Carlos 640,000
Rafael C. Romualdez 840,000
Jose Teodoro K. limcaoco 800,000
Hiroshi nishimura 560,000
Sherisa P. nuesa 760,000
Edgar O. Chua 800,000
Diosdado P. Banatao 400,000
TOTAL 6,700,000
None of the non-executive directors and independent directors have been contracted and compensated by the company for services other than those provided as a director.
Integrated mIcro-electronIcs, Inc.
40 Years of manufacturing technology and Innovation 40 Years of manufacturing technology and Innovation
2020 Integrated rePort
52 53

boaRD CoMMITTees
The Board created seven committees as it may deem necessary to support in the performance of its functions in accordance with the By-Laws, manual of corporate Governance, and Board charter of the corporation and to aid in good governance. The Board has delegated specific responsibilities to each of these Committees, and these Committees, had been formed and are guided by their respective committee charters which are available in the Corporation’s official website.
eXeCUTIVe CoMMITTee
The Executive committee, in accordance with the authority granted by the Board, or during the absence of the Board, shall act by majority vote of all its members on such specific matters within the competence of the Board of directors as may from time to time be delegated to the Executive committee in accordance with the corporation’s By-Laws, subject to the limitations provided by the corporation code.
PeRsonnel anD CoMPensaTIon CoMMITTee
The Personnel and compensation committee is responsible for establishing a formal and transparent procedure for developing a policy on director and executive remuneration and for fixing the remuneration packages of corporate officers and directors, and provide oversight over remuneration of senior management and other key personnel ensuring that compensation is consistent with the corporation’s culture, strategy, and control environment. The committee also oversees the annual performance review of each of the members of management appointed by the Board other than the Chief Executive Officer, Chief Operating Officer and President; recommends and reviews succession plans for members of management and senior executives, except the Chief Executive Officer, Chief Operating Officer and President, and implement a process to ensure appointment of competent, professional, honest, and highly motivated individuals who will add value to the company; identifies, reviews and evaluates the qualifications, skills and abilities needed for management positions; assesses the effectiveness of the Board’s processes and procedures in the appointment, election or replacement of senior executives; and establishes a performance management framework that ensures senior officers’ performance is at par with the standards set by the Board.
audIt and rISk COmmIttee
The Audit and Risk committee is expected, through the provision of checks and balances, to bring positive results in supervising and supporting the management of the corporation. The committee, through the Internal Audit (IA) department of the company, monitors and evaluates the adequacy and effectiveness of the corporation’s internal control system, integrity of financial reporting, and security of physical and information assets. The committee also performs oversight functions over the company’s internal and external auditors and reviews and monitors management’s responsiveness to the auditors’ findings and recommendations. The committee is also responsible in the development, evaluation and oversight of the implementation of enterprise risk management plans to ensure that it’s relevant, comprehensive, and effective. It also provides oversight over management’s activities in managing credit, market, liquidity, operational, legal, and other risk exposures of the corporation.
RelaTeD PaRTY TRansaCTIon CoMMITTee
The committee was assigned by the Board to review all material related party transactions (RPTs) for endorsement to the Board to ensure that these are at arm’s length, the terms are fair, and they will inure to the best interest of the company and its subsidiaries or affiliates and their shareholders. The committee ensures that related party transactions are reviewed, approved, and disclosed in accordance with its policy consistent with the principles of transparency and fairness. The committee also oversees the implementation of the system for identifying, monitoring, measuring, controlling, and reporting RPTs, including a periodic review of RPT policies and procedures.
CoRPoRaTe GoVeRnanCe anD noMInaTIon CoMMITTee
The committee shall review and monitor the structure, size, and composition of the Board and make recommendations to ensure compliance with applicable laws, rules, and regulations as well as the corporation’s By-Laws, Board charter, and manual of corporate Governance. The committee also assesses the company’s needs to identify the best mix of competencies of directors that would be aligned with the company’s vision, mission, and strategic objectives; identifies, reviews, and evaluates the qualifications and disqualifications, skills, and abilities that would result in a proper mix of competent directors, including the chief Executive Officer, Chief Operating Officer, and President; develops, updates, and recommends to the Board policies for considering nominees for directors to ensure that all nominations to the Board are fair and transparent; assesses the effectiveness of the Board’s processes and procedures in the election or replacement, and recommends and reviews succession plans for members of the Board, including for the Chief Executive Officer, Chief Operating Officer, and President; oversees the implementation of the corporate governance framework and periodically reviews the said framework; adopts corporate governance policies and ensures that these are reviewed and updated regularly, and consistently implemented in form and substance;
fInanCe CoMMITTee
The Finance Committee oversees the company’s financial risk management, including the company’s capital structure strategies, mergers, acquisitions and other strategic investments, as well as divestitures of any material operations of the company, and make appropriate recommendations to the Board of directors. The committee also has general oversight responsibility over the company’s treasury activities and policies, including policies with respect to cash flow management, investment of the company’s cash, and financial risk management including the use of derivatives. They are responsible for reviewing and evaluating the financial affairs of the Corporation from time to time and carry out such other duties as may be delegated by the Board of directors.
PRoXY ValIDaTIon CoMMITTee
The committee is responsible for ensuring that the validating process of the proxies and ballots is transparent, fair and in accordance with applicable laws, regulations, and company policies.
BOARD AND BOARD COMMITTEE MEMBERSHIPSTOCKHOLDERS, BOARD, BOARD COMMITTEE MEETINGS, AND DIRECTORS’ ATTENDANCEFOR THE YEAR ENDED DECEMBER 31, 2020
DETAILSMEMBERSHIP AND ATTENDANCE
STOCKHOLDER & BOARD BOARD COMMITTEE
MEETIngS AS BOD* EC** ARC FC CgnC RPTC PCC PVC***nO. OF MEETIngS 1 6 4 7 2 3 1 1Jaime Augusto Zobel de Ayala, non-Executive Director
C1/1
C6/6 - - - - - - -
Fernando Zobel de Ayala, non-Executive Director
-1/1
M6/6 - - - - - - -
Arthur R. Tan, Executive Director
-1/1
M6/6
C1/1 - - - - - -
gilles Bernard, Executive Director
-0/1
M0/2 - - - - - - -
Delfin l. lazaro, non-Executive Director
-1/1
M6/6 - - C
5/5 - - - -
Jose Ignacio A. Carlos, non-Executive Director
-1/1
M6/6 - - - - M
2/2 -
Rafael C. Romualdez, non-Executive Director
-1/1
M6/6
M1/1
M5/5
M5/5 - M
1/1 - -
Jose Teodoro K. limcaoco, non-Executive Director
-1/1
M6/6
M1/1 - M
5/5M
1/1M
1/1M
2/2 -
Hiroshi nishimura, Independent Director
-0/0
M4/5 - M
4/4 - M3/3
C1/1 - -
Sherisa P. nuesa, Independent Director
-1/1
M6/6 - M
2/2 - C4/4 - C
2/2 -
Edgar O. Chua, Independent Director
-1/1
M6/6 - C
5/5 - M4/4
M1/1 - -
Diosdado P. BanataoIndependent Director
-1/1
M4/5 - - - - - - -
Solomon M. Hermosura (not a Member of the Board)
CS1/1 - - - - - - - C
1/1Jaime g. Sanchez (not a Member of the Board)
CO1/1 - - - - - - - M
1/1neilson C. Esguerra (not a Member of the Board)
O1/1 - - - - - - - M
1/1
c - chairmanm - memberO - Observercs - corporate secretaryCO - Compliance Officer
As - Annual stockholderBOd - Board of directorsEc - Executive committeeARc - Audit and Risk committeeFc - Finance committeecGNc - corporate Governance and Nomination committeeRPTc - Related Party Transaction committeePcc - Personnel and compensation committeePVc - Proxy Validation committee
*In 2020 and during the incumbency of the director.**The actions of the Executive Committee were taken via digital/electronic means.***May not be members of the Board of Directors.
Integrated mIcro-electronIcs, Inc.
40 Years of manufacturing technology and Innovation 40 Years of manufacturing technology and Innovation
2020 Integrated rePort
54 55

boaRD sTRUCTURe
BOARD OF DIRECTORS
BOARD COMMITTEES
Office of the Corporate Secretary and Office of the Compliance Officer
Executive
Finance & Controllership
Treasury
Audit and Risk
Internal Audit
Enterprise Risk
Management
FinanceCorporate
governance and
nomination
Office of the Compliance
Officer
Human Resources
Office of the Data
Protection
Personnel and
Compensation
Human Resources
Related Party
Transaction
Office of the Compliance
Officer
Finance & Controllership
Proxy Validation
Office of the Corporate Secretary
PRESIDEnT & CEO
CORPORATE SECRETARy / COMPlIAnCE OFFICER
Management Committees
CommercialProcurementOperationsTechnology
FinanceInformation and Communications
Human Resources
SUPPORT FUNCTIONS
PeRfoRManCe assessMenT
In a landscape of rising competitive and regulatory pressures, oversight from a strong and effective board goes a long way in guiding the company to success. As such, the Board engages in an annual process of self-assessment and evaluation of their performance in order to identify key strengths and areas for improvement. In 2020, each director accomplished a self-assessment survey on Board, committee and Individual effectiveness evaluation across several categories through Aon Hewitt singapore Pte Ltd, in compliance with the recommendation of sEc memorandum circular Number 15, series of 2017, to conduct the assessments supported by an external facilitator every three years.
Among the categories surveyed are: 1) Board composition, 2) Roles and functions, 3) Information management, 4) Representation of shareholders and environment, social and governance (EsG) factors, 5) managing company’s performance, 6) senior executive’s performance management and succession planning, 7) director development and management, 8) Risk management and internal
control, and 9) Overall perception. The evaluation report includes highlights on the board, committees and individual performance across these categories and its relative standing against the market.
TRaInInG of DIReCToRs
Prior to assuming office, all new Directors shall undergo at the minimum an eight-hour orientation program on the corporation’s business and corporate structure, its vision, mission and corporate strategy, the By-Laws and manual of corporate Governance, Board charter, sEc-mandated topics on corporate governance and other relevant matters essential for the effective performance of their duties and responsibilities.
directors shall likewise attend at least once a year, a four-hour annual continuing training program involving courses on corporate governance matters relevant to the corporation.
Training and seminars were administered by Institute of corporate directors, an accredited training provider of the sEc.
Corporate Governance Programs Attended in 2020
Director Program Training Institute Date of TrainingJaime Augusto Zobel de Ayala (nED), Chairman
The Board Agenda2020: The Business ofBuilding Back Better
(Ayala IntegratedCorporate
governance, RiskManagement and
Sustainability Summit)
Institute of Corporate Directors
november 10, 2020 (Through Zoom webinars)
Arthur R. Tan (ED), President and CEOFernando Zobel de Ayala (nED)Delfin l. lazaro (nED)Jose Teodoro K. limcaoco (nED) Edgar O. Chua (ID)Sherisa P. nuesa (ID)Jose Ignacio A. Carlos (nED)Rafael C. Romualdez (nED)Hiroshi nishimura (ID)Sherisa P. nuesa (ID)Edgar O. Chua (ID)Rafael C. Romualdez
Future-Ready BoardsA Deep Dive
Institute of Corporate Directors
May 28, 2020 (Through Zoom
webinars)
Sherisa P. nuesa (ID) Technology governance for Directors
Institute of Corporate Director
Oct. 21, 2020(Through Zoom
webinars)
Sherisa P. nuesa (ID) 7th SEC – PSE Corporate governance Forum
Securities and Exchange
Commission (SEC) and Philippine Stock
Exchange (PSE)
nov. 19, 2020 (Through Zoom
webinars)
NED – Non-Executive DirectorsID – Independent Directors
Integrated mIcro-electronIcs, Inc.
40 Years of manufacturing technology and Innovation 40 Years of manufacturing technology and Innovation
2020 Integrated rePort
56 57

aCCoUnTabIlITY anD aUDIT
eXTeRnal aUDIToR anD aUDIToR RePoRT
The external auditor of the company is the auditing firm of Sycip, Gorres, Velayo and Co. (SGV) with Ms. cyril Jasmin B. Valencia as the Partner-in-charge for the 2020 audit year.
The Audit and Risk committee has the primary responsibility to recommend the appointment and removal of the external auditor. The committee met with the external auditors without the presence of the management team to discuss any issues or concern.
To ensure that the external auditor maintains the highest level of independence from the company, both in fact and appearance, the Audit and Risk committee had approved all audit, audit-related, and permitted non-audit services rendered by the external auditor. Non-audit services expressly prohibited by regulations of the sEc were awarded to other audit firms to ensure that the company’s external auditor carries out its work in an objective manner.
The aggregate fees billed for the current year and each of the last two years for professional services rendered by sGV & co.:
2020 2019 2018
Audit and Audit-related fees*
4.17 16.00 4.50
Tax fees** - - 0.30
All other fees*** 0.07 0.07 0.17
TOTAL 4.24 16.07 4.97
In P Millions *Audit and Audit-Related Fees. This category includes the audit of annual financial statements and services that are normally provided by the independent auditor in connection with statutory and regulatory filings or engagements for those calendar years. The 2019 audit fees include fees for the review of interim financial statements amounting to PhP11.9M. The fees are exclusive of out-of-pocket expenses incidental to the independent auditors’ work.
**Tax fees. The Company engaged SGV & Co. to perform tax advisory services in 2018.
***All Other Fees. This category includes other services rendered by SGV & Co. such as financial and accounting advisory, financial reporting valuation reviews, assessment of compliance with the Data Privacy Act, and the validation of votes during Annual Stockholders’ Meeting.
Global InTeRnal aUDIT
Global Internal Audit (Global IA) serves as a vital support in the effective discharge of the Board’s Audit and Risk committee’s (ARc) oversight role
and responsibilities. To maintain independence and objectivity, the Global IA through the chief Audit Executive, Lorlyn Arceo, reports functionally to the ARc with its operations governed by a separate Internal Audit charter reviewed on annual basis, presented to senior management and approved by ARc and the Board. Periodically, the committee also meets the chief Audit Executive without the presence of management.
Global IA activities conform with the International standards for the Professional Practice of InternalAuditing and its code of Ethics, complies with the code of corporate Governance for publicly listed companies and are continuously evaluated through an independent Quality Assessment Review. In carrying out Global IA mandate, it adopts a risk-based audit approach with coverage of the most critical processes in its assurance/advisory reviews and annual internal audit plan. The internal audit plan and any changes thereto is reviewed and approved by the ARc and is reassessed quarterly to consider emerging risks, dynamic business, market, industry and customer conditions to allow maximum and timely coverage of key risk areas.
On a quarterly basis and as needed, Global IA reports the status of the approved audit plan, review results including recommendations and implementation status to ensure management is taking appropriate corrective actions in a timely manner. Further, the report includes quality assurance improvement program, resource management, competencies, and trainings of the staff to ensure effectiveness of the internal audit function and that resources are adequate and reasonably allocated to the areas of highest risks.
In strengthening key stakeholders’ relationship and value add proposition, Global IA participates in key
management and operations meetings, coordinates with other internal and external assurance providers to optimize audit efficiencies, and secure executive management inputs in support and alignment with corporate strategies and business goals.
DIsClosURe anD TRansPaRenCY
ImI is fully committed in ensuring that timely and accurate disclosure is made on all material matters regarding the corporation, including financial information, performance, ownership, and governance of the company.
owneRsHIP sTRUCTUReAs of december 31, 2020, ImI’s outstanding common shares were held as follows:
Name of Shareholder and Beneficial Owner
Total Share Outstanding*
% to Total Share
AC Industrial Technology Holdings, Inc. 1,153,725,046 52.03%
Resins, Inc. 291,785,034 13.16%
Shares owned by the Public 681,687,216 30.74%
AC, ESOWn, Directors and Officers 90,095,919 4.07%
TOTAl 2,217,293,215 100.00%*Based on the Public Ownership Report as of December 31, 2020
RelaTeD PaRTY TRansaCTIons
To promote good corporate governance and the protection of the shareholders and minority investors, the company has adopted a policy to ensure that its RPTs are at arm’s length, their terms are fair, and will inure to the best interest of the company and its subsidiaries or affiliates and their shareholders. The RPTs are transactions which may include sales and purchases of goods and services to and from related parties that are concluded at normal commercial terms consistent with the principles of transparency and fairness. As per policy, the company or a related party or any of its subsidiaries or affiliates, as the case may be, shall disclose material RPTs to the RPT committee for review and approval prior to entering into the transaction, unless it is considered as a pre-approved RPT. material RPTs are transactions that meet the threshold values—$1 million or five percent (5%) of the company’s consolidated assets based on its latest audited financial statements, whichever is lower.
The company also complied with sEc memorandum circular No. 10: Rules on material RPT for Publicly Listed Companies. The SEC-defined material RPTs cover transactions, either individually, or in aggregate over a twelve (12)-month period with the same related party, amounting to ten percent (10%) or higher of the company’s consolidated assets based on latest audited financial statement. The Company submitted a revised policy on material RPT in accordance with the Rule.
There were no RPTs classified as financial assistance to entities other than subsidiaries. There were also no cases of noncompliance with the laws, rules, and regulations pertaining to significant or material RPTs in the past three years.
The company discloses the names of all related parties, degree of relationship, nature and value of significant RPT. Details are found in Note 31 to the consolidated Financial statements.
PolICY on InsIDeR TRaDInG
To protect the shareholders, Directors, officers and employees are prohibited from trading ImI shares, five trading days before and two trading days after the disclosure of structured reports and two trading days after disclosure of any material information other than the structured reports. The compliance officer issues a black-out period notice before the release of structured reports or disclosure of other material information to ensure compliance with the policy. The Policy ensures compliance with disclosure
Integrated mIcro-electronIcs, Inc.
40 Years of manufacturing technology and Innovation 40 Years of manufacturing technology and Innovation
2020 Integrated rePort
58 59

rules and prevention of unlawful practice using to one’s own advantage confidential information one has access to. All Directors and reportable officers must report all acquisitions and disposals, or any changes in their
wHIsTle bloweR PolICY
The Policy covers directors, officers, employees, and stakeholders. It provides a process whereby the covered persons will report in good faith, instances of actual and suspected non-compliance with the code of conduct, and in a manner that is outside the normal chain of commands that preserves confidentiality. It encourages an atmosphere that allows individuals to exercise their obligations to responsibly disclose violations of law and serious breaches of conduct and ethics covered by the code of conduct through ImI’s reporting channels. It provides the process which protects the whistleblowers from retaliation or reprisals by adverse disciplinary or employment penalties as a result of having disclosed wrongful conduct.
Whistleblowers may report, among others, conflicts of interest; misconduct or policy violations; theft, fraud, or misappropriation; falsification of documents; financial reporting concerns; and any act of retaliation taken against persons covered by the policy.
The whistleblower may choose the manner by which he or she may be contacted without compromising his or his anonymity. Through face-to-face meeting with any member of the committee or the Human Resource department (HRd) at the option of the employee or stakeholder, through email [email protected], or through hotline 0917-629-7074 and 0917-557-9323.
StakehOlder relatIOnS
sHaReHolDeR MeeTInG anD VoTInG PRoCeDURes
Notice of Annual stockholders’ meetings and Definitive Information Statement (including the audited financial statements) were sent to all shareholders at least fifteen (15) business days prior to the meeting date on April 15, 2020.
Each outstanding common shares of stock entitles the registered holder to one vote.
stockholders may vote manually using the paper ballot provided upon registration, for those who are unable to go to the venue of the stockholders’ meeting may vote electronically in absentia on the matters in the agenda upon registration and validation online. For this purpose, the company has set up a website which may be accessed by stockholders to register and vote on matters through remote communication or in absentia. The requirements and procedure for electronic voting in
absentia are included in the Notice and the Definitive Information Statements (Annex “C”) which are sent to the stockholders at least 28 business days prior to the date of the meeting. The company also provides non-controlling or minority shareholders the right to nominate candidates for board of directors.
DIVIDenD PolICY
dividends declared by the company on its shares of stocks are payable in cash or in additional sharesof stock. The payment of dividends in the future will depend upon the earnings, cash flow, and financialcondition of the company and other factors. There are no other restrictions that limit the payment ofdividends on common shares.
cash dividends are subject to approval by the company’s Board of directors, but no stockholderapproval is required. Property dividends which may come in the form of additional shares of stock aresubject to approval by both the Board of directors and the stockholders of the company. In addition,the payment of stock dividends is likewise subject to the approval of the sEc and PsE.
sHaReHolDeR anD InVesToR RelaTIons
The company maintains strong and transparent relationships with its investors and encourages active participation and regular communication with various stakeholders. Through Investor Relations, information requirements of the investing public and minority shareholders are fully disclosed to securities’ regulators on time.
Quarterly, after the release of financial results, the CEO, CFO, and the Investor Relations Officer conduct a briefing for both media and credit analysts. In 2020, the Analyst Briefings were done virtually through zoom online application.
Presentation materials used in the briefings are posted in the Company’s official website.https://www.global-imi.com/investors
We conduct regional roadshows about twice or thrice a year to engage analysts and potential investors. This is often a good opportunity to introduce our company and to show our role in the industry. The activity opens doors for prospective institutional investors in a given region.
The Company’s official website provides information on its compliance to corporate Governance, matters related to the Board, and investor relations program.www.global-imi.com
shareholdings in the company within three trading days from the transaction date, two days earlier than the five-day disclosure requirement of the PSE. All other officers and employees must submit a quarterly report on their trades of company securities to the Compliance Officer.
CHanGes In sHaReHolDInGs
Reported trades in IMI securities of the directors and officers in 2020:
Number of Shares
Security As of Dec. 31, 2019
Acquired/Assigned Disposed of As of Dec. 31,
2020
DIRECTORS
Jaime Augusto Zobel de Ayala Direct 100 - -
100
Fernando Zobel de Ayala Direct 100 - - 100
Arthur R. Tan Direct 1,955,452 - - 1,955,452
Indirect 19,268,100 - - 19,268,100
Jose Teodoro K. limcaoco Direct 100 - - 100
Edgar O. Chua Direct 100 - - 100
Sherisa P. nuesa Direct 112,807 - - 112,807
Indirect 890,578 - - 890,578
Jose Ignacio A. Carlos Direct 1 - - 1
Delfin l. lazaro Direct 100 - - 100
Rafael C. Romualdez Direct 1 - - 1
Hiroshi nishimura Direct 115 - - 115
Indirect 712,463 - - 712,463
Diosdado P. Banatao Direct 0 115 - 115
OFFICERS
Jerome S. Tan Indirect 2,884,733 - - 2,884,733
laurice S. Dela Cruz** Indirect 157,221 - - 157,221
Eric De Candido* Indirect - - - -
Mary Ann S. natividad* Direct 75,204 - - 75,204
Indirect 806,935 - - 806,935
Rosalyn O. Tesoro** Indirect 19,505 - - 19,505
Solomon M. Hermosura Indirect 450,015 170,000 - 620,015
Joanne M. lim Direct - - - -
TOTAL 27,333,630 170,115 - 27,503,745
*Appointed last December 6, 2019
** Appointed last April 15, 2020
Integrated mIcro-electronIcs, Inc.
40 Years of manufacturing technology and Innovation 40 Years of manufacturing technology and Innovation
2020 Integrated rePort
60 61

enterprISe rISk managementWith heightened environmental, social, and governance (EsG) issues and objectives as well as global events such as the cOVId-19 pandemic, risk management has rightly taken on greater focus for a broad set of stakeholders. Indeed, our ability to rapidly understand and adjust strategies, and seek new opportunities has never been more critical and consequential than it is today.
rISk management pOlICy
Our Enterprise Risk management (ERm) Policy establishes the overall direction of the company’s risk management processes and practices. Guided by ISO 31000 risk management principles, IMI defines a common, structured approach that governs the risk management process towards value creation and protection, helps improve performance, encourages innovation, and supports the achievement of objectives.
rISk management FramewOrk
Across the organization, our risk management framework and internal control systems reflect our deep commitment to integrity, transparency, and good governance for sustainable and resilient operations. This clear set of standards takes into account the company’s size, risk profile, and complexity/diversity of operations to ensure the adequacy and effectiveness of our approach. moreover, it is also embodied in ImI’s management oversight, and control culture and activities that help
identify, evaluate, mitigate, and monitor key risk exposures.
In 2020, to further improve our risk management framework and strategy, we began working on upgrading our legacy ERm intranet site which served as a key channel for communicating risk management programs, into a more robust enterprise governance software platform that creates a stronger security, risk management, compliance, and assurance system.
rISk repOrtIng
IMI has well-defined reporting lines that set out accountability and ownership in every level of the organization as well as focus on quality that promotes risk-based thinking in all processes at all levels. Our Chief Risk Officer (CRO) is responsible for regular internal reporting on the implementation of the ERm framework, its effectiveness, and outcomes. The cRO reports to our Audit and Risk committee and is being supported by the ERm leader who communicates with site risk owners and appointed risk leads on the programs, activities, and initiatives that will strengthen the risk engagement framework. Our Audit and Risk committee, in turn, ensures that we have an effective and comprehensive risk management framework and internal control systems. The committee discusses critical risks, their nature, likelihood and impact, and the management’s risk mitigation efforts and initiatives on a regular basis.
Framework (clause 5)
Principles (clause 4)
Process (clause 6)
VALUE CREATION
ANDPROTECTION
ContinualImprovement
structuredand
comprehensive
Integrated
customized
InclusiveDynamic
Best AvailableInformation
Human andCultural Factors
LEADERSHIPAND
COMMITMENT Design
Improvement
Evaluation
Implementation
Integration
Com
mun
icat
ion
& Co
nsul
tatio
n Mentoring & Review
Recording & Reporting
Scope, Context, Criteria
Risk Treatment
RISK ASSESSMENT
Risk Identification
Risk Evaluation
Risk Analysis
COVID-19 made 2020 one of the most difficult in IMI’s 40-year history. Risks to employee safety, lockdowns lowering demand in our markets, disruption in operations, and the supply chain were our primary challenges. IMI’s Business Continuity Management Systems (BCMS) and strategies were tested and implemented in full swing which provided mitigating controls and procedures that allowed effective management of organizational health and safety.
As the pace of change is not likely to slow down, we will be updating our Business Impact Analysis and BCMS Maturity Review in 2021 to identify potential gaps between our execution and best practices.
2
1
5
Continued downturn in automotive market from 2019 was strained even further by the global pandemic. given the market situation, inability to discover, evaluate and select best decisions among alternatives increased our operational risk. That is why we initiated an organizational transformation and realignment to withstand this difficult period and maintain focus on our long-term strategic areas: Customer & Product Approach - Create more value in products, services, and technologies (Market / Segment Mix)Operational Excellence - Embed quality in all operations through principles of lEAn. (Multi-specialist EMS)Organization, Leadership & Culture - Develop future leaders through talent and succession planning, employee engagement, and continuous learning
Between lockdowns and logistics issues, COVID-19 has revealed some of the vulnerabilities and fragilities in global supply chains. The biggest risk factors are the risks of not being able to source required components, and find alternative parts in a timely manner due to limited manufacturing or temporary closures of suppliers—both of which can compromise our commitments. As such, our first steps as the crisis erupted were to coordinate with customers and suppliers in order to formulate mitigating strategies for supply chain disruptions. Our global Procurement team maintained close coordination with various import and export organizations to expedite release of needed components for production, and delivery of finished goods.
In the future, our necessary series of adjustments will continue to be informed by our frequent engagements and coordination with customers to better serve them in times like these. We intend to qualify alternative suppliers from various geographic locations, and look for logistics alternatives for timely and efficient delivery of components. We are also investing in supply chain digitalization and talent acquisition to enhance capabilities in data analytics which we expect to result in reduction of spend and total acquisition cost, as well as improved overall efficiency of global procurement.
Changing political, regulatory environment, and macroeconomic factors across the globe were our major risk issues, as customers looked inward to explore alternatives within their and their customers’ geographical areas.
We believe the synergies within our group will help us manage these risks. Together with Ayala Corporation and AC Industrials, we intend to look for opportunities in untapped markets such as ASEAn, Japan, and South Korea. We expect to leverage on our Tier 1 experience in automotive and technical acquisition to reinforce and improve our position in the industry.
3 4
The “new normal” requires rapid migration to digital technologies. It means virtualization and deployment of online systems at much larger volumes within a short period of time. In this transition, the company is more susceptible to risks of not adequately protecting critical data and infrastructure from unauthorized access, use, disclosure, disruption, modification, inspection, recording or destruction, theft, viruses, or sabotage. These risks formed the starting point for in-depth reviews that led to our underlying mitigation strategies. For example, our ICT group deployed additional layers of cybersecurity controls, procedures, and capabilities to ensure the integrity of the company’s digital environment, its users, and other stakeholders. We also intensified our cyber security training, simulation exercises, and systems vulnerability testing to identify potential gaps and weaknesses.
Operational – Strategic Planning & Execution
Business Resilience
Information & Cyber Security
Operational – Sourcing & Procurement POLITICAL RISK - Geopolitical / Macroeconomic
top risk 2020 (top 5)
As part of our risk management process, we perform annual assessment of the key risks that the company faces and strategize action plans to mitigate such risks. The assessment considers, among other matters, the nature, frequency, and severity of risk factors, and the company’s experience with each of the identified estimates and assumptions.
The top five key risks that emerged from our risk analysis and discussions during the year include:
Integrated mIcro-electronIcs, Inc.
40 Years of manufacturing technology and Innovation 40 Years of manufacturing technology and Innovation
2020 Integrated rePort
62 63

IMI Philippines, SSCg building
sUsTaInabIlITY RePoRT
Our unwavering commitment to sustainability
Qualifying Key suppliers
TcFd Adoption
Our Framework
Natural capital
Our Integrated Value chain
How we create and share Value
Human capital sAsB material Issues Index
66
72
78
67
73
68 70
75 77
Integrated mIcro-electronIcs, Inc.
40 Years of manufacturing technology and Innovation 40 Years of manufacturing technology and Innovation
2020 Integrated rePort
64 65

Our FramewOrkoUR UnwaVeRInG CoMMITMenT To sUsTaInabIlITY
As a company, we aim to be a trusted partner for all our stakeholders—employees, customers, shareholders, business partners, governments, and the communities in which we operate.
That is why when we look for ways to evolve, we remain firmly committed to our core values—Integrity, customer Focus, concern for Others, and Excellence. They are the foundation of all our activities from the way we collaborate internally to how we engage externally. This same philosophy guides our approach to sustainability, including our policy framework, commitments, management systems, and stakeholder engagement.
SuStaInaBIlIty FramewOrk
Our framework for sustainability management is the ImI code of conduct, adapted from the Responsible Business Alliance (RBA) code of conduct. It outlines the standards that we have set for ourselves to ensure that: working conditions are safe, workers are treated with respect and dignity, and manufacturing processes are all environmentally responsible.
It also extends across our business partners to support a responsible supply chain and a continuous improvement of performance within their own
operations. In particular, we require suppliers and subcontractors to comply with the same principles laid down in the ImI code of conduct. They are expected to acknowledge and implement the code to remain in good standing. They must: • operate as an equal opportunity employer and
recognize minimum and prevailing wages and benefits;
• provide a healthy and safe working environment that is free from use of any forced or child labor, and prevent harassment or abuse of employees and;
• support sustainable development, observe environmental commitments to conserve natural resources, minimize the negative impacts of the production, application, and disposal of products, and reduce the use of hazardous materials.
To enable this journey, we formed a global sustainability Team to facilitate and inform sustainability management and performance across the company. The team is composed of representative subject matter experts (smEs) from Enterprise Risk management, Human Resources, Environmental Health and safety, Finance, Procurement, supplier Quality Engineering, and Quality management systems.
· company commitment · management Accountability
and Responsibility · Legal customer
Requirements · Risk Assessment and Risk
management · Improvement Objectives · Training
· communication · Worker Feedback and
Participation · Audits and Assessments · corrective Action Process · documentation and records · supplier communication
HealTH & safeTYmaintain a safe and healthy work environment · Occupational safety · Emergency Preparedness · Occupational Injury and
Illness · Industrial Hygiene · Physically demanding Work · machine safeguarding · sanitation, Food and Housing · Health and safety
communication
enVIRonMenTProtect the environment · Environmental Permits and
Reporting · Pollution Prevention and
Resource Reduction · Hazardous substances · Waste and solid Waste · Air Emission · Product content
Restrictions · Water management · Energy consumption and
Greenhouse Gas Emission Energy
eTHICsuphold the highest standards · Business Integrity Q&A
Requirements · No Improper Advantage · disclosure of Information · Intellectual Property · Fair Business, Advertising
and competition · Protection of Identity and
Retaliation · Responsible sourcing of
minerals · Privacy · Insider Trading
laboRTreat employees with dignity and respect · Freely chosen Employment · child Labor Avoidance · Working Hours · Wages and Benefits · Humane Treatment · Non discrimination · Freedom of Association
ManaGeMenT sYsTeMsEnsure compliance to RBA standards and the four pillars (Labor, Ethics, Health & safety, Environment)
MAnAgEMEnT SySTEMS
IMI CODE OF CONDUCT
(RBA MODEL)
MAnAgEMEnT SySTEMS
AUDIT CH
ECKS & KPIsSyST
EMS
& TO
OlS
ETHICS
ENVIRONMENT
LABOR
HEALTH & SAFETY
As a technology company, ImI is fully aware of how fast product and development cycles are. In today’s digital age, the skills and know-how of our employees have become more relevant to stay on top of our industry. Through the Learning and development initiatives of the ImI university, we are able to address the skill gaps and thus provide more value to the company, our customers, and suppliers. As our employees improve and advance, so do our levels of quality and service. As the organization grows and succeeds, the employees follow suit. These are all in line with sdG # 8 in providing decent Work and Economic Growth.
With our people living our company core values, we are able to drive innovation and collaboration in the various key segments of mobility, connectivity, and smart energy. Our competence is in our ability to work together and co-develop solutions with our partners and customers in design and manufacturing of new technologies that save lives (automotive safety systems and medical devices) and save energy (electric vehicles, power management systems, renewable energy) in line with sdG # 9 Industry Innovation & Infrastructure.
Amidst the rapidly changing technologies in the world today, ImI believes that humanity—our people—will drive our growth and our success while in the cusp of our own digital transformation. We do so, mindful of how we can provide better paths for our employees and the world towards a more sustainable future.
As the world struggles to live with the virus today and at the same time recover from a severe economic downturn, we shall continue to provide valuable services to all our stakeholders while keeping focused on what matters most, as we continue to lead and thrive ready to face the next 40 years of ImI.
For us at ImI, employees are not just remunerated fairly but are also provided with opportunities to grow and develop in all aspects with their health and safety as top priority. A strong and healthy workforce benefits the local economy of nearby communities. Their employment, along with the support from the local government, provides a multiplier effect to the local economy enabling more movement of goods and services thereby supporting the company’s overall operations.
Over the last four decades, ImI has not wavered in living its core values of Integrity, Excellence, customer Focus, and concern for Others. The company has grown from a local company that fostered a tight-knit culture of openness and cooperation to a global organization with greater determination in advocating the universal scopes of sustainability. As the 20th largest Ems company in the world, ImI continues to improve and reduce all negative impact on inputs and outputs by continuously aligning ourselves with the uN sustainability development Goals (sdGs). We are deliberate about achieving a circular economy that would have long-term implications on the environment and society, well aware that our legacy is in making sure that our footprint can be measured with the quadruple bottom-line of People, Planet, Purpose and Prosperity in mind.
Integrated mIcro-electronIcs, Inc.
40 Years of manufacturing technology and Innovation 40 Years of manufacturing technology and Innovation
2020 Integrated rePort
66 67

Our Integrated Value ChaIn
Our management team provides a streamlined range of corporate functions while actively strengthening our portfolio and seeking synergy opportunities among our stakeholders.
using six capitals to
create value
financial capital
manufactured capital
intellectual capital
natural capital
social and relationship
capital
human capital
We always ensure that we have an effective process in planning, implementing, and managing the flow of goods, services, and information along our integrated value chain.
Integrated mIcro-electronIcs, Inc.
40 Years of manufacturing technology and Innovation 40 Years of manufacturing technology and Innovation
2020 Integrated rePort
68 69

How we Create and SHare Value
KEY INPUTS oUTPUTS oUTcomES
ToP RISKS IN oUR oPERATINGENVIRoNmENT•Abruptshifttoremoteworking
hasintensifiedITvulnerabilities•Businessinterruptiondueto
lockdownormassclosures;logisticsandsupplychaindisruption
• InfectiousdiseasesandothermultiplevariantsofthevirusthatcausedCOVID-19circulatingglobally
•Naturaldisastersandothercatastrophicevents—damagescausedbyflooding,earthquake,andvolcanoeruption
• Industryvolatilityandeconomicuncertainty
•Marketcrashandrecession•Componentsshortage
STRoNG GoVERNANcE•FullcompliancewiththeCode
ofCorporateGovernanceforpubliclylistedcompaniessetforthbytheSecuritiesandExchangeCommission(SEC).
•TheBoardofDirectorsisthesupremeauthorityinmattersgoverningandmanagingthebusinessoftheCorporation.
oPPoRTUNITIES•Regionalmanufacturing•Convergenceofkeymarket
segmentslikemobility,connectivity,andsmartenergy
•Focusonsustainablecostreductionprograms
•Risingimportanceofsustainabilityinoperationsandbusinessenvironment
•Emergenceofnewplayersintraditionalandemergingmarket
FINANcIALWemaintainstrongcreditratingsandhealthycapitalratiostosupportourbusinessandmaximizeshareholdervalue.•MarketcapitalizationofPHP20.2billion
(US$420.2million)•Currentratioof1.54:1•Debt-to-equityratioof0.41:1
mANUFAcTURED cAPITALWeensureon-timedelivery,monitorkeyperformancemetrics,andcomplywithqualitystandardstodriveoperatingefficiencyandprofitability.•21manufacturingplantsacross10countries
INTELLEcTUAL cAPITALWeleverageonourextensiveexperienceandknow-howintechnologiestodeliverhighervaluetoourpartners.•Ourexpertiseinco-developmentprovides
leadingserviceofferingstoourcustomers•Ourtechnologyteamsprovideinnovation
andproductsolutionsacrossallcustomerfocusedunits
HUmAN cAPITALWeprotectouremployees’physicalhealthandsafetyandensurecontinuouslearninganddevelopmentinthisperiodofheighteneduncertainty.•Globalworkforce•Skillsandcompetencies•Workarrangements
SocIAL AND RELATIoNSHIP cAPITALWestrengthenoursharedvaluesandcommitmentstofurthersupportourpartnersandcommunitiesaroundus.•Partnershipwithmorethan300customers
andover200majorsuppliers•Engagementandcollaborationwith
governments,academe,stakeholders,investorsandcommunities
NATURAL cAPITALWeintegratenaturalcapitalintoourbusinessmodelsandstrategicdecision-making•Energy•Water•Waste
STRATEGIc INITIATIVE mANAGING RISK
AdoptionofinternationalmanagementsystemsstandardsonenvironmentalmanagementsystemsthroughISO14001andfullsupportonUNSDGs
Mitigatehighoperationscostsandsupplychainchallengestoimproveprofitability
EmbedsustainabilityandqualityinalloperationsthroughprinciplesofLeanManufacturingandIndustrialExcellence
LeverageonR&Dcapabilitiestoco-developwithcustomersandindustryexperiencetomovetowardshigherboxbuildvalueaddservices
Continuousandtimelyimplementationofhealthandsafetymeasures,virtualsupportsolutions,andE-learningplatformsforlearninganddevelopment
Ensureongoinginvolvement,monitoringandmeasurementofprogressandsuccessfromcommunityengagementsandcollaborations
IntegrationofEnvironmental,Social,andGovernance(ESG)stewardship
WedefineriskaseffectofuncertaintyonIMIgoalsandobjectives.OurEnterpriseRiskManagementprinciples,framework,andprocessensureefficient,effective,andconsistentriskmanagementthathelpscreateandprotectvalue,improveperformance,encourageinnovation,andsupportachievementofobjectives.
Ourenterprise-wideapproachrecognizesthatmanagementofriskisnotjustimplementingappropriatecontrolandmitigationonnegativerisksbutalsoidentifypotentialopportunities.
In2021aswebeginourjourneytoadoptingtherecommendationsoftheTaskforceonClimateRelatedFinancialDisclosures(TCFD),wewillincorporateclimaterelatedriskandopportunitiesintoourriskmanagementframework.
Weimprovefinancialleverageandprofitabilitytoraisereturnstoshareholdersandinvestors
Customersatisfactionformsthebasisofreputationandtrust
Innovativeproductsolutionsdemonstratetheabilitytocreateandcapturesustainableandprofitablevalue
Employeecompetenceaddsvaluetotheorganizationthroughuniqueskillsthatincreasethequalityoftheorganizationaloperations
Long-termandstrongrelationshipwithourcustomers,suppliersandotherstakeholdershelpsinachievingcompetitiveadvantageandenhancestheorganizationalperformance.
Fullsupportandcompliancewithsustainabilityinitiativesofcustomersandregulatorsasregardsinputsusedandwastesgeneratedaddressestheincreasingthreatofclimatechangeandotherenvironmentalimpactstoourbusinessandcommunities
FINANcIAL2020 2019 2018(As
restated)Revenue $1.14B $1.25B $1.35BNetIncome/(Loss) ($3.5M) ($7.8M) $47.2MDebt-to-Equity 0.41 0.55 0.79BankBorrowings $240.8 $268.5 $324.3Earnings/(Loss)perShare ($0.002) ($0.004) $0.022ReturnonEquity -0.8% -2.0% 13.9%
mANUFAcTURED cAPITAL2020 2019 2018(As
restated)TotalAssets $1.13B $1.10B $1.08BCapitalExpenditure $18.7M $38.8M $65.0MDepreciationandAmortization $55.4M $48.7M $37.5M
INTELLEcTUAL cAPITAL2020 2019 2018
Numberofengineersandtechnicians 2,767 2,594 2,616
Indirectlaborcosts $75.2M $74.5M $77.0M
HUmAN cAPITAL
2020 2019 2018Salaries,wages,andbenefits $215.6M $226.8M $226.6MTotalTraininghours 851K 1.2M 936KSafemanhours 39M 44.7M 41.6M
SocIAL AND RELATIoNSHIP cAPITAL2020 2019 2018
Keycustomerswithmorethan15yearsoftenure 20+ 20+ 20+
MajorSuppliers Over200 Over200 Over200Taxestogovernments $9.4M $10.2M $12.5M
NATURAL cAPITAL2020 2019 2018(As
restated)DirectScope1GHGemission(intonsCO2e) 503 407 356a
IndirectScope2GHGemission(in'000tonsCO2e) 93 105 114a
IndirectScope3GHGemission(in'000tonsCO2e) 1.9 1.7 1.4a
Energyconsumption(inmillionkw/h) 144 163 176Waterconsumption(inmillionm3) 1.4 1.4b 2.3
Hazardouswaste(in'000kg) 540d 674c 970
a2018Scope1,2,3hasbeenchangedinaccordancewiththeglobalstandardsb2019dataexcludingGermany
c2019dataexcludingGermanyandVTSJapand2020dataexcludingVIAGermany,VIAChina&VTSJapan
Integrated mIcro-electronIcs, Inc.
40 Years of manufacturing technology and Innovation 40 Years of manufacturing technology and Innovation
2020 Integrated rePort
70 71

Qualifying Key SupplierSour proCureMent ManageMent approaCH
Our business covers a broad geographical spread, and a range of services and market segments.
With such reach, we hold ourselves to high standards and always strive to be better. This means our approach to advance sustainability is at the core of our sourcing network and supply chain. To do so, we work with customers to understand their needs and ensure our engagements are fulfilled in a manner that reflects their sustainability expectations and good practice guidance. In parallel, we communicate our expectations to business partners and carry out due diligence checks. Through this process, we establish accountability and assess compliance. We audit our suppliers once a year.
In 2020, our Sustainability Team organized training and assessment programs to key IMI suppliers in the Philippines and China based on RBA Code of Conduct Version 6.0 (2018). It includes labor, ethics, data protection, environmental, health and safety, and overall management system. We also provided risk management seminars to suppliers designed to help them adopt a risk mindset throughout their organization as well as to raise awareness of their impact in the achievement of IMI’s and its customers’ long-term goals and business strategy.
our poliCy of ConfliCt MineralS
IMI continuously supports the sourcing of minerals and metals from RBA compliant smelters or those not supporting the rebel groups of the Democratic Republic of Congo and adjoining countries. We collect Conflict Minerals Reporting Template from suppliers annually and use the same format in disclosing smelter information to customer through our Customer Focus Team. We check compliance from the publicly available list of conformant smelters through the Responsible Minerals Initiative website. Whenever we uncover non-compliance, we share the results with our suppliers and require them to source responsibly. As part of our contractual agreements, we expect suppliers to practice the same measures for alignment within their operations and supply chains.
Trainingsessionwithsuppliers
natural CapitalEarly on, we said that our journey toward sustainability will be a long-term undertaking. With the support of our stakeholders, we continue our first steps to sustainable growth and development as one of our priorities.
We are fully committed to supporting UN SDGs through Ayala Corporation’s Sustainability Blueprint. As part of AC Industrials, IMI champions SDG 9— Industry, Innovation, and Infrastructure, as well as SDG 12—Responsible Consumption and Production. By 2030, we envision the following:• An inclusive and sustainable industrialization by
demonstrating manufacturing value add of US$1 billion across all IMI locations including
developing countries where we operate;• IMI will reduce its CO2 Emissions by 5 percent
based on 2018 levelss by adopting energy efficient technologies and harnessing clean energy
• Substantially reduce waste generation through reduction of material consumption and zero out waste disposal to municipal landfills through recycling and recovery; and
• IMI will reduce its water drawn from source by 30 percent based on 2018 levels by adopting recycling and re-use of waste water;
• Exhaust gas produced in production is discharged after purification using activated carbon
• Initial installation of solar panels at IMI Laguna Philippines site
water
Optimization of de-ionized water system operations, re-use of treated water and recovery of excess water. Re-use and/or recycle water including reverse osmosis reject, replacement of aging main water piping supply.
waSte
• Reduce-reuse-recycle program in disposing of waste materials/chemicals; assurance of proper disposal through accredited haulers, treaters, and recyclers.
• IMI Philippines achieved 98.20 percent of waste recovered diverting to municipal landfill, through reduce, re-use, recycle programs.
Monitoring
Regular emission testing and monitoring of air pollutants is conducted continuously.
energy ConSuMption
Our initiatives to mitigate the impact of energy consumption:• Standardization of Energy Efficiency Program
(EEP) across regional sites/best practices and emergency efficiency programs from the Philippine site
• Reduction of kilowatt/cubic feet minute compressors or compressed dry air system to be retrofitting efficient element units
• Retrofitting of variable speed drive and air dropped temperature circulation for major AC support system equipment yielding 10,000 kw/h
• Conversion and retrofit of obsolete environmental controls to updated setup for increased reliability— replaced two out of three controls as planned
• Introduction to site facility risk assessment• Data analytics for energy consumption with focus
on air-conditioning and compressed air• Coordination with power suppliers for bigger
renewal energy allocation
un Sdg CoMMitMentS Continuously aligning with the UN SDGs, all our manufacturing sites across continents adopt an international management systems standards on environmental management systems through ISO 14001.
energy
• Use of LED lightings, reduction of operating hours on cooling tower, installation of duct links on air conditioning, optimization of operating hours of selected compressed dry air equipment
• Reduction/optimization of operating hours for cooling towers and compressors, retrofit of AHU and PACU units, cooling coil replacement (improves chiller setpoint)
• Central air conditioning uses secondary circulation water to save energy and protect the environment
our approach to advance sustainability
is at the core of our sourcing network and
supply chain.
Although we are making good progress, there remains much to do. In 2021, the IMI Code of Conduct will be updated based on the recently released RBA version 7.0. Our audit will involve at least 15 major suppliers, and we will issue an updated Supplier Code of Conduct and corresponding risk management trainings.
Integrated mIcro-electronIcs, Inc.
40 Years of manufacturing technology and Innovation 40 Years of manufacturing technology and Innovation
2020 Integrated rePort
72 73

waSte ManageMent
Our initiatives to mitigate the Impact of waste generation and waste disposal • Continue and sustain the waste reduction
programs from upstream waste sources by implementing the 4 Rs method—reduce, reuse, recycle, and replace material that are not hazardous to environment
HuMan Capital
ImI GRoUP HUmAN cAPITAL
ImI EmPLoYEE ENGAGEmENT ScoRE
2020 2019
14%
13%
19%
21%
67%
67%
ASIA EUROPE US
ASIA EUROPE US
2020
2019
reSpeCting HuMan rigHtS
Our commitment to human rights starts with safeguarding the health and safety of our employees and their working environment.
This applies to all employees including temporary, project, migrant, student, direct employees, and any other type of employee. It also recognizes international standards (e.g., Universal Declaration of Human Rights, Social Accountability International, UN Global Compact, and the Ethical Trading).
ToTAL
ToTAL17,215
15,834
HuMan reSourCeS initiatiVeS
• Reinforcing IMI’s core values • Employee engagement survey• Leadership assessment for key talents and
successors• Global talent review• Organizational transformation through
management program across levels
GENDER DIVERSITY (BY GENDER)*
WoRKFoRcE DIVERSITY (BY AGE)*
40%
60%
41%
10%
8%
59%
57%
31%
35%
59%
BELO
W3
0OVE
R50
30-
50
2020 2019
Webuildonthesestrengths:communication, customer Focus, and
operating Efficiency
92% 86%PhilippineNorms88%GlobalNorms
un Sdg CoMMitMentS
We recognize that human capital will become increasingly important as the world transforms into knowledge-based economies that depend on information, knowledge, and multi-level skills. This transformation was made more challenging in 2020 as the world adjusted to the new normal with the need to deploy more robust on-line, digital solutions to cater to work from home and telecommuting.
Our most important asset remains to be all 15,000+ strong employees spanning a multi-culturally diverse and global community that will continue to provide the strength, resilience, innovation, and creativity that will enable us to provide value to our customers and stakeholders. It was therefore incumbent upon IMI in the face of the global pandemic to prioritize and ensure the safety and well-being of all employees across the enterprise.
We continue to invest in strengthening our corporate culture and employee engagement utilizing more innovative and creative means as we adjust to the demands of a more digital world.
*Excluding VIA Germany, VIA China & VTS Japan
GREENHoUSE GAS EmISSIoN (GHG)IN ToNNES co2e
Scope 1 2020 2019 2018
Asia 363 213 324
Europe 111 158 21
US 29 35 11
ToTAL 503 407 356
Scope 2 2020 2019 2018
Asia 70,954 81,105 94,475
Europe 14,443 15,228 12,721
US 7,898 8,692 7,628
ToTAL 93,294 105,025 114,825
Scope 3 2020 2019 2018
Asia 1,854 1,586 1,396
Europe 90 136 45
US 0 0.00 0.00
ToTAL 1,943 1,722 1,441
Note:Datafrom2018Scope1,2,3hasbeenchangedinaccordancewiththeglobalstandards
2020dataexcludingVIAGermany,VIAChina,&VTSJapan
• Initiate the redesign of equipment and processes to reduce material consumption
• Continue the recycling recovery and treatment of all wastes to zero out the disposal from municipal land fill
ENERGY coNSUmPTIoN(inmillionkw/h)
Electricity 2020 2019 2018
Asia 100 116 135
Europe 26 28 24
US 17 19 17
ToTAL 144 163 176
WASTE mANAGEmENT (in ‘000 kg)
Hazardous 2020 2019 2018
Asia 313 418b 433
Europe 159 432b 167
US 68 120 74
ToTAL 540 970 674
Non-HazardousREcYcLED 2020 2019 2018
Asia 532 851b 1,322
Europe 351 533b 504
US 784 831 712
ToTAL 1,667 2,215 2,538
Non-HazardousRESIDUAL 2020 2019 2018
Asia 615 488b 287
Europe 124 14b 3
US 178 269 189
ToTAL 917 770 479
b2019GermanyandVTSJapannodataofwastemanagement2020dataexcludingVIAGermany,VIAChina&VTSJapan
WATER(in‘000m3)
2020 2019 2018
Asia 1,244 1,223 1,870
Europe 96 200a 431
US 20 24 21
ToTAL 1,360 1, 447 2, 322
a2019Germanynodataofwaterconsumption2020electricity&waterconsumptionexcluding
VIAGermany,VIAChina&VTSJapan
Integrated mIcro-electronIcs, Inc.
40 Years of manufacturing technology and Innovation 40 Years of manufacturing technology and Innovation
2020 Integrated rePort
74 75

SaSB Material iSSueS index
mATERIAL ToPIcS AccoUNTING mETRIcS SDGS PAGE NUmBER (S)
Environment • GHGEmissions• AirQuality• EnergyManagement• WaterManagement• Waste&HazardousMaterials• EcologicalImpact
6-967-68
Human capital • LaborPractices• EmployeeHealth&Safety• EmployeeEngagement,Diversity&Inclusion
6–962-6569-70
Business model & Innovation
• ProductDesign&LifeCycleManagement• BusinessModelResilience• SupplyChainManagement• Materials&ResourceEfficiency• PhysicalImpactofClimateChange
18-3166
Leadership & Governance
• BusinessEthics• CompetitiveBehavior• ManagementofLegal&RegulatoryRequirements• CriticalIncidentRiskManagement• SystemicRiskManagement
45–5762–6575-86
training and deVelopMent
In 2020, IMI University conducted a total of 98 training programs completing 19,394 of training man hours. We certified additional four SMEs giving us a total of 127 SMEs supporting our IMI University. The IMI University Learning Management System (LMS) was successfully launched in Bulgaria and Serbia with 26 available LMS modules.
IMI Philippines provided assistance through the Expanded Tertiary Education Equivalency and Accreditation Program (ETEEAP) of the Commission on Higher Education (CHED). In August last year, 11 employees achieved a bachelor’s degree in engineering and business administration. Five of them were ETEEAP scholars. In partnership with a local university, scholarship grants were awarded to three qualified employees after a thorough screening.
HealtH and Safety of our worKforCe
We safeguard the health, safety, and well-being of all members of our global IMI team, at the same time creating a fun working environment
To raise awareness and participation, we keep our employees informed of various health programs, blood drives, and annual physical examinations. In addition, annual vaccination programs are offered at workable deduction scheme to further encourage employees to avail the services offered.
Safety trainings are conducted regularly as part of our accident prevention program to minimize occupational hazards and risk while improving productivity.
TrainingsessionatIMIChina
Sustainability accounting Standards Board (SaSB) Standards
Analyzing the materiality of sustainability information requires an understanding of the specific impact of business on society and the environment, as well as the impact of sustainability challenges on business. Companies operating in a specific industry are more likely to have similar business models and use resources in similar ways than companies in other industries. Therefore, they are likely to have similar sustainability risks and opportunities. The SASB develops sustainability accounting standards at the industry level, focusing on issues that are closely tied to resource use, business models, and other factors at play in the industry.
The SASB Standards identify industry-specific sustainability factors that likely to be material for 77 industries. They focus on the subset of environmental, social, and governance (ESG) issues most relevant to financial performance in each industry.
They are designed to:
1. Meet investor needs Investors across asset classes want comparable,
consistent, and reliable data on financially material sustainability factors. For example, investors who evaluate corporate performance within an industry context can easily integrate and assess material sustainability factors alongside financial fundamentals.
2. Be cost-effective and industry specific Industry-specific disclosure reduces costs and
minimizes noise by surfacing the most relevant information. IMI uses SASB for Electronic Manufacturing Services & Original Design Manufacturing - Sustainable Industry Classification System™ (SICS™) #TC0101 as our SASB reference guide.
3. Be aligned and can be used with other frameworks and standards
Many companies use both SASB and GRI Standards to meet the needs of various audiences. It is also a practical tool for implementing principles-based frameworks, including those provided by the TCFD and IIRC.
SASB INDEX - SUSTAINABILITY ISSUES & ToPIcS FoR EmS mANUFAcTURING
GLoBAL TRAINING HoURS
Safe Man HourS(In MILLIOnS)
2018
ASIA
ASIA
ASIA
EUROPE
EUROPE
EUROPE
US
US
US
2019
2020
ToTAL
ToTAL
ToTAL
ToTAL
2019
2020
2018
ToTAL
ToTAL936K
44.7m
39.2m
41.6m
1.15m
851K
8.98.0
5.4
6.16.1
5.4
29.625.1
30.7
20192020 2018
EUROPE
ASIA
US
86%
76%
91%
12%
22%
5%
2%
2%
4%
2020dataexcludingVIAGermany,VIAChina&VTSJapan
Integrated mIcro-electronIcs, Inc.
40 Years of manufacturing technology and Innovation 40 Years of manufacturing technology and Innovation
2020 Integrated rePort
76 77

As a public company, we recognize the value of global standards for corporate disclosure. We joined the network of supporters of Task Force on Climate-Related Financial Disclosure (TCFD) in January 2021 to promote a more resilient financial system through climate-related disclosure.
TCFD was set up by the G20’s Financial Stability Board in 2015 with the goal of developing voluntary and consistent climate-related financial risk disclosure which can be adopted by companies to help inform investors, lenders, the market, and other members of the public to understand material risk related to climate change.
With this initiative, IMI is among the first electronic equipment manufacturers in South East Asia, and in the Philippines to join 1,800 companies in 78 countries across the globe to adopt the TCFD framework. Going forward, we will be guided by the Task Force’s recommendations which involve four thematic areas: governance, strategy, risk management, and metrics and targets, where there are 11 adoptable recommendations which take into
tCfd adoption
Recommendations and Supporting Recommended Disclosures mAIN BENEFITS oF TcFD ADoPTIoN
AccESS To cAPITAL DIScLoSURE REqUIREmENTS
moRE EFFEcTIVE RISK mANAGEmENT
ADDRESING INVESToR EXPEcTATIoNS
Easier or better access to capitalbyincreasinginvestor’sandlenders’confidence
more effectively meeting existing disclosure requirementstoreportmaterialinformationinfinancialfilings
Increased awareness and understanding of climate-related risks and opportunitieswithinthecompanyresultinginmore effective risk management
Proactively addressing investors’ demand for climate-related informationinaframeworkthatinvestorsareincreasinglyaskingfor
Recommended Disclosures Recommended Disclosures Recommended Disclosures Recommended Disclosures
a)Describetheboard’soversightofclimate-relatedrisksandopportunities.
a)Describetheclimate-relatedrisksandopportunitiestheorganizationhasidentifiedovertheshort,medium,andlongterm.
a)Describetheorganization’sprocessesforidentifyingandassessingclimate-relatedrisks.
a)Disclosethemetricsusedbytheorganizationtoassessclimate-relatedrisksandopportunitiesinlinewithitsstrategyandriskmanagementprocess.
b)Describemanagement’sroleinassessingandmanagingclimate-relatedrisksandopportunities.
b)Describetheimpactofclimate-relatedrisksandopportunitiesontheorganization’sbusinesses,strategy,andfinancialplanning.
b)Describetheorganization’sprocessesformanagingclimate-relatedrisks.
b)DiscloseScope1,Scope2,and,ifappropriate,Scope3greenhousegas(GHG)emissions,andtherelatedrisks.
c)Describetheresilienceoftheorganization’sstrategy,takingintoconsiderationdifferentclimate-relatedscenarios,includinga2°Corlowerscenario.
c)Describehowprocessesforidentifying,assessing,andmanagingclimate-relatedrisksareintegratedintotheorganization’soverallriskmanagement.
c)Describethetargetsusedbytheorganizationtomanageclimate-relatedrisksandopportunitiesandperformanceagainsttargets.
account physical and transition risks associated with climate change. By committing to this framework with focus on financial materiality, we hope to make the quality of information valuable to investors.
BenefitS of tCfd TCFD adoption supports IMI’s vision of being Future-Ready as a global technology solutions company that takes into account its responsibility as one of Ayala Corporation and AC Industrial’s sustainability champions, in the manufacturing industry, in the Philippines, and across the globe. IMI reinforces its commitment to help achieve AC/ACI’s Sustainability Blueprint, and also to help mitigate the risk of climate change.
Companies implementing the TCFD recommendations will:
• have easier or better access to capital by increasing investors’ and lenders’ confidence that the company’s climate-related risks are appropriately assessed and managed;
• more effectively meet existing disclosure requirements to report material information in financial filings;
• increased awareness and understanding of climate-related risks and opportunities within the company resulting in better risk management and more informed strategic planning; and
• proactively address investors’ demand for climate-related information in a framework that investors are increasingly asking for, which could ultimately reduce the number of climate-related information requests received
IMI will work and align with the Ayala group to develop its TCFD roadmap to full adoption and implementation in 2021. In addition, as part of its first steps in this journey, IMI will place emphasis on climate-related risks in the upcoming 2021 Annual Risk Assessment. Results of the risk assessment will be used in IMI Strategic Planning Conference to cascade IMI’s strategy and direction about the risks and opportunities of climate change to the organization.
GoVERNANcEDisclosetheorganization’sgovernancearoundclimate-relatedrisksandopportunities
STRATEGYDisclosetheactualandpotentialimpactsofclimate-relatedrisksandopportunitiesontheorganization’sbusinesses,strategy,andfinancialplanningwheresuchinformationismaterial.
RISK mANAGEmENTDisclosehowtheorganizationidentifies,assesses,andmanagesclimate-relatedrisks.
mETRIcS AND TARGETSDisclosethemetricsandtargetsusedtoassessandmanagerelevantclimate-relatedrisksandopportunitieswheresuchinformationismaterial.
“ImI has always been in the forefront of pioneering ESG values in the manufacturing sector for the Philippines. As
part of the global supply chain for the world’s top brands
and products, we have been complying and exceeding these
requirements for years. our decision to support the TcFD initiatives is a natural path for
us to take and uphold."Arthur R. Tan
PresidentandCEO
Integrated mIcro-electronIcs, Inc.
40 Years of manufacturing technology and Innovation 40 Years of manufacturing technology and Innovation
2020 Integrated rePort
78 79

MANAGEMENT DISCUSSION AND ANALYSIS Review of 2020 Performance Revenues COVID-19 had contained so much paradigm-shifting developments in the industry and changes in the strategies of almost all businesses globally. Consolidated full year 2020 revenues were US$1.14 billion, nine percent lower than 2019. Our wholly owned businesses made US$867 million of revenues, down 14 percent from 2019, as plant shutdowns in various operating regions during the first half of the year significantly affected financial results. Facilities in the Philippines, China, and Mexico all adhered to government mandated lockdowns to contain the spread of COVID-19, while operating sites in Bulgaria and Czech Republic aligned with the demand slowdown of OEM customers by exercising voluntary reduced work schedules. The global situation led to a 28 percent year-on-year reduction in top line sales in the first half. Revenues in the second half of the year recouped, 36 percent better than first half on the back of strong demand recovery and subsequent normalization of operations. The global demand for security and I-o-T products boosted industrial revenue while mobility-focused European and North American facilities benefited from the rapid rise of global automotive production. In addition, IMI’s growing foothold in the profitable medical segment also led to increased higher margin sales for its manufacturing plants in Asia. Subsidiaries VIA optronics and STI Ltd. posted combined revenues of US$269 million, an increase of nine percent from the previous year. VIA optronics continues its shift towards automotive display solutions by partnering with leading manufacturers in both traditional and electric vehicle spaces. Meanwhile, STI Ltd. is buoyed by the continued growth of its medical segment and recovery of the aerospace and defense markets. The financial information included herein for the fourth quarter and full year 2020 for VIA optronics and STI Ltd. may change; however, IMI does not expect any such changes to be material, in the aggregate, to IMI. Gross Margins and Net Profits Our gross profit was down six percent year-on-year to US$96.3 million due to the decline in revenues from the lockdowns, but we were able to improve our margin to 8.5% from 8.2%. This was driven by improved manufacturing efficiency and cost-cutting initiatives implemented across all sites. In a continuing difficult market environment, we worked with the local government units of countries where we operate to secure various forms of employee-related subsidies in Bulgaria, China, Czech Republic, France, Mexico, Serbia, and Singapore, thereby reducing the operating costs. Net loss amounted to US$3.5 million compared with net loss of US$7.8 million in the previous year. The improvement of US$4.3 million was primarily from higher operating income of US$7.9 million following the improved gross profit margins and reduced general and administrative expenses. The second half of 2020 also benefited from a significant swing from a net loss of US$21.5 million in the first half to a positive US$18.0 million in the second half—a testament to IMI’s continuing efforts to respond swiftly in times of business disruptions. Financial Condition We remain resolutely committed to our disciplined approach to capital allocation and to maintaining a robust balance sheet. At the end of 2020, current ratio stood at 1.54:1 compared to 1.49:1 in 2019, and debt-to-equity ratio was 0.41:1 from 0.55:1. And from net debt of US$116 million in 2019, we now have close to US$4 million of net cash mainly as a result of increased cash and cash equivalents and reduced financial indebtedness. Our capital expenditures decreased to US$18.7 million in 2020 from US$38.8 million in the prior year due to our focus on cash flow management as well as maximum utilization of existing capacity. We spent most of our capital expenditures on expansionary strategic priorities including additional machineries and building expansions intended for emerging technologies, new projects, and improvement of existing facilities. As a percentage of revenues, capital expenditures were 1.6%, down from 3.1% in 2019. We expect capital expenditures in 2021 at a level consistent with 2019 levels as we expand our portfolio of business opportunities.
finanCial StateMentS
ManageMent diSCuSSion and analySiS
Integrated mIcro-electronIcs, Inc.
40 Years of manufacturing technology and Innovation 40 Years of manufacturing technology and Innovation
2020 Integrated rePort
80 81

report of tHe audit and riSK CoMMitteeto tHe Board of direCtorS
StateMent of ManageMent’S reSponSiBility for finanCial StateMentS
FOR THE YEAR ENDED 31 DECEMBER 2020REPORT OF THE AUDIT AND RISK COMMITTEE TO THE BOARD OF DIRECTORS
For the Year Ended 31 December 2020
The Board-approved Audit and Risk Committee Charter defines the duties and responsibilities of the Audit Committee. In accordance with the Charter, the Committee assists the Board of Directors in fulfilling its oversight responsibilities to the shareholders with respect to: Integrity of the Company’s financial statements and the financial reporting process
Appointment, remuneration, qualifications, independence and performance of the independent external auditors and the integrity of the audit process as a whole
Effectiveness of the systems of internal control and the risk management process
Performance and leadership of the internal audit function
Compliance with applicable legal, regulatory and corporate governance requirements In compliance with the Audit and Risk Committee Charter, we confirm that: The Chairman and another member of the Committee are Independent Directors;
We had four (4) regular meetings during the year with all the members present. We met separately with the internal and external auditors in an executive session during the year;
We recommended for approval of the Board and endorsement to the shareholders the reappointment of SGV & Co. as the Company’s 2020 Independent Auditor;
We have reviewed and discussed the quarterly unaudited consolidated financial statements and the annual audited consolidated financial statements of Integrated Micro-Electronics, Inc. and subsidiaries (“IMI”) with management, the internal auditors, as well as SGV & Co. as the independent auditor of IMI, and that these activities were performed in the following context: - Management has the primary responsibility for the financial statements and the financial reporting process;
and - SGV & Co. is responsible for expressing an opinion on the conformity of IMI’s audited consolidated financial
statements with Philippine Financial Reporting Standards; We have discussed and approved the overall scope and the respective audit plans of the Company’s internal
auditors and SGV & Co. We have also discussed the results of their audits, their assessment of the Company’s internal controls, and the overall quality of the financial reporting process including their management letter of comments;
We have reviewed the reports and updates of the internal auditors ensuring that management is taking appropriate corrective actions in a timely manner, including addressing internal control and compliance issues. The Global Internal Audit Group obtained the highest rating of “Generally Conforms,” from the External Quality Assessment Review performed by Punongbayan & Araullo/Grant Thornton external audit firm in January 2020.
Based on the assurance provided by internal audit and SGV & Co., as a result of their audit activities, the Committee assessed that the Company’s systems of internal controls, risk management, and governance processes are adequate;
We have reviewed and discussed the adequacy of IMI’s enterprise risk management process, including the nature of significant risk exposures, and the related risk mitigation efforts and initiatives. This activity was reviewed in the context that management is primarily responsible for the risk management process;
We have reviewed and recommended for the approval by the Board of Directors all audit, audit-related and non-audit services provided by SGV & Co. to IMI and the related fees for such services. We have also assessed the compatibility of non-audit services with the auditors’ independence to ensure that such services will not impair their independence;
We have conducted an annual assessment of our performance to confirm that the Committee satisfactorily performed its responsibilities based on the requirements of its Charter; and
We reviewed the Audit Committee Charter to ensure that it is updated and aligned with regulatory requirements.
Based on the reviews and discussions undertaken, and subject to the limitations on our roles and responsibilities referred to above, the Audit and Risk Committee recommends to the Board of Directors that the audited consolidated financial statements be included in the Annual Report for the year ended December 31, 2020 for filing with the Securities and Exchange Commission and the Philippine Stock Exchange. The Audit and Risk Committee is also recommending to the Board of Directors the re-appointment of SGV & Co. as IMI’s independent auditor for 2021 based on the review of their performance and qualifications. 23 February 2021
EDGAR O. CHUA
Chairman RAFAEL C. ROMUALDEZ
Member HIROSHI NISHIMURA
Member
STATEMENT OF MANAGEMENT’S RESPONSIBILITY FOR FINANCIAL STATEMENTS
The management of Integrated Micro-Electronics, Inc. (the Company) is responsible for the preparation and fair presentation of the consolidated financial statements including the schedules attached therein for the years ended December 31, 2020, 2019 and 2018, in accordance with the prescribed financial reporting framework indicated therein, and for such internal control as management determines is necessary to enable the preparation of the consolidated financial statements that are free from material misstatement, whether due to fraud or error. In preparing the consolidated financial statements, management is responsible for assessing the Company’s ability to continue as a going concern, disclosing, as applicable matters related to going concern and using the going concern basis of accounting unless management either intends to liquidate the Company or to cease operations, or has no realistic alternative but to do so. The Board of Directors is responsible for overseeing the Company’s financial reporting process. The Board of Directors reviews and approves the consolidated financial statements including the schedules attached therein, and submits the same to the stockholders.
SyCip Gorres Velayo & Co., the independent auditor appointed by the stockholders, has audited the consolidated financial statements of the Company and its subsidiaries in accordance with Philippine Standards on Auditing, and in its report to the stockholders, has expressed its opinion on the fairness of presentation upon completion of such audit.
JAIME AUGUSTO ZOBEL DE AYALA Chairman, Board of Directors
ARTHUR R. TAN JEROME S. TAN
Chief Executive Officer Global Chief Financial Officer
Integrated mIcro-electronIcs, Inc.
40 Years of manufacturing technology and Innovation 40 Years of manufacturing technology and Innovation
2020 Integrated rePort
82 83

independent auditor’S reportINDEPENDENT AUDITOR’S REPORT The Board of Directors and Stockholders Integrated Micro-Electronics, Inc. Opinion
We have audited the consolidated financial statements of Integrated Micro-Electronics, Inc. and its subsidiaries (the Group), which comprise the consolidated balance sheets as at December 31, 2020 and 2019, and the consolidated statements of income, consolidated statements of comprehensive income, consolidated statements of changes in equity and consolidated statements of cash flows for each of the three years in the period ended December 31, 2020, and notes to the consolidated financial statements, including a summary of significant accounting policies.
In our opinion, the accompanying consolidated financial statements present fairly, in all material respects, the consolidated balance sheets of the Group as at December 31, 2020 and 2019, and its consolidated financial performance and its consolidated cash flows for each of the three years in the period ended December 31, 2020 in accordance with Philippine Financial Reporting Standards (PFRSs).
Basis for Opinion
We conducted our audits in accordance with Philippine Standards on Auditing (PSAs). Our responsibilities under those standards are further described in the Auditor’s Responsibilities for the Audit of the Consolidated Financial Statements section of our report. We are independent of the Group in accordance with the Code of Ethics for Professional Accountants in the Philippines (Code of Ethics) together with the ethical requirements that are relevant to our audit of the consolidated financial statements in the Philippines, and we have fulfilled our other ethical responsibilities in accordance with these requirements and the Code of Ethics. We believe that the audit evidence we have obtained is sufficient and appropriate to provide a basis for our opinion.
Key Audit Matters
Key audit matters are those matters that, in our professional judgment, were of most significance in our audit of the consolidated financial statements of the current period. These matters were addressed in the context of our audit of the consolidated financial statements as a whole, and in forming our opinion thereon, and we do not provide a separate opinion on these matters. For each matter below, our description of how our audit addressed the matter is provided in that context.
We have fulfilled the responsibilities described in the Auditor’s Responsibilities for the Audit of the Consolidated Financial Statements section of our report, including in relation to these matters. Accordingly, our audit included the performance of procedures designed to respond to our assessment of the risks of material misstatement of the consolidated financial statements.
The results of our audit procedures, including the procedures performed to address the matters below, provide the basis for our audit opinion on the accompanying consolidated financial statements. Recoverability of Goodwill Under PFRS, the Group is required to annually test the amount of goodwill for impairment. As of December 31, 2020, the Group’s goodwill attributable to the following cash-generating units (CGUs): Integrated Micro-Electronics, Inc., Speedy-Tech Electronics, Ltd., IMI Czech Republic s.r.o., VIA Optronics GmbH (VIA), and Surface Technology International Enterprises Limited (STI), amounted to $147.25 million, which is considered significant to the consolidated financial statements. In addition, management’s assessment process requires significant judgment and is based on assumptions which are subject to higher level of estimation uncertainty due to the current economic conditions which have been impacted by the coronavirus pandemic, specifically revenue growth rate, gross margin and discount rate. The Group’s disclosures about goodwill are included in Note 11 to the consolidated financial statements. Audit response We obtained an understanding of the Group’s impairment assessment process and the related controls. We involved our internal specialist in evaluating the methodologies and assumptions used. These assumptions include revenue growth rate, gross margin and discount rate. We compared the key assumptions used such as revenue growth rate against actual historical performance of the CGU and industry outlook, the gross margins against historical rates, and other relevant external data, taking into consideration the impact associated with coronavirus pandemic. We tested the parameters used in the
determination of the discount rate against market data. We also reviewed the Group’s disclosures about those assumptions to which the outcome of the impairment test is more sensitive; specifically those that have the most significant effect on the determination of the recoverable amount of goodwill. Valuation of the put options arising from the acquisition of VIA Optronics GmbH (VIA) and STI The terms of the acquisition of VIA in 2016 and STI in 2017 included put options that granted the noncontrolling shareholders the right to sell their shares in the acquiree to the Group. This resulted to a recognition of financial liability which is being revalued at every reporting period. In 2020, the shareholders agreement for VIA was amended which resulted to the cancellation of the put option and reclassification of the put option liability amounting to $15.3 million to additional paid-in capital. As of December 31, 2020, the remaining put options liability for STI amounted to $1.59 million. We considered the valuation of the put options to be a key audit matter because it requires significant judgment and is based on assumptions which are subject to higher level of estimation uncertainty due to the current economic conditions which have been impacted by the coronavirus pandemic, specifically, revenue growth rate, EBITDA multiple, discount rate, forecasted interest rate and the probability of trigger events occurring. Details of the transactions and the valuation of the put options are disclosed in Notes 18 and 32 to the consolidated financial statements.
Audit response We involved our internal specialists in testing the fair values of the put options, including the evaluation of the methodologies and key assumptions used. These assumptions include revenue growth rate, EBITDA multiple, discount rate, forecasted interest rate and probability of trigger events occurring. We evaluated the revenue growth rate against the acquirees’ historical financial performance, the Group’s business plan for the acquirees and industry outlook. We evaluated the EBITDA multiple against market data of comparable companies. We tested the parameters used in the derivation of the discount rate against market data. We compared the interest rate used in forecasting the future equity value to the risk-free rate in Germany and the United Kingdom, and inquired with management its basis for the probability of trigger events occurring. We also examined the agreement supporting the cancellation of the put option granted to the noncontrolling shareholders. Recoverability of capitalized product development costs and property, plant and equipment Under PFRS, the Group is required to test the recoverability of nonfinancial assets when indicators of impairment exist. In 2020, the continuing gross loss position since the start of mass production for the production line for certain customers in Philippines and Mexico has been assessed as an impairment indicator requiring an impairment assessment. The management’s impairment assessment process requires significant judgment and is based on assumptions which are subject to higher level of estimation uncertainty due to the current economic conditions which have been impacted by the coronavirus pandemic, specifically revenue growth rate and inclusion of future price increases in the revenue growth, cost ratios and discount rates. As of December 31, 2020, the carrying amount of the capitalized product development costs and the property, plant, and equipment specifically used in the projects amounted to $10.99 million, and the impairment loss recognized for the year amounted to $7.22 million. These balances are considered significant to the consolidated financial statements. The Group’s disclosures about the capitalized product development costs and property, plant and equipment are included in Notes 10 and 12 to the consolidated financial statements. Audit response We obtained an understanding of the Group’s impairment assessment process and the related controls. We involved our internal specialist in evaluating the methodologies and assumptions used. These assumptions include revenue growth rate, cost ratios and discount rate. We compared the key assumptions used such as revenue growth rate and cost ratios against actual historical performance of the specific production line and other relevant external data, taking into consideration the impact associated with coronavirus pandemic. We tested the parameters used in the derivation of the discount rate against market data. We also reviewed the Group’s disclosures about those assumptions to which the outcome of the impairment test is more sensitive; specifically, those that have the most significant effect on the determination of the recoverable amount of the capitalized product development costs and property, plant and equipment. Other Information
Management is responsible for the other information. The other information comprises the information included in the SEC Form 20-IS (Definitive Information Statement), SEC Form 17-A and Annual Report for the year ended December 31, 2020, but does not include the consolidated financial statements and our auditor’s report thereon. The SEC Form 20-IS (Definitive Information Statement), SEC Form 17-A and Annual
Integrated mIcro-electronIcs, Inc.
40 Years of manufacturing technology and Innovation 40 Years of manufacturing technology and Innovation
2020 Integrated rePort
84 85

Report for the year ended December 31, 2020 are expected to be made available to us after the date of this auditor’s report.
Our opinion on the consolidated financial statements does not cover the other information and we will not express any form of assurance conclusion thereon.
In connection with our audits of the consolidated financial statements, our responsibility is to read the other information identified above when it becomes available and, in doing so, consider whether the other information is materially inconsistent with the consolidated financial statements or our knowledge obtained in the audits, or otherwise appears to be materially misstated.
Responsibilities of Management and Those Charged with Governance for the Consolidated Financial Statements Management is responsible for the preparation and fair presentation of the consolidated financial statements in accordance with PFRSs, and for such internal control as management determines is necessary to enable the preparation of consolidated financial statements that are free from material misstatement, whether due to fraud or error. In preparing the consolidated financial statements, management is responsible for assessing the Group’s ability to continue as a going concern, disclosing, as applicable, matters related to going concern and using the going concern basis of accounting unless management either intends to liquidate the Group or to cease operations, or has no realistic alternative but to do so.
Those charged with governance are responsible for overseeing the Group’s financial reporting process.
Auditor’s Responsibilities for the Audit of the Consolidated Financial Statements
Our objectives are to obtain reasonable assurance about whether the consolidated financial statements as a whole are free from material misstatement, whether due to fraud or error, and to issue an auditor’s report that includes our opinion. Reasonable assurance is a high level of assurance, but is not a guarantee that an audit conducted in accordance with PSAs will always detect a material misstatement when it exists. Misstatements can arise from fraud or error and are considered material if, individually or in the aggregate, they could reasonably be expected to influence the economic decisions of users taken on the basis of these consolidated financial statements.
As part of an audit in accordance with PSAs, we exercise professional judgment and maintain professional skepticism throughout the audit. We also: Identify and assess the risks of material misstatement of the consolidated financial statements, whether
due to fraud or error, design and perform audit procedures responsive to those risks, and obtain audit evidence that is sufficient and appropriate to provide a basis for our opinion. The risk of not detecting a material misstatement resulting from fraud is higher than for one resulting from error, as fraud may involve collusion, forgery, intentional omissions, misrepresentations, or the override of internal control.
Obtain an understanding of internal control relevant to the audit in order to design audit procedures that are appropriate in the circumstances, but not for the purpose of expressing an opinion on the effectiveness of the Group’s internal control.
Evaluate the appropriateness of accounting policies used and the reasonableness of accounting
estimates and related disclosures made by management.
Conclude on the appropriateness of management’s use of the going concern basis of accounting and, based on the audit evidence obtained, whether a material uncertainty exists related to events or conditions that may cast significant doubt on the Group’s ability to continue as a going concern. If we conclude that a material uncertainty exists, we are required to draw attention in our auditor’s report to the related disclosures in the consolidated financial statements or, if such disclosures are inadequate, to modify our opinion. Our conclusions are based on the audit evidence obtained up to the date of our auditor’s report. However, future events or conditions may cause the Group to cease to continue as a going concern.
Evaluate the overall presentation, structure and content of the consolidated financial statements, including the disclosures, and whether the consolidated financial statements represent the underlying transactions and events in a manner that achieves fair presentation.
Obtain sufficient appropriate audit evidence regarding the financial information of the entities or business activities within the Group to express an opinion on the consolidated financial statements. We are responsible for the direction, supervision and performance of the audit. We remain solely responsible for our audit opinion.
We communicate with those charged with governance regarding, among other matters, the planned scope and timing of the audit and significant audit findings, including any significant deficiencies in internal control that we identify during our audit.
We also provide those charged with governance with a statement that we have complied with relevant ethical requirements regarding independence, and to communicate with them all relationships and other matters that may reasonably be thought to bear on our independence, and where applicable, related safeguards. From the matters communicated with those charged with governance, we determine those matters that were of most significance in the audit of the consolidated financial statements of the current period and are therefore the key audit matters. We describe these matters in our auditor’s report unless law or regulation precludes public disclosure about the matter or when, in extremely rare circumstances, we determine that a matter should not be communicated in our report because the adverse consequences of doing so would reasonably be expected to outweigh the public interest benefits of such communication. The engagement partner on the audit resulting in this independent auditor’s report is Cyril Jasmin B. Valencia. SYCIP GORRES VELAYO & CO. Cyril Jasmin B. Valencia Partner CPA Certificate No. 90787 SEC Accreditation No. 1737-A (Group A), January 24, 2019, valid until January 23, 2022 Tax Identification No. 162-410-623 BIR Accreditation No. 08-001998-074-2020, December 3, 2020, valid until December 2, 2023 PTR No. 8534376, January 4, 2021, Makati City March 2, 2021
Integrated mIcro-electronIcs, Inc.
40 Years of manufacturing technology and Innovation 40 Years of manufacturing technology and Innovation
2020 Integrated rePort
86 87

InTEGRATED MICRO-ELECTROnICS, InC. AnD SUBSIDIARIES
ConSolidated BalanCe SHeetSINTEGRATED MICRO-ELECTRONICS, INC. AND SUBSIDIARIES CONSOLIDATED BALANCE SHEETS December 31
(Forward)
2020 2019
ASSETS
Current Assets Cash and cash equivalents (Note 5) $244,355,425 $152,660,116 Receivables (Notes 6 and 31) 275,621,791 290,643,361 Contract assets (Note 7) 54,525,401 58,908,123 Inventories (Note 8) 142,316,055 152,629,272 Other current assets (Notes 9 and 33) 17,355,310 19,106,392 Total Current Assets 734,173,982 673,947,264
Noncurrent Assets Property, plant and equipment (Note 10) 177,950,968 194,294,448 Goodwill (Note 11) 147,245,094 140,781,251 Intangible assets (Note 12) 17,145,629 28,576,837 Right-of-use assets (Note 30) 32,660,720 32,027,604 Financial assets at FVOCI (Notes 13 and 32) 1,124,461 1,199,763 Deferred tax assets - net (Note 25) 3,491,878 3,610,639 Other noncurrent assets (Note 14) 19,882,038 21,898,132 Total Noncurrent Assets 399,500,788 422,388,674 $1,133,674,770 $1,096,335,938
LIABILITIES AND EQUITY
Current Liabilities Accounts payable and accrued expenses (Note 15) $253,824,928 $267,072,013 Contract liabilities (Note 7) 1,515,095 4,742,170 Loans payable (Note 16) 206,490,427 126,051,547 Other financial liabilities (Notes 18, 32 and 33) 1,680,879 22,370,085 Current portion of long-term debt (Note 17) 2,109,394 28,037,902 Current portion of lease liabilities (Note 30) 7,785,039 4,074,866 Income tax payable 3,350,479 1,441,505 Total Current Liabilities 476,756,241 453,790,088
Noncurrent Liabilities Noncurrent portion of: Long-term debt (Notes 17 and 32) 32,210,531 114,385,913 Lease liabilities (Note 30) 27,628,221 29,722,846 Net retirement liabilities (Note 27) 9,355,655 9,165,082 Deferred tax liabilities - net (Note 25) 1,598,134 1,869,955 Other noncurrent liabilities (Note 24) 5,263,259 3,623,257 Total Noncurrent Liabilities 76,055,800 158,767,053 Total Liabilities 552,812,041 612,557,141
December 31 2020 2019
EQUITY
Equity Attributable to Equity Holders of the Parent Company Capital stock - common (Note 19) $42,674,930 $42,674,027 Subscribed capital stock (Note 19) 744,823 752,560 Additional paid-in capital (Notes 18 and 19) 193,869,684 146,208,099 Subscriptions receivable (Notes 19 and 28) (2,888,800) (2,955,581) Retained earnings (Note 19) 215,793,690 225,752,846 Treasury stock (Note 19) (1,012,588) (1,012,588) Other components of equity (Note 13) (874,804) (735,811) Cumulative translation adjustment 9,137,769 (17,682,926) Remeasurement losses on defined benefit plans (Note 27) (9,750,213) (10,450,763) 447,694,491 382,549,863
Equity Attributable to Non-controlling Interests in Consolidated Subsidiaries (Note 19) 133,168,238 101,228,934
Total Equity 580,862,729 483,778,797 $1,133,674,770 $1,096,335,938 See accompanying Notes to Consolidated Financial Statements.
Integrated mIcro-electronIcs, Inc.
40 Years of manufacturing technology and Innovation 40 Years of manufacturing technology and Innovation
2020 Integrated rePort
88 89

InTEGRATED MICRO-ELECTROnICS, InC. AnD SUBSIDIARIES
ConSolidated StateMentS of inCoMeInTEGRATED MICRO-ELECTROnICS, InC. AnD SUBSIDIARIES
ConSolidated StateMentS ofCoMpreHenSiVe inCoMe
INTEGRATED MICRO-ELECTRONICS, INC. AND SUBSIDIARIES CONSOLIDATED STATEMENTS OF INCOME Years Ended December 31 2020 2019 2018
REVENUE FROM CONTRACTS WITH CUSTOMERS (Note 29) $1,135,840,593 $1,250,365,914 $1,349,400,445
COST OF SALES (Notes 20 and 22) 1,039,503,708 1,148,137,698 1,214,979,839
GROSS PROFIT 96,336,885 102,228,216 134,420,606
OPERATING EXPENSES (Notes 21 and 22) (92,460,393) (106,222,063) (96,935,285)
OTHERS – Net Interest expense and bank charges (Note 23) (10,422,633) (13,141,935) (11,992,384) Foreign exchange losses – net (755,744) (4,215,058) (3,845,781) Interest income (Note 5) 330,682 860,775 998,995 Miscellaneous income – net (Note 24) 5,522,929 9,285,288 34,178,491 (5,324,766) (7,210,930) 19,339,321
INCOME (LOSS) BEFORE INCOME TAX (1,448,274) (11,204,777) 56,824,642
PROVISION FOR INCOME TAX (Note 25) Current 6,496,089 5,279,215 7,737,422 Deferred (1,570,668) (3,288,780) 304,920 4,925,421 1,990,435 8,042,342
NET INCOME (LOSS) ($6,373,695) ($13,195,212) $48,782,300
Net Income (Loss) Attributable to: Equity holders of the Parent Company ($3,455,073) ($7,780,648) $47,187,313 Non-controlling interests (2,918,622) (5,414,564) 1,594,987 ($6,373,695) ($13,195,212) $48,782,300
Earnings (Loss) Per Share (Note 26) Basic and diluted ($0.002) ($0.004) $0.022 See accompanying Notes to Consolidated Financial Statements.
INTEGRATED MICRO-ELECTRONICS, INC. AND SUBSIDIARIES CONSOLIDATED STATEMENTS OF COMPREHENSIVE INCOME Years Ended December 31 2020 2019 2018
NET INCOME (LOSS) ($6,373,695) ($13,195,212) $48,782,300
OTHER COMPREHENSIVE INCOME (LOSS) Other comprehensive income (loss) to be
reclassified into profit or loss in subsequent periods:
Exchange differences arising from translation of foreign operations (Note 19) 29,152,586 (5,475,454) (12,021,978)
Other comprehensive income (loss) not to be
reclassified into profit or loss in subsequent periods:
Remeasurement gains (losses) on defined benefit plans (Note 27) 700,550 (4,214,969) 1,201,302
Fair value changes on financial assets at FVOCI - net of tax (138,993) 360,553 202,768
561,557 (3,854,416) 1,404,070 29,714,143 (9,329,870) (10,617,908)
TOTAL COMPREHENSIVE INCOME (LOSS) $23,340,448 ($22,525,082) $38,164,392
Total Comprehensive Income (Loss) Attributable to:
Equity holders of the Parent Company $23,927,179 ($16,161,173) $37,972,252 Non-controlling interests (586,731) (6,363,909) 192,140 $23,340,448 ($22,525,082) $38,164,392 See accompanying Notes to Consolidated Financial Statements.
Integrated mIcro-electronIcs, Inc.
40 Years of manufacturing technology and Innovation 40 Years of manufacturing technology and Innovation
2020 Integrated rePort
90 91

A
ttri
bu
tab
le t
o E
qu
ity H
old
ers
of
the P
are
nt
Co
mp
an
y
Oth
er
Co
mp
reh
ensi
ve Inco
me (
Lo
ss)
.
Cap
ital S
tock -
C
om
mo
n
(No
te 1
9)
Su
bsc
rib
ed
C
ap
ital
Sto
ck
(No
te 1
9)
Ad
dit
ion
al
Paid
-in
Cap
ital
(No
te 1
9)
Su
bsc
rip
tio
ns
Receiv
ab
le
(No
tes
19
an
d 2
8)
Reta
ined
E
arn
ing
s (N
ote
s 2
an
d 1
9)
Tre
asu
ry
Sto
ck
(No
te 1
9)
Oth
er
Co
mp
on
en
ts
of
Eq
uit
y
(No
te 1
3)
Cum
ula
tive
Tra
nsl
ati
on
A
dju
stm
en
t (N
ote
19
)
Rem
easu
rem
en
t lo
sses
on
d
efi
ned
ben
efi
t p
lan
s (N
ote
27
)
Att
rib
uta
ble
to
E
qu
ity H
old
ers
o
f th
e P
are
nt
Co
mp
an
y
(No
te 1
9)
Att
rib
uta
ble
to
N
on-c
on
tro
llin
g
Inte
rest
s
(No
te 1
9)
To
tal
Bala
nces
at
Jan
uary
1, 2
019
$
42,6
48
,04
2
$8
15,1
98
$
146
,513
,26
4($
3,4
02,9
40
) $
23
6,2
89
,815
($
1,0
12,5
88
) ($
1,0
96
,36
4)
($12
,89
4,2
91)
($
6,2
35
,79
4)
$4
01,
62
4,3
42
$4
,811
,99
4
$4
06
,43
6,3
36
E
ffe
ct
of
fin
alizati
on
of
busi
ness
co
mb
inati
on
(N
ote
2)
–
– –
– 1,6
80
,38
6
– –
(26
2,5
26
) –
1,4
17,8
60
2,7
80
,84
9
4,1
98
,70
9
Bala
nces
at
Jan
uary
1, 2
019
,
as
rest
ate
d
42,6
48
,04
2
815
,19
8
146
,513
,26
4(3
,40
2,9
40
) 23
7,9
70
,20
1 (1
,012
,58
8)
(1,0
96
,36
4)
(13,15
6,8
17)
(6,2
35
,79
4)
40
3,0
42,2
02
7,5
92,8
43
410
,635
,04
5
Issu
ed
sh
are
s d
uri
ng
th
e
year
25
,98
5
(25
,98
5)
––
– –
– –
– –
– –
Issu
an
ce o
f p
refe
rred
sh
are
s (N
ote
19
) –
– –
– –
– –
– –
– 10
0,0
00
,00
0
100
,00
0,0
00
C
olle
cti
on
s o
n s
ub
scri
pti
on
s –
– –
105
,54
1 –
– –
– –
105
,54
1 –
105
,54
1 F
orf
eit
ure
s d
uri
ng
th
e y
ear
–
(36
,65
3)
(30
5,1
65)
34
1,8
18
– –
– –
– –
– –
Cash
div
iden
ds
–
– –
– (4
,43
6,7
07)
– –
– –
(4,4
36
,70
7)
– (4
,43
6,7
07)
4
2,6
74
,027
75
2,5
60
14
6,2
08
,09
9(2
,95
5,5
81)
23
3,5
33
,49
4
(1,0
12,5
88
) (1
,09
6,3
64
) (1
3,15
6,8
17)
(6,2
35
,79
4)
39
8,7
11,0
36
10
7,5
92,8
43
50
6,3
03
,879
N
et
loss
–
– –
– (7
,78
0,6
48
) –
– –
– (7
,78
0,6
48
) (5
,414
,56
4)
(13
,19
5,2
12)
Oth
er
co
mp
reh
en
sive
inco
me (
loss
) –
– –
– –
– 36
0,5
53
(4,5
26
,10
9)
(4,2
14,9
69
) (8
,38
0,5
25
) (9
49
,34
5)
(9,3
29
,87
0)
To
tal co
mp
reh
en
siv
e
inco
me (
loss
) –
– –
– (7
,78
0,6
48
) –
36
0,5
53
(4,5
26
,10
9)
(4,2
14,9
69
) (1
6,16
1,17
3)
(6,3
63
,90
9)
(22,5
25
,08
2)
Bala
nces
at
Decem
ber
31,
20
19
$4
2,6
74
,027
$
75
2,5
60
$
146
,20
8,0
99
($2
,95
5,5
81)
$
22
5,7
52,8
46
($
1,0
12,5
88
) ($
73
5,8
11)
($17
,68
2,9
26
) ($
10,4
50
,76
3)
$38
2,5
49
,86
3
$10
1,22
8,9
34
$
48
3,7
78
,79
7
See a
cco
mp
an
yin
g N
ote
s to
Co
nso
lidate
d F
inan
cial S
tate
men
ts.
InT
EG
RA
TE
D M
ICR
O-E
LE
CT
RO
nIC
S, In
C. A
nD
SU
BS
IDIA
RIE
S
Co
nS
ol
ida
te
d S
ta
te
Me
nt
S o
f C
Ha
ng
eS
in
eQ
uit
y
InT
EG
RA
TE
D M
ICR
O-E
LE
CT
RO
nIC
S, In
C. A
nD
SU
BS
IDIA
RIE
S
Co
nS
ol
ida
te
d S
ta
te
Me
nt
S o
f C
Ha
ng
eS
in
eQ
uit
y
FO
R T
HE
YE
AR
S E
ND
ED
DE
CE
MB
ER
31,
20
20
, 20
19 A
ND
20
18
FO
R T
HE
YE
AR
S E
ND
ED
DE
CE
MB
ER
31,
20
20
, 20
19 A
ND
20
18
INT
EG
RA
TE
D M
ICR
O-E
LE
CT
RO
NIC
S, IN
C. A
ND
SU
BS
IDIA
RIE
S
CO
NS
OL
IDA
TE
D S
TA
TE
ME
NT
S O
F C
HA
NG
ES
IN
EQ
UIT
Y
FO
R T
HE
YE
AR
S E
ND
ED
DE
CE
MB
ER
31, 2
020
, 20
19 A
ND
20
18
A
ttri
bu
tab
le t
o E
quit
y H
old
ers
of
the P
are
nt
Co
mp
an
y
O
ther
Co
mp
reh
en
sive In
co
me
(L
oss
)
Cap
ital S
tock-
Co
mm
on
(N
ote
19
)
Su
bsc
rib
ed
C
ap
ital
Sto
ck
(No
te 1
9)
Ad
dit
ion
al
Paid
-in
C
ap
ital
(No
te 1
9)
Su
bsc
rip
tio
ns
Receiv
ab
le
(No
tes
19
an
d 2
8)
Reta
ined
E
arn
ing
s (N
ote
s 2
an
d 1
9)
Tre
asu
ry
Sto
ck
(No
te 1
9)
Oth
er
Co
mp
on
en
ts
of
Eq
uit
y
(No
te 1
3)
Cu
mu
lati
ve
Tra
nsl
ati
on
A
dju
stm
en
t (N
ote
19
)
Rem
easu
rem
en
t lo
sses
on
d
efin
ed
ben
efi
t p
lan
s (N
ote
27
)
Att
rib
uta
ble
to
E
qu
ity H
old
ers
o
f th
e P
are
nt
Co
mp
an
y
(No
te 1
9)
Att
rib
uta
ble
to
N
on
-co
ntr
olli
ng
In
tere
sts
(No
te 1
9)
To
tal
Bala
nces
at
Jan
uary
1, 2
02
0
$4
2,6
74
,027
$
75
2,5
60
$
146
,20
8,0
99
($
2,9
55
,58
1)
$2
25
,75
2,8
46
($
1,0
12,5
88
)($
73
5,8
11)
($17
,68
2,9
26
) ($
10,4
50
,76
3)
$3
82,5
49
,86
3
$10
1,2
28
,93
4
$4
83
,778
,79
7
Issu
ed
sh
are
s d
uri
ng
th
e
year
90
3
(90
3)
– –
– –
– –
– –
– –
Red
em
pti
on
of
pre
ferr
ed
sh
are
s –
– –
– –
– –
– –
– (3
0,0
00
,00
0)
(30
,00
0,0
00
) R
efu
nd
on
su
bsc
rip
tio
ns
–
– –
(5,0
23
) –
– –
– –
(5,0
23
) –
(5,0
23
) F
orf
eit
ure
s d
uri
ng
th
e y
ear
–
(6,8
34
) (6
4,9
70
) 71,
80
4
– –
– –
– –
– –
Dilu
tio
n o
f o
wners
hip
in
tere
st in
a s
ub
sid
iary
–
– 3
2,3
97,6
10
– –
– –
– –
32
,39
7,6
10
62,5
26
,03
5
94
,92
3,6
45
D
ere
co
gn
itio
n o
f p
ut
op
tio
n
fin
ancia
l lia
bili
ty
–
– 15
,32
8,9
45
–
– –
– –
– 15
,328
,94
5
– 15
,328
,94
5
Cash
div
iden
ds
–
– –
– (6
,50
4,0
83
) –
– –
–
(6,5
04
,08
3)
– (6
,50
4,0
83)
4
2,6
74
,93
0
74
4,8
23
19
3,8
69
,68
4
(2,8
88
,80
0)
219
,24
8,7
63
(1
,012
,58
8)
(73
5,8
11)
(17,6
82,9
26
) (1
0,4
50
,76
3)
423
,76
7,3
12
133,7
54
,96
9
55
7,5
22
,28
1 N
et
loss
–
–
– –
(3,4
55
,073
) –
– –
– (3
,45
5,0
73
) (2
,918
,622
) (6
,37
3,6
95)
Oth
er
co
mp
reh
en
sive
inco
me (
loss
) –
– –
– –
– (1
38
,99
3)
26
,82
0,6
95
70
0,5
50
27,3
82
,25
2
2,3
31,8
91
29
,714
,14
3
To
tal co
mp
reh
en
sive
inco
me (
loss
) –
– –
– (3
,45
5,0
73
) –
(13
8,9
93
) 26
,82
0,6
95
70
0,5
50
2
3,9
27,1
79
(5
86
,73
1)
23
,34
0,4
48
B
ala
nces
at
De
cem
ber
31,
2
02
0
$4
2,6
74
,93
0
$74
4,8
23
$19
3,8
69
,68
4
($2
,88
8,8
00
) $
215
,79
3,6
90
($
1,0
12,5
88
)($
874
,80
4)
$9
,13
7,7
69
($
9,7
50
,213
) $
44
7,6
94
,49
1 $
133
,16
8,2
38
$
58
0,8
62,7
29
See a
cco
mp
an
yin
g N
ote
s to
Co
nso
lidate
d F
inan
cial S
tate
men
ts.
Integrated mIcro-electronIcs, Inc.
40 Years of manufacturing technology and Innovation 40 Years of manufacturing technology and Innovation
2020 Integrated rePort
92 93

Att
rib
uta
ble
to
Eq
uit
y H
old
ers
of
the P
are
nt
Co
mp
an
y
Oth
er
Co
mp
reh
en
sive
In
co
me (
Lo
ss)
.
Cap
ital S
tock -
C
om
mo
n
(No
te 1
9)
Su
bsc
rib
ed
C
ap
ital
Sto
ck
(No
te 1
9)
Ad
dit
ional
Paid
-in
Cap
ital
(No
te 1
9)
Su
bsc
rip
tio
ns
Receiv
ab
le
(No
tes
19
and
28
)
Reta
ined
E
arn
ing
s (N
ote
19
)
Tre
asu
ry
Sto
ck
(No
te 1
9)
Oth
er
Co
mp
on
en
ts
of
Eq
uit
y
(No
te 1
3)
Cu
mu
lati
ve
T
ran
slati
on
A
dju
stm
en
t
Rem
easu
rem
en
t lo
sses
on
d
efi
ned
bene
fit
pla
ns
(No
te 2
7)
Att
rib
uta
ble
to
E
qu
ity H
old
ers
o
f th
e P
are
nt
Co
mp
an
y
(No
te 1
9)
Att
rib
uta
ble
to
No
n-
co
ntr
olli
ng
In
tere
sts
(No
te 2
) T
ota
l B
ala
nces
at
Jan
uary
1, 2
018
$
35
,70
9,6
79
$
1,0
58
,27
8
$5
8,1
21,
26
6
($5
,35
1,8
44
) $
194
,49
9,5
40
($
1,0
12,5
88
) $
454
,45
7
($2,5
37
,68
6)
($7
,43
7,0
96
) $
27
3,5
04
,00
6
$3
,09
0,5
93
$
27
6,5
94
,59
9
Cu
mu
lati
ve c
atc
h-u
p
ad
just
men
t d
ue t
o a
do
pti
on
o
f P
FR
S 9
and
15
–
– –
– 6
,413
,47
0
– (1
,753
,58
9)
– –
4,6
59
,88
1 29
5,5
22
4,9
55
,40
3
Bala
nces
at
Jan
uary
1, 2
018
, ad
just
ed
3
5,7
09
,67
9
1,0
58
,27
8
58
,121,
26
6
(5,3
51,
84
4)
20
0,9
13,0
10
(1,0
12,5
88
) (1
,29
9,1
32
) (2
,53
7,6
86
) (7
,43
7,0
96
) 27
8,1
63
,88
7
3,3
86
,115
28
1,5
50
,00
2
Issu
ed
sh
are
s d
uri
ng
th
e y
ear
220
,513
(2
20
,513
) –
– –
– –
– –
–
–
–
Issu
ed
sh
are
s fr
om
sto
ck r
igh
ts
off
er
6,7
17,8
50
–
89
,213
,052
– –
– –
– –
95
,93
0,9
02
– 9
5,9
30
,90
2
Tra
nsa
cti
on
co
sts
on
sh
are
s is
suan
ce
– –
(66
0,8
53)
– –
– –
– –
(66
0,8
53
) –
(66
0,8
53)
Co
st o
f sh
are
-base
d p
aym
en
ts
(No
te 2
8)
– –
29
,58
9
– –
– –
– –
29
,58
9
– 29
,58
9
Co
llecti
on
s o
n s
ub
scri
pti
on
s –
1,73
6,5
47
– –
– –
– 1,73
6,5
47
– 1,
73
6,5
47
Fo
rfeit
ure
s d
uri
ng
th
e y
ear
– (2
2,5
67)
(18
9,7
90
) 212
,35
7
– –
– –
– –
– –
Incre
ase
in
no
n-c
on
tro
llin
g
inte
rest
du
e t
o a
cq
uis
itio
n
of
a s
ub
sid
iary
du
rin
g t
he
year
(No
te 2
) –
– –
– –
– –
– –
–
4,0
65
,56
2
4,0
65
,56
2
Eff
ect
of
fin
alizati
on
of
bu
sin
ess
co
mb
inati
on
–
– –
– –
– –
– –
–
(50
,97
4)
(50
,97
4)
Cash
div
iden
ds
–
– –
– (1
0,1
30
,122
) –
– –
– (1
0,1
30
,122
) –
(10
,13
0,122)
4
2,6
48
,04
2
815
,19
8
146
,513
,26
4
(3,4
02
,94
0)
190
,78
2,8
88
(1
,012
,58
8)
(1
,29
9,1
32
) (2
,53
7,6
86
) (7
,43
7,0
96
) 3
65
,06
9,9
50
7,4
00
,70
3
37
2,4
70
,65
3
Net
inco
me, as
pre
vio
usl
y
state
d
– –
– –
45
,50
6,9
27
– –
– –
45
,50
6,9
27
2,3
44
,129
4
7,8
51,0
56
E
ffe
ct
of
fin
alizati
on
of
bu
sin
ess
co
mb
inati
on
(N
ote
2)
– –
– –
1,6
80
,38
6
– –
– –
1,6
80
,38
6
(74
9,1
42
) 9
31,
24
4
Net
inco
me, as
rest
ate
d
– –
– –
47,1
87
,313
–
– –
– 4
7,1
87,3
13
1,5
94
,98
7
48
,78
2,3
00
O
ther
co
mp
reh
en
sive in
co
me
(l
oss
), a
s p
revio
usl
y s
tate
d
– –
– –
– –
20
2,7
68
(1
0,3
56
,60
5)
1,2
01,3
02
(8,9
52
,53
5)
(1,4
02,8
47)
(10
,35
5,3
82)
Eff
ect
of
fin
alizati
on
of
bu
sin
ess
co
mb
inati
on
(N
ote
2)
– –
– –
– –
–
(26
2,5
26
) –
(26
2,5
26
) –
(26
2,5
26
) O
ther
co
mp
reh
en
sive in
co
me
(l
oss
) –
– –
– –
– 20
2,7
68
(1
0,6
19,1
31)
1,2
01,3
02
(9,2
15,0
61)
(1
,40
2,8
47)
(10
,617
,90
8)
To
tal co
mp
reh
en
siv
e in
co
me
(lo
ss)
– –
– –
47,1
87,3
13
– 20
2,7
68
(1
0,6
19,13
1)
1,2
01,3
02
37,9
72,2
52
192,1
40
3
8,16
4,3
92
Bala
nces
at
Decem
ber
31,
20
18,
as
rest
ate
d
$4
2,6
48
,04
2
$8
15,1
98
$
146
,513
,26
4
($3
,40
2,9
40
) $
23
7,9
70
,20
1 ($
1,0
12,5
88
) ($
1,0
96
,36
4)
($13
,15
6,8
17)
($6
,23
5,7
94
) $
40
3,0
42,2
02
$
7,5
92,8
43
$
410
,63
5,0
45
S
ee a
cco
mp
an
yin
g N
ote
s to
Co
nso
lidate
d F
inan
cial S
tate
men
ts.
InT
EG
RA
TE
D M
ICR
O-E
LE
CT
RO
nIC
S, In
C. A
nD
SU
BS
IDIA
RIE
S
Co
nS
ol
ida
te
d S
ta
te
Me
nt
S o
f C
Ha
ng
eS
in
eQ
uit
yF
OR
TH
E Y
EA
RS
EN
DE
D D
EC
EM
BE
R 3
1, 2
020
, 20
19 A
ND
20
18InTEGRATED MICRO-ELECTROnICS, InC. AnD SUBSIDIARIES
ConSolidated StateMentS of CaSH flowS
INTEGRATED MICRO-ELECTRONICS, INC. AND SUBSIDIARIES CONSOLIDATED STATEMENTS OF CASH FLOWS Years Ended December 31 2020 2019 2018
CASH FLOWS FROM OPERATING ACTIVITIES Income (loss) before income tax ($1,448,274) ($11,204,777) $56,824,642 Adjustments for: Depreciation of property, plant and
equipment (Notes 10, 20, and 21) 38,158,147 35,308,020 31,097,283 Amortization of right-of-use asset (Notes 20, 21 and 30) 9,395,254 6,955,732 – Interest expense on loans (Note 23) 8,411,717 10,262,423 10,566,675 Amortization of intangible assets (Notes 12, 20 and 21) 7,879,168 6,464,921 6,440,284 Impairment loss on product development
cost (Note 24) 4,693,985 – – Unrealized foreign exchange losses - net 3,723,227 1,106,924 4,460,835 Impairment of property, plant and
equipment (Note 24) 2,620,779 – – Interest expense on lease liabilities (Note 23) 1,644,189 1,368,494 –
Loss (gain) on derivative transactions (Note 33)
92,122
(15,373) (152,368)
Gain on sale of property, plant and equipment (Notes 10 and 24) (657,101) (99,404) (189,298)
Interest income (Note 5) (330,682) (860,775) (998,995) Mark-to-market loss (gain) on put options
(Notes 18 and 24) (6,068,906) (3,445,288) 5,372,114 Reversal of contingent consideration
(Notes 18 and 24) – (3,728,985) (21,304,030) Net gain on disposal of a subsidiary (Note 24) – – (19,062,344) Impairment loss on goodwill (Notes 11 and 24) – – 6,902,838 Gain from bargain purchase (Notes 2 and 24) – – (2,411,951) Cost of share-based payments (Note 28) – – 29,589 Operating income before working capital
changes 68,113,625 42,111,912 77,575,274 Changes in operating assets and liabilities: Decrease (increase) in: Receivables 21,328,413 13,411,173 (46,398,064) Inventories 13,873,495 38,984,113 (36,441,769) Contract assets 4,382,722 4,576,071 (16,364,351) Other current assets (5,446,059) 1,719,633 5,871,820 Increase (decrease) in: Accounts payable and accrued expenses (7,405,255) (16,870,412) 30,969,749 Contract liabilities (3,227,075) 2,911,110 (3,794,787) Retirement liabilities 487,307 717,179 549,433 Advances from customers – – (1,843,501) Net cash generated from operations 92,107,173 87,560,779 10,123,804 Interest paid (9,954,398) (9,915,877) (9,624,264) Income tax paid (4,587,114) (7,368,934) (8,028,054) Interest received 330,682 860,775 998,995 Net cash provided by (used in) operating
activities 77,896,343 71,136,743 (6,529,519)
(Forward)
Integrated mIcro-electronIcs, Inc.
40 Years of manufacturing technology and Innovation 40 Years of manufacturing technology and Innovation
2020 Integrated rePort
94 95

InTEGRATED MICRO-ELECTROnICS, InC. AnD SUBSIDIARIES
noteS to ConSolidated finanCial StateMentS
Years Ended December 31 2020 2019 2018
CASH FLOWS FROM INVESTING ACTIVITIES Acquisitions of: Property, plant and equipment (Note 10) ($18,121,100) ($37,398,057) ($63,822,429) Intangible assets (Note 12) (595,188) (1,388,481) (1,139,531) Proceeds from sale and retirement of property,
plant and equipment 1,529,412 862,996 3,136,331 Decrease (increase) in other noncurrent assets 4,130,406 (6,227,538) (13,879,679) Capitalized product development costs,
excluding depreciation (Notes 10 and 12) – (2,520,866) (3,476,821) Acquisition through business combination, net
of cash acquired (Note 2) – – (1,558,227) Increase (decrease) in deposits from a third
party – (11,540,911) (9,231,423) Net cash used in investing activities (13,056,470) (58,212,857) (89,971,779)
CASH FLOWS FROM FINANCING ACTIVITIES Proceeds from: Net proceeds from subsidiary’s public
offering (Note 19) 106,787,500 – – Availments of loans payable
and long-term debt 82,665,635 12,002,758 66,879,877 Stock rights offering (Note 19) – – 95,930,902 Payments of: (Note 35) Loans payable (4,974,751) (20,540,547) (35,152,844) Long-term debt (108,497,471) (46,510,457) (6,710,439) Lease liabilities (Note 30) (10,799,326) (7,603,732) – Dividends paid to preference shareholders
of a subsidiary (Note 19) (6,504,083) – – Dividends paid to common equity holders of
the Parent Company (Note 19) – (4,436,707) (10,130,122) Issuance (redemption) of preferred shares of a subsidiary to non-controlling interest (Note 19) (30,000,000) 100,000,000 – Increase (decrease) in noncurrent liabilities 1,640,002 (1,626,646) 1,949,887 Collections (refund) of subscriptions receivable
(Note 19) (5,023) 105,541 1,736,547 Settlement of derivatives (Note 33) (5,321) 13,555 112,675 Net cash provided by financing activities 30,307,162 31,403,765 114,616,483
EFFECT OF CHANGES IN FOREIGN EXCHANGE RATES ON CASH AND CASH EQUIVALENTS (3,451,726) (201,876) (208,072)
NET INCREASE IN CASH AND CASH EQUIVALENTS 91,695,309 44,125,775 17,907,113
CASH AND CASH EQUIVALENTS AT BEGINNING OF YEAR 152,660,116 108,534,341 90,627,228
CASH AND CASH EQUIVALENTS AT END OF YEAR (Note 5) $244,355,425 $152,660,116 $108,534,341
See accompanying Notes to Consolidated Financial Statements.
INTEGRATED MICRO-ELECTRONICS, INC. AND SUBSIDIARIES NOTES TO CONSOLIDATED FINANCIAL STATEMENTS 1. Corporate Information
Integrated Micro-Electronics, Inc. (IMI or the Parent Company), a stock corporation organized and registered under the laws of the Republic of the Philippines on August 8, 1980, has four wholly-owned subsidiaries, namely: IMI International (Singapore) Pte. Ltd. (IMI Singapore), IMI USA, Inc. (IMI USA), IMI Japan, Inc. (IMI Japan) and PSi Technologies, Inc. (PSi) (collectively referred to as the Group). The Parent Company is 52.03% owned by AC Industrial Technology Holdings, Inc. (AC Industrials), a wholly-owned subsidiary of Ayala Corporation (AC), a corporation incorporated in the Republic of the Philippines and listed in the Philippine Stock Exchange (PSE). AC is 47.28% owned by Mermac, Inc. (Ultimate Parent Company) and the rest by the public.
The registered office address of the Parent Company is at North Science Avenue, Laguna Technopark- Special Economic Zone (LT-SEZ), Bo. Biñan, Biñan, Laguna.
The Parent Company was listed by way of introduction in the PSE on January 21, 2010. It has completed its follow-on offering and listing of 215,000,000 common shares on December 5, 2014. On March 2, 2018, the Parent Company completed the stock rights offer and listing of 350,000,000 common shares to all eligible stockholders.
The Parent Company is registered with the Philippine Economic Zone Authority (PEZA) as an exporter of printed circuit board assemblies (PCBA), flip chip assemblies, electronic sub-assemblies, box build products and enclosure systems. It also provides the following solutions: product design and development, test and systems development, automation, advanced manufacturing engineering, and power module assembly, among others. It serves diversified markets that include those in the automotive, industrial, medical, storage device, and consumer electronics industries, and non-electronic products (including among others, automobiles, motorcycles, solar panels) or parts, components or materials of non-electronic products, as well as to perform and provide information technology services such as but not limited to data labeling/encoding or image annotation services.
IMI Singapore is a strategic management, investment and holding entity that owns operating subsidiaries of the Group and was incorporated and domiciled in Singapore. Its wholly-owned subsidiary, Speedy-Tech Electronics Ltd. (STEL), was incorporated and domiciled also in Singapore. STEL, on its own, has subsidiaries located in Hong Kong and China. STEL and its subsidiaries (collectively referred to as the STEL Group) are principally engaged in the provision of electronic manufacturing services (EMS) and power electronics solutions to original equipment manufacturers (OEMs) in the automotive, consumer electronics, telecommunications, industrial equipment, and medical device sectors, among others.
In 2011, the Parent Company, through its indirect subsidiary, Cooperatief IMI Europe U.A. (Cooperatief) acquired Integrated Micro-Electronics Bulgaria EOOD (formerly EPIQ Electronic Assembly EOOD) (IMI BG), Integrated Micro-Electronics Czech Republic s.r.o. (formerly EPIQ CZ s.r.o.) (IMI CZ) and Integrated Micro-Electronics Mexico, S.A.P.I. de C.V. (formerly EPIQ MX, S.A.P.I. de C.V.) (IMI MX) (collectively referred to as the IMI EU/MX Subsidiaries). IMI EU/MX Subsidiaries design and produce PCBA, engage in plastic injection, embedded toolshop, supply assembled and tested systems and sub-systems which include drive and control elements for automotive equipment, household appliances, and industrial equipment, among others. IMI EU/MX Subsidiaries also provide engineering, test and system development and logistics management services.
In 2016, Cooperatief acquired a 76.01% ownership interest in VIA Optronics GmbH (VIA), a Germany-based company with operations in Germany and China and sales offices in the USA and Taiwan. VIA is a leading provider of enhanced display solutions for multiple end markets in which superior functionality or durability is a critical differentiating factor. The acquisition allows the Group to strengthen its partnerships with customers by offering complementary automotive camera and display monitor solutions for advanced driver assistance systems. The Group together with VIA enables the scale to introduce patented technology into automotive camera monitor systems for increased safety.
In 2018, VIA acquired 65% ownership interest in VTS-Touchsensor Co., Ltd. (VTS), a Japanese entity that develops and manufactures metal mesh touch sensor technologies and electrode base film.
In 2019, VIA formed VIA Optronics AG (VIA AG) by way of a contribution in kind against issuance of new shares making VIA AG the sole shareholder of VIA Optronics GmbH. The contribution in kind and resulting re-organization was recognized as a business combination under common control. In the same year, VIA Optronics (Taiwan) Ltd was also founded as a new subsidiary with the purpose of conducting sales activities.
Integrated mIcro-electronIcs, Inc.
40 Years of manufacturing technology and Innovation 40 Years of manufacturing technology and Innovation
2020 Integrated rePort
96 97

In 2020, VIA raised some proceeds through an initial public offering (IPO) and was listed on the New York Stock Exchange under the ticker symbol “VIAO”. As a result of the IPO, IMI’s ownership interest in VIA was diluted from 76.01% to 50.32% (see Note 19).
In 2018, the Group opened its 21st manufacturing site in Niš, Republic of Serbia in line with the IMI’s strategy to strengthen its global footprint and support the growing market for automotive components in the European region.
IMI France serves as a support entity which provides manufacturing support services, market research and analysis, sales promotional activity support, strategic planning advisory, and general corporate marketing support.
In 2017, IMI, through its indirect subsidiary Integrated Micro-electronics UK Limited (IMI UK), acquired an 80% stake in Surface Technology International Enterprises Limited (STI), an EMS company based in the United Kingdom (UK). STI has factories in the UK and Cebu, Philippines. STI provides electronics design and manufacturing solutions in both PCBA and full box-build manufacturing for high-reliability industries. The acquisition of STI strengthens the Group’s industrial and automotive manufacturing competencies, broaden its customer base, and also provides access to the UK market. Further, the partnership allows the Group’s entry into the aerospace, security and defense sectors.
IMI USA acts as direct support to the Group’s customers by providing program management, customer service, engineering development and prototype manufacturing services to customers, especially for processes using direct die attach to various electronics substrates. It specializes in prototyping low to medium PCBA and sub-assembly and is at the forefront of technology with regard to precision assembly capabilities including, but not limited to, surface mount technology (SMT), chip on flex, chip on board and flip chip on flex. IMI USA is also engaged in advanced manufacturing process development, engineering development, prototype manufacturing and small precision assemblies.
IMI Japan was registered and is domiciled in Japan to serve as IMI’s front-end design and product development and sales support center. IMI Japan was established to attract more Japanese OEMs to outsource their product development to IMI.
PSi is a power semiconductor assembly and test services company serving niche markets in the global power semiconductor market. PSi provides comprehensive package design, assembly and test services for power semiconductors used in various electronic devices.
The consolidated financial statements as of December 31, 2020 and 2019 and for each of the three years in the period ended December 31, 2020 were endorsed for approval by the Audit Committee on February 22, 2021 and authorized for issue by the Parent Company’s Board of Directors (BOD) on March 2, 2021.
2. Group Information
Information about Subsidiaries The consolidated financial statements include the financial statements of the Parent Company and the following subsidiaries:
Percentage of
Ownership Country of Subsidiary 2020 2019 Incorporation Functional Currency IMI International (Singapore) Pte. Ltd. 100.00% 100.00% Singapore United States Dollar (USD)
IMI International ROHQ 100.00% 100.00% Philippines USD Speedy-Tech Electronics Ltd. (STEL) Group 100.00% 100.00% Singapore USD
IMI (Chengdu) Ltd. (IMICD) 100.00% 100.00% China Renminbi (RMB) IMI Technology (Shenzhen) Co. Ltd. (IMI SZ) 100.00% 100.00% China USD IMI Smart Technology (Shenzhen) Co. Ltd. a 100.00% 100.00% China RMB Speedy-Tech Electronics (HK) Limited (STHK) 100.00% 100.00% Hong Kong USD Speedy-Tech Electronics (Jiaxing)
Co., Ltd. (STJX) 100.00% 100.00% China RMB Speedy-Tech (Philippines), Inc. (STPH) 100.00% 100.00% Philippines USD
Cooperatief IMI Europe U.A. 100.00% 100.00% Netherlands Euro (EUR) Integrated Micro-Electronics Bulgaria EOOD 100.00% 100.00% Bulgaria EUR
Microenergia EOOD (Microenergia) 100.00% 100.00% Bulgaria Bulgarian Lev (BGN) Integrated Micro-Electronics d.o.o. Niš (IMI Serbia) 100.00% 100.00% Serbia Serbian Dinar (RSD) Integrated Micro-Electronics Czech Republic s.r.o. 100.00% 100.00% Czech Republic EUR Integrated Micro-Electronics Mexico, S.A.P.I. de C.V. 100.00% 100.00% Mexico USD IMI France SAS (IMI France) 100.00% 100.00% France EUR VIA Optronics AG (VIA) b/c 50.32% 76.01% Germany EUR
VIA Optronics GmbH (VIA) 100.00% 100.00% Germany EUR VIA Optronics Suzhou Co. Ltd. (VIA Suzhou) 100.00% 100.00% China RMB VIA Optronics LLC (VIA LLC) 100.00% 100.00% USA USD VIA Optronics (Taiwan) Ltd b 100.00% 100.00% Taiwan Taiwan Dollar VTS-Touchsensor Co., Ltd. (VTS) 65.00% 65.00% Japan Japanese Yen (JPY)
(Forward)
Percentage of
Ownership Country of Subsidiary 2020 2019 Incorporation Functional Currency
Integrated Micro-Electronics UK Limited (IMI UK) 100.00% 100.00% United Kingdom British Pounds (GBP) Surface Technology International Enterprises Ltd (STI) 80.00% 80.00% United Kingdom GBP
STI Limited 100.00% 100.00% United Kingdom GBP STI Philippines Inc. (STIPH) 100.00% 100.00% Philippines USD STI Asia Ltd d 100.00% 100.00% Hong Kong Hong Kong Dollar (HKD) STI Supplychain Ltd d 100.00% 100.00% United Kingdom GBP ST Intercept Limited 100.00% 100.00% United Kingdom GBP
IMI USA 100.00% 100.00% USA USD IMI Japan 100.00% 100.00% Japan USD PSi 100.00% 100.00% Philippines USD
PSiTech Realty, Inc. (PSiTech Realty) d 40.00% 40.00% Philippines USD Pacsem Realty, Inc. (Pacsem Realty) d 64.00% 64.00% Philippines USD
a New subsidiary under IMI SZ incorporated in 2019 as a spin-off of the Kuichong operations b New entities of VIA in 2019 c IMI’s ownership in VIA was diluted to 50.32% as a result of the initial public offering of VIA in the New York Stock Exchange (NYSE) d In the process of liquidation
Business Combinations Acquisition of VTS-Touchsensor Co., Ltd. (VTS) On April 9, 2018, VIA and Toppan Printing Co., Ltd. (Toppan) entered into an agreement to serve the market for copper-based metal mesh touch sensors. The agreement provides that Toppan transfer 65% of its shares in VTS to VIA. VTS is a newly formed spin-off company of Toppan.
VTS develops and manufactures the metal mesh touch sensors in Japan on the existing premises of Toppan. The new setup strengthens VIA’s portfolio of differentiated and value-added sensor technology for touch panels, touch-display modules, display head assemblies, and interactive display systems across multiple markets and segments.
The Group elected to measure the non-controlling interest in VTS at the proportionate share of its interest in the acquiree’s identifiable net assets.
The net assets recognized in December 31, 2018 financial statements were based on a provisional assessment of their fair value. The valuation had not been completed by the date the 2018 financial statements were approved for issue by the Board of Directors. In March 2019, the purchase price allocation was finalized. The fair value of the property, plant and equipment (PPE) and intangible asset increased by $7.16 million and $2.58 million, respectively (see Notes 10 and 12). The increase in fair value of PPE arose from the assessment and valuation mainly of technical equipment and machinery, buildings and improvements and other equipment, which was determined using current replacement cost method. The increase in intangible asset is due to the identification and valuation of customer relationship as a separate asset with fair value determined using the Multi Period Excess Earnings Method (MEEM). PPE was depreciated using various useful lives ranging from 3-10 years while the customer relationship is amortized over a period of 5 years. As a result, deferred tax liability on the increase in fair value of the property, plant and equipment and intangible asset was recognized amounting to $3.32 million. There was also corresponding recognition of gain on a bargain purchase amounting to $2.41 million upon finalization and the provisional goodwill amounting to $0.97 million was reversed. In addition, additional depreciation and amortization from increase in fair values of property and equipment and intangible assets net of share of non-controlling interest totaling to $0.73 million was recognized in 2018. Below are the final fair values and provisional fair values as of December 31, 2019:
Fair Values Provisional Fair Values
Assets Receivables $184,781 $184,781 Inventories 1,338,391 1,243,686 Property, plant and equipment (Note 10) 7,252,918 97,536 Intangible assets (Note 12) 7,835,218 5,258,211 16,611,308 6,784,214 Liabilities Deferred tax liabilities 3,321,558 – Other noncurrent liabilities 5,254,010 5,254,010 8,575,568 5,254,010 Net Assets $8,035,740 $1,530,204 Non-controlling interest (35%) (4,065,562) (535,571) Goodwill (Gain on a bargain purchase) (Note 11) (2,411,951) 970,725 Cost of acquisition $1,558,227 $1,965,358
Integrated mIcro-electronIcs, Inc.
40 Years of manufacturing technology and Innovation 40 Years of manufacturing technology and Innovation
2020 Integrated rePort
98 99

The 2018 comparative information was restated to reflect the adjustments to the provisional amounts. The effects of the restatement on the consolidated financial statements as of December 31, 2018 are as follows: Consolidated Balance Sheet
Increase (decrease) after depreciation and amortization:
Receivables $407,131 Inventories (2,204) Property, plant and equipment 5,086,344 Goodwill (918,412) Intangible assets 2,031,774 Deferred tax liabilities 2,405,924 Retained earnings 1,680,386 Cumulative translation adjustment (262,526) Non-controlling interests in balance sheet 2,780,849
Consolidated Statement of Income
Increase (decrease) in: Cost of sales $1,820,635 Operating expenses 416,083 Gain from bargain purchase 2,411,951 Deferred tax benefit 756,011 Non-controlling interest in net income (749,142)
Consolidated Statement of Cash Flow
Increase (decrease) in: Cash flow from operating activities ($407,131) Cash flow from investing activities 407,131
Analysis of cash flows on acquisition:
Initial purchase consideration $1,965,358 Purchase price adjustment related to inventory (407,131) Cost of acquisition $1,558,227
From the date of acquisition, VTS contributed $26.46 million of revenue and $0.95 million profit before tax to the Group in 2018. Acquisition-related costs, which consist of professional and legal fees, travel and recruitment services amounting to $1.47 million were recognized as expense in 2018.
3. Summary of Significant Accounting and Financial Reporting Policies
Basis of Preparation The accompanying consolidated financial statements of the Group have been prepared on a historical cost basis, except for financial assets and liabilities at fair value through profit or loss (FVPL) and financial assets at fair value through other comprehensive income (FVOCI). The consolidated financial statements are presented in United States Dollar (USD) and all values are rounded to the nearest dollar, unless otherwise indicated.
The consolidated financial statements provide comparative information in respect of the previous period. Statement of Compliance The consolidated financial statements of the Group have been prepared in compliance with PFRS.
Basis of Consolidation The consolidated financial statements comprise the financial statements of the Group as of December 31, 2020 and 2019 and for each of the three years in the period ended December 31, 2020.
Control is achieved when the Group is exposed, or has rights, to variable returns from its involvement with the investee and has the ability to affect those returns through its power over the investee.
Specifically, the Group controls an investee if and only if the Group has:
a. Power over the investee (i.e. existing rights that give it the current ability to direct the relevant activities of the investee)
b. Exposure, or rights, to variable returns from its involvement with the investee, and c. The ability to use its power over the investee to affect its returns
When the Group has less than a majority of the voting or similar rights of an investee, the Group considers all relevant facts and circumstances in assessing whether it has power over an investee, including:
a. The contractual arrangement with the other vote holders of the investee b. Rights arising from other contractual arrangements c. The Group’s voting rights and potential voting rights
The Group re-assesses whether it controls an investee if facts and circumstances indicate that there are changes to one or more of the three elements of control. Consolidation of a subsidiary begins when the Group obtains control over the subsidiary and ceases when the Group loses control of the subsidiary. Assets, liabilities, income and expenses of a subsidiary acquired or disposed of during the year are included or excluded in the consolidated financial statements from the date the Group gains control or until the date the Group ceases to control the subsidiary.
Non-controlling interests pertain to the equity in a subsidiary not attributable, directly or indirectly to the Parent Company. Any equity instruments issued by a subsidiary that are not owned by the Parent Company are non-controlling interests including preferred shares and options under share-based transactions. The portion of profit or loss and net assets in subsidiaries not wholly-owned are presented separately in the consolidated statements of income, consolidated statements of comprehensive income, consolidated statements of changes in equity and consolidated statements of financial position, separately from the Parent Company’s equity. Non-controlling interests are net of any outstanding subscription receivable.
Losses within a subsidiary are attributed to the non-controlling interests even if that results in a deficit balance.
In accounting for call and put options over non-controlling interests, management determines whether it has present access to the returns associated with the non-controlling interests. If the options give the Group access to the returns over the non-controlling interests, the Group consolidates the acquiree as if it acquired a 100% interest.
If the options do not give the Group present access to the returns over the non-controlling interests, the Group takes the view that the non-controlling interests should be accounted for in accordance with PFRS 10, Consolidated Financial Statements, and must be presented within equity separate from the equity of the Parent Company, until the option is exercised.
The call option is accounted for under PFRS 9, Financial Instruments, as a derivative instrument carried at fair value through profit or loss.
The financial liability for the put option is accounted for under PFRS 9 like any other written put option on equity instruments. On initial recognition, the corresponding debit is made to a component of equity attributable to the parent, not to the non-controlling interest. All subsequent changes in the carrying amount of the financial liability that result from the remeasurement of the present value payable on exercise are recognized in profit or loss also attributable to the parent. If the put option is exercised, the entity accounts for an increase in its ownership interest. At the same time, the entity derecognizes the financial liability and reverses the component of equity that was reduced on initial recognition. If the put option expires unexercised, the financial liability is reclassified to the same component of equity that was reduced on initial recognition.
A change in the ownership interest of a subsidiary, without a loss of control, is accounted for as an equity transaction. Any difference between the amount by which the non-controlling interests are adjusted and the fair value of the consideration paid or received is recognized directly in equity and attributed to the owners of the Parent Company. The difference is included as part of additional paid-in capital.
If the Group losses control over a subsidiary, it derecognises the related assets (including goodwill), liabilities, non-controlling interest and other components of equity, while the resulting gain or loss is recognised in profit or loss. Any investment retained is recognised at fair value.
Integrated mIcro-electronIcs, Inc.
40 Years of manufacturing technology and Innovation 40 Years of manufacturing technology and Innovation
2020 Integrated rePort
100 101

Changes in Accounting Policies and Disclosures The accounting policies adopted in the preparation of the consolidated financial statements are consistent with those of the previous financial years except for the new PFRS, amended PFRS and improvements to PFRS which were adopted beginning January 1, 2020. The Group has not early adopted any other standard, interpretation or amendment that has been issued but is not yet effective.
Amendments to PFRS 3, Business Combinations, Definition of a Business
The amendments to PFRS 3 clarifies that to be considered a business, an integrated set of activities and assets must include, at a minimum, an input and a substantive process that together significantly contribute to the ability to create output. Furthermore, it clarifies that a business can exist without including all of the inputs and processes needed to create outputs. These amendments may impact future periods should the Group enter into any business combinations. These amendments had no impact on the consolidated financial statements of the Group as it did not enter to any business combinations during the period.
Amendments to PFRS 7, Financial Instruments: Disclosures and PFRS 9, Financial Instruments, Interest Rate Benchmark Reform The amendments to PFRS 9 provide a number of reliefs, which apply to all hedging relationships that are directly affected by the interest rate benchmark reform. A hedging relationship is affected if the reform gives rise to uncertainties about the timing and or amount of benchmark-based cash flows of the hedged item or the hedging instrument. These amendments had no impact on the consolidated financial statements of the Group.
Amendments to PAS 1, Presentation of Financial Statements, and PAS 8, Accounting Policies,
Changes in Accounting Estimates and Errors, Definition of Material The amendments provide a new definition of material that states “information is material if omitting, misstating or obscuring it could reasonably be expected to influence decisions that the primary users of general purpose financial statements make on the basis of those financial statements, which provide financial information about a specific reporting entity.” The amendments clarify that materiality will depend on the nature or magnitude of information, either individually or in combination with other information, in the context of the financial statements. A misstatement of information is material if it could reasonably be expected to influence decisions made by the primary users. The amendments were consistently applied on the disclosures of the Group.
Conceptual Framework for Financial Reporting issued on March 29, 2018 The Conceptual Framework is not a standard, and none of the concepts contained therein override the concepts or requirements in any standard. The purpose of the Conceptual Framework is to assist the standard-setters in developing standards, to help preparers develop consistent accounting policies where there is no applicable standard in place and to assist all parties to understand and interpret the standards.
The revised Conceptual Framework includes new concepts, provides updated definitions and recognition criteria for assets and liabilities and clarifies some important concepts. The amendments were consistently applied on the disclosures of the Group.
Amendments to PFRS 16, COVID-19-related Rent Concessions The amendments provide relief to lessees from applying the PFRS 16 requirement on lease modifications to rent concessions arising as a direct consequence of the COVID-19 pandemic. A lessee may elect not to assess whether a rent concession from a lessor is a lease modification if it meets all of the following criteria: The rent concession is a direct consequence of COVID-19; The change in lease payments results in a revised lease consideration that is substantially the
same as, or less than, the lease consideration immediately preceding the change; Any reduction in lease payments affects only payments originally due on or before
June 30, 2021; and There is no substantive change to other terms and conditions of the lease.
A lessee that applies this practical expedient will account for any change in lease payments resulting from the COVID-19 related rent concession in the same way it would account for a change that is not a lease modification, i.e., as a variable lease payment. The amendments are effective for annual reporting periods beginning on or after June 1, 2020. Early adoption is permitted. The Group adopted the amendments to PFRS 16 using the practical expedient beginning January 1, 2020 and recognized rent concession as variable lease payments amounting to $0.42 million as part of cost of sales.
Pronouncements issued but not yet effective are listed below. Unless otherwise indicated, the Group does not expect that the future adoption of the said pronouncements will have a significant impact on its consolidated financial statements. The Group intends to adopt the following pronouncements when they become effective.
Effective beginning on or after January 1, 2021
Amendments to PFRS 9, PFRS 7, PFRS 4 and PFRS 16, Interest Rate Benchmark Reform – Phase 2
The amendments provide the following temporary reliefs which address the financial reporting effects when an interbank offered rate (IBOR) is replaced with an alternative nearly risk-free interest rate (RFR): Practical expedient for changes in the basis for determining the contractual cash flows as a
result of IBOR reform Relief from discontinuing hedging relationships Relief from the separately identifiable requirement when an RFR instrument is designated as a
hedge of a risk component
The Group shall also disclose information about: The about the nature and extent of risks to which the entity is exposed arising from financial
instruments subject to IBOR reform, and how the entity manages those risks; and Their progress in completing the transition to alternative benchmark rates, and how the entity is
managing that transition
The amendments are effective for annual reporting periods beginning on or after 1 January 2021 and apply retrospectively, however, the Group is not required to restate prior periods.
Effective beginning on or after January 1, 2022 Amendments to PFRS 3, Reference to the Conceptual Framework
The amendments are intended to replace a reference to the Framework for the Preparation and Presentation of Financial Statements, issued in 1989, with a reference to the Conceptual Framework for Financial Reporting issued in March 2018 without significantly changing its requirements. The amendments added an exception to the recognition principle of PFRS 3, Business Combinations, to avoid the issue of potential ‘day 2’ gains or losses arising for liabilities and contingent liabilities that would be within the scope of PAS 37, Provisions, Contingent Liabilities and Contingent Assets, or Philippine-IFRIC 21, Levies, if incurred separately. At the same time, the amendments add a new paragraph to PFRS 3 to clarify that contingent assets do not qualify for recognition at the acquisition date. The amendments are effective for annual reporting periods beginning on or after 1 January 2022 and apply prospectively.
Amendments to PAS 16, Plant and Equipment: Proceeds before Intended Use
The amendments prohibit entities deducting from the cost of an item of property, plant and equipment, any proceeds from selling items produced while bringing that asset to the location and condition necessary for it to be capable of operating in the manner intended by management. Instead, an entity recognizes the proceeds from selling such items, and the costs of producing those items, in profit or loss. The amendment is effective for annual reporting periods beginning on or after January 1, 2022 and must be applied retrospectively to items of property, plant and equipment made available for use on or after the beginning of the earliest period presented when the entity first applies the amendment. The amendments are not expected to have a material impact on the Group.
Integrated mIcro-electronIcs, Inc.
40 Years of manufacturing technology and Innovation 40 Years of manufacturing technology and Innovation
2020 Integrated rePort
102 103

Amendments to PAS 37, Onerous Contracts – Costs of Fulfilling a Contract
The amendments specify which costs an entity needs to include when assessing whether a contract is onerous or loss-making. The amendments apply a “directly related cost approach”. The costs that relate directly to a contract to provide goods or services include both incremental costs and an allocation of costs directly related to contract activities. General and administrative costs do not relate directly to a contract and are excluded unless they are explicitly chargeable to the counterparty under the contract.
The amendments are effective for annual reporting periods beginning on or after January 1, 2022. The Group will apply these amendments to contracts for which it has not yet fulfilled all its obligations at the beginning of the annual reporting period in which it first applies the amendments.
Annual Improvements to PFRSs 2018-2020 Cycle
Amendments to PFRS 1, First-time Adoption of Philippines Financial Reporting Standards,
Subsidiary as a first-time adopter
The amendment permits a subsidiary that elects to apply paragraph D16(a) of PFRS 1 to measure cumulative translation differences using the amounts reported by the parent, based on the parent’s date of transition to PFRS. This amendment is also applied to an associate or joint venture that elects to apply paragraph D16(a) of PFRS 1.
The amendment is effective for annual reporting periods beginning on or after January 1, 2022 with earlier adoption permitted. The amendments are not expected to have a material impact on the Group.
Amendments to PFRS 9, Financial Instruments, Fees in the ’10 per cent’ test for derecognition of financial liabilities
The amendment clarifies the fees that an entity includes when assessing whether the terms of a new or modified financial liability are substantially different from the terms of the original financial liability. These fees include only those paid or received between the borrower and the lender, including fees paid or received by either the borrower or lender on the other’s behalf. An entity applies the amendment to financial liabilities that are modified or exchanged on or after the beginning of the annual reporting period in which the entity first applies the amendment.
The amendment is effective for annual reporting periods beginning on or after January 1, 2022 with earlier adoption permitted. The Group will apply the amendments to financial liabilities that are modified or exchanged on or after the beginning of the annual reporting period in which the entity first applies the amendment. The amendments are not expected to have a material impact on the Group.
Amendments to PAS 41, Agriculture, Taxation in fair value measurements
The amendment removes the requirement in paragraph 22 of PAS 41 that entities exclude cash flows for taxation when measuring the fair value of assets within the scope of PAS 41.
The amendments are expected to have no impact on the Group.
Effective beginning on or after January 1, 2023 Amendments to PAS 1, Classification of Liabilities as Current or Non-current
The amendments clarify paragraphs 69 to 76 of PAS 1, Presentation of Financial Statements, to specify the requirements for classifying liabilities as current or non-current. The amendments clarify: What is meant by a right to defer settlement That a right to defer must exist at the end of the reporting period That classification is unaffected by the likelihood that an entity will exercise its deferral right That only if an embedded derivative in a convertible liability is itself an equity instrument would
the terms of a liability not impact its classification
The amendments are effective for annual reporting periods beginning on or after January 1, 2023 and must be applied retrospectively. The Group is currently assessing the impact the amendments will have on current practice and whether existing loan agreements may require renegotiation.
PFRS 17, Insurance Contracts
PFRS 17 is a comprehensive new accounting standard for insurance contracts covering recognition and measurement, presentation and disclosure. Once effective, PFRS 17 will replace PFRS 4, Insurance Contracts. This new standard on insurance contracts applies to all types of insurance contracts (i.e., life, non-life, direct insurance and re-insurance), regardless of the type of entities that issue them, as well as to certain guarantees and financial instruments with discretionary participation features. A few scope exceptions will apply.
The overall objective of PFRS 17 is to provide an accounting model for insurance contracts that is more useful and consistent for insurers. In contrast to the requirements in PFRS 4, which are largely based on grandfathering previous local accounting policies, PFRS 17 provides a comprehensive model for insurance contracts, covering all relevant accounting aspects. The core of PFRS 17 is the general model, supplemented by: A specific adaptation for contracts with direct participation features (the variable fee approach) A simplified approach (the premium allocation approach) mainly for short-duration contracts
PFRS 17 is effective for reporting periods beginning on or after January 1, 2023, with comparative figures required. Early application is permitted.
The amendments are expected to have no impact on the Group.
Deferred effectivity Amendments to PFRS 10, Consolidated Financial Statements, and PAS 28, Sale or Contribution of
Assets between an Investor and its Associate or Joint Venture
The amendments address the conflict between PFRS 10 and PAS 28 in dealing with the loss of control of a subsidiary that is sold or contributed to an associate or joint venture. The amendments clarify that a full gain or loss is recognized when a transfer to an associate or joint venture involves a business as defined in PFRS 3. Any gain or loss resulting from the sale or contribution of assets that does not constitute a business, however, is recognized only to the extent of unrelated investors’ interests in the associate or joint venture.
On January 13, 2016, the Financial Reporting Standards Council deferred the original effective date of January 1, 2016 of the said amendments until the International Accounting Standards Board (IASB) completes its broader review of the research project on equity accounting that may result in the simplification of accounting for such transactions and of other aspects of accounting for associates and joint ventures.
The significant accounting policies that have been used in the preparation of the consolidated financial statements are summarized below. These policies have been consistently applied to all the years presented, unless otherwise stated.
Current versus Noncurrent Classification The Group presents assets and liabilities in the consolidated balance sheet based on current or noncurrent classification.
An asset is current when it is:
Expected to be realized or intended to be sold or consumed in the normal operating cycle; Held primarily for the purpose of trading; Expected to be realized within twelve months after the balance sheet date; or Cash or cash equivalent, unless restricted from being exchanged or used to settle a liability for at
least twelve months after the balance sheet date.
All other assets are classified as noncurrent.
A liability is current when:
It is expected to be settled in the normal operating cycle; It is held primarily for the purpose of trading; It is due to be settled within twelve months after the balance sheet date; or There is no unconditional right to defer the settlement of the liability for at least twelve months after
the balance sheet date.
All other liabilities are classified as noncurrent.
Deferred tax assets and liabilities are classified as noncurrent assets and liabilities, respectively.
Integrated mIcro-electronIcs, Inc.
40 Years of manufacturing technology and Innovation 40 Years of manufacturing technology and Innovation
2020 Integrated rePort
104 105

Cash and Cash Equivalents Cash includes cash on hand and in banks. Cash equivalents are short-term, highly liquid investments that are readily convertible to known amounts of cash with original maturities of three months or less and that are subject to an insignificant risk of change in value.
Financial Instruments A financial instrument is any contract that gives rise to a financial asset of one entity and a financial liability or equity instrument of another entity.
a) Financial assets Initial recognition and measurement Financial assets are classified at fair value, at initial recognition, and subsequently measured at amortized cost, FVOCI, and FVPL.
The classification of financial assets at initial recognition depends on the financial asset’s contractual cash flow characteristics and the Group’s business model for managing them. With the exception of trade receivables that do not contain a significant financing component or for which the Group has applied the practical expedient, the Group initially measures a financial asset at its fair value plus, in the case of a financial asset not at FVPL, transaction costs. Trade receivables that do not contain a significant financing component or for which the Group has applied the practical expedient are measured at the transaction price determined under PFRS 15.
In order for a financial asset to be classified and measured at amortized cost or FVOCI, it needs to give rise to cash flows that are ‘solely payments of principal and interest (SPPI)’ on the principal amount outstanding. This assessment is referred to as the SPPI test and is performed at an instrument level.
The Group’s business model for managing financial assets refers to how it manages its financial assets in order to generate cash flows. The business model determines whether cash flows will result from collecting contractual cash flows, selling the financial assets, or both.
Purchases or sales of financial assets that require delivery of assets within a time frame established by regulation or convention in the market place (regular way trades) are recognized on the trade date, i.e., the date that the Group commits to purchase or sell the asset.
Subsequent measurement For purposes of subsequent measurement, financial assets are classified in four categories: Financial assets at amortized cost (debt instruments) Financial assets at FVOCI with recycling of cumulative gains and losses (debt instruments) Financial assets designated at FVOCI with no recycling of cumulative gains and losses upon
derecognition (equity instruments) Financial assets at FVPL
The financial assets of the Group as of December 31, 2020 and 2019 consist of financial assets at amortized cost (debt instruments) and financial assets designated at FVOCI with no recycling of cumulative gains and losses upon derecognition (equity instruments).
Financial assets at amortized cost (debt instruments) This category is the most relevant to the Group. The Group measures financial assets at amortized cost if both of the following conditions are met: The financial asset is held within a business model with the objective to hold financial assets in order
to collect contractual cash flows; and The contractual terms of the financial asset give rise on specified dates to cash flows that are solely
payments of principal and interest on the principal amount outstanding.
Financial assets at amortized cost are subsequently measured using the effective interest (EIR) method and are subject to impairment. Gains and losses are recognized in profit or loss when the asset is derecognized, modified or impaired.
The Group’s financial assets at amortized cost includes cash and cash equivalents, receivables and miscellaneous deposits included under “Other noncurrent assets” account.
Financial assets designated at FVOCI (equity instruments) Upon initial recognition, the Group can elect to classify irrevocably its equity investments as equity instruments designated at FVOCI when they meet the definition of equity under PAS 32, Financial Instruments: Presentation, and are not held for trading. The classification is determined on an instrument-by-instrument basis.
Gains and losses on these financial assets are never recycled to profit or loss. Dividends are recognized as other income in the consolidated statement of income when the right of payment has been
established, except when the Group benefits from such proceeds as a recovery of part of the cost of the financial asset, in which case, such gains are recorded in OCI. Equity instruments designated at FVOCI are not subject to impairment assessment.
The Group elected to classify irrevocably its investments in club shares and non-listed common equity shares under this category.
Financial assets at FVPL Financial assets at FVPL include financial assets held for trading, financial assets designated upon initial recognition at FVPL, or financial assets mandatorily required to be measured at fair value. Financial assets are classified as held for trading if they are acquired for the purpose of selling or repurchasing in the near term. Derivatives, including separated embedded derivatives, are also classified as held for trading unless they are designated as effective hedging instruments. Financial assets with cash flows that are not solely payments of principal and interest are classified and measured at FVPL, irrespective of the business model. Notwithstanding the criteria for debt instruments to be classified at amortized cost or at FVOCI, as described above, debt instruments may be designated at FVPL on initial recognition if doing so eliminates, or significantly reduces, an accounting mismatch.
Financial assets at FVPL are carried in the consolidated balance sheet at fair value with net changes in fair value recognized in the consolidated statement of income.
This category includes derivative instruments which the Group had not irrevocably elected to classify at FVOCI.
A derivative embedded in a hybrid contract, with a financial liability or non-financial host, is separated from the host and accounted for as a separate derivative if: the economic characteristics and risks are not closely related to the host; a separate instrument with the same terms as the embedded derivative would meet the definition of a derivative; and the hybrid contract is not measured at fair value through profit or loss. Embedded derivatives are measured at fair value with changes in fair value recognized in profit or loss. Reassessment only occurs if there is either a change in the terms of the contract that significantly modifies the cash flows that would otherwise be required or a reclassification of a financial asset out of the fair value through profit or loss category.
Derecognition A financial asset (or, where applicable, a part of a financial asset or part of a group of similar financial assets) is primarily derecognized (i.e., removed from the Group’s consolidated balance sheet) when: The rights to receive cash flows from the asset have expired, or The Group has transferred its rights to receive cash flows from the asset or has assumed an
obligation to pay the received cash flows in full without material delay to a third party under a ‘pass-through’ arrangement; and either (a) the Group has transferred substantially all the risks and rewards of the asset, or (b) the Group has neither transferred nor retained substantially all the risks and rewards of the asset, but has transferred control of the asset.
When the Group has transferred its rights to receive cash flows from an asset or has entered into a pass-through arrangement, it evaluates if, and to what extent, it has retained the risks and rewards of ownership. When it has neither transferred nor retained substantially all of the risks and rewards of the asset, nor transferred control of the asset, the Group continues to recognize the transferred asset to the extent of its continuing involvement. In that case, the Group also recognizes an associated liability. The transferred asset and the associated liability are measured on a basis that reflects the rights and obligations that the Group has retained.
Continuing involvement that takes the form of a guarantee over the transferred asset is measured at the lower of the original carrying amount of the asset and the maximum amount of consideration that the Group could be required to repay.
Impairment of Financial Assets The Group recognizes an allowance for expected credit losses (ECLs) for all debt instruments not held at FVPL. ECLs are based on the difference between the contractual cash flows due in accordance with the contract and all the cash flows that the Group expects to receive, discounted at an approximation of the original effective interest rate. The expected cash flows will include cash flows from the sale of collateral held or other credit enhancements that are integral to the contractual terms.
For those credit exposures for which there has been a significant increase in credit risk since initial recognition, a loss allowance is recognized for credit losses expected over the remaining life of the exposure, irrespective of timing of the default (a lifetime ECL).
For trade receivables and contract assets, the Group applies a simplified approach in calculating ECLs. Therefore, the Group does not track changes in credit risk, but instead recognizes a loss allowance based on lifetime ECLs at each reporting date. The Group has established a provision matrix that is
Integrated mIcro-electronIcs, Inc.
40 Years of manufacturing technology and Innovation 40 Years of manufacturing technology and Innovation
2020 Integrated rePort
106 107

based on its historical credit loss experience, adjusted for forward-looking factors specific to the debtors and the economic environment.
The Group considers a financial asset in default when internal or external information indicates that the Group is unlikely to receive the outstanding contractual amounts in full before taking into account any credit enhancements held by the Group. A financial asset is written off when there is no reasonable expectation of recovering the contractual cash flows.
b) Financial liabilities Initial recognition and measurement Financial liabilities are classified, at initial recognition, as financial liabilities at FVPL, loans and borrowings, payables, or as derivatives designated as hedging instruments in an effective hedge, as appropriate.
All financial liabilities are recognized initially at fair value and, in the case of loans and borrowings and payables, net of directly attributable transaction costs.
Subsequent measurement The measurement of financial liabilities depends on their classification, as described below:
Financial liabilities at FVPL Financial liabilities at FVPL include financial liabilities held for trading and financial liabilities designated upon initial recognition as at FVPL.
Financial liabilities are classified as held for trading if they are incurred for the purpose of repurchasing in the near term. This category also includes derivative financial instruments entered into by the Group that are not designated as hedging instruments in hedge relationships as defined by PFRS 9. Separated embedded derivatives are also classified as held for trading unless they are designated as effective hedging instruments.
Gains or losses on liabilities held for trading are recognized in the consolidated statements of income.
Financial liabilities designated upon initial recognition at FVPL are designated at the initial date of recognition, and only if the criteria in PFRS 9 are satisfied.
This category applies to the Group’s derivative liabilities and financial liabilities on put options over the non-controlling interests.
Other financial liabilities This category pertains to financial liabilities that are not held for trading or not designated as at FVPL upon the inception of the liability. These include liabilities arising from operations and borrowings.
After initial measurement, other financial liabilities are measured at amortized cost using the EIR method. Amortized cost is calculated by taking into account any discount or premium on the acquisition and fees or costs that are an integral part of the EIR. Gains and losses are recognized in profit or loss when other financial liabilities are derecognized, as well as through the EIR amortization process.
This category applies to the Group’s accounts payable and accrued expenses (excluding advances from customers, advances from third party, statutory payables and taxes payables), loans payable and long-term debt.
Derecognition A financial liability is derecognized when the obligation under the liability is discharged or cancelled or has expired. When an existing financial liability is replaced by another from the same lender on substantially different terms, or the terms of an existing liability are substantially modified, such an exchange or modification is treated as the derecognition of the original liability and the recognition of a new liability. The difference in the respective carrying amounts is recognized in profit or loss.
c) Offsetting of financial instruments Financial assets and financial liabilities are offset and the net amount is reported in the consolidated balance sheets if there is a currently enforceable legal right to offset the recognized amounts and there is an intention to settle on a net basis, to realize the assets and settle the liabilities simultaneously.
Fair Value Measurement The Group measures its derivatives, financial assets at FVOCI and financial liabilities at FVPL at fair value at each balance sheet date. Also, fair values of financial instruments measured at amortized cost are disclosed in Note 32.
The fair value is the price that would be received to sell an asset, or paid to transfer a liability in an orderly transaction between market participants at the measurement date. The fair value measurement
is based on the presumption that the transaction to sell the asset or transfer the liability takes place either:
In the principal market for the asset or liability; or In the absence of a principal market, in the most advantageous market for the asset or liability.
The principal or the most advantageous market must be accessible to the Group.
The fair value of an asset or a liability is measured using the assumptions that market participants would use when pricing the asset or liability, assuming that market participants act in their economic best interest.
The Group uses valuation techniques that are appropriate in the circumstances and for which sufficient data are available to measure the fair value, maximizing the use of relevant observable inputs and minimizing the use of unobservable inputs.
All assets and liabilities for which the fair value is measured or disclosed in the consolidated financial statements are categorized within the fair value hierarchy, described as follows, based on the lowest level input that is significant to the fair value measurement as a whole:
Level 1 - Quoted (unadjusted) market prices in active markets for identical assets and liabilities. Level 2 - Valuation techniques for which the lowest level input that is significant to the fair value
measurement is directly or indirectly observable. Level 3 - Valuation techniques for which the lowest level input that is significant to the fair value
measurement is unobservable.
For assets and liabilities that are recognized in the consolidated financial statements on a recurring basis, the Group determines whether transfers have occurred between levels in the hierarchy by reassessing categorization (based on the lowest level input that is significant to the fair value measurement as a whole) at balance sheet date.
For purposes of fair value disclosures, the Group has determined classes of assets and liabilities on the basis of the nature, characteristics and risks of the asset or liability and the level of the fair value hierarchy as explained above.
Inventories Inventories are valued at the lower of cost and net realizable value (NRV). Cost is determined using the moving average method for raw materials and supplies. For finished goods and work-in-process, cost includes direct materials, direct labor, and a proportion of manufacturing overhead costs based on normal operating capacity determined using the moving average method. NRV is the estimated selling price in the ordinary course of business, less the estimated costs of completion and costs necessary to make the sale. In the event that NRV is lower than cost, the decline shall be recognized as an expense in profit or loss.
Deferred Charges Deferred charges are recognized when the Group incurred expenses but the benefits are not expected to be realized on a short-term basis. These are normally chargeable to the customers as part of the selling price of the manufactured items.
Property, Plant and Equipment Property, plant and equipment are stated at cost, net of accumulated depreciation and accumulated impairment losses. The initial cost of property, plant and equipment consists of its purchase price and any directly attributable cost of bringing the asset to its working condition and location for its intended use. Expenditures incurred after the property, plant and equipment have been put into operation, such as repairs and maintenance and overhaul costs, are normally charged to profit or loss in the period in which the costs are incurred. In situations where it can be clearly demonstrated that the expenditures have resulted in an increase in the future economic benefits expected to be obtained from the use of an item of property, plant and equipment beyond its originally assessed standard of performance, the expenditures are capitalized as additional costs of property, plant and equipment.
Construction in progress is stated at cost, less impairment loss, if any. This includes costs of construction and installation of equipment and machinery items, and any other costs directly attributable to bringing the asset to its intended use. Construction in progress is not depreciated until such time as the relevant assets are completed and put into operational use.
Depreciation of property, plant and equipment commences once the property, plant and equipment are available for use and is calculated on a straight-line basis over the estimated useful lives (EUL) of the assets as follows:
Integrated mIcro-electronIcs, Inc.
40 Years of manufacturing technology and Innovation 40 Years of manufacturing technology and Innovation
2020 Integrated rePort
108 109

Years Buildings 25 - 30 Building improvements 5 Machineries and facilities equipment 7 Furniture, fixtures and office equipment 3 - 5 Transportation equipment 3 - 5 Tools and instruments 2 - 5
The EUL and methods of depreciation of property, plant and equipment are reviewed annually and adjusted prospectively, if appropriate. The EUL of property, plant and equipment are based on expected asset utilization as anchored on business plans and strategies that also consider expected future technological developments and market behavior to ensure that the period of depreciation is consistent with the expected pattern of economic benefits from items of property, plant and equipment.
An item of property, plant and equipment is derecognized upon disposal or when no future economic benefits are expected from its use. Any gain or loss arising from the derecognition of the asset (calculated as the difference between the net disposal proceeds and the carrying amount of the asset) is recognized in profit or loss when the asset is derecognized.
Fully depreciated property, plant and equipment are retained in the accounts until these are no longer used and no further depreciation is charged to profit or loss.
Borrowing Costs Borrowing costs directly attributable to the acquisition, construction or production of an asset that necessarily takes a substantial period of time to get ready for its intended use or sale are capitalized as part of the cost of the asset. All other borrowing costs are expensed in the period in which they occur. Borrowing costs consist of interest and other costs that the Group incurs in connection with the borrowing of funds.
Business Combinations and Goodwill Business combinations are accounted for using the acquisition method. The cost of an acquisition is measured as the aggregate of the consideration transferred, measured at acquisition date fair value, and the amount of any non-controlling interest in the acquiree. For each business combination, the Group elects to measure the non-controlling interest in the acquiree at the proportionate share of the acquiree’s identifiable net assets. Acquisition-related costs are expensed as incurred and included in the consolidated statements of income under “Operating expenses” account.
When the Group acquires a business, it assesses the financial assets and liabilities assumed for appropriate classification and designation in accordance with the contractual terms, economic circumstances and pertinent conditions as at the acquisition date. This includes the separation of embedded derivatives in host contracts by the acquiree.
If the business combination is achieved in stages, any previously held equity interest is remeasured at its acquisition date fair value and any resulting gain or loss is recognized in profit or loss. Any contingent consideration to be transferred by the acquirer will be recognized at fair value at the acquisition date. Contingent consideration classified as an asset or liability, that is a financial instrument and within the scope of PFRS 9 is measured at fair value with changes in fair value recognized in profit or loss. Other contingent consideration that is not within the scope of PFRS 9 is measured at fair value at each reporting date with changes in fair value recognized in profit or loss. Goodwill is initially measured at cost, being the excess of the aggregate of the consideration transferred and the amount recognized for non-controlling interests over the net identifiable assets acquired and liabilities assumed. If the fair value of the net assets acquired is in excess of the aggregate consideration transferred, the Group reassesses whether it has correctly identified all of the assets acquired and all of the liabilities assumed and reviews the procedures used to measure amounts to be recognized at the acquisition date. If the reassessment still results in an excess of the fair value of net assets acquired over the aggregate consideration transferred, then the gain is recognized in profit or loss.
After initial recognition, goodwill is measured at cost, less accumulated impairment losses. For purposes of impairment testing, goodwill acquired in a business combination is, from the acquisition date, allocated to each of the Group’s cash-generating unit (CGU), or group of CGUs, that are expected to benefit from the synergies of the combination, irrespective of whether other assets or liabilities of the Group are assigned to those units or groups of units. Each unit or group of units to which the goodwill is allocated should:
Represent the lowest level within the Group at which the goodwill is monitored for internal management purposes; and
Not be larger than an operating segment determined in accordance with PFRS 8, Operating Segments.
When goodwill has been allocated to a CGU and part of the operation within that unit is disposed of, the goodwill allocated with the disposed operation is included in the carrying amount of the operation when determining the gain or loss on disposal. Goodwill disposed in these circumstances is measured based on the relative values of the disposed operation.
If the initial accounting for a business combination can be determined only provisionally by the end of the period in which the combination is effected because either the fair values to be assigned to the acquiree’s identifiable assets, liabilities or contingent liabilities or the cost of the combination can be determined only provisionally, the acquirer shall account for the combination using those provisional values. The acquirer shall recognize any adjustments to those provisional values as a result of completing the initial accounting within twelve months of the acquisition date as follows: (i) the carrying amount of the identifiable asset, liability or contingent liability that is recognized or adjusted as a result of completing the initial accounting shall be calculated as if its fair value at the acquisition date had been recognized from that date; (ii) goodwill or any gain recognized shall be adjusted by an amount equal to the adjustment to the fair value at the acquisition date of the identifiable asset, liability or contingent liability being recognized or adjusted; and (iii) comparative information presented for the periods before the initial accounting for the combination is complete shall be presented as if the initial accounting has been completed from the acquisition date.
Intangible Assets Intangible assets acquired separately are measured on initial recognition at cost. The cost of intangible assets acquired in a business combination is the fair value as of the date of acquisition.
Research and development costs Research costs are expensed as incurred. Development expenditures on an individual project are recognized as an intangible asset when the Group can demonstrate:
(a) The technical feasibility of completing the intangible asset so that the asset will be available for use
or sale; (b) Its intention to complete and ability to use or sell the intangible asset; (c) How the intangible asset will generate probable future economic benefits. Among other things, the
entity can demonstrate the existence of a market for the output of the intangible asset or the intangible asset itself or, if it is to be used internally, the usefulness of the intangible asset;
(d) The availability of adequate technical, financial and other resources to complete the development and to use or sell the intangible asset; and
(e) Its ability to measure reliably the expenditure attributable to the intangible asset during its development.
After initial recognition, intangible assets are carried at cost, less accumulated amortization and any accumulated impairment losses. Amortization begins when development is complete and the asset is available for use. It is amortized over the period of expected benefit.
The EUL of intangible assets are assessed as either finite or indefinite. Intangible assets with finite useful lives are amortized over their EUL and assessed for impairment whenever there is an indication that the intangible asset is impaired. The amortization period and method for intangible assets with finite useful lives are reviewed at least at the end of each balance sheet date. Changes in the EUL or the expected pattern of consumption of future economic benefits embodied in the asset are considered to modify the amortization period or method, as appropriate, and are treated as changes in accounting estimates. The amortization expense on intangible assets with finite useful lives is recognized in profit or loss.
The EUL of intangible assets of finite useful life are as follows:
Years Customer relationships 5 Unpatented technology 5 Licenses 3-5 Intellectual properties 5 Product development costs 5
Intangible assets with indefinite useful lives and those not yet available for use are not amortized, but are tested for impairment annually, either individually or at the CGU level. The assessment of indefinite useful life is reviewed annually to determine whether the indefinite useful life continues to be supportable. If not, the change in useful life from indefinite to finite is made on a prospective basis.
Integrated mIcro-electronIcs, Inc.
40 Years of manufacturing technology and Innovation 40 Years of manufacturing technology and Innovation
2020 Integrated rePort
110 111

Gains or losses arising from the derecognition of an intangible asset are measured as the difference between the net disposal proceeds and the carrying amount of the asset and are recognized in profit or loss when the asset is derecognized.
Leases (Upon Adoption of PFRS 16 beginning January 1, 2019) The Group assesses at contract inception whether a contract is, or contains, a lease. That is, if the contract conveys the right to control the use of an identified asset for a period of time in exchange for consideration. Group as Lessee The Group applies a single recognition and measurement approach for all leases, except for short-term leases and leases of low-value assets. The Group recognizes lease liabilities to make lease payments and right-of-use assets representing the right to use the underlying assets.
Right-of-use Assets The Group recognizes right-of-use assets at the commencement date of the lease (i.e., the date the underlying asset is available for use). Right-of-use assets are measured at cost, less any accumulated depreciation and impairment losses, and adjusted for any remeasurement of lease liabilities. The cost of right-of-use assets includes the amount of lease liabilities recognized, initial direct costs incurred, and lease payments made at or before the commencement date less any lease incentives received. Right-of-use assets are depreciated on a straight-line basis over the shorter of the lease term and the estimated useful lives of the assets. If ownership of the leased asset transfers to the Group at the end of the lease term or the cost reflects the exercise of a purchase option, depreciation is calculated using the estimated useful life of the asset. The right-of-use assets are also subject to impairment.
Lease Liabilities At the commencement date of the lease, the Group recognizes lease liabilities measured at the present value of lease payments to be made over the lease term. The lease payments include fixed payments (including in-substance fixed payments) less any lease incentives receivable, variable lease payments that depend on an index or a rate, and amounts expected to be paid under residual value guarantees. The lease payments also include the exercise price of a purchase option reasonably certain to be exercised by the Group and payments of penalties for terminating the lease, if the lease term reflects the Group exercising the option to terminate. Variable lease payments that do not depend on an index or a rate are recognized as expenses (unless they are incurred to produce inventories) in the period in which the event or condition that triggers the payment occurs. In calculating the present value of lease payments, the Group uses its incremental borrowing rate at the lease commencement date because the interest rate implicit in the lease is not readily determinable. After the commencement date, the amount of lease liabilities is increased to reflect the accretion of interest and reduced for the lease payments made. In addition, the carrying amount of lease liabilities is remeasured if there is a modification, a change in the lease term, a change in the lease payments (e.g., changes to future payments resulting from a change in an index or rate used to determine such lease payments) or a change in the assessment of an option to purchase the underlying asset.
Short-term Leases (STL) and Leases of Low-value Assets The Group applies the STL recognition exemption to those leases that have a lease term of 12 months or less from the commencement date and do not contain a purchase option. The Group applies the low-value assets recognition exemption to leases of underlying assets with a value, when new, of US$5,000 and below. Lease payments on short-term leases and low-value assets are recognized as expense on a straight-line basis over the lease term.
Leases (Prior to Adoption of PFRS 16 beginning January 1, 2019) The determination of whether an arrangement is, or contains, a lease, is based on the substance of the arrangement at the inception date. The arrangement is assessed for whether fulfillment of the arrangement is dependent on the use of a specific asset or assets, or whether the arrangement conveys a right to use the asset or assets, even if that right is not explicitly specified in an arrangement.
Operating and finance lease commitments - Group as lessee Finance leases that transfer substantially all the risks and benefits incidental to ownership of the leased item to the Group are capitalized at the inception of the lease at the fair value of the leased property or, if lower, at the present value of the minimum lease payments and included in the “Property, plant and equipment” account, with the corresponding liability to the lessor included in the “Accounts payable and accrued expenses” account for the current portion, and “Noncurrent portion of obligation under finance lease” account for the noncurrent portion in the consolidated balance sheets. Lease payments are apportioned between the finance charges and reduction of the lease liability so as to achieve a constant rate of interest on the remaining balance of the liability. Finance charges are recognized under “Interest expense and bank charges” account in the consolidated statements of income.
Capitalized leased assets are depreciated over the shorter of the EUL of the assets and the respective lease terms.
Leases in which the Group does not transfer substantially all the risks and benefits of ownership of the assets are classified as operating leases. Operating lease payments are recognized as expense in profit or loss on a straight-line basis over the respective lease terms.
Impairment of Nonfinancial Assets The Group assesses, at each balance sheet date, whether there is an indication that a nonfinancial asset (e.g., deferred charges, property, plant and equipment, right-of-use assets and intangible assets) is impaired. If any indication exists, or when annual impairment testing for an asset is required, the Group estimates the asset’s recoverable amount. An asset’s recoverable amount is the higher of an asset’s or CGU’s fair value less costs to sell and its value-in-use. Recoverable amount is determined for an individual asset, unless the asset does not generate cash inflows that are largely independent of those from other assets or groups of assets. When the carrying amount of an asset or CGU exceeds its recoverable amount, the asset is considered impaired and is written down to its recoverable amount.
In determining fair value less costs to sell, recent market transactions are taken into account. If no such transactions can be identified, an appropriate valuation model is used. These calculations are corroborated by valuation multiples, quoted share prices for publicly traded companies or other available fair value indicators. In assessing value-in-use, the estimated future cash flows are discounted to their present value using a pre-tax discount rate that reflects current market assessments of the time value of money and the risks specific to the asset.
The Group bases its impairment calculation on detailed budgets and forecast calculations, which are prepared separately for each of the Group’s CGU to which the individual assets are allocated. These budgets and forecast calculations generally covered a period of five years.
For nonfinancial assets, excluding goodwill, an assessment is made at each balance sheet date to determine whether there is an indication that previously recognized impairment losses no longer exist or have decreased. If such indication exists, the Group estimates the asset’s or CGU’s recoverable amount. A previously recognized impairment loss is reversed only if there has been a change in the assumptions used to determine the asset’s recoverable amount since the last impairment loss was recognized. The reversal is limited so that the carrying amount of the asset does not exceed its recoverable amount, nor exceed the carrying amount that would have been determined, net of depreciation and amortization, had no impairment loss been recognized for the asset in prior years. Such reversal is recognized in profit or loss. After such reversal, the depreciation and amortization expense is adjusted in future periods to allocate the asset’s revised carrying amount, less any residual value, on a systematic basis over its remaining EUL.
All goodwill of the Group are tested for impairment annually as of December 31 and also tested for impairment when circumstances indicate that the carrying amount is impaired. Provisional goodwill allocated to a CGU is also tested for impairment even if the fair value exercise is not complete during the year.
Impairment is determined for goodwill by assessing the recoverable amount of each CGU (or group of CGUs) to which the goodwill relates. When the recoverable amount of the CGU is less than its carrying amount, an impairment loss is recognized. Impairment losses relating to goodwill cannot be reversed in future periods.
Provisions Provisions are recognized when the Group has a present obligation (legal or constructive) as a result of a past event, it is probable that an outflow of resources embodying economic benefits will be required to settle the obligation and a reliable estimate can be made of the amount of the obligation.
When the Group expects a provision to be reimbursed, the reimbursement is recognized as a separate asset, but only when the reimbursement is virtually certain.
If the effect of the time value of money is material, provisions are determined by discounting the expected future cash flows at a pre-tax rate that reflects the current market assessments of the time value of money and, when appropriate, the risks specific to the liability. When discounting is used, the increase in the provision due to the passage of time is recognized as interest expense.
Provisions are reviewed at each balance sheet date and adjusted to reflect the current best estimate.
Integrated mIcro-electronIcs, Inc.
40 Years of manufacturing technology and Innovation 40 Years of manufacturing technology and Innovation
2020 Integrated rePort
112 113

Equity Capital stock Capital stock is measured at par value for all shares issued and outstanding. When the Parent Company issues more than one class of stock, a separate account is maintained for each class of stock and the number of shares issued.
Preferred shares may be issued with various rights. In determining whether a preference share is financial liability or equity instrument, the issuer is required to assess the particular rights attaching to the share to determine whether it exhibits the fundamental characteristic of a financial liability. A preference share redeemable only at the holder’s option is an equity instrument because the issuer does not have a present or future obligation to transfer financial assets to the shareholder.
Additional paid-in capital Additional paid-in capital pertains to the difference of the par value and selling price of issued and outstanding shares of stock. Direct costs incurred related to equity issuance, such as underwriting, accounting and legal fees, printing costs and taxes are charged to “Additional paid-in capital” account. If additional paid-in capital is not sufficient, the excess is charged against “Retained earnings” account. The financial liabilities for the put options over the non-controlling interests are recognized at the acquisition date with a debit to additional paid-in capital. An increase or decrease in a parent’s ownership interest that does not result in a loss of control of a subsidiary is accounted for as an equity transaction, i.e. a transaction with owners in their capacity as owners. A parent’s ownership interest may change without a loss of control, e.g. when a parent buys shares from or sells shares to a non-controlling interest, a subsidiary redeems shares held by a non-controlling interest, or when a subsidiary issues new shares to a non-controlling interest. The carrying amounts of the controlling and non-controlling interests are adjusted to reflect the changes in their relative interests in the subsidiary. PFRS 10 states that ‘the entity shall recognize directly in equity any difference between the amount by which the non-controlling interests are adjusted and the fair value of the consideration paid or received, and attribute it to the owners of the parent. The Group recognize this difference under “Additional paid-in capital” account.
Subscriptions receivable Subscriptions receivable pertains to the uncollected portion of the subscribed shares.
Retained earnings and dividends on capital stock of the Parent Company Retained earnings represent net accumulated earnings of the Group, less dividends declared. Dividends on capital stock are recognized as a liability and deducted from equity when they are approved by Parent Company’s BOD.
Treasury stock Treasury stock is recorded at cost and is presented as a deduction from equity. When the shares are retired, the “Capital stock” account is reduced by its par value and the excess of cost over par value upon retirement is debited to “Additional paid-in capital” account to the extent of the specific or average additional paid-in capital when the shares were issued and to “Retained earnings” account for the remaining balance.
Revenue Recognition a) Revenue from contracts with customers
The Group is in the business of providing electronic manufacturing and other related services to various customers. Revenue from contracts with customers is recognized when control of the goods or services are transferred to the customer at an amount that reflects the consideration to which the Group expects to be entitled in exchange for those goods or services. The Group has concluded that it is the principal in its revenue arrangements because it controls the goods or services before transferring them to the customer.
Manufacturing of goods The Group provides manufacturing services in accordance with the customer’s specifications. The Group promises to provide a combined performance obligation comprised of non-distinct goods or services, which include issuance of materials to production, assembly, testing and packaging.
Contracts with customers are generally classified as turnkey or consignment. In a turnkey contract, the Group procures the materials and provides the assembly services to the customer. In a consignment contract, the Group only provides assembly services to the customer.
For turnkey contracts, revenue is recognized over time since the products created have no alternative use to the Group and the Group has right to payment for performance completed to date
including the related profit margin, in case of termination for reasons other than the Group’s failure to perform as promised.
For goods manufactured not covered by customer purchase orders or firm delivery schedule, revenues are recognized at a point in time, when control of the asset is transferred to the customer, generally when goods are shipped or goods are received by the customer, depending on the corresponding agreement with the customer.
For consignment contracts, revenue is recognized over time as services are rendered since the customer simultaneously receives and consumes the benefits as the Group performs.
Revenue from optical bonding technology and metal mesh touch sensors (VIA and VTS) Revenue from contracts with customers is recognized when control of the goods or services are transferred to the customer at an amount that reflects the consideration to which the Group expects to be entitled in exchange for those goods or services. The Group has concluded that it is the principal in its revenue arrangements because it typically controls the goods or services before transferring them to the customer. For optical bonding services performed under the consignment model, revenue is recognized at a point in time based on the fact that the assets created have alternative use to the Group entities. This is when the enhancement process is finalized, the customer removes the enhanced products from the consignment stock and is invoiced, according to contract. For the sale of products under the full service model, revenue is recognized at a point in time when control of the products are transferred to the customers, generally on delivery of the products.
Non-recurring engineering services Non-recurring engineering charges, tooling and other pre-production revenue stream (NREs) are recognized at a point in time since the criteria for over time recognition is not met. This is based on the assessment that while, in general, the Group has no alternative use for these NREs, either due to customization or restrictions by the customer, there is no assurance or relevant experience that IMI has enforceable right to payment or can recover the cost, plus reasonable margin, in case of contract termination. Point in time revenue recognition for NREs would mean revenue is recognized upon customer acceptance of the NREs (transfer of control).
The Group considers whether there are other promises in the contract that are separate performance obligations to which a portion of the transaction price needs to be allocated (e.g., customer options that provide material rights to customers, warranties). In determining the transaction price, the Group considers the effects of variable consideration, the existence of significant financing components, noncash consideration and consideration payable to the customer, if any. Variable consideration If the consideration in a contract includes a variable amount, the Group estimates the amount of consideration to which it will be entitled in exchange for transferring the goods to the customer. The variable consideration is estimated at contract inception and constrained until it is highly probable that a significant revenue reversal in the amount of cumulative revenue recognized will not occur when the associated uncertainty with the variable consideration is subsequently resolved.
Significant financing component The Group’s contracts with its customers are short-term in nature. Using the practical expedient in PFRS 15, the Group does not adjust the promised amount of consideration of the effects of a significant financing component if it expects, at contract inception, that the period between the transfer of the promised good or service to the customer and when the customer pays for that good or service will be one year or less.
The Group does not have significant separate performance obligations wherein the transaction price needs to be allocated as of December 31, 2020 and 2019.
b) Contract balances
Contract asset A contract asset is the right to consideration in exchange for goods or services transferred to the customer. If the Group performs by transferring goods or services to a customer before the customer pays consideration or before payment is due, a contract asset is recognized for the earned consideration that is conditional.
Integrated mIcro-electronIcs, Inc.
40 Years of manufacturing technology and Innovation 40 Years of manufacturing technology and Innovation
2020 Integrated rePort
114 115

Contract liability A contract liability is the obligation to transfer goods or services to a customer for which the Group has received consideration (or an amount of consideration is due) from the customer. If a customer pays consideration before the Group transfers goods or services to the customer, a contract liability is recognized when the payment is made or the payment is due (whichever is earlier). A contract liability is recognized as revenue when the Group performs under the contract.
c) Cost to obtain a contract
The Group pays sales commission to its employees for each contract that they obtain. The Group has elected to apply the optional practical expedient for costs to obtain a contract which allows the Group to immediately expense sales commissions (included under operating expenses) because the amortization period of the asset that the Group otherwise would have used is one year or less.
Other Income Interest income Interest income is recognized as it accrues using the EIR method.
Dividends Dividend income is recognized when the right to receive the payment is established.
Miscellaneous income Miscellaneous income is recognized as the Group earns the right over it. Expenses Cost of sales This account includes cost of goods sold and cost of services. These expenses pertain to the direct expenses incurred by the Group in relation to the products and services offered. Cost of sales is recognized when the related goods are sold and when services are rendered.
Operating expenses This account pertains to the general and administrative expenses. Operating expenses are recognized when incurred, except for short term and low value rental expense, which is computed on a straight line-basis over the lease term.
Government Grants Government grants are recognized where there is reasonable assurance that the grant will be received and all attached conditions will be complied with. When the grant relates to an expense item, it is initially recognized as a liability in the consolidated balance sheet and recognized as income on a systematic basis over the periods that the related costs, for which it is intended to compensate, are expensed. When the grant relates to the acquisition or construction of a fixed asset, it is initially recognized as a liability in the consolidated balance sheet and recognized as income in equal amounts over the period of depreciation of the related asset. Foreign Currency Transactions Functional currency is determined for each entity within the Group and items included in the financial statements of each entity are measured and recorded using that functional currency. For consolidation purposes, the foreign subsidiaries’ balances are translated to USD, which is the Parent Company’s functional and presentation currency.
Transactions in foreign currencies are initially recorded in the functional currency rate ruling at the date of the transaction. Monetary assets and liabilities denominated in foreign currencies are retranslated at the functional currency rate of exchange ruling at the balance sheet date. All differences are taken to profit or loss. Nonmonetary items that are measured in terms of historical cost in a foreign currency are translated using the exchange rate as at the date of initial transaction. Nonmonetary items measured at fair value in a foreign currency are translated using the exchange rate at the date when the fair value was determined.
The functional currencies of the Group’s foreign subsidiaries are summarized in Note 2 to the consolidated financial statements. As at the balance sheet date, the assets and liabilities of these subsidiaries are translated into the presentation currency of the Parent Company at the rate of exchange ruling at the balance sheet date and their profit and loss accounts are translated at the weighted average exchange rates for the year. The exchange differences arising on the translation are recognized in the consolidated statement of comprehensive income and reported as a separate component of equity.
Exchange differences arising from elimination of intragroup balances and intragroup transactions are recognized in profit or loss. As an exception, if the exchange differences arise from intragroup balances that, in substance, forms part of an entity’s net investment in a foreign operation, the exchange
differences are not to be recognized in profit or loss, but are recognized in OCI and accumulated in a separate component of equity until the disposal of the foreign operation.
On disposal of a foreign entity, the deferred cumulative amount recognized in the consolidated statement of comprehensive income relating to that particular foreign operation shall be recognized in profit or loss.
Income Taxes Current tax Current tax assets and current tax liabilities for the current and prior periods are measured at the amount expected to be recovered from or paid to the tax authorities. The tax rates and tax laws used to compute the amount are those that are enacted or substantively enacted as of the balance sheet date in the countries where the Group operates and generates taxable profit.
Current tax relating to items recognized directly in equity is recognized in equity and not in profit or loss. Management periodically evaluates positions taken in the tax returns with respect to situations in which applicable tax regulations are subject to interpretation and establishes provisions, when appropriate. Deferred tax Deferred tax is provided using the liability method on all temporary differences between the tax bases of assets and liabilities and their carrying amounts for financial reporting purposes as of the balance sheet date.
Deferred tax assets are recognized for all deductible temporary differences and carryforward benefits of unused tax losses, to the extent that it is probable that sufficient future taxable profits will be available against which the deductible temporary differences and carryforward benefits of unused tax losses can be utilized, except: When the deferred tax asset relating to the deductible temporary differences arises from the initial
recognition of an asset or liability in a transaction that is not a business combination and, at the time of the transaction, affects neither the accounting profit nor taxable profit or loss; and
In respect of deductible temporary differences associated with investments in subsidiaries, deferred tax assets are recognized only to the extent that it is probable that the temporary differences will reverse in the foreseeable future and sufficient future taxable profits will be available against which the temporary differences can be utilized.
The carrying amount of deferred tax assets is reviewed at each balance sheet date and reduced to the extent that it is no longer probable that sufficient future taxable profits will be available to allow all or part of the deferred tax assets to be utilized.
Deferred tax liabilities are recognized for all taxable temporary differences, except:
When the deferred tax liability arises from the initial recognition of goodwill or an asset or liability in
a transaction that is not a business combination and, at the time of the transaction, affects neither the accounting profit nor taxable profit or loss; and
In respect of taxable temporary differences associated with investments in subsidiaries, when the timing of the reversal of the temporary differences can be controlled and it is probable that the temporary differences will not reverse in the foreseeable future.
Deferred tax assets and deferred tax liabilities are measured at the tax rates that are expected to apply in the period when the asset is realized or the liability is settled, based on tax rates (and tax laws) that have been enacted or substantively enacted as of the balance sheet date.
Deferred tax relating to items recognized outside profit or loss is recognized outside profit or loss. Deferred tax items are recognized in correlation to the underlying transaction either in OCI or directly in equity.
Deferred tax assets and deferred tax liabilities are offset if a legally enforceable right exists to offset current tax assets against current tax liabilities and the deferred taxes relate to the same taxable entity and the same tax authority.
For periods where an Income Tax Holiday (ITH) is in effect, no deferred taxes are recognized in the consolidated financial statements as the ITH status of the Group neither results in a deductible temporary difference or taxable temporary difference. However, for temporary differences that are expected to reverse beyond the ITH, deferred taxes are recognized.
Earnings per Share (EPS) Attributable to Equity Holders of the Parent Company Basic EPS is computed by dividing net income attributable to common equity holders by the weighted average number of common shares outstanding and adjusted to give retroactive effect to any stock
Integrated mIcro-electronIcs, Inc.
40 Years of manufacturing technology and Innovation 40 Years of manufacturing technology and Innovation
2020 Integrated rePort
116 117

dividends declared during the period. Diluted EPS is computed by dividing net income attributable to common equity holders by the weighted average number of common shares outstanding, plus the weighted average number of common shares that would be issued on conversion of all the dilutive potential common shares. The calculation of diluted EPS does not assume conversion, exercise or other issue of potential common shares that would have an antidilutive effect on EPS.
Retirement and Other Employee Benefits Defined benefit plans The Parent Company, PSi, IMI BG and IMI Serbia maintain separate defined benefit plans covering substantially all of their employees. The plans of the Parent Company and PSi are funded and noncontributory retirement plans administered by their respective Boards of Trustees, while that of IMI BG and IMI Serbia is unfunded and noncontributory.
The cost of providing benefits under the defined benefit plans is actuarially determined using the projected unit credit method. This method reflects services rendered by employees up to the date of valuation and incorporates assumptions concerning employees’ projected salaries. Actuarial valuations are conducted with sufficient regularity, with the option to accelerate when significant changes to underlying assumptions occur.
Service costs which include current service costs, past service costs and gains or losses on non-routine settlements are recognized as expense in profit or loss. Past service costs are recognized when plan amendment or curtailment occurs.
Net interest on net retirement liabilities is the change during the period in net retirement liabilities that arises from the passage of time which is determined by applying the discount rate based on government bonds to net retirement liabilities. Net interest on retirement liabilities is recognized as expense or income in profit or loss.
Remeasurements comprising actuarial gains and losses, return on plan assets and any change in the effect of the asset ceiling (excluding net interest on net retirement liabilities) are recognized immediately in OCI in the period in which they arise. Remeasurements are not reclassified to profit or loss in subsequent periods.
Net retirement liabilities are the aggregate of the present value of the defined benefit obligation at the end of the balance sheet date reduced by the fair value of plan assets, adjusted for any effect of limiting a net retirement asset to the asset ceiling. The asset ceiling is the present value of any economic benefits available in the form of refunds from the plan or reductions in future contributions to the plan.
Plan assets are assets that are held by a long-term employee benefit fund. Plan assets are not available to the creditors of the Group, nor can they be paid directly to the Group. The fair value of plan assets is based on market price information. When no market price is available, the fair value of plan assets is estimated by discounting expected future cash flows using a discount rate that reflects both the risk associated with the plan assets and the maturity or expected disposal date of those assets (or, if they have no maturity, the expected period until the settlement of the related obligations).
Defined contribution plans The Parent Company’s subsidiaries in Singapore, China and Hong Kong, Czech Republic, Mexico, Germany, and UK participate in the respective national retirement schemes defined by the laws of the countries in which it has operations. These retirement schemes are considered as defined contribution plans. A defined contribution plan is a plan under which the subsidiary pays fixed contributions. Each subsidiary has no legal or constructive obligations to pay further contributions if the fund does not hold sufficient assets to pay all employees the benefits relating to employee service in the current and prior periods. The required contributions to the national retirement schemes are recognized as retirement expense as accrued.
Singapore The subsidiaries incorporated in Singapore make contributions to the Central Provident Fund (CPF) scheme in Singapore, a defined contribution scheme. Contributions to the CPF scheme are recognized as an expense in the period in which the related service is performed.
China The subsidiaries incorporated and operating in China are required to provide certain staff retirement benefits to their employees under existing China regulations, a defined contribution scheme. Retirement contributions are provided at rates stipulated by China regulations and are contributed to a retirement fund managed by government agencies, which are responsible for administering these amounts for the subsidiaries’ employees. Contributions to this defined contribution scheme are recognized as expense in the period in which the related service is performed.
Hong Kong The subsidiary in Hong Kong participates in the defined provident fund. The subsidiary and its employees make monthly contributions to the scheme at 5% of the employees’ earnings as defined under the Mandatory Provident Fund legislation. Contributions to this defined contribution scheme are recognized as expense in the period in which the related service is performed.
IMI CZ IMI CZ, under its collective agreement, is committed to pay contributions to life and retirement insurance of its loyal employees. This is done on a monthly basis as part of payroll expenses and only over the employment period. IMI CZ is not obliged to any other payments if employment terminates.
IMI MX In accordance with the Mexican Labor Law, IMI MX provides seniority premium benefits to its employees under certain circumstances. These benefits consist of a one-time payment equivalent to twelve days of wage for each year of service (at the employee’s most recent salary, but not to exceed twice the legal minimum wage), payable to all employees with fifteen or more years of service, as well as to certain employees terminated involuntarily prior to the vesting of their seniority premium benefit.
IMI MX also provides statutorily mandated severance benefits to its employees terminated under certain circumstances. Such benefits consist of a one-time payment of three months wages plus twenty days wages for each year of service payable upon involuntary termination without just cause. These are recognized when such an event occurs.
VIA VIA only has defined contribution plans relating to statutory pension. Funds paid by the employees and employers are not saved or invested but are used to pay current pension obligations. Obligations for contributions to defined contribution plans are recognized as an expense when incurred.
STI Contributions to defined contribution plans are recognized as an expense in the period in which the related service is provided. Prepaid contributions are recognized as an asset to the extent that the prepayment will lead to a reduction in future payments or a cash refund.
When contributions are not expected to be settled wholly within 12 months of the end of the reporting date in which the employees render the related service, the liability is measured on a discounted present value basis. The unwinding of the discount is recognized as a finance cost in profit or loss in the period in which it arises.
Employee leave entitlement Employee entitlements to annual leave are recognized as a liability when they accrue to the employees. The undiscounted liability for leave expected to be settled wholly before twelve months after the end of the balance sheet date is recognized for services rendered by employees up to the end of the balance sheet date.
Share-based Payment Transactions Certain employees (including directors) of the Group receive remuneration in the form of share-based payment transactions, whereby employees render services in exchange for shares or rights over shares (“equity-settled transactions”).
The Group has an employee stock ownership plan (ESOWN) which allows the grantees to purchase the Parent Company’s shares at a discounted price. The Group recognizes employee benefit expense over the holding period. The Group treats its ESOWN plan as option payable within a given period. These are accounted for similar to the methods outlined in PFRS 2. Dividends paid on the awards that have vested are deducted from equity while those paid on awards that are unvested are charged to profit or loss.
Operating Segments The Group is organized and managed separately according to geographical locations of businesses. The geographical segments are segregated as follows: Philippines, China, Europe, Mexico, Germany/UK, and USA/Japan/Singapore/IMI UK. These geographical businesses are the basis upon which the Group reports its operating segment information presented in Note 29.
Contingencies Contingent liabilities are not recognized in the consolidated financial statements. These are disclosed in the consolidated financial statements, unless the possibility of an outflow of resources embodying economic benefits is remote. Contingent assets are not recognized in the consolidated financial statements but are disclosed in the consolidated financial statements when an inflow of economic benefits is probable.
Integrated mIcro-electronIcs, Inc.
40 Years of manufacturing technology and Innovation 40 Years of manufacturing technology and Innovation
2020 Integrated rePort
118 119

Events after the Balance Sheet Date Post period events that provide additional information about the Group’s financial position at the balance sheet date (adjusting events) are reflected in the consolidated financial statements. Post period events that are non-adjusting events are disclosed in the consolidated financial statements when material.
4. Significant Accounting Judgments, Estimates and Assumptions
The preparation of the consolidated financial statements in conformity with PFRS requires management to make judgments, estimates and assumptions that affect the amounts reported in the consolidated financial statements and accompanying notes. Uncertainty about these judgments, assumptions and estimates could result in outcomes that require a material adjustment to the carrying amounts of assets and liabilities affected in future periods.
Judgments In the process of applying the Group’s accounting policies, management has made the following judgments, which have the most significant effect on the amounts recognized in the consolidated financial statements:
Determining the lease term of contracts with renewal and termination options - Group as lessee The Group determines the lease term as the non-cancellable term of the lease, together with any periods covered by an option to extend the lease if it is reasonably certain to be exercised, or any periods covered by an option to terminate the lease, if it is reasonably certain not to be exercised.
The Group has several lease contracts that include extension and termination options. The Group applies judgement in evaluating whether it is reasonably certain to exercise the option to renew or terminate the lease. That is, it considers all relevant factors that create an economic incentive for it to exercise the renewal or termination. After the commencement date, the Group reassesses the lease term if there is a significant event or change in circumstances that is within its control and affects its ability to exercise or not to exercise the option to renew or to terminate (e.g., a change in business strategy, construction of significant leasehold improvements or significant customization to the leased asset).
The Group’s leases consist mainly of land, production facilities and warehouses and office buildings (land and buildings). The Group included the renewal period as part of the lease term for leases of land and buildings due to the significance of these assets to its operations. These leases have a lease term of more than one year and there will be a significant negative effect on the business if a replacement is not readily available.
Operating lease commitments - Group as lessee (Prior to adoption of PFRS 16) The Group has entered into contracts with various lease contracts for office spaces and land. The Group has determined that all significant risks and rewards of ownership of these properties are retained by the lessor. Further details are disclosed in Note 30.
Revenue from contracts with customers Identifying contracts with customers
Generally, a valid and approved manufacturing service agreement (MSA), scheduling agreement (SA), customer accepted quote, customer forecast, and/or customer purchase order or firm delivery schedule will be in place before the Group provides services or manufacture goods for the customers. The Group is not obligated to transfer any goods or provide services until the customer submits a purchase order or firm delivery schedule under the MSA or SA, respectively. The purchase order or firm delivery schedule creates the enforceable rights and obligations and is therefore evaluated together with the MSA or SA for revenue recognition in accordance with PFRS 15.
Determining the timing of revenue recognition
The Group assessed that revenue from manufacturing of goods shall be recognized over time or point in time. For turnkey contracts wherein the products created have no alternative use to the Group and the Group has right to payment for performance completed to date including the related profit margin, in case of termination for reasons other than the Group’s failure to perform as promised, revenue is recognized over time. For goods manufactured not covered by customer purchase orders or firm delivery schedule, revenues are recognized at a point in time. For consignment contracts, revenue is recognized over time as services are rendered since the customer simultaneously receives and consumes the benefits as the Group performs.
Determining the method of measure of progress for revenue recognized over time
The Group measures progress towards complete satisfaction of the performance obligation using an input method (i.e., costs incurred). Management believes that this method provides a faithful depiction of the transfer of goods or services to the customer because the Group provides
integration service to produce a combined output and each item in the combined output may not transfer an equal amount of value to the customer.
Product development costs Expenditures for the development of new products or production systems are recognized as intangible assets if such expenditures, with a high degree of certainty, will result in future economic benefits for the Group. The rules require stringent criteria to be met for these development expenditures to be recognized as assets such as determining technical feasibility of completing the intangible asset. Management assessed that it is able to meet the identifiability and separability criteria provided in PAS 38, Intangible Assets, on the premise that the projects involved are in separate locations from other existing lines and that each project arises from a contractual right between the Group and each customer. Moreover, management is able to demonstrate that the projects are in the advanced stage of development.
Functional currency PAS 21, Effects of Changes in Foreign Exchange Rates, requires management to use its judgment to determine each entity’s functional currency such that it most faithfully represents the economic effects of the underlying transactions, events and conditions that are relevant to the Group. In making this judgment, each entity within the Group considers the currency in which the sales prices for its goods and services are denominated and settled.
Contingencies The Group is currently involved in various legal proceedings. The estimates of the probable costs of the resolutions and assessments of these claims have been developed in consultation with outside counsels handling the defense in these matters and are based upon analyses of potential results. The Group currently does not believe that these proceedings and tax assessments will have a material effect on the Group’s financial position. It is possible, however, that future results of operations could be materially affected by changes in the estimates or in the effectiveness of the strategies relating to these proceedings.
Further details are disclosed in Note 34. Estimates and Assumptions The key assumptions concerning the future and other key sources of estimation uncertainty at the balance sheet date that have a significant risk of causing a material adjustment to the carrying amounts of assets and liabilities within the next financial year are discussed below. The Group based its estimates and assumptions on parameters available when the consolidated financial statements were prepared. Existing circumstances and assumptions about future developments, however, may change due to market changes or circumstances arising beyond the control of the Group. Such changes are reflected in the assumptions when they occur.
Lease commitments - Group as lessee Leases - Estimating the incremental borrowing rate The Group cannot readily determine the interest rate implicit in the lease, therefore, it uses its incremental borrowing rate (IBR) to measure lease liabilities. The IBR is the rate of interest that the Group would have to pay to borrow over a similar term, and with a similar security, the funds necessary to obtain an asset of a similar value to the right-of-use asset in a similar economic environment. The IBR therefore reflects what the Group ‘would have to pay’, which requires estimation when no observable rates are available (such as for subsidiaries that do not enter into financing transactions) or when they need to be adjusted to reflect the terms and conditions of the lease (for example, when leases are not in the subsidiary’s functional currency). The Group estimates the IBR using observable inputs (such as market interest rates) when available and is required to make certain entity-specific estimates (such as the subsidiary’s stand-alone credit rating).
Fair value of the financial liabilities on put options The acquisition of VIA in 2016 and STI in 2017 included call and put options over the non-controlling interests. These options are considered when determining whether the entity has obtained control over the acquiree if in substance the entity already has access to the returns associated with that ownership interest. Management assessed that the options do not give the Group present access to the returns associated with the non-controlling interests in subsidiary and, therefore, accounted for the non-controlling interests under PFRS 10, while the financial liability was accounted for under PFRS 9 measured at the present value of the redemption amount, with a debit to a component of equity attributable to the parent.
Management assessed that the discounted, probability-weighted cash flow methodology is the appropriate model to derive the present value of the redemption amount. The key estimates and assumptions used in the valuation include impact of coronavirus pandemic, the current equity value of the acquiree, forecasted interest rate and probability of trigger events occurring. The equity value of
Integrated mIcro-electronIcs, Inc.
40 Years of manufacturing technology and Innovation 40 Years of manufacturing technology and Innovation
2020 Integrated rePort
120 121

VIA is determined using the discounted cash flow approach. The future cash flows are projected using the projected revenue growth rate of VIA. The discount rate represents the current market assessment of the risk specific to the acquiree, taking into consideration the time value of money and individual risks of the underlying assets that have not been incorporated in the cash flow estimates. The discount rate calculation is based on the specific circumstances of the acquiree and is derived from its weighted average cost of capital. For STI, management used the market approach by approximating the EBITDA multiple taken from comparable companies of STI that are engaged in providing electronic services solutions to derive its current equity value. Management computed EBITDA as the difference of forecasted gross profit and selling and administrative expenses before depreciation and amortization.
Further details on the valuation of the put options are disclosed in Notes 18 and 32.
Provision for expected credit losses of trade receivables and contract assets The Group uses a provision matrix to calculate ECLs for trade receivables and contract assets. The provision rates are based on days past due for groupings of various customer segments that have similar loss patterns (i.e., customer type and rating, and coverage by letters of credit and other forms of credit insurance, etc.). The provision matrix is initially based on the Group’s historical observed default rates. The Group will calibrate the matrix to adjust the historical credit loss experience with forward-looking information. For instance, if forecast economic conditions (i.e., industry compounded annual growth rate) are expected to deteriorate over the next year which can lead to an increased number of defaults in the manufacturing sector, the historical default rates are adjusted. At every reporting date, the historical observed default rates are updated and changes in the forward-looking estimates are analyzed. The assessment of the correlation between historical observed default rates, forecast economic conditions and ECLs is a significant estimate. The amount of ECLs is sensitive to changes in circumstances and of forecast economic conditions. The Group’s historical credit loss experience and forecast of economic conditions may also not be representative of customer’s actual default in the future. The Group has considered impact of COVID-19 pandemic and revised its assumptions in determining the macroeconomic variables and loss rates in the computation of ECL. The changes in the gross carrying amount of receivables from the sales of the Group during the year and impact of COVID-19 pandemic did not materially affect the allowance for ECLs.
Further details on the expected credit loss are disclosed in Note 6. Estimating NRV of inventories Inventories are valued at the lower of cost and NRV. This requires the Group to make an estimate of the inventories’ estimated selling price in the ordinary course of business, costs of completion and costs necessary to make a sale to determine the NRV. In line with the impact of COVID-19, the Group experienced lower demand and production that resulted to lower sales in 2020. In the event that NRV is lower than cost, the decline is recognized as an expense. Further details on inventories are disclosed in Note 8.
Depreciation and amortization The Group computes depreciation and amortization of property, plant and equipment, right-of-use assets and intangible assets with finite useful life on a straight-line basis over the assets’ EUL. The EUL and depreciation and amortization method are reviewed annually to ensure that these are consistent with the expected pattern of the economic benefits from the assets. This requires the Group to make an estimate of the expected asset utilization from business plans and strategies, future technical developments and market behavior to determine the expected pattern of economic benefits from the assets. Changes in the EUL or the expected pattern of consumption of future economic benefits embodied in the asset are considered to modify the depreciation and amortization period or method, as appropriate, and are treated as changes in accounting estimates. The depreciation and amortization expense on property, plant and equipment and intangible assets with finite useful lives are recognized in profit or loss, in the expense category, consistent with the function of the property, plant and equipment and intangible assets.
Further details on property, plant and equipment, right-of-use assets and intangible assets are disclosed in Notes 10, 30 and 12, respectively.
Evaluation of impairment of nonfinancial assets The Group reviews certain property, plant and equipment, right-of-use assets, goodwill, intangible assets and deferred charges, for impairment of value. Except for the impairment for goodwill which is assessed at least annually, the impairment evaluation for the other nonfinancial assets includes considering certain indications of impairment such as significant changes in asset usage, significant decline in assets’ market value, obsolescence or physical damage of an asset, significant underperformance relative to expected
historical or projected future operating results and significant negative industry or economic trends. Moreover, lockdown to Group manufacturing sites due to the impact of COVID-19 pandemic that leads to lower production post impairment indicators requiring the assessment of the recoverable amount for the said assets. The Group estimates the recoverable amount as the higher of the fair value less costs to sell and value-in-use. In determining the present value of estimated future cash flows expected to be generated from the continued use of the assets, the Group is required to make estimates and assumptions that may affect property, plant and equipment, right-of-use assets, intangible assets and deferred charges. For goodwill, this requires an estimation of the recoverable amount which is the fair value less costs to sell or value-in-use of the CGU to which the goodwill is allocated. Estimating a value-in-use amount requires management to make an estimate of the expected future cash flows for the cash generating unit and also to choose a suitable discount rate in order to calculate the present value of cash flows. Further details on property, plant and equipment, right-of-use assets, goodwill, intangible assets and deferred charges are disclosed in Notes 10, 30, 11, 12 and 14, respectively. Details of the impairment loss recognized are disclosed in Note 24.
Taxes Uncertainties exist with respect to the interpretation of complex tax regulations, changes in tax laws and the amount and timing of future taxable profits. Given the wide range of international business relationships and the long-term nature and complexity of existing contractual agreements, differences arising between the actual results and the assumptions made, or future changes to such assumptions, could necessitate future adjustments to tax income and expense already recorded. The Group establishes provisions, based on reasonable estimates, for possible consequences of audits by the tax authorities of the respective countries in which it operates. The amount of such provisions is based on various factors, such as experience on previous tax audits and differing interpretations of tax regulations by the taxable entity and the responsible tax authority. Such differences in interpretation may arise for a wide variety of issues depending on the conditions prevailing in the respective domicile of the entities within the Group.
Deferred tax assets are recognized for all deductible temporary differences and carryforward benefits of unused tax losses, to the extent that it is probable that sufficient future taxable profits will be available against which the deductible temporary differences and carryforward benefits of unused tax losses can be utilized. Significant judgment is required to determine the amount of deferred tax assets that can be recognized, based upon the likely timing and the level of future taxable profits together with future tax planning strategies.
Further details on taxes are disclosed in Note 25.
Retirement and other employee benefits The cost of defined benefit plans and other long-term employee benefits as well as the present value of defined benefit obligation are determined using actuarial valuations. An actuarial valuation involves making various assumptions. These include the determination of the discount rates, turnover rates, mortality rates, salary increase rates, and future retirement increases. Due to the complexity of the actuarial valuation, the underlying assumptions and its long-term nature, a defined benefit obligation is highly sensitive to changes in these assumptions. All assumptions are reviewed at each balance sheet date.
In determining the appropriate discount rate, management considers the interest rates of government bonds that are denominated in the currency in which the benefits will be paid, with extrapolated maturities corresponding to the expected duration of the defined benefit obligation. The turnover rate represents the proportion of the current plan members who will resign from service prior to their retirement date and hence, be entitled to resignation benefits instead of retirement benefits. The mortality rate is based on publicly available mortality tables and is modified accordingly with estimates of mortality improvements. Salary increase rates and future retirement increases are based on expected future inflation rates.
The Group also estimates other short-term employee benefit obligations and expenses, including the cost of paid leaves based on historical leave availments of employees, subject to the Group’s policies. These estimates may vary depending on the future changes in salaries, turn-over rates, mortality rates and actual experiences during the period.
Further details on retirement and other employee benefits are disclosed in Note 27.
Integrated mIcro-electronIcs, Inc.
40 Years of manufacturing technology and Innovation 40 Years of manufacturing technology and Innovation
2020 Integrated rePort
122 123

5. Cash and Cash Equivalents
This account consists of:
2020 2019 Cash on hand $70,169 $81,479 Cash in banks 244,285,256 127,288,749 Cash equivalents − 25,289,888 $244,355,425 $152,660,116
Cash in banks earns interest at the respective bank deposit rates. Short-term investments are made for varying periods of up to three months and earn interest at the respective short-term investment rates.
Interest income earned from cash in banks and short-term investments amounted to $0.33 million in 2020, $0.86 million in 2019 and $1.00 million in 2018.
Net proceeds from VIA’s IPO in 2020 amounted to $87.19 million, net of underwriting discounts and commissions, but before expenses. In addition, proceeds from separate concurrent private placement by Corning Research and Development Corporation on VIA shares amounted to $20 million ($19.6 million net of commissions) (see Note 19).
6. Receivables
This account consists of:
2020 2019 Trade $273,278,729 $284,594,422 Nontrade 2,825,231 6,080,113 Receivable from insurance 1,095,700 1,086,673 Receivable from employees 329,548 642,995 Due from related parties (Note 31) 299,253 439,973 Others 540,695 94,696 278,369,156 292,938,872 Less allowance for ECLs 2,747,365 2,295,511 $275,621,791 $290,643,361
Trade Trade receivables arise from manufacturing and other related services for electronic products and components and have credit terms averaging 70 days from invoice date.
Nontrade Nontrade receivables represent billings to customers for production and test equipment and all other charges agreed with the customers in carrying out business operations. These receivables have credit terms averaging 45 days from invoice date.
Receivable from Insurance Receivable from insurance pertains to claims for damages to equipment and inventories caused by a fire incident in the Parent Company’s plant in Cebu in 2009 amounting to $1.09 million and which was fully impaired as of December 31, 2020 and 2019.
Receivable from Employees Receivable from employees mostly pertain to non-interest bearing short-term loans granted to the Group’s employees which are collectible through salary deduction.
Allowance for ECLs Trade receivables, nontrade receivables and receivable from insurance with aggregate nominal value of $2.75 million and $2.30 million as of December 31, 2020 and 2019, respectively, were individually assessed to be impaired and fully provided with allowance for doubtful accounts.
Movements in the allowance for ECLs are as follows:
December 31, 2020
Trade Nontrade Receivable
from Insurance Total At beginning of year $1,051,715 $157,123 $1,086,673 $2,295,511 Provisions (Note 22) 574,495 − − 574,495 Foreign currency exchange
difference
(122,641) (9,027) 9,027
(122,641) At end of year $1,503,569 $148,096 $1,095,700 $2,747,365
December 31, 2019
Trade Nontrade Receivable
from Insurance Total At beginning of year $797,163 $160,516 $1,056,529 $2,014,208 Provisions (Note 22) 265,059 31,148 − 296,207 Accounts written-off (24,952) (5,349) − (30,301) Foreign currency exchange
difference
14,445 (29,192) 30,144
15,397 At end of year $1,051,715 $157,123 $1,086,673 $2,295,511
Provisions form part of “Operating expenses” account and are included under “Facilities costs and others” (see Note 22).
7. Contract Balances
This account consists of:
2020 2019 Contract assets $54,525,401 $58,908,123 Contract liabilities 1,515,095 4,742,170
Contract assets are initially recognized for revenue earned from manufacturing of goods as receipt of consideration is conditional on successful completion of the services. When goods are shipped or goods are received by the customer, depending on the corresponding agreement with the customers, the amounts recognized as contract assets are reclassified to trade receivables. Payments are received from customers depending on the credit terms. For the years ended December 31, 2020 and 2019, the Group did not recognize a provision for expected credit losses on contract assets. Contract liabilities includes short-term advances received to render manufacturing services. The significant decrease in contract liabilities was mainly due to lower advance payments received from new and existing customers towards the end of the year. The Group applied the practical expedient in PFRS 15 on the disclosure of information about the transaction price allocated to remaining performance obligations given the customer contracts have original expected duration of one year or less.
8. Inventories
This account consists of:
2020 2019 Raw materials and supplies $140,573,218 $149,038,976 Work-in-process 6,344,858 7,767,003 Finished goods 8,644,901 8,989,036 155,562,977 165,795,015 Less allowance for: Inventory obsolescence 13,151,796 13,072,876 Decline in value of inventories 95,126 92,867 13,246,922 13,165,743 $142,316,055 $152,629,272
Integrated mIcro-electronIcs, Inc.
40 Years of manufacturing technology and Innovation 40 Years of manufacturing technology and Innovation
2020 Integrated rePort
124 125

The cost of the inventories carried at NRV amounted to $46.67 million and $46.90 million as of December 31, 2020 and 2019, respectively. The amount of inventories recognized as an expense under “Cost of sales” account amounted to $796.04 million in 2020, $888.42 million in 2019, and $952.19 million in 2018 (see Note 20).
Balance of work-in-process and finished goods inventories pertain to VIA’s sale of product under the full service model since VIA typically controls the goods before transferring them to customers and therefore revenue is recognized at a point in time upon the delivery of products.
Movements in the allowance for inventory obsolescence follows:
2020 2019 At beginning of year $13,072,876 $8,473,726 Provisions (reversals) (Note 22) (291,526) 4,599,150 Foreign currency exchange difference 370,446 − At end of year $13,151,796 $13,072,876
Movements in the allowance for decline in value of inventories value follows:
2020 2019 At beginning of year $92,867 $172,389 Provisions (reversals) (Note 22) 2,259 (79,522) At end of year $95,126 $92,867
The Group recognized gains from sale of materials and scrap amounting to $0.04 million in 2020, $0.03 million in 2019, and $0.82 million in 2018. Gains from sale of materials and scrap are included under “Miscellaneous income (loss) - net” account in the consolidated statements of income (see Note 24).
9. Other Current Assets
This account consists of:
2020 2019 Prepayments and deferred charges $5,807,226 $11,113,227 Advances to suppliers 5,437,643 2,893,138 Input taxes 3,709,501 2,538,002 Tax credits 2,007,747 2,547,694 Derivative assets (Note 33) − 5,321 Others 393,193 9,010 $17,355,310 $19,106,392
Prepayments and Deferred Charges Prepayments include prepayments for rent, life and fire insurance and prepaid insurance for product liability and recall which covers product recall expenses and potential liability to third parties seeking damage if the Group recalls any of its products. This also includes prepaid intellectual property rights and financing transaction costs and deferred charges related to capital raising activity. In 2020, the prepayment pertaining to IPO transaction costs was charged to equity upon IPO of VIA. Advances to Suppliers This account represents advance payments made to suppliers for purchase of direct materials.
Input Taxes This account includes input tax expected to be applied against output tax within 12 months from the balance sheet date. Input tax is recognized when an entity in the Group purchases goods or services from a supplier or vendor. Tax Credits Tax credits represent recoverable taxes of IMI MX and BG such as VAT refundable and business tax and amounts withheld from income tax payments of the Parent Company and PSi.
10. Property, Plant and Equipment
Movements in this account follows:
2020
Buildings and
Improvements
Machineries and Facilities
Equipment
Furniture, Fixtures
and Office Equipment
Transportation Equipment
Tools and Instruments
Construction in Progress Total
Cost At beginning of year $98,810,242 $214,876,716 $24,812,986 $2,490,664 $10,292,763 $4,433,974 $355,717,345 Additions 2,173,444 4,550,405 549,379 405,134 825,140 9,617,598 18,121,100 Disposals/retirement (718,140) (8,396,245) (1,698,207) (432,735) (94,342) – (11,339,669)Transfers (Notes 12 and 14) 2,698,514 4,459,496 (1,498,556) 53,450 (1,176,201) (8,245,470) (3,708,767)Foreign currency exchange
difference 3,758,216 9,281,484 981,754 144,139 94,018 402,257
14,661,868 At end of year 106,722,276 224,771,856 23,147,356 2,660,652 9,941,378 6,208,359 373,451,877 Accumulated depreciation At beginning of year 38,011,962 98,328,542 18,642,159 1,226,971 3,481,051 – 159,690,685 Depreciation 6,597,929 28,789,323 1,882,472 512,201 376,222 – 38,158,147 Disposals/retirement (668,833) (7,613,276) (1,693,083) (397,825) (94,342) – (10,467,359)Transfers (Note 12) – – (1,152,456) – – – (1,152,456)Foreign currency exchange
difference 557,358 4,017,755 162,325 95,897 85,566
–
4,918,901 At end of year 44,498,416 123,522,344 17,841,417 1,437,244 3,848,497 – 191,147,918
Accumulated impairment losses
At beginning and end of year – 1,732,212 – – – – 1,732,212 Impairment loss (Note 24) – 2,620,779 – – – – 2,620,779 At end of year – 4,352,991 – – – – 4,352,991 Net book value $62,223,860 $96,896,521 $5,305,939 $1,223,408 $6,092,881 $6,208,359 $177,950,968
2019
Buildings and
Improvements
Machineries and Facilities
Equipment
Furniture, Fixtures
and Office Equipment
Transportation Equipment
Tools and Instruments
Construction in Progress Total
Cost At beginning of year, as
previously stated $92,595,629 $188,629,382 $25,215,170 $2,457,369 $9,034,650 $13,547,924 $331,480,124 Effects of finalization of
business combination 17,673 6,692,850 59,246 – – – 6,769,769 At beginning of year, as
restated 92,613,302 195,322,232 25,274,416 2,457,369 9,034,650 13,547,924 338,249,893 Additions 5,028,622 21,801,433 1,354,800 348,897 1,406,714 7,457,591 37,398,057 Disposals/retirement (14,457) (13,755,433) (2,223,490) (303,371) (292,879) – (16,589,630) Transfers 1,999,274 13,668,702 535,160 22,211 159,751 (16,385,098) – Foreign currency exchange
difference (816,499) (2,160,218) (127,900) (34,442) (15,473) (186,443)
(3,340,975) At end of year 98,810,242 214,876,716 24,812,986 2,490,664 10,292,763 4,433,974 355,717,345 Accumulated depreciation At beginning of year, as
previously stated 31,674,062 83,586,109 18,308,498 942,347 3,494,764 – 138,005,780 Effects of finalization of
business combination 1,325 1,673,213 8,887 – – – 1,683,425 At beginning of year, as
restated 31,675,387 85,259,322 18,317,385 942,347 3,494,764 – 139,689,205 Depreciation 6,188,538 25,581,603 2,691,888 583,575 262,416 – 35,308,020 Depreciation capitalized as
development cost 295,704 1,225,787 13,203 – 33,204
–
1,567,898 Disposals/retirement (2,528) (13,068,055) (2,201,573) (272,443) (281,439) – (15,826,038) Foreign currency exchange
difference (145,139) (670,115) (178,744) (26,508) (27,894)
–
(1,048,400) At end of year 38,011,962 98,328,542 18,642,159 1,226,971 3,481,051 – 159,690,685
Accumulated impairment losses
At beginning and end of year – 1,732,212 – – – – 1,732,212 Net book value $60,798,280 $114,815,962 $6,170,827 $1,263,693 $6,811,712 $4,433,974 $194,294,448
The Group capitalized depreciation related to development phase for certain projects amounting to nil in 2020 and $1.57 million in 2019. The capitalized cost is included as part of product development under “Intangible assets” account. During the year, the Company transferred property, plant and equipment with a net book value of $2.56 million to “Other noncurrent assets” representing deferred tooling charges, and licenses to “Intangible assets” account amounting to $2.11 million and $0.44 million, respectively (see Note 12).
Integrated mIcro-electronIcs, Inc.
40 Years of manufacturing technology and Innovation 40 Years of manufacturing technology and Innovation
2020 Integrated rePort
126 127

Due to declining demand brought by the global automotive downturn, the Group recognized impairment losses on certain machineries amounting to $2.62 million in 2020 (see Note 24).
Construction in progress pertains to the construction and development of manufacturing production lines of the Group. Construction in progress transferred to property, plant and equipment amounted to $8.25 million and $16.39 million as of December 31, 2020 and 2019, respectively.
The Group recognized gains from disposal and retirement of certain property, plant and equipment amounting to $0.66 million in 2020, $0.10 million in 2019, and $0.19 million in 2018 (see Note 24).
As of December 31, 2020 and 2019, the cost of fully depreciated property, plant and equipment still being used by the Group amounted to $71.43 million and $75.20 million, respectively. Depreciation expense included in “Cost of sales” and “Operating expenses” accounts follows:
2020 2019 2018 Cost of sales (Note 20) $34,148,037 $30,961,361 $26,080,694 Operating expenses (Note 21) 4,010,110 4,346,659 5,016,589 $38,158,147 $35,308,020 $31,097,283
The Group has no restrictions on its property and equipment and none of these have been pledged as security for its obligations.
11. Goodwill
Goodwill acquired through business combinations had been allocated to the following CGUs:
2020 2019 STI $58,637,679 $56,627,517 VIA 48,728,404 44,324,971 STEL 38,225,186 38,225,186 Parent Company 1,097,776 1,097,776 IMI CZ 556,049 505,801 $147,245,094 $140,781,251
Movement in goodwill follows:
2020 2019 Cost At beginning of year $147,684,089 $147,354,138 Foreign currency exchange difference 6,463,843 329,951 At end of year 154,147,932 147,684,089 Accumulated impairment loss At beginning and end of year 6,902,838 6,902,838 $147,245,094 $140,781,251
STI, VIA, STEL and IMI CZ The recoverable amounts of these CGUs have been based on value-in-use calculations using cash flow projections from financial budgets approved by management covering a five (5)-year period. The pre-tax discount rates applied to cash flow projections follows:
2020 2019 STI 10.11% 9.47% VIA 11.45% 12.78% STEL 12.85% 12.36% IMI CZ 10.60% 7.90%
Cash flows beyond the 5-year period are extrapolated using a steady growth rate of 1%, which does not exceed the compound annual growth rate (CAGR) for the global electronics manufacturing services (EMS) industry, specifically on automotive, industrial equipment, consumer electronics and telecommunications segments.
Key assumptions used in the value-in-use calculations The calculations of value-in-use for the CGUs are most sensitive to the following assumptions: Revenue - Revenue forecasts are management’s best estimates considering factors such as industry
CAGR, existing customer contracts and projections, historical experiences and other economic factors.
Forecasted gross margins - Gross margins are based on the mix of business model arrangements with the customers.
Overhead and administrative expenses - estimates are based on applicable inflation rates in the respective countries of the cash generating units considering expected future cost efficiencies and production facilities rationalization.
Pre-tax discount rates - Discount rates represent the current market assessment of the risks specific to each CGU, taking into consideration the time value of money and individual risks of the underlying assets that have not been incorporated in the cash flow estimates. This is also the benchmark used by management to assess operating performance. The discount rate calculation is based on the specific circumstances of the Group and its operating segments and is derived from its weighted average cost of capital.
No impairment loss was assessed for STI, VIA and IMI CZ in 2020, 2019 and 2018.
For STEL, the assessment resulted to an impairment loss of $6.90 million in 2018 triggered by slowing growth in the region. The impairment loss is included under “Miscellaneous income (loss) - net” account in the consolidated statements of income (see Note 24). In 2020 and 2019, despite the weak economy and impact of the pandemic, management assessed that no additional impairment loss should be recognized given the strategies in place to improve the financial performance and lower discount rates.
Sensitivity to changes in assumptions With regard to the assessment of value-in-use of STI, VIA and IMI CZ, management believes that no reasonably possible change in any of the above key assumptions would cause the carrying value of these CGUs to exceed their recoverable amount.
Parent Company The goodwill of the Parent Company pertains to its acquisition of M. Hansson Consulting, Inc. (MHCI) in 2006 and IMI USA in 2005. MHCI was subsequently merged to the Parent Company as testing and development department. IMI USA acts as direct support to the Group’s customers by providing program management, customer service, engineering development and prototyping manufacturing services. IMI USA’s expertise in product design and development particularly on the flip chip technology is being used across the Group in providing competitive solutions to customers. In 2018, the recoverable amount was based on the market price of the Parent Company’s shares at valuation date, less estimated costs to sell. The fair value of the Parent Company’s shares represents the value of the Group. In 2020 and 2019 given the volatile market, the Group assessed the impairment based on value-in-use calculations using cash flow projections of the Parent Company from financial budgets approved by management covering a 5-year period. The comparison of the recoverable amounts and the carrying amounts resulted to no impairment loss in 2020, 2019 and 2018.
12. Intangible Assets
Movements in this account are as follows:
December 31, 2020
Customer
Relationships Unpatented Technology Licenses
Intellectual Properties
Product Development
Costs Total Cost At beginning of year $22,046,083 $100,000 $13,858,721 $14,521,541 $20,599,131 $71,125,476 Additions – – 595,188 – – 595,188 Transfers (Note 10) – – 442,001 – – 442,001 Foreign currency exchange
difference 196,017 – 584,334 (44,291) – 736,060 At end of year 22,242,100 100,000 15,480,244 14,477,250 20,599,131 72,898,725 Accumulated amortization At beginning of year 20,599,134 100,000 9,936,846 6,161,827 5,226,127 42,023,934 Amortization 828,554 – 1,084,613 2,372,035 3,593,966 7,879,168 Foreign currency exchange
difference 52,271 – 494,552 84,481 – 631,304 At end of year 21,479,959 100,000 11,516,011 8,618,343 8,820,093 50,534,406 Accumulated impairment loss At beginning of year – – – – 524,705 524,705 Impairment loss (Note 24) – – – – 4,693,985 4,693,985 At end of year – – – – 5,218,690 5,218,690 Net book value $762,141 $– $3,964,233 $5,858,907 $6,560,348 $17,145,629
Integrated mIcro-electronIcs, Inc.
40 Years of manufacturing technology and Innovation 40 Years of manufacturing technology and Innovation
2020 Integrated rePort
128 129

December 31, 2019
Customer
Relationships Unpatented Technology Licenses
Intellectual Properties
Product Development
Costs Total Cost At beginning of year, as
previously stated $19,666,617 $100,000 $13,439,236 $13,868,690 $16,510,367 $63,584,910 Effects of finalization of
business combination 2,438,129 – – – – 2,438,129 At beginning of year, as
restated 22,104,746 100,000 13,439,236 13,868,690 16,510,367 66,023,039 Additions – – 573,704 814,777 – 1,388,481 Capitalized development costs – – – – 4,088,764 4,088,764 Foreign currency exchange
difference (58,663) – (154,219) (161,926) – (374,808) At end of year 22,046,083 100,000 13,858,721 14,521,541 20,599,131 71,125,476 Accumulated amortization At beginning of year, as
previously stated 19,666,617 100,000 8,260,262 4,428,684 2,815,074 35,270,637 Effects of finalization of
business combination 406,355 – – – – 406,355 At beginning of year, as
restated 20,072,972 100,000 8,260,262 4,428,684 2,815,074 35,676,992 Amortization 530,132 – 1,762,098 1,761,638 2,411,053 6,464,921 Foreign currency exchange
difference (3,970) – (85,514) (28,495) – (117,979) At end of year 20,599,134 100,000 9,936,846 6,161,827 5,226,127 42,023,934 Accumulated impairment loss – – – – 524,705 524,705 Net book value $1,446,949 $– $3,921,875 $8,359,714 $14,848,299 $28,576,837
Customer Relationships Customer relationships pertain to STEL Group, IMI BG and VTS’ contractual agreements with certain customers, which lay out the principal terms upon which the parties agree to undertake business.
Customer relationships of STEL Group and IMI BG aggregating to $19.67 million were fully amortized as of December 31, 2020, 2019 and 2018.
In 2018, the acquisition of VTS gave rise to identification and valuation of customer relationships that were not recognized as internally-developed intangible assets. The net book value of the customer relationships acquired through business combination (VTS) restated as of December 31, 2018 amounted to $2.03 million, net of accumulated amortization and foreign currency revaluation.
Licenses This includes acquisitions of computer software, applications and modules. Intellectual Properties The Group’s intellectual properties relate to the acquisition of VIA and VTS. VIA’s intellectual properties pertain to display system optically bonded to a display region and enhanced liquid crystal display system and methods. The finalization of the purchase price allocation for the acquisition of VIA resulted to the measurement of intellectual properties at fair value amounting to $7.85 million.
Acquisition through business combination in connection with the establishment of VTS amounted to ¥568.68 million ($5.26 million). Toppan has agreed to transfer to VTS the intellectual property (technology) relevant to run the business.
As of December 31, 2020 and 2019, the carrying value of VIA and VTS’s intellectual properties amounted to $4.23 million and $5.15 million, respectively.
Product Development Costs This includes capitalized costs arising from the development phase of certain projects which are still undergoing qualification.
Intangible assets not yet available for use are tested for impairment following the value-in-use approach. The recoverable amounts of these product development costs and related property, plant and equipment have been determined using cash flow projections from financial budgets approved by management covering a 5-year period, which is within the expected life cycle of the projects. The pre-tax discount rates applied to cash flow projections range from 10.28% to 10.68%. Key assumptions used in the value-in-use calculations are consistent with those disclosed in Note 11.
Significant delay in the ramp up of certain projects and declining demand brought by the global automotive downturn resulted to impairment of the related capitalized development cost. Impairment loss amounting to $4.69 million was recognized under “Miscellaneous income (loss) - net” account in 2020 (see Note 24).
Research expenditure recognized as expense amounted to $4.94 million, $0.85 million, and $2.37 million in 2020, 2019 and 2018, respectively.
Amortization expense included in “Cost of sales” and “Operating expenses” accounts follows:
2020 2019 2018 Cost of sales (Note 20) $3,810,122 $2,614,302 $3,088,002 Operating expenses (Note 21) 4,069,046 3,850,619 3,352,282 $7,879,168 $6,464,921 $6,440,284
13. Financial assets at Fair Value through Other Comprehensive Income (FVOCI)
The fair value of each of the investments in equity instruments designated at fair value through other comprehensive income at the end of the reporting period is as follows:
2020 2019 Club shares - quoted $1,124,461 $1,199,763
The table below shows reconciliation of fair value measurements:
2020 2019 Balance at beginning of year $1,199,763 $1,076,455 Change in fair value of quoted securities (75,302) 123,308 Balance at end of year $1,124,461 $1,199,763
14. Other Noncurrent Assets
This account consists of:
2020 2019 Deferred charges $18,203,997 $20,080,285 Miscellaneous deposits 1,547,045 1,558,138 Others 130,996 259,709 $19,882,038 $21,898,132
Deferred charges represent tooling items customized based on the specifications of the customers and to be repaid as part of the price of the manufactured items.
Miscellaneous deposits comprise utilities and rent deposits.
15. Accounts Payable and Accrued Expenses
This account consists of:
2020 2019 Trade payables $176,556,142 $188,022,901 Accrued expenses 33,117,472 24,687,733 Employee-related accruals 22,993,540 21,443,971 Nontrade payables 15,625,138 26,994,655 Taxes and government-related payables 3,100,732 1,272,642 Advances from customers 1,288,622 934,975 Accrued interest payable 821,933 2,364,614 Customer deposits 230,701 878,202 Due to related parties (Note 31) 27,333 2,024 Others 63,315 470,296 $253,824,928 $267,072,013
Trade Payables Trade payables are noninterest-bearing and are normally settled on 30 to 90-day average terms. Accrued Expenses Accrued expenses consist mainly of accruals for taxes, supplies, professional fees, utilities, insurance, and freight and brokerage.
Integrated mIcro-electronIcs, Inc.
40 Years of manufacturing technology and Innovation 40 Years of manufacturing technology and Innovation
2020 Integrated rePort
130 131

Employee-Related Accruals This account consists mainly accrued compensation and benefits including accrued salaries, leave credits and other employee benefits. Nontrade Payables This account consists of obligations related to outsourced manpower, logistics and freight forwarders, professional and service fees and other nontrade related payables. These payables are normally settled on 30 to 60-day terms. Taxes and Government-related Payables Taxes payable pertain to taxes due other than corporate income tax and remittances related to government agencies such as social security and insurance, housing fund and health insurance. Advances from Customers Advances from customers include financial liabilities pertaining to commercial agreements with certain customers of VIA. Customer Deposits Customer deposits pertain to advance payment from customers as manufacturing bond. Others This account consists of unreleased checks and consignment payables of the Parent Company for the materials received from its customers.
16. Loans Payable
This account consists of borrowings of the following entities:
2020 2019 Parent Company $143,000,000 $72,000,000 STEL 35,500,000 25,901,039 VIA and STI 27,110,927 28,150,508 CZ 879,500 − $206,490,427 $126,051,547
Parent Company As of December 31, 2020 and 2019, the Parent Company has unsecured short-term loans aggregating to $143.00 million and $72.00 million, respectively, with maturities ranging from 30 to 94 days, and fixed annual interest rates ranging from 1.42% to 2.94% in 2020, 2.45% to 2.95% in 2019, and 2.50% to 3.12% in 2018.
The Parent Company incurred interest expense on its short-term loans amounting to $3.23 million in 2020, $1.67 million in 2019, and $2.68 million in 2018 (see Note 23).
STEL As of December 31, 2020 and 2019, STEL has short-term loans aggregating to $35.50 million and $25.90 million, respectively, are from existing revolving credit facilities with Singapore-based banks and bear annual interest rate from 2.93% to 4.46% in 2020, 3.46% to 4.64% in 2019, and 4.02% to 5.32% in 2018, and have maturities of 91 to 92 days from the date of issue. STEL incurred interest expense on short-term loans amounting to $1.28 million in 2020, $1.51 million in 2019, and $1.29 million in 2018 (see Note 23). VIA & STI The loans of VIA and STI were obtained from China, Germany and UK-based banks with terms ranging from 90 to 365 days and interest rates ranging from 1.16% to 4.0% in 2020 and 2.91% to 5.0% in 2019. VIA has pledged a portion of its trade accounts receivable, up to amounts drawn under the respective loans, in support of the obligations. The carrying value of the related trade receivables factored amounted to $21.09 million and $17.58 million as of December 31, 2020 and 2019, respectively. VIA and STI incurred interest expense on the short-term loan amounting to $1.47 million, $1.29 million and $1.39 million in 2020, 2019 and 2018, respectively (see Note 23).
IMI CZ The loans of IMI CZ are clean loans from existing revolving credit facilities with Czech-based bank which bear annual interest based on 1-month EURIBOR plus 0.9%. IMI CZ incurred interest expense on short-term loans amounting to $0.01 million in 2020, $0.01 million in 2019 and $0.02 million in 2018 (see Note 23).
17. Long-Term Debt
This account consists of borrowings of the following entities:
2020 2019 Parent Company $29,795,564 $135,835,000 VTS and IMI CZ 4,524,361 6,588,815 34,319,925 142,423,815 Less current portion: Parent Company – 25,830,000 VTS and IMI CZ 2,109,394 2,207,902 2,109,394 28,037,902 Noncurrent portion $32,210,531 $114,385,913
Parent Company The long-term debts of the Parent Company aggregating to $30 million ($29.80 million if net of discount) and $135.84 million as of December 31, 2020 and 2019, respectively, were obtained from Singapore-based and Philippine banks with terms of three to five years, subject to fixed annual interest rate of 3.798% in 2020 and interest ranging from 2.70% to 3.41% in 2019.
Loan covenants related to the Parent Company’s loans are as follows:
The ratio of net debt to equity shall not exceed 1.75:1 with reference to the borrower’s consolidated
financial statements; Maintenance of debt service coverage ratio of at least 1.25:1 on the consolidated financial
statements; Maintenance at all times of a current ratio of at least 1:1 on the parent financial statements;
As of December 31, 2020 and 2019, the Parent Company has complied with all of the above-mentioned loan covenants.
The Parent Company incurred interest expense on its long-term loans amounting to $2.36 million in 2020, $5.70 million in 2019, and $5.00 million in 2018 (see Note 23).
VTS and IMI CZ VTS and IMI CZ have unsecured long-term loans with Japanese and Czech-based banks that are payable in regular monthly installments both with terms of five years. The VTS loan has interest rate ranging 1.67% while the CZ loan bears interest based on 1-month EURIBOR plus 0.9% but is not to exceed 15% per annum. VTS and IMI CZ incurred interest expense on its long-term debt amounting to $0.06 million, $0.08 million and $0.06 million in 2020, 2019 and 2018, respectively (see Note 23).
18. Other Financial Liabilities
The account consists of:
2020 2019 Put options over non-controlling interests (Note 32) STI $1,592,518 $5,477,227 VIA – 16,892,858 Derivative liabilities (Note 33) 88,361 – $1,680,879 $22,370,085
Put options over non-controlling interests The put options of VIA pertain to the right of the non-controlling shareholder to sell to IMI a portion of its shareholding that is approximately 5% of the issued and outstanding nominal share capital of VIA within the first and third anniversary of the agreement (5% put option) and all remaining shares held by the non-controlling shareholder upon the happening of certain trigger events (exit put options). The 5%
Integrated mIcro-electronIcs, Inc.
40 Years of manufacturing technology and Innovation 40 Years of manufacturing technology and Innovation
2020 Integrated rePort
132 133

put option is exercisable any time between the 1st and 3rd anniversary of the agreement or if prior to the 3rd anniversary, the share capital of VIA is increased, the 5% put option may be exercised within three months from registration of the capital increase. The exit put options are exercisable when there is a termination for a cause of the service agreement or the share capital of VIA is increased that will dilute the holding of non-controlling interest to below 10%.
In 2020, the put options of VIA was terminated in accordance with the amendment in the shareholders’ agreement. Triggered by VIA’s IPO, the balance of $15.33 million liability before the termination was closed to equity under “Additional paid-in capital” account (see Note 19).
The put option of STI pertains to the right of the non-controlling shareholder to sell to IMI all non-controlling interests held upon the happening of certain trigger events as specified in the shareholders agreement. The put option of STI is exercisable during the period commencing upon the earlier of: (1) No Fault Leaver Event (i.e., First Founder of STI ceases to be an employee of a member of the STI Group) occurring in respect of a Founder, (2) the aggregate relevant proportion of the Founders falling to less than 5%, or (3) the fifth anniversary of the service agreement.
The value of put options of STI amounted to $1.59 and $5.48 million as of December 31, 2020 and 2019, respectively.
Mark-to-market gains (loss) on put options included under “Miscellaneous income (expense) - net” account amounted to $6.07 million in 2020, $3.45 million in 2019 and ($5.37) million in 2018 (see Note 24).
Contingent consideration The contingent consideration is part of the cost of acquisition of STI and is valued based on the actual normalized EBITDA performance. In 2018, the Group reversed $21.30 million contingent liability. The remaining balance of $3.73 million was reversed in full in 2019 and was included under “Miscellaneous income (expense) - net” account (see Note 24).
19. Equity
Capital Stock This account consists of:
2020 2019 2018
Shares Amount Shares Amount Shares Amount Authorized - P=1 par value Common 2,250,000,000 2,250,000,000 2,250,000,000 Preferred 200,000,000 200,000,000 200,000,000
Issued - Common At beginning of year 2,191,273,522 $42,674,027 2,190,076,503 $42,648,042 1,829,892,224 $35,709,679 Issuances from ESOWN 41,765 903 1,197,019 25,985 10,184,279 220,513 Issuance from stock rights offer – – – – 350,000,000 6,717,850 At end of year* 2,191,315,287 $42,674,930 2,191,273,522 $42,674,027 2,190,076,503 $42,648,042 * Out of the total issued shares, 15,892,224 shares or $1.01 million as of December 31, 2020, 2019 and 2018 pertain to treasury shares.
On January 30, 2018, IMI obtained the approval of the PSE for a stock rights offer of up to 350,000,000 new common shares to eligible shareholders. Under the rights offer, each shareholder is entitled to subscribe to one rights share for every 5.3551 existing common shares held as of record date February 14, 2018. The offer price was determined to be at P=14.28 per rights share which was based on the 30-day volume-weighted average price of IMI common shares listed at the PSE as of February 7, 2018 at a discount of 25.3%. On March 2, 2018, the Parent Company completed the offer and the listing of the shares, raising P=5.00 billion ($95.93 million) of proceeds to fund capital expenditures and support business expansions and refinance debts. The Parent Company has 2,190,076,503 issued and outstanding shares after the offer.
As of December 31, 2020, 2019 and 2018, there were 288, 287 and 295 registered common stockholders, respectively.
Subscribed Capital Stock Subscribed capital pertains to subscriptions relating to the ESOWN of the Group.
Details of this account follow:
2020 2019 2018
Shares Amount Shares Amount Shares Amount At beginning of year 33,308,281 $752,560 36,177,963 $815,198 47,403,889 $1,058,278 Issuances during the year - ESOWN (41,765) (903) (1,197,019) (25,985) (10,184,279) (220,513)
Forfeitures during the year - ESOWN (315,235) (6,834) (1,672,663) (36,653) (1,041,647) (22,567) At end of year 32,951,281 $744,823 33,308,281 $752,560 36,177,963 $815,198
Additional Paid-in Capital VIA Initial Public Offering On September 25, 2020, VIA Optronics, a 76%-owned German subsidiary of IMI, raised some proceeds through an initial public offering (IPO) and was listed on the New York Stock Exchange under the ticker symbol “VIAO”. The IPO involves issuance of 6,250,000 American Depositary Shares (ADSs), representing 1,250,000 ordinary shares at a public offering price of $15.00 per ADS, for gross proceeds of $93.75 million (net proceeds of $87.19 million after deducting underwriting discounts and commissions). Corning Research & Development Corporation (“Corning”), one of VIA’s commercial partners, has also agreed to purchase additional 1,403,505 ADSs, representing 280,701 ordinary shares, at an aggregate purchase price of approximately $20 million (net $19.6 million after commissions) in a separate concurrent private placement. As a result of the IPO, IMI’s ownership interest in VIA was diluted from 76.01% to 50.32%. In relation to the dilution without loss of control, the carrying amount of the non-controlling interest was increased by $62.52 million to reflect the changes in the relative interests in VIA (including allocation of goodwill). IMI recognized directly in equity any difference between the amount by which the non-controlling interests are adjusted and the fair value of the consideration received, and attributed it to the owners of the Parent Company. The amount recognized in equity amounted to $32.40 million and was recognized as a credit to the “Additional paid-in capital” account. The additional credit to additional paid up capital of $15.33 million is coming from the reversal of put option liability as discussed in Note 18.
Subscriptions Receivable Details of this account follow:
2020 2019 2018 At beginning of year $2,955,581 $3,402,940 $5,351,844 Forfeitures during the year (71,804) (341,818) (212,357) Refund/(collections) during the
year 5,023 (105,541) (1,736,547) At end of year (Note 28) $2,888,800 $2,955,581 $3,402,940
Dividends 2020 IMI Singapore paid dividends on the redeemable cumulative preferred stocks (RCPS) to AC Industrials (Singapore) Pte, Ltd. (ACI Singapore) on the anniversary dates amounting to $3.47 million and $2.02 million in March 2020 and October 2020, respectively. In November 2020, dividends were paid to the redeemed portion of the RCPS that have accrued as of redemption date amounting to $1.01 million. No dividend payment was declared to common shareholders. 2019 On April 8, 2019, the BOD of the Parent Company approved the declaration of cash dividend of $0.00201 or P=0.10542 per share to all outstanding common shares aggregating to $4.44 million as of record date of April 25, 2019 paid on May 7, 2019.
2018 On February 20, 2018, the BOD of the Parent Company approved the declaration of cash dividend of $0.00458 or P=0.235 per share to all outstanding common shares aggregating to $10.13 million as of record date of March 7, 2018 paid on March 21, 2018.
Retained Earnings Retained earnings as of January 1, 2019 was adjusted for the effect of the finalization of purchase price allocation of VTS with a net increase of $1.68 million. The net increase is due to the gain on a bargain purchase of $2.41 million, net of the increase in depreciation and amortization, deferred taxes and corresponding share of non-controlling interest totaling to $0.73 million.
Integrated mIcro-electronIcs, Inc.
40 Years of manufacturing technology and Innovation 40 Years of manufacturing technology and Innovation
2020 Integrated rePort
134 135

Upon adoption of PFRS 9, any cumulative impairment losses previously recognized under PAS 39 for equity instruments measured at FVOCI will have to be transferred from retained earnings to OCI. As a result, a cumulative catch up adjustment was made as of January 1, 2018 resulting to a decrease in OCI and an increase in retained earnings of $1.75 million. Accumulated net earnings of the subsidiaries amounting to $202.52 million and $201.15 million as of December 31, 2020 and 2019, respectively, are not available for dividend declaration. This accumulated net earnings of subsidiaries becomes available for dividend upon receipt of cash dividends from the investees.
The retained earnings are restricted to dividend declaration to the extent of the cost of treasury shares amounting to $1.01 million. In accordance with Securities Regulation Code Rule 68, As Amended (2019), Annex 68-D, the Parent Company’s retained earnings available for dividend declaration as of December 31, 2020 amounted to $2.58 million. Treasury Shares In July 1999, the Company repurchased a total of 8,867,318 Class B common shares issued to a minority stockholder for a price P=75 million.
Cumulative Translation Adjustments This account pertains to cumulative translation adjustments of subsidiaries with functional currency other than the Group’s presentation currency (see Note 2). Exchange differences arising from translation of foreign operations for the period ended December 31, 2020, 2019 and 2018 follows:
2020 2019 2018 EU and MX $14,970,268 ($3,977,210) ($7,502,790) VIA and STI 8,330,030 1,927,491 (7,435,746) STEL 3,185,241 (33,983) (113,776) Consolidation and eliminations 2,667,047 (3,391,752) 3,030,334 $29,152,586 ($5,475,454) ($12,021,978) Attributable to:
Equity holders of the Parent $26,820,695 ($4,526,109) ($10,619,131) Non-controlling interest 2,331,891 (949,345) (1,402,847)
$29,152,586 ($5,475,454) ($12,021,978)
Non-controlling interest Issuance of capital stock - preferred by IMI Singapore In 2019, IMI Singapore, a wholly-owned subsidiary of the Parent Company, issued RCPS, which were subscribed by AC Industrials (Singapore) Pte, Ltd., an entity under common control of AC Industrials. The preferred shares have certain features, rights and privileges, which include redemption at the option of the issuer and cumulative, non-participating dividend rights at rates to be determined by the Board of Directors. There is no conversion option to the shareholders to convert the RCPS into ordinary shares of IMI Singapore and the shareholders have no voting rights unless the resolution in question varies the rights attached to the RCPS or is for the winding-up of the IMI Singapore. Total shares issued aggregated to $100 million, $60 million of which was allotted and issued in July 2019 and $40 million in November 2019. In November 2020, the Board approved the partial redemption of the RCPS amounting to $30.0 million and paid the dividends that have accrued as of redemption date amounting to $1.01 million. Outstanding balance of the RCPS as of December 31, 2020 amounted to $70.0 million. Capital Management The primary objective of the Group’s capital management is to ensure that it maintains a strong credit rating and healthy capital ratios in order to support its business and maximize shareholder value.
No changes were made in the objectives, policies and processes for the years ended December 31, 2020 and 2019.
The Group monitors capital using a gearing ratio of debt-to-equity and net debt-to-equity. The Group considers bank borrowings in the determination of debt, which consist of loans payable and long-term bank debt. Net debt is equivalent to the total bank borrowings, less cash and cash equivalents.
2020 2019 Loans payable $206,490,427 $126,051,547 Long-term bank borrowings 34,319,925 142,423,815
Total bank debt 240,810,352 268,475,362 Less cash and cash equivalents 244,355,425 152,660,116 Net bank debt (cash) ($3,545,073) $115,815,246
Total Equity $580,862,729 $483,778,797
Debt-to-equity ratio 0.41:1 0.55:1
Net debt (cash)-to-equity ratio (0.01):1 0.24:1
The Group is not subject to externally-imposed capital requirements.
20. Cost of Sales
This account consists of:
2020 2019 2018 Direct, indirect and other material-
related costs (Note 8) $796,036,703 $888,417,084 $952,186,147 Direct labor, salaries, wages and
employee benefits (Note 27) 165,020,873 172,657,671 179,892,752 Depreciation and amortization
(Notes 10, 12 and 30) 43,435,464 38,475,325 29,168,696 Facilities costs and others
(Note 22) 35,010,668 48,587,618 53,732,244 $1,039,503,708 $1,148,137,698 $1,214,979,839
21. Operating Expenses
This account consists of:
2020 2019 2018 Salaries, wages and employee
benefits (Note 27) $50,543,361 $54,178,946 $46,727,732 Depreciation and amortization
(Notes 10, 12 and 30) 11,997,105 10,253,348 8,368,871 Facilities costs and others (Note 22) 29,919,927 41,789,769 41,838,682 $92,460,393 $106,222,063 $96,935,285
22. Facilities Costs and Others - Net
This account consists of:
Cost of Sales Operating Expenses 2020 2019 2018 2020 2019 2018 Utilities $16,944,219 $18,561,156 $19,599,504 $1,479,229 $948,015 $1,336,139 Outsourced activities 7,968,725 10,332,444 15,828,874 11,184,209 14,143,794 14,377,484 Repairs and maintenance 6,203,813 13,052,752 11,508,562 781,950 1,076,059 921,113 Government-related 1,795,352 1,316,475 2,226,864 3,028,921 3,497,749 4,505,120 Travel and transportation 934,445 1,741,426 1,497,218 2,247,563 5,314,278 5,435,915 Technology-related 710,862 1,098,239 361,746 4,224,730 3,912,362 6,229,630 Insurance 673,733 1,359,974 1,564,971 2,823,246 2,000,776 1,928,184 Postal and communication 301,012 371,828 382,798 431,548 1,459,905 1,171,214 Promotional materials, representation
and entertainment 117,674 476,418 242,534 637,995 1,012,922 1,102,576 Staff house 15,083 155,727 333,749 272,056 296,117 477,608 Membership fees 4,839 57,467 10,237 143,575 143,923 174,346 Provision (reversal of provision) for
inventory obsolescence (Note 8) − − − (291,526) 4,599,150 2,344,158 Sales commission − − 399,402 1,659,413 1,398,391 Provision for ECLs (Note 6) − − − 574,495 296,207 88,238 Provision (reversal of provision) for
decline in value of inventories (Note 8) − − − 2,259 (79,522) 93,123 Others - net (659,089) 63,712 175,187 1,980,275 1,508,621 255,443 $35,010,668 $48,587,618 $53,732,244 $29,919,927 $41,789,769 $41,838,682
Integrated mIcro-electronIcs, Inc.
40 Years of manufacturing technology and Innovation 40 Years of manufacturing technology and Innovation
2020 Integrated rePort
136 137

Others include donations, small tools and instruments, spare parts, materials, office supplies, and copying expenses. In 2020, this also includes Covid-related incentives in the form of social insurance refunds, electricity cost subsidies and other job support schemes in China, Europe and Singapore recognized as reduction in cost of sales and operating expenses.
23. Interest Expense and Bank Charges
This account consists of:
2020 2019 2018 Interest expense on loans (Notes 16 and 17) $8,411,717 $10,262,423 $10,566,675 Interest on leases (Note 30) 1,644,189 1,368,494 − Bank charges 320,526 1,505,259 1,398,669 Others 46,201 5,759 27,040 $10,422,633 $13,141,935 $11,992,384
Others include interest on employee housing and car loans in 2020, 2019, and 2018.
24. Miscellaneous Income - Net
Miscellaneous income (loss) - net consists of:
2020 2019 2018 Financial subsidies $6,288,982 $1,735,855 $1,223,397 Mark-to-market gain (loss) on put options
(Note 18) 6,068,906 3,445,288 (5,372,114) Gain on sale of property, plant and equipment
(Note 10) 657,101 99,404 189,298 Other income from customers 404,813 456,291 890,489 Gain on insurance claims 61,260 12,672 − Sale of materials and scrap (Note 8) 36,332 32,927 820,231 Impairment on property, plant and equipment
(Notes 3 and 10) (2,620,779) − − Impairment loss on product development cost
(Notes 3 and 12) (4,693,985) − − Set up of intellectual property related liability − (1,638,206) − Net gain on disposal of a subsidiary − − 19,062,344 Gain from bargain purchase (Note 2) − − 2,411,951 Impairment loss on goodwill (Notes 3 and 11) − − (6,902,838) Reversal of contingent consideration (Note 18) − 3,728,985 21,304,030 Other income (expense) - net (679,701) 1,412,072 551,703 $5,522,929 $9,285,288 $34,178,491
Financial subsidies are comprised of special subsidy funds such as industrial, economic and technological development fund subsidies provided by the China government, amortization of the grant incentives received from the government of Serbia related to the new manufacturing facility and other Covid-related grants in China, Europe and Singapore. The balance of the Serbia grant incentive included under “Other noncurrent liabilities” account amounted to $2.49 million and $1.61 million in 2020 and 2019, respectively. Gain on sale of property, plant and equipment includes gain on the sale of the manufacturing building located in the Cavite Economic Zone amounting to $0.41 million in 2020. The liability on contingent consideration was reversed in full to arrive at the fair value of the expected earn-out based on target normalized EBITDA performance in relation to the acquisition of STI. The period for the prepayment of contingent consideration has lapsed in 2019.
Intellectual property (IP) related liability pertains to provision for potential compensation related to IP rights acquired on the acquisition of VTS.
In 2018, the sale of Shenzhen entity was completed for a final purchase price of $85.09 million. The net gain recognized from the sale amounted to $19.06 million, net of employee relocation incentive.
Other income and expenses pertain to accruals and reversals for certain non-operating expenses.
25. Income Tax
Current Tax Parent Company The Parent Company is registered with PEZA and is entitled to certain incentives, which include ITH. As of December 31, 2020, there are three remaining project activities with ITH. Under its PEZA registrations, the Parent Company’s projects and activities are subject to certain requirements and are entitled to certain incentives, which include, but are not limited to, ITH and tax and duty free importation of inventories and capital equipment. Upon the expiration of the ITH, the Parent Company will be subject to a 5% tax on gross income earned after certain allowable deductions provided under Republic Act (R.A.) No. 7916, otherwise known as the “Special Economic Zone Act of 1995”, in lieu of payment of national and local taxes. Income from other income-producing activities that are not registered with PEZA is subject to regular corporate income tax (RCIT) rate of 30%.
IMICD, IMISZ and STJX In accordance with the “Income Tax Law of the China for Enterprises with Foreign Investment and Foreign Enterprises,” the subsidiaries in China are entitled to full exemption from Enterprise Income Tax (EIT) for the first two years and a 50% reduction in EIT for the next three years, commencing from the first profitable year after offsetting all tax losses carried forward from the previous five years.
During the financial year ended December 31, 2020, STJX and IMISZ have been granted tax preference by the State Taxation Administration of the People’s Republic of China (PRC) for a period of 3 years as the entities are operating in the high-technology industry. STJX and IMISZ are subjected to taxation at the statutory tax rate of 15% in 2020 and 25% in 2019 on its taxable income as reported in its financial statements, prepared in accordance with the accounting regulations in the PRC. IMICD is subject to taxation at the statutory rate of 15% on its taxable income as reported in the financial statements.
STHK Hong Kong profits tax has been provided at the rate of 16.5% on the estimated assessable profit for the year.
Cooperatief Taxation is calculated on the reported pre-tax result, at the prevailing tax rate of 20% on the first €200,000 and 25% on the taxable amount exceeding €200,000, taking into account any losses carried forward from previous financial years (if applicable), tax-exempt items and nondeductible expenses, and using tax facilities. IMI BG Income taxes are calculated in accordance with Bulgarian legislation, and the effect of the current and deferred taxes is reported. The current tax is calculated based on the taxable income for tax purposes. The nominal tax rate is 10%.
IMI NIS Taxable income is established on the basis of accounting profit. The applicable tax rate is 15%.
IMI CZ Income tax due is calculated by multiplying the tax base by the rate as defined by the income tax law of Czech Republic. The tax base comprises the book income from operations, which is increased or decreased by permanently or temporarily tax-decreasing costs and tax-deductible revenues (for example, creation and recording of other provisions and allowances, entertainment expenses, difference between book and tax depreciations). The applicable tax rate is 19%.
IMI MX The Mexican Income Tax Law (MITL) established a corporate income tax rate of 30% for fiscal years 2020, 2019 and 2018. The MITL established requirements and limits regarding certain deductions, including restrictions on the deductibility of payroll-related expenses that are considered tax-exempt for employees, contributions to create or increase pension fund reserves, and Mexican Social Security Institute dues that are paid by the company but should be paid by the employees. The MITL also establishes that certain payments made to related parties shall not be deductible if they do not meet certain requirements.
IMI France Income tax is computed based on the income earned by the entity during the calendar year. Losses may be carried forward with no time limit. On certain conditions, losses may be carried back one year. The tax rate applicable is 33% based on net income.
Integrated mIcro-electronIcs, Inc.
40 Years of manufacturing technology and Innovation 40 Years of manufacturing technology and Innovation
2020 Integrated rePort
138 139

VIA and VTS VIA GmbH is subject to corporate income tax and trade taxes in Germany. For the years ended December 31, 2020, 2019 and 2018, the statutory German corporate income tax rate applicable to VIA GmbH is 15,0% plus solidarity surcharge of 5,5% thereon. The municipal trade tax is approximately 16,0% in 2020 and 16,0% in 2019 and 2018. Overall tax rate for Germany is 31.8% for 2020, 2019 and 2018. The change in the municipal trade tax is due to the relocation of a permanent establishment from Altdorf to Nuremberg, with Nuremberg having higher tax rates. For VIA’s subsidiaries, VIA LLC (USA) a tax rate of 27.0% in 2020, 2019 and 2018, for VIA Suzhou (China) a tax rate of 25.0% for 2020, 2019 and 2018 and for VTS (Japan) a tax rate of 33.9% is applicable. STI The standard rate of corporation tax in the UK is 19%. STI Philippines is governed by the rules of R.A. No. 7916, which prescribes a final tax rate of 5% on gross income net of certain deductions specifically provided for by the law.
PSi As a PEZA-registered entity, PSi is subject to a 5% tax on gross income less allowable deductions, as defined in R.A. No. 7916, as amended by R.A. No. 8748, in lieu of all national and local taxes, except real property tax on land being leased by PSi. The 5% tax on gross income shall be paid and remitted as follows: (a) 3% to the National Government; and (b) 2% to the treasurer’s office of the municipality or city where the enterprise is located. Income from other income-producing activities that are not registered with PEZA is subject to RCIT rate of 30%.
As at December 31, 2020 and 2019, PSi has no PEZA-registered activities with ITH entitlement. Deferred Tax Recognized deferred taxes of the Group relate to the tax effects of the following:
2020 2019 Deferred tax assets: Lease liabilities $7,355,223 $7,254,586 Net operating loss carry-over 2,070,468 3,970,284 Allowance for inventory obsolescence 580,259 173,612 Allowance for doubtful accounts 149,828 21,493 Unrealized foreign exchange loss on monetary
assets - net 6,748 − Fair value adjustment on property, plant and
equipment arising from business combination − 78,571 Others 947,960 − $11,110,486 $11,498,546
2020 2019 Deferred tax liabilities: Right-of-use asset $6,715,279 $7,230,198 Fair value adjustment on property, plant and
equipment arising from business combination 1,804,127 857,370 Contract assets 340,363 856,766 Fair value adjustments on intangible assets from
business combination 263,810 615,557 Unrealized foreign exchange gain on monetary
assets - net 93,163 34,956 Others − 163,015 $9,216,742 $9,757,862
Deferred tax assets and deferred tax liabilities are offset on per entity level and the net amount is reported in consolidated balance sheets as follows:
December 31, 2020
Deferred Tax
Assets Deferred Tax
Liabilities
Total Deferred Tax Assets - net
Total Deferred Tax Liabilities -
net Parent Company $– ($106,169) $– ($106,169) PSI 396,315 (389,247) 7,068 – IMI BG 683,776 (1,054,562) – (370,786) IMI CZ 286,934 (55,404) 231,530 – IMI MX 1,005,534 (853,560) 151,974 – VIA and STI 5,527,574 (3,490,362) 2,037,212 – STEL 3,111,258 (2,073,750) 1,037,508 – Serbia 26,231 – 26,231 – Consolidation 72,864 (1,193,688) 355 (1,121,179) $11,110,486 ($9,216,742) $3,491,878 ($1,598,134)
December 31, 2019
Deferred Tax
Assets Deferred Tax
Liabilities
Total Deferred Tax Assets - net
Total Deferred Tax Liabilities -
net Parent Company $– ($45,751) $– ($45,751) PSI 172,261 (116,244) 56,017 – IMI BG – (289,848) – (289,848) IMI CZ 286,905 (82,596) 204,309 – IMI MX 1,037,754 (984,357) 53,397 – VIA and STI 5,814,691 (4,577,227) 1,237,464 – STEL 4,169,299 (2,109,847) 2,059,452 – Consolidation 17,636 (1,551,992) – (1,534,356) $11,498,546 ($9,757,862) $3,610,639 ($1,869,955)
Others pertain to the deferred tax liabilities resulting from the acquisition of IMI EU/MX Subsidiaries. The movement in deferred taxes are impacted by the translation of the deferred taxes of the subsidiaries with functional currency other than the presentation currency of the Parent Company. The deferred taxes are translated using the closing rate as at balance sheet date and the exchange differences are recognized as part of the other comprehensive income and reported as separate component of equity. As of December 31, 2020 and 2019, the temporary differences for which no deferred tax assets have been recognized are as follows:
2020 2019 Net operating loss carry-over $36,274,754 $20,896,912 Accumulated impairment losses on property, plant
and equipment 4,352,991 1,732,212 Excess of cost over NRV of inventories 625,966 644,030 Provisions 462,938 786,727 Allowance for doubtful accounts 61,805 58,730 $41,778,454 $24,118,611
Deferred tax assets are recognized only to the extent that sufficient future taxable profits will be available against which the deferred tax assets can be used.
As of December 31, 2020 and 2019, deferred tax liabilities have not been recognized on the undistributed earnings of subsidiaries (see Note 19) and the related cumulative translation adjustments since the timing of the reversal of the temporary difference can be controlled by the Group and management does not expect the reversal of the temporary differences in the foreseeable future. On September 30, 2020, the Philippine Bureau of Internal Revenue (BIR) issued Revenue Regulations No. 25-2020 implementing Section 4(bbbb) of “Bayanihan to Recover As One Act” which states that the NOLCO incurred for taxable years 2020 and 2021 can be carried over and claimed as a deduction from gross income for the next five (5) consecutive taxable years immediately following the year of such loss.
Integrated mIcro-electronIcs, Inc.
40 Years of manufacturing technology and Innovation 40 Years of manufacturing technology and Innovation
2020 Integrated rePort
140 141

As of December 31, 2020, the entities operating in the Philippines has incurred NOLCO before taxable year 2020 which can be claimed as deduction from the regular taxable income for the next three (3) consecutive taxable years, as follows:
Year Incurred Availment Period Amount Applied/Expired Unapplied 2017 2018 to 2020 $182,397 $182,397 $– 2018 2019 to 2021 12,295,900 – 12,295,900 2019 2020 to 2022 15,757,987 – 15,757,987
$28,236,284 $182,397 $28,053,887 As of December 31, 2020, the entities operating in the Philippines has incurred NOLCO in taxable year 2020 which can be claimed as deduction from the regular taxable income for the next five (5) consecutive taxable years pursuant to the Bayanihan to Recover As One Act, as follows:
Year Incurred Availment Period Amount Applied/Expired Unapplied 2020 2020 to 2025 $8,619,419 $– $8,619,419
For the carry-over losses of certain entities within the Group, this expires between three to ten years from the date incurred depending on the jurisdiction the entity is operating.
Year Incurred Amount Applied/Expired Unapplied 2020 $30,661,230 $− $30,661,230 2019 36,629,041 5,244,205 31,384,836 2018 20,750,755 1,297,954 19,452,801
2017 and prior 17,357,130 226,014 17,131,116 $105,398,156 $6,768,173 $98,629,983
The tax on income from foreign subsidiaries was derived by aggregating the effective income tax for each national jurisdiction.
The reconciliation of the statutory income tax rate to the effective income tax rate of the Group follows:
2020 2019 2018 Statutory income tax (30.00%) (30.00%) 30.00% Tax effects of: Nondeductible expenses and
movement in unrecognized deferred taxes (277.93%) (13.30%) 16.36%
Income subject to minimum corporate income tax 7.48% 0.66% (0.31%)
Income subject to gross income tax 100.57% 17.45% (18.36%) Difference in tax jurisdiction (140.61%) 7.24% (13.40%) Interest income subjected to final tax 0.40% 0.19% (0.14%) Provision for income tax (340.09%) (17.76%) 14.15%
26. Earnings per Share
The following table presents information necessary to calculate EPS on net income attributable to equity holders of the Parent Company:
2020 2019 2018 Net income (loss) attributable to
equity holders of Parent Company ($3,455,073) ($7,780,648) $47,187,313
Weighted average number of common shares outstanding 2,208,592,993 2,208,966,029 2,152,356,856
Basic and diluted EPS ($0.002) ($0.004) $0.022
As of December 31, 2020, 2019 and 2018, the Group has no dilutive potential common shares.
27. Personnel Costs
Details of salaries, wages, and employee benefits follow:
2020 2019 2018 Salaries, wages and benefits $193,371,691 $203,260,943 $202,411,802 Government related contributions 9,509,438 8,699,424 7,692,058 Retirement expense under defined
contribution plans 7,239,590 8,877,809 9,104,762 Net retirement expense under
defined benefit plans 2,093,381 1,552,705 1,574,569 Employee spin-off (Note 21) − 131,270 − Others 3,350,134 4,314,466 5,837,293 $215,564,234 $226,836,617 $226,620,484
Others include expenses such as employee social and recreation, employee awards and recognition, trainings and seminars, labor union expenses, and uniforms.
Salaries, wages, and employee benefits are allocated as follows:
2020 2019 2018 Cost of sales (Note 20) $165,020,873 $172,657,671 $179,892,752 Operating expenses (Note 21) 50,543,361 54,178,946 46,727,732 $215,564,234 $226,836,617 $226,620,484
Defined Benefit Plans The Parent Company, IMI BG and PSi have defined benefit plans covering substantially all of their employees. The latest actuarial valuations were made on December 31, 2020.
The plan is administered by local banks as trustees. The Board of Trustees is responsible for the investment direction of the assets. It defines the investment strategy as often as necessary, at least annually, especially in the case of significant market developments or changes to the structure of the plan participants. When defining the investment strategy, it takes into account the plan’s objectives, benefit obligations and risk capacity. The investment strategy is defined in the form of a long-term target structure (investment policy). The Board of Trustees delegates the implementation of the investment policy in accordance with the investment strategy, as well as various principles and objectives to an Investment Committee, which also consists of members of the Board of Trustees, and the Treasurer. The Treasurer oversees the entire investment process.
The defined benefit plans of the Parent Company and PSi meet the minimum retirement benefit specified under R.A. No. 7641, Retirement Pay Law, while IMI BG is in accordance with the Bulgarian labour legislation and the Collective Labour Contract.
The Group has net retirement liabilities attributable to the following:
2020 2019 Parent Company $7,253,561 $7,549,797 IMI BG 1,751,670 1,314,853 PSi 343,258 300,432 Serbia 7,166 − $9,355,655 $9,165,082
Integrated mIcro-electronIcs, Inc.
40 Years of manufacturing technology and Innovation 40 Years of manufacturing technology and Innovation
2020 Integrated rePort
142 143

Par
en
t C
om
pan
y, I
MI B
G a
nd
PS
i C
han
ges
in n
et
reti
rem
en
t lia
bili
ties
of
the P
are
nt
Co
mp
an
y, IM
I B
G a
nd
PS
i’s d
efi
ned
ben
efi
t p
lan
s are
as
follo
ws:
20
20
N
et
Reti
rem
en
t E
xp
en
se
Rem
easu
rem
en
ts
Jan
uary
1
Curr
en
t S
erv
ice C
ost
N
et
I nte
rest
Lo
ss o
n
Cu
rtailm
en
ts
an
d
Sett
lem
en
ts
Su
bto
tal
Sep
ara
tio
n
an
d
Ben
efi
ts
Paid
Retu
rn o
n
Pla
n A
ssets
(E
xclu
din
g
Am
oun
t In
clu
ded
in
N
et
Inte
rest
)
Actu
ari
al
Ch
an
ges
Du
e t
o
Exp
eri
en
ce
A
dju
stm
en
ts
Actu
ari
al
Ch
an
ges
Du
e t
o
Dem
og
rap
hic
A
ssu
mp
tio
ns
Actu
ari
al
Ch
ang
es
Ari
sin
g f
rom
C
han
ges
in
Fin
an
cia
l A
ssu
mp
tio
ns
Su
bto
tal
Actu
al
Co
ntr
ibu
tio
n
Fo
reig
n
Cu
rren
cy
E
xchan
ge
D
iffe
ren
ce
De
ce
mb
er
31
Pre
sen
t valu
e o
f d
efi
ned
ben
efi
t o
blig
ati
on
$
22
,19
3,9
86
$
1,78
6,5
40
$
98
6,7
17
$–
$2,7
73
,25
7
($1,
182
,46
0)
$–
($8
56
,74
6)
$–
$24
7,2
98
($
60
9,4
48
)$
– $
1,3
07,4
63
$
24
,48
2,7
98
F
air
valu
e o
f p
lan
ass
ets
(1
3,0
28
,90
4)
– (6
79
,876
) –
(67
9,8
76
) (5
85
,09
3)
(77,0
31)
(1
4,0
71)
–
– (9
1,10
2)
– (7
42
,16
8)
(15,127
,14
3)
Net
reti
rem
en
t lia
bili
ties
$
9,16
5,0
82
$1,
78
6,5
40
$3
06
,84
1
$–
$
2,0
93
,38
1
($1,76
7,5
53
)
($77,0
31)
($8
70
,817
)
$–
$
24
7,2
98
($70
0,5
50
)$
–
$5
65
,29
5
$
9,3
55
,65
5
2
019
N
et
Re
tire
men
t E
xp
ense
R
em
easu
rem
en
ts
Jan
uary
1
Curr
en
t S
erv
ice C
ost
N
et
Inte
rest
Lo
ss o
n
Cu
rtailm
en
ts
an
d
Sett
lem
en
ts
Su
bto
tal
Sep
ara
tio
n
an
d
Ben
efi
ts
Paid
Retu
rn o
n
Pla
n A
sse
ts
(Exclu
din
g
Am
oun
t In
clu
ded
in
N
et
Inte
rest
)
Actu
ari
al
Ch
an
ges
Du
e t
o
Exp
eri
en
ce
Ad
just
men
ts
Actu
ari
al
Chan
ges
Du
e t
o
Dem
og
rap
hic
A
ssu
mp
tio
ns
Actu
ari
al
Ch
ang
es
Ari
sin
g f
rom
C
han
ges
in
Fin
an
cia
l A
ssu
mp
tio
ns
Su
bto
tal
Actu
al
Co
ntr
ibu
tio
n
Fo
reig
n
Cu
rren
cy
Exch
an
ge
D
iffe
ren
ce
D
ecem
ber
31
Pre
sen
t valu
e o
f d
efi
ned
ben
efi
t o
blig
ati
on
$
16,2
24
,86
0
$1,4
03
,96
6
$1,0
81,10
0
$19
,29
9
$2,5
04
,36
5
($1,5
57,0
84
) $
– $
1,0
44
,08
0
($3
27,1
71)
$
3,6
81,
39
7
$4
,39
8,3
06
$
– $
62
3,5
39
$
22,1
93
,98
6
Fair
valu
e o
f p
lan
ass
ets
(1
1,9
91,9
26
) –
(95
1,6
60
) –
(95
1,6
60
) 5
62
,26
9
(174
,75
2)
(8,5
85)
– –
(18
3,3
37)
– (4
64
,250
) (1
3,0
28
,90
4)
Net
reti
rem
en
t lia
bili
ties
$
4,2
32
,93
4
$
1,4
03
,96
6
$
129
,44
0
$
19,2
99
$1,5
52,7
05
($
99
4,8
15)
($
174
,75
2)
$
1,0
35
,49
5
($
32
7,1
71)
$3
,68
1,3
97
$
4,2
14,9
69
$
–
$15
9,2
89
$9
,16
5,0
82
Th
e m
axim
um
eco
no
mic
ben
efi
t availab
le is
a c
on
trib
uti
on
of
exp
ecte
d r
efu
nd
s fr
om
th
e p
lan
s an
d r
ed
ucti
on
s in
fu
ture
co
ntr
ibu
tio
ns.
The distribution of the plan assets as of December 31, 2020 and 2019 follows:
2020 2019 Government securities $10,799,098 $9,623,334 Equities 1,596,656 1,207,358 Corporate bonds 1,164,006 1,100,609 Trust funds 1,057,038 645,374 Investment properties 486,472 461,378 Cash and cash equivalents 50 76 Others 23,823 (9,205) $15,127,143 $13,028,924
The plan assets include corporate bonds and deposit instruments of related parties, primarily AC, Ayala Land, Inc. (ALI) and Bank of the Philippine Islands (BPI). As of December 31, 2020 and 2019, the fair value of these plan assets amounted to $1.51 million and $1.02 million, respectively.
The plan assets pertain to diverse investments and do not have any concentration risk.
The overall investment policy and strategy of the Group’s defined benefit plans are guided by the objective of achieving an investment return which, together with contributions, ensures that there will be sufficient assets to pay retirement benefits as they fall due while also mitigating the various risk of the plans.
The Group expects to contribute $2.26 million to the defined benefit plans for 2021.
The actual return (loss) of plan assets amounted to ($0.08) million, ($0.17) million and $0.83 million in 2020, 2019 and 2018, respectively.
The average duration of net retirement liabilities at the end of the balance sheet date is 13.2 to 20.03 years as of December 31, 2020 and 14.26 to 21.31 years as of December 31, 2019.
Shown below is the maturity analysis of the undiscounted benefit payments as of December 31, 2020 and 2019:
2020 2019 Less than one year $1,877,723 $1,843,180 More than one year to five years 8,798,373 8,497,569 More than five years to ten years 12,181,108 11,889,588 More than ten years to fifteen years 13,120,139 13,784,395 More than fifteen years 46,901,027 52,490,273 $82,878,370 $88,505,005
Principal actuarial assumptions The principal actuarial assumptions used to determine retirement benefits are shown below:
2020 2019 2018 Discount rate 0.34% - 3.89% 0.40% - 4.99% 0.90% - 7.38% Salary increase rate 3.00% - 5.00% 4.00% - 5.00% 4.00% - 5.00%
The sensitivity analysis per entity below has been determined based on reasonably possible changes of each significant assumption on the net retirement liabilities as of the end of the balance sheet date, assuming all other assumptions were held constant:
Increase/
Decrease in Actuarial Assumption
Effect on Net Retirement Liability Actuarial Assumption 2020 2019 Discount rate +1% ($1,833,819) ($1,647,358) -1% 2,102,930 1,951,455 Salary increase rate +1% 2,230,776 2,068,298 -1% (1,981,362) (1,873,459)
The mortality rate in 2020 and 2019 is based on the 2017 Philippine Intercompany Mortality Table for the Parent Company and PSi. Meanwhile, IMI BG used the table for mortality and average life continuance population in the period 2017-2019 from National Statistical Institute (of Bulgaria) for 2020 and 2019. IMI Serbia used the 2012 table of mortality published by the Statistical Office of the Republic of Serbia for 2020.
Integrated mIcro-electronIcs, Inc.
40 Years of manufacturing technology and Innovation 40 Years of manufacturing technology and Innovation
2020 Integrated rePort
144 145

The net retirement expense of the Parent Company, IMI BG and PSi under the defined benefit plans is allocated as follows:
2020 2019 2018 Cost of sales $1,481,625 $1,058,798 $1,133,974 Operating expenses 611,756 493,907 440,595 $2,093,381 $1,552,705 $1,574,569
Defined Contribution Plans The Parent Company’s subsidiaries, excluding PSi, IMI BG and IMI Serbia, participate in their respective national retirement schemes which are considered as defined contribution plans. The retirement expense of these subsidiaries is allocated as follows:
2020 2019 2018 Cost of sales $6,024,351 $7,696,667 $7,726,248 Operating expenses 1,215,239 1,181,142 1,378,514 $7,239,590 $8,877,809 $9,104,762
28. Employee Stock Ownership Plan (ESOWN)
The Group has an ESOWN, which is a privilege extended to the Group’s eligible managers and staff whereby the Group allocates up to 10% of its authorized capital stock for subscription by said personnel under certain terms and conditions stipulated in the ESOWN.
The key features of the plan are as follows:
The subscription price per share shall be based on the average closing price at the PSE for 20
consecutive trading days with a discount to be determined by the Parent Company’s Compensation Committee.
Term of payment is eight years reckoned from the date of subscription:
Initial payment 2.5% 1st Anniversary 5.0% 2nd Anniversary 7.5% 3rd Anniversary 10.0% Over the remaining years 75.0% balance
Holding period:
40% after one (1) year from subscription date 30% after two (2) years from subscription date 30% after three (3) years from subscription date
Movements in the number of shares outstanding under ESOWN in 2019, 2018 and 2017 follow:
2020 2019 2018
Number of
Shares
Weighted Average Exercise
Price Number of
Shares
Weighted Average Exercise
Price Number of
Shares
Weighted Average Exercise
Price At beginning of year 137,692,186 P=6.62 139,364,849 P=6.65 140,406,496 P=6.67 Forfeitures (315,235) 10.49 (1,672,663) 9.39 (1,041,647) 9.40 At end of year 137,376,951 P=6.61 137,692,186 P=6.62 139,364,849 P=6.65
The balance of the subscriptions receivable amounted to $2.89 million, $2.96 million and $3.40 million as of December 31, 2020, 2019 and 2018, respectively (see Note 19).
The share option expense amounted to nil in 2020 and 2019, and $0.03 million in 2018.
29. Segment Information
Management monitors operating results per geographical area for the purpose of making decisions about resource allocation and performance assessment. It evaluates the segment performance based on gross revenue, interest income and expense and net income before and after tax of its major manufacturing sites. The Parent Company and PSi are combined under Philippine segment, STEL Group is categorized under China segment, IMI BG, IMI CZ and IMI Serbia are combined under Europe based on the industry segment and customers served, IMI Mexico is presented under Mexico segment, VIA and STI are combined under Germany/UK segment representing non-wholly owned subsidiaries, IMI USA, IMI Japan, IMI UK and IMI Singapore/ROHQ are combined being the holding and support facilities for strategic management, research and development, engineering development and sales and marketing.
Prior period information is consistent with the current year basis of segmentation.
The Parent Company and its subsidiaries generally account for inter-segment revenue and transfers as if the revenue and transfers were to third parties at current market prices. These transactions are accounted for in accordance with PFRS. Intersegment revenues, cost of sales, and operating expenses are eliminated on consolidation.
The amount of segment assets and liabilities are based on measurement principles that are similar with those used in measuring assets and liabilities in the consolidated statement of financial position which is in accordance with PFRS.
Integrated mIcro-electronIcs, Inc.
40 Years of manufacturing technology and Innovation 40 Years of manufacturing technology and Innovation
2020 Integrated rePort
146 147
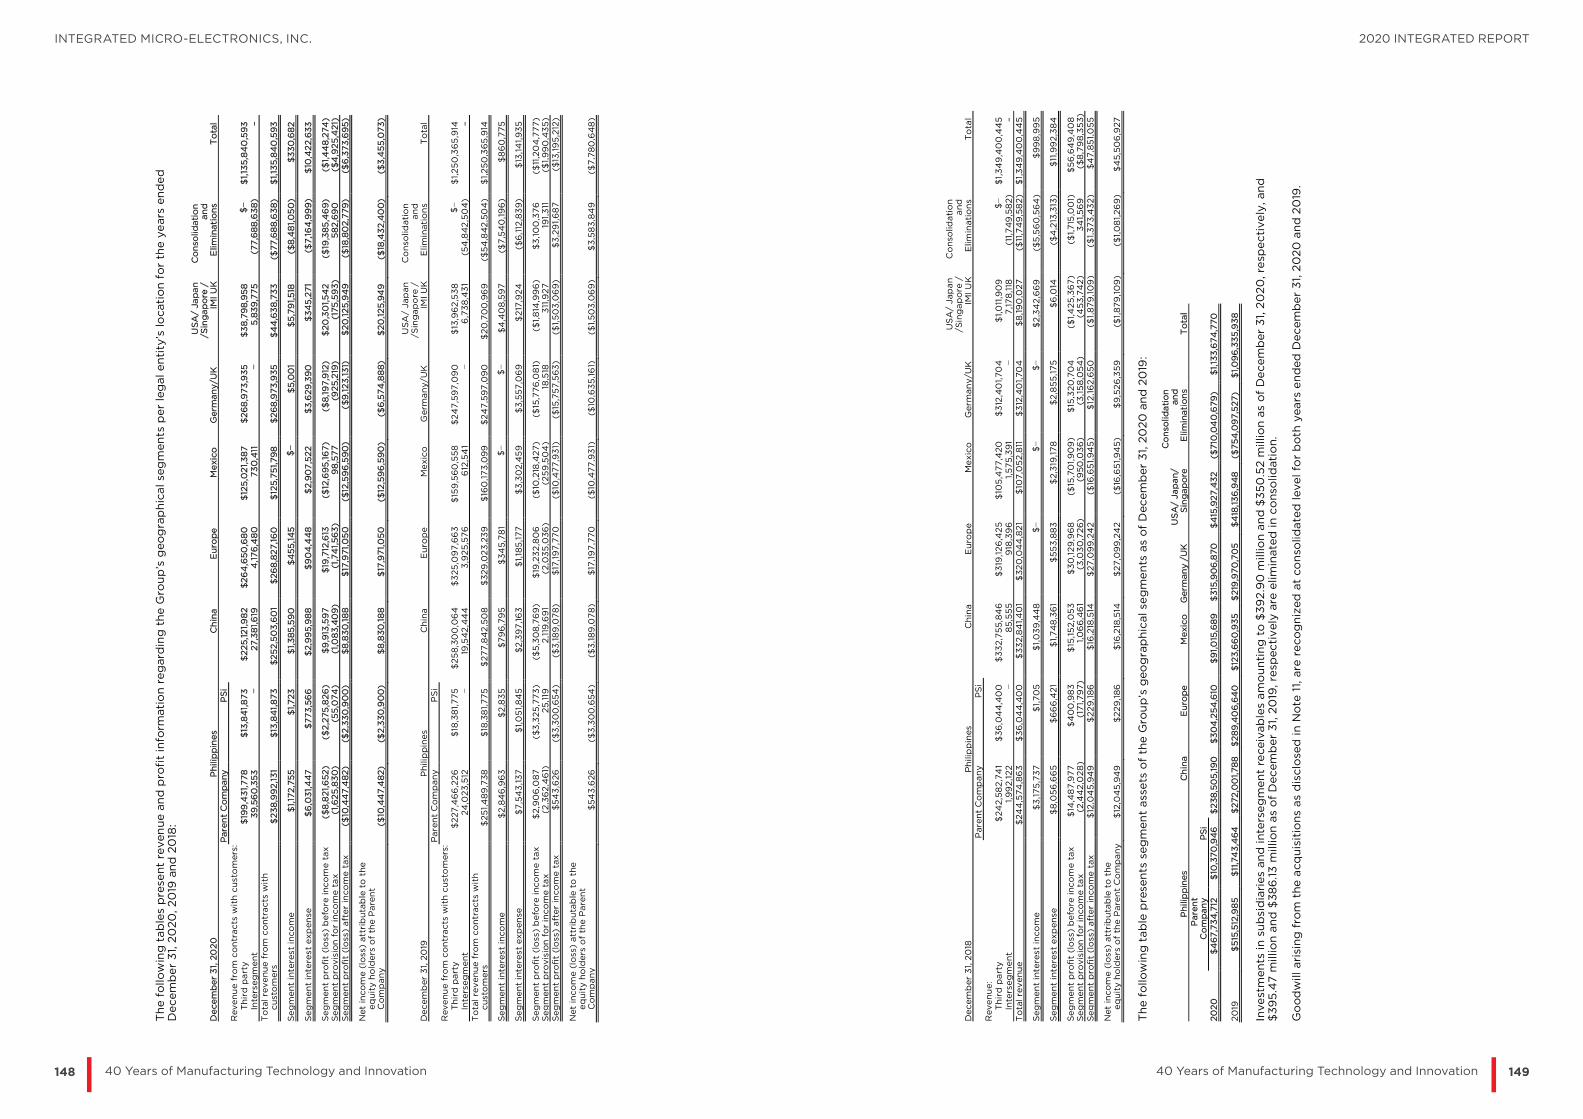
Th
e f
ollo
win
g t
ab
les
pre
sent
reven
ue a
nd
pro
fit
info
rmati
on
reg
ard
ing
th
e G
rou
p’s
geo
gra
ph
ical se
gm
en
ts p
er
leg
al en
tity
’s lo
cati
on
fo
r th
e y
ears
en
ded
D
ecem
ber
31, 2
020
, 2
019
an
d 2
018
: D
ecem
ber
31,
20
20
P
hili
pp
ines
Ch
ina
Eu
rop
e
Mexic
o
Germ
an
y/U
K
US
A/
Jap
an
/Sin
gap
ore
/
IMI U
K
Co
nso
lidati
on
an
d
Elim
inati
on
s T
ota
l P
are
nt
Co
mp
any
PS
i
Reven
ue f
rom
co
ntr
acts
wit
h c
ust
om
ers
:
T
hir
d p
art
y
$19
9,4
31,
778
$
13,8
41,
873
$
22
5,12
1,9
82
$2
64
,65
0,6
80
$
125
,02
1,3
87
$
26
8,9
73
,93
5
$3
8,7
98
,95
8
$−
$1,13
5,8
40
,59
3
In
ters
eg
men
t 3
9,5
60
,35
3
− 27,3
81,6
19
4,1
76
,48
0
73
0,4
11
− 5
,83
9,7
75
(7
7,6
88
,63
8)
– T
ota
l re
venu
e f
rom
co
ntr
acts
wit
h
cust
om
ers
$
23
8,9
92
,13
1 $
13,8
41,
873
$
25
2,5
03
,60
1 $
26
8,8
27
,16
0
$12
5,7
51,79
8
$26
8,9
73
,93
5
$4
4,6
38
,73
3
($77,6
88
,63
8)
$1,13
5,8
40
,59
3
Seg
men
t in
tere
st in
co
me
$
1,17
2,7
55
$1,72
3
$1,3
85
,59
0
$4
55
,14
5
$−
$5,0
01
$5
,79
1,518
($
8,4
81,
05
0)
$3
30
,68
2
Seg
men
t in
tere
st e
xp
en
se
$6
,03
1,4
47
$77
3,5
66
$
2,9
95
,98
8
$9
04
,44
8
$2,9
07
,522
$
3,6
29
,39
0
$3
45
,271
($7,1
64
,99
9)
$10
,42
2,6
33
Seg
men
t p
rofi
t (l
oss
) b
efo
re inco
me t
ax
($8
,821,
652
) ($
2,2
75
,82
6)
$9
,913
,59
7
$19
,712
,613
($
12,6
95
,16
7)
($8
,19
7,9
12)
$20
,30
1,5
42
($
19,3
85
,46
9)
($1,4
48
,274
) S
eg
men
t p
rovis
ion
fo
r in
co
me
tax
(1,6
25
,83
0)
(55
,07
4)
(1,0
83,4
09
) (1
,74
1,5
63
) 9
8,5
77
(925
,219
) (1
75
,59
3)
58
2,6
90
($
4,9
25
,421)
S
eg
men
t p
rofi
t (l
oss
) aft
er
inco
me
tax
($10
,44
7,4
82)
($2
,33
0,9
00
) $
8,8
30
,18
8
$17
,971,
05
0
($12
,59
6,5
90
) ($
9,1
23
,13
1)
$20
,12
5,9
49
($
18,8
02,7
79
) ($
6,3
73
,69
5)
Net
inco
me (
loss
) att
rib
uta
ble
to
the
eq
uit
y h
old
ers
of
the
Pare
nt
Co
mp
an
y
( $10
,44
7,4
82)
($2
,33
0,9
00
) $
8,8
30
,18
8
$17
,971,
05
0
($12
,59
6,5
90
) ($
6,5
74
,88
8)
$20
,12
5,9
49
($
18,4
32
,40
0)
($3
,45
5,0
73
)
Decem
ber
31,
20
19
Ph
ilip
pin
es
Ch
ina
Eu
rop
e
Mexic
o
Germ
an
y/U
K
US
A/
Jap
an
/S
ing
ap
ore
/
IMI U
K
Co
nso
lidati
on
an
d
Elim
inati
on
s T
ota
l P
are
nt
Co
mp
an
y
PS
i
Reven
ue f
rom
co
ntr
acts
wit
h c
ust
om
ers
:
T
hir
d p
art
y
$227
,46
6,2
26
$
18,3
81,
775
$
25
8,3
00
,06
4
$3
25
,09
7,6
63
$
159
,56
0,5
58
$
24
7,5
97
,09
0
$13
,96
2,5
38
$
− $
1,2
50
,36
5,9
14
In
ters
eg
men
t 24
,023
,512
−
19,5
42
,44
4
3,9
25
,576
6
12,5
41
− 6
,73
8,4
31
(54
,84
2,5
04
) –
To
tal re
venu
e f
rom
co
ntr
acts
wit
h
cust
om
ers
$
25
1,4
89
,738
$
18,3
81,
775
$
27
7,8
42
,50
8
$32
9,0
23,2
39
$
160
,17
3,0
99
$
24
7,5
97
,09
0
$20
,70
0,9
69
($
54
,84
2,5
04
) $
1,2
50
,36
5,9
14
Seg
men
t in
tere
st in
co
me
$
2,8
46
,96
3
$2
,83
5
$7
96
,79
5
$3
45,7
81
$−
$−
$4
,40
8,5
97
($7
,54
0,1
96
) $
86
0,7
75
Seg
men
t in
tere
st e
xp
en
se
$7,5
43
,13
7
$1,
05
1,8
45
$2
,39
7,1
63
$1,
185
,17
7
$3
,30
2,4
59
$
3,5
57,0
69
$
217
,92
4
($6
,112
,83
9)
$13
,14
1,9
35
Seg
men
t p
rofi
t (l
oss
) b
efo
re inco
me t
ax
$2,9
06
,08
7
($3
,325
,773
) ($
5,3
08
,76
9)
$19
,23
2,8
06
($
10,2
18,4
27)
($15
,776
,08
1)
($1,
814
,99
6)
$3
,10
0,3
76
($
11,2
04
,777
) S
eg
men
t p
rovis
ion
fo
r in
co
me
tax
(2,3
62
,46
1)
25
,119
2,1
19,6
91
(2,0
35
,036
) (2
59
,50
4)
18,5
18
311
,92
7
191,
311
($
1,9
90
,43
5)
Seg
men
t p
rofi
t (l
oss
) aft
er
inco
me
tax
$5
43
,626
($
3,3
00
,65
4)
($3
,18
9,0
78
) $
17,1
97
,770
($
10,4
77,9
31)
($
15,7
57,5
63
) ($
1,5
03
,06
9)
$3
,29
1,6
87
($13
,19
5,2
12)
Net
inco
me (
loss
) att
rib
uta
ble
to
the
eq
uit
y h
old
ers
of
the
Pare
nt
Co
mp
an
y
$5
43
,626
($
3,3
00
,65
4)
($3
,18
9,0
78
) $
17,1
97
,770
($
10,4
77,9
31)
($
10,6
35
,16
1)
($1,5
03
,06
9)
$3,5
83
,84
9
($7,7
80
,64
8)
Decem
ber
31,
20
18
Ph
ilip
pin
es
Ch
ina
Eu
rop
e
Mexic
o
Germ
an
y/U
K
US
A/
Jap
an
/S
ing
ap
ore
/
IMI U
K
Co
nso
lidati
on
and
E
limin
ati
on
s T
ota
l P
are
nt
Co
mp
an
y
PS
i
Reven
ue:
Th
ird
part
y
$24
2,5
82,7
41
$3
6,0
44
,40
0
$3
32,7
55,8
46
$
319
,12
6,4
25
$10
5,4
77
,420
$
312
,40
1,70
4
$1,0
11,9
09
$−
$1,3
49
,40
0,4
45
In
ters
eg
men
t 1,9
92
,122
−
85
,55
5
918
,39
6
1,5
75
,39
1 −
7,1
78
,118
(1
1,74
9,5
82)
– T
ota
l re
venu
e
$24
4,5
74
,86
3
$3
6,0
44
,40
0
$3
32,8
41,
40
1 $
32
0,0
44
,82
1 $
107,0
52,8
11
$3
12,4
01,
70
4
$8
,19
0,0
27
($11
,74
9,5
82
) $
1,3
49
,40
0,4
45
Seg
men
t in
tere
st in
co
me
$
3,1
75
,73
7
$1,7
05
$1,0
39
,44
8
$−
$−
$−
$2
,34
2,6
69
($
5,5
60
,56
4)
$9
98
,99
5
Seg
men
t in
tere
st e
xp
en
se
$8
,05
6,6
65
$6
66
,421
$1,
74
8,3
61
$5
53
,88
3
$2,3
19,17
8
$2
,85
5,1
75
$6
,014
($
4,2
13,3
13)
$11
,99
2,3
84
Seg
men
t p
rofi
t (l
oss
) b
efo
re inco
me t
ax
$14
,48
7,9
77
$
40
0,9
83
$
15,1
52,0
53
$
30
,12
9,9
68
($
15,7
01,
90
9)
$15
,320
,70
4
($1,
425
,36
7)
($1,715
,00
1)
$5
6,6
49
,40
8
Seg
men
t p
rovis
ion
fo
r in
co
me
tax
(2,4
42,0
28
) (1
71,
79
7)
1,0
66
,46
1 (3
,03
0,7
26
) (9
50
,03
6)
(3,1
58
,05
4)
(45
3,7
42)
34
1,5
69
($
8,7
98
,35
3)
Seg
men
t p
rofi
t (l
oss
) aft
er
inco
me
tax
$12
,04
5,9
49
$
22
9,1
86
$
16,2
18,5
14
$27
,09
9,2
42
($16
,65
1,9
45
) $
12,1
62,6
50
($
1,8
79
,10
9)
($1,3
73
,43
2)
$4
7,8
51,
055
Net
inco
me (
loss
) att
rib
uta
ble
to
the
eq
uit
y h
old
ers
of
the
Pare
nt
Co
mp
an
y
$12
,04
5,9
49
$
22
9,1
86
$
16,2
18,5
14
$27
,09
9,2
42
($16
,65
1,9
45
) $
9,5
26
,35
9
($1,
87
9,1
09
) ($
1,0
81,26
9)
$4
5,5
06
,927
Th
e f
ollo
win
g t
ab
le p
rese
nts
seg
men
t ass
ets
of
the G
rou
p’s
geo
gra
ph
ical se
gm
en
ts a
s o
f D
ecem
ber
31,
20
20
an
d 2
019
:
Ph
ilip
pin
es
Ch
ina
Eu
rop
e
Mexic
o
Germ
an
y /
UK
U
SA
/ Jap
an
/ S
ing
ap
ore
Co
nso
lidati
on
an
d
Elim
inati
on
s T
ota
l
P
are
nt
Co
mp
an
y
PS
i
20
20
$
46
7,7
34
,712
$
10,3
70
,94
6
$23
8,5
05
,19
0
$3
04
,25
4,6
10
$9
1,0
15,6
89
$
315
,90
6,8
70
$
415
,92
7,4
32
($
710
,04
0,6
79
) $
1,13
3,6
74
,770
20
19
$5
15,5
12,9
85
$
11,7
43
,46
4
$272,0
01,78
8
$2
89
,40
6,6
40
$
123
,66
0,9
35
$
219
,970
,70
5
$4
18,13
6,9
48
($
75
4,0
97,5
27)
$1,0
96
,33
5,9
38
Invest
men
ts in
su
bsi
dia
ries
an
d inte
rseg
men
t re
ceiv
ab
les
am
ou
nti
ng
to
$3
92
.90
mill
ion a
nd
$3
50
.52 m
illio
n a
s o
f D
ecem
ber
31,
20
20
, re
specti
vely
, an
d
$3
95
.47 m
illio
n a
nd
$38
6.13
mill
ion a
s o
f D
ecem
ber
31,
20
19, re
specti
vely
are
elim
inate
d in
co
nso
lidati
on.
G
oo
dw
ill a
risi
ng
fro
m t
he a
cq
uis
itio
ns
as
dis
clo
sed
in N
ote
11, a
re r
eco
gn
ized
at
co
nso
lidate
d level fo
r b
oth
years
en
ded
Decem
ber
31,
20
20
an
d 2
019
.
Integrated mIcro-electronIcs, Inc.
40 Years of manufacturing technology and Innovation 40 Years of manufacturing technology and Innovation
2020 Integrated rePort
148 149

Revenue from Contracts with Customers Revenues from contracts with customers are further disaggregated by type, customer’s nationality, market segment and timing of revenue recognition, as management believes it best depicts how the nature, amount, timing and uncertainty of revenue and cash flows are affected by economic factors.
The following table presents revenue by type:
2020 2019 Manufacturing of goods $1,129,576,030 $1,244,997,918 Non-recurring engineering services 6,264,563 5,367,996 Revenue from contracts with customers $1,135,840,593 $1,250,365,914
The following table presents revenue from contracts with customer per timing of revenue recognition for each reportable segments:
2020
Revenue recognized
over time
Revenue recognized at point in time Total
Philippines Parent Company $199,431,778 $– $199,431,778 PSi 13,841,873 – 13,841,873 China 225,121,982 – 225,121,982 Europe 263,304,840 1,345,840 264,650,680 Mexico 121,994,587 3,026,800 125,021,387 Germany/UK 93,140,200 175,833,735 268,973,935 USA/Japan/Singapore 37,429,668 1,369,290 38,798,958 Revenue from contracts with customers $954,264,928 $181,575,665 $1,135,840,593
2019
Revenue recognized
over time
Revenue recognized at point in time Total
Philippines Parent Company $227,466,226 $– $227,466,226 PSi 18,381,775 – 18,381,775 China 258,300,064 – 258,300,064 Europe 322,701,152 1,986,185 324,687,337 Mexico 157,852,371 1,708,187 159,560,558 Germany/UK 93,569,019 154,028,071 247,597,090 USA/Japan/Singapore – 14,372,864 14,372,864 Revenue from contracts with customers $1,078,270,607 $172,095,307 $1,250,365,914
The following table presents revenues from external customers based on customer’s nationality:
2020 2019 2018 Europe $675,265,274 $777,467,488 $797,205,895 America 164,835,520 197,209,628 238,841,358 Japan 73,620,703 71,563,832 51,634,368 Rest of Asia/Others 222,119,096 204,124,966 261,718,824 $1,135,840,593 $1,250,365,914 $1,349,400,445
Revenues are attributed to countries on the basis of the customer’s location. The current top customer accounts for 8.34%, 8.51% and 5.88% of the Group’s total revenue in 2020, 2019 and 2018, respectively.
The following table presents revenues per market segment:
2020 2019 2018 Automotive $521,070,692 $601,996,871 $571,123,693 Industrial 355,463,462 380,061,711 379,753,654 Consumer 85,591,512 95,446,491 172,044,981 Telecommunication 64,928,610 80,762,597 89,004,663 Aerospace/defense 47,317,163 53,181,362 56,827,484 Medical 38,013,836 17,592,584 14,273,519 Multiple market/others 23,455,318 21,324,298 66,372,451 $1,135,840,593 $1,250,365,914 $1,349,400,445
The following table presents noncurrent assets based on their physical location:
2020 2019 Europe* $217,770,002 $211,101,116 America** 36,579,308 45,076,036 Rest of Asia/Others 120,653,101 139,502,988 $375,002,411 $395,680,140
*Pertains to Europe, Germany and UK **Pertains to Mexico and USA
Noncurrent assets include property, plant and equipment, goodwill, intangible assets and right of use assets.
The following table presents the depreciation and amortization expense based on their physical location:
2020 2019 2018 Europe* $21,591,738 $21,958,792 $14,147,465 America** 6,417,245 4,575,137 4,054,506 Rest of Asia/Others 27,423,586 22,194,744 19,335,596 $55,432,569 $48,728,673 $37,537,567
*Pertains to Europe, Germany and UK **Pertains to Mexico and USA
30. Lease Commitments
Set out below are the carrying amounts of the Group’s right-of-use assets presented under non-current assets, and the movements during the period:
2020 2019 As at January 1, 2020 $32,027,604 $39,099,942 Additions 8,450,830 – Amortization expense (9,818,095) (6,955,732) Cumulative translation adjustment 2,000,381 (116,606) As at December 31, 2020 $32,660,720 $32,027,604
Set out below are the carrying amounts of the Group’s lease liabilities and the movements during the period:
2020 2019 As at January 1, 2020 $33,797,712 $39,099,942 Additions 10,050,921 – Interest expense on lease liabilities 1,644,189 1,368,494 Rental payments (10,799,326) (7,603,732) Waived rentals (422,841) – Cumulative translation adjustment 1,142,605 933,008 As at December 31, 2020 $35,413,260 $33,797,712 Current $7,785,039 $4,074,866 Noncurrent $27,628,221 $29,722,846
The following are the amounts recognized in consolidated statements of income:
2020 2019 Amortization expense of right-of-use assets
(Notes 20 and 21) $9,395,254 $6,955,732 Interest expense on lease liabilities (Note 23) 1,644,189 1,368,494 Expense related to short-term leases and low-value
assets (included in cost of sales) 1,300,718 2,552,296 Expense related to short-term leases and low-value
assets (included in operating expenses) 394,971 409,527 $12,735,132 $11,286,049
Amortization expense of right-of-use assets recorded in the consolidated statements of income is net of the recognized effect of waived rentals for COVID-19-related rent concessions amounting to $0.42 million (see Note 3). The Group’s lease agreements have terms of fixed payments and there are no variable payment provisions.
Integrated mIcro-electronIcs, Inc.
40 Years of manufacturing technology and Innovation 40 Years of manufacturing technology and Innovation
2020 Integrated rePort
150 151

The Group has several lease contracts that include extension and termination options. These options are negotiated by management to provide flexibility in managing the leased-asset portfolio and align with Group’s business needs. Management exercises significant judgment in determining whether these extension and termination options are reasonably certain to be exercised (see Note 4). Shown below is the maturity analysis of the undiscounted lease payments as of December 31, 2020 and 2019 follow:
2020 2019 Within one year $11,615,891 $8,451,525 After one year but not more than five years 26,108,092 27,268,012 More than five years 10,098,182 10,694,962 $47,822,165 $46,414,499
Lease Commitments Parent Company In 2018, the Parent Company entered into a lease agreement related to warehouse building located in Laguna. The non-cancellable lease is for a period of five years from September 1, 2018 to August 31, 2023 without renewal and termination option. The Parent Company entered into an amended lease contract with Technopark Land, Inc. (TLI), an affiliate, for the lease of parcels of land situated at the Special Export Processing Zone, Laguna Technopark, Biñan, Laguna. The previous lease contract which will expire on December 31, 2022 was extended by another five years up to 2027 subject to new lease rates beginning 2023 based on market with annual escalation thereafter until the end of the term. On March 7, 2014, the Parent Company executed a Lease Agreement with PEZA for the use of land located at the Blk 16 Phase 4 PEZA, Rosario, Cavite to be used exclusively for IMI Cavite’s registered activities. The lease is for a period of 50 years renewable once at the option of the lessee for a period of not more than 25 years. In 2020, the lease agreement was cancelled in line with the sale of the building to a third party.
The Parent Company also entered into an agreement involving the lease of residential houses and lots located in Sta. Rosa, Laguna covering a period of five years from January 1, 2016 to December 31, 2020.
IMI Singapore and STEL Group STEL Group have various operating lease agreements on office premises, plant and equipment, leasehold building and improvement, and motor vehicles. These non-cancellable lease contracts have lease terms of between two to eight years. There are no lease commitments for IMI Singapore.
In 2017, the new entity, IMI SZ, entered into a lease agreement on its manufacturing facility covering a period of six years from May 2017 to May 2023. The lease premise is a five floor building with 29,340 square meters located in an industrial park in Pingshan district of Shenzhen. In 2020, IMI SZ executed a renewal of lease agreement for its 30,430 square meters plant in Kuichong. The coverage of the lease is from November 2019 to November 2022.
In January 2020, IMI CD entered a five year lease agreement, from January 2021 to January 2026, for its electronic production, office and staff accommodation. The lease premises is a three floor building and a dormitory located at Xindu district, Chengdu City.
IMI BG IMI BG have lease agreements related to office and warehouse building rent lease terms of five years. These leases have renewal options.
IMI CZ IMI CZ have various operating lease agreements in respect of its company cars with lease terms of four to five years.
IMI MX IMI MX have various lease agreements related to building and automobiles used in operation with lease terms of three to five years
PSi PSi leases its plant facilities, office spaces and other facilities in Calamba, Laguna from Centereach Resources, Inc. (CRI), an unrelated entity with a term of four years. The operating lease agreements will expire in 2022.
VIA and VTS VIA and VTS lease production buildings with terms ranging from 10 to 20 years. Other agreements involve lease of vehicles and other equipment for periods ranging from one to eight years.
STI STI have various lease agreements in respect of manufacturing facilities, office premises and vehicles both in the UK and Philippines. These non-cancellable lease contracts have remaining non-cancellable lease terms of between three to fifty years. There are no restrictions placed upon the lessee by entering into these leases.
IMI Japan IMI Japan entered into a six-year lease for the lease of office premises which matured in 2018. The lease contract provides for the automatic renewal of the lease contract, unless prior notice of termination is given to the lessor.
IMI USA On June 5, 2020, IMI USA entered into a fourth amendment to a standard industrial commercial single tenant lease contract for an extended term of five years commencing from November 1, 2020 to October 31, 2025 for the lease of office premises. The lease contract contains provisions including, but not limited to, an escalation rate of 3% per year and early termination penalties.
31. Related Party Transactions
Parties are considered to be related if one party has the ability, directly or indirectly, to control the other party or exercise significant influence over the other party in making financial and operating decisions. Parties are also considered to be related if they are subject to common control or common significant influence which include affiliates. Related parties may be individuals or corporate entities.
The Group, in its regular conduct of business, has entered into transactions with subsidiaries, affiliate, and other related parties principally consisting of advances, loans and reimbursement of expenses. Sales and purchases of goods and services as well as other income and expenses to and from related parties are made at normal commercial prices and terms.
Terms and Conditions of Transactions with Related Parties The Group has a Related Party Transactions (RPT) Committee that evaluates and governs related party transactions. Prior to finalization of any related party agreement, the management shall report for review and approval to the RPT Committee all new and proposed significant related party transaction above the threshold set by the RPT Committee. Outstanding balances at year-end are unsecured and settlement occurs in cash unless otherwise stated. For the years ended December 31, 2020, 2019 and 2018, the Group has not recorded any impairment on receivables relating to amounts owed by related parties. Impairment assessment is undertaken each financial year through examining the financial position of the related parties and the markets in which the related parties operate.
In the ordinary course of business, the Group transacts with its related parties. The transactions and balances of accounts with related parties follow:
Transactions with BPI, an affiliate
As of December 31, 2020 and 2019, the Group maintains current and savings accounts and short-term investments with BPI amounting to nil and $1.14 million, respectively.
Total interest income earned from investments with BPI amounted to $0.01 million, $0.01 million and $0.31 million for the years ended December 31, 2020, 2019 and 2018, respectively.
Outstanding balances of the Group’s related party transactions with its affiliates follow:
Receivables/Deposits Payables
2020 2019 2020 2019 KTM Asia Motor Manufacturing Inc. (KAMMI) $184,412 $256,167 $– $– Merlin Solar Technologies (Phils.) Inc. (MSTPI) 99,862 135,751 – – AC Industrials Technology Inc. (AC Industrials) 14,979 48,055 – – BPI – – 20,873 – Innove Communication, Inc. (ICI) 6,460 Globe Telecom, Inc. (GTI) – – – 2,024 $299,253 $439,973 $27,333 $2,024
Integrated mIcro-electronIcs, Inc.
40 Years of manufacturing technology and Innovation 40 Years of manufacturing technology and Innovation
2020 Integrated rePort
152 153

i. Transaction with KAMMI and MSTPI pertains to trade related receivables.
ii. Transaction with AC Industrials pertains to management fee on corporate and support services.
iii. Payable to BPI pertains to employee related transactions.
iv. Payables to ICI pertain to building rental, leased lines, internet connections and ATM connections.
v. Payables to GTI pertain to billings for software and WiFi connections. These are due and demandable.
Revenue/income and expenses from the Group’s affiliates follow:
Revenue/Income Expenses
2020 2019 2018 2020 2019 2018 KAMMI $1,040,797 $1,361,041 $3,845,192 $– $– $– MSTPI 857,807 668,115 872,118 – – – AC Industrials 42,801 49,370 − – – – BPI 3,851 9,740 223,944 − − − IADI – – 110,900 – – – HCMI – – 66,540 – – – ACEI – – 15,430 – – – TLI – – – 1,407,557 1,094,592 1,032,845 Laguna Water (LAWC) – – – 961,519 608,094 571,938 AC – – – 676,738 1,913,224 1,664,336 AG Legal – – – 172,011 113,111 131,289 ICI – – – 135,011 210,871 132,578 GTI – – – 103,492 147,337 108,812 ACEHI – – – – 463,874 4,633,019 $1,945,256 $2,088,266 $5,134,124 $3,456,328 $4,551,103 $8,274,817
Revenue/income from its affiliates pertains to the following transactions:
i. Revenues from KAMMI and MSTPI pertain to subcontracting services related to registered activities.
ii. Revenues from AC Industrials, IADI, HCMI and ACEI represent recoveries for the provision of
corporate and support services.
iii. Interest income earned from investments with BPI.
Expenses incurred from related party transactions include:
i. Light and power allocation charged by ACEHI to the Parent Company. The contract with ACEHI ended in January 2019.
ii. Administrative services charged by AC related to certain transactions.
iii. Rental expense from the lease contract between the Parent Company and TLI.
iv. Water allocation charged by LAWC.
v. Building rental, leased lines, internet connections and ATM connections with ICI.
vi. Consultations on legal matters and assistance on regulatory and legal requirements from AG
Legal.
vii. Billings for cellphone charges and WiFi connections with GTI.
Revenue and expenses eliminated at the Group level follow:
i. Intercompany revenues mainly pertain to billings of IMI USA and IMI Japan to IMI Singapore and the Parent Company for recovery costs related to the management salaries of key management personnel under IMI ROHQ.
ii. Expenses incurred from related party transactions include interest expense of PSi, IMI MX, STI
and IMI CZ from loans granted by the Parent Company, IMI Singapore and STSN.
Guarantees and Commitments IMI BG has agreed to provide continuing operational, investment and financial assistance to the facilities of C-Con GmbH (“C-Con”), a related party and an entity under common control of AC Industrials, for C-Con will duly and timely perform all required obligations under contracts to be entered into with a particular customer. In case of C-Con’s failure to perform its contractual obligations under the contract including but not limited to failure to perform due to C-Con’s insolvency (“Breach”), IMI BG will indemnify and hold harmless the customer from any and all costs, liabilities, damages, losses, and reasonable amount of actually-incurred out of pocket expenses (including court costs and legal expenses) of the customer occasioned by or arising from such Breach. As consideration for extending said guarantee, IMI BG will be charging C-Con a guarantee fee equivalent to two (2%) of the revenue for the projects won using or relying upon IMI BG’s guarantee. Additionally, IMI BG’s guarantee to C-Con is backstopped by AC Industrials (Singapore) Pte. Ltd., another related party of IMI BG.
Compensation of Key Management Personnel of the Group Compensation of key management personnel by benefit type follows:
2020 2019 Short-term employee benefits $6,482,928 $9,513,678 Post-employment benefits 73,519 206,487 $6,556,447 $9,720,165
32. Fair Values of Financial Instruments
Fair Values of Financial Assets and Financial Liabilities where the Carrying Amounts Approximate Fair Values Financial assets and financial liabilities that are liquid or are short-term in nature which consist of cash and cash equivalents, receivables, accounts payables and accrued expenses, loans payable and current portion of long-term debt, are assumed to have carrying amounts approximating their fair values. Below are the fair values of financial assets and financial liabilities that are either carried at fair value or where the carrying amounts do not approximate fair values as of December 31, 2020 and 2019:
Carrying Amounts Fair Values 2020 2019 2020 2019 Financial assets: Financial assets at FVOCI $1,124,461 $1,199,763 $1,124,461 $1,199,763 Financial liabilities: Noncurrent portion of long-term debt $32,210,531 $114,385,913 $33,678,393 $109,757,132 Financial liabilities on put options 1,592,518 22,370,085 1,592,518 22,370,085 $33,803,049 $136,755,998 $35,270,911 $132,127,217 The following methods and assumptions were used to estimate the fair value of each class of financial instruments for which it is practicable to estimate such value:
Financial assets at FVOCI pertain to investments in club shares. Fair value is based on the most recent selling price of the club shares.
Derivatives - These pertain to currency forwards hedged by the Group for risks associated with foreign currency fluctuations. The fair value of the currency forwards is calculated by reference to current forward exchange rates for contracts with similar maturities as advised by the counterparty to the currency forwards contracts.
Financial liabilities on put options - These pertain to the liabilities of Cooperatief and IMI UK arising from the written put options over the non-controlling interest of VIA and STI. The fair value of the financial liabilities is estimated using the discounted, probability-weighted cash flow method. The future cash flows were projected using the equity forward pricing formula with reference to the current equity value of the acquiree and the forecasted interest rate which is the risk-free rate in Germany and UK. The risk-free rate used is (0.72%) and 0.17% for VIA and (1.27%) and 0.74% for STI for 2020 and 2019, respectively. Management applied weights on the estimated future cash flows, based on management’s judgment on the chance that the trigger events for the put options will occur.
The current equity value of VIA prior to derecognition is determined using the discounted cash flow approach. The future cash flows are projected using the projected revenue growth rate of VIA. The discount rate represents the current market assessment of the risk specific to the acquiree, taking into consideration the time value of money and individual risks of the underlying assets that have not been
Integrated mIcro-electronIcs, Inc.
40 Years of manufacturing technology and Innovation 40 Years of manufacturing technology and Innovation
2020 Integrated rePort
154 155

incorporated in the cash flow estimates. The discount rate calculation is based on the specific circumstances of the acquiree and is derived from its weighted average cost of capital. For STI, management used the market approach by approximating the EBITDA multiple taken from comparable companies of STI that are engaged in providing electronics services solutions to derive its current equity value. Management computed EBITDA as the difference of forecasted gross profit and selling and administrative expenses before depreciation and amortization. Another significant assumption is the probability of trigger event occurring within the put option period.
Contingent consideration - This pertains to the contingent consideration related to the acquisition of STI determined by discounting the probability weighted payout as estimated by management. The payout is estimated using the projected revenue growth rate of STI. The discount rate is based on the specific circumstances of the acquiree and is derived from its weighted average cost of capital. The contingent liability was fully reversed in 2019.
Noncurrent portion of long-term debt - The fair value of long-term debt is estimated by using the discounted cash flow method using the current incremental borrowing rates for similar borrowings, with maturities consistent with those remaining for the liability being valued. The discount rates used for 2020 and 2019 ranged from 1.67% to 2.33% and from 1.67% to 3.76%, respectively.
Fair Value Hierarchy The following tables provide the fair value hierarchy of the Group’s assets and liabilities:
December 31, 2020 Fair Value Measurement Using
Quoted Prices in Active Markets (Level 1)
Significant Observable
Inputs (Level 2)
Significant Unobservable
Inputs (Level 3) Total
Assets measured at fair value: Financial assets at FVOCI $– $1,124,461 $– $1,124,461 Liabilities measured at fair value: Financial liabilities on put options
$–
$– $1,592,518 $1,592,518
Liabilities for which fair values are disclosed: Long-term debt $– $– $32,210,531 $32,210,531
December 31, 2019 Fair Value Measurement Using
Quoted Prices in Active Markets (Level 1)
Significant Observable
Inputs (Level 2)
Significant Unobservable
Inputs (Level 3) Total
Assets measured at fair value: Financial assets at FVOCI $– $1,199,763 $– $1,199,763 Liabilities measured at fair value: Financial liabilities on put options
$–
$– $22,370,085 $22,370,085
Liabilities for which fair values are disclosed: Long-term debt $– $– $114,385,913 $114,385,913
The table below shows reconciliation of recurring fair value measurements categorized within Level 3 of the fair value hierarchy:
Dec 31, 2019
Mark-to-market
gain-net Adjustment
to APIC
Currency Translation Adjustment Dec 31, 2020
Financial liabilities on put options $22,370,085 ($6,068,906) ($15,328,945) $620,284 $1,592,518
The Group’s policy is to recognize transfers into and transfers out of fair value hierarchy levels as of the date of the event or change in circumstances that caused the transfer.
There were no transfers between Level 1 and Level 2 fair value measurements, and no transfers into and out of Level 3 fair value measurements.
The following table presents the valuation techniques and unobservable key inputs used to value the Group’s financial liabilities categorized as Level 3: December 31, 2020
Valuation Technique
Unobservable inputs
Range of unobservable
inputs Sensitivity of the input to the fair
value Financial liabilities on put options
Discounted, probability-weighted cash flow method
Probability of trigger events
occurring
1%-10% (5%) Increase in the probability to 10% would result in an increase in fair
value by $0.01 million. Decrease in the probability to 1% would result in
a decrease in fair value by $0.01 million.
December 31, 2019
Valuation Technique
Unobservable inputs
Range of unobservable
inputs Sensitivity of the input to the fair
value Financial liabilities on put options
Discounted, probability-weighted cash flow method
Growth rate 0%-2% (1%) 1% increase in growth rate would result in an increase in fair value by
$1.59 million. Decrease in growth rate by 1% would result in a fair value decrease of $1.25 million.
Discount rate 8%-10% (9%) 1% increase in discount rate would result in a decrease in fair value by $1.83 million. Decrease in discount
rate by 1% would result in a fair value increase of $2.31 million.
Probability of trigger events
occurring
1%-10% (5%) Increase in the probability to 10% would result in an increase in fair
value by $0.77 million. Decrease in the probability to 1% would result in
a decrease in fair value by $1.17 million.
33. Financial Risk Management Objectives and Policies
The Group’s principal financial instruments, composed of loans payable, long-term debt and other financial liabilities, were issued primarily to raise financing for the Group’s operations. The Group has various financial instruments such as cash and cash equivalents, receivables and accounts payable and accrued expenses which arise directly from its operations.
The main purpose of the Group’s financial instruments is to fund its operational and capital expenditures. The main risks arising from the Group’s financial instruments are interest rate risk, liquidity risk, credit risk and foreign currency risk. The Group also enters into currency forwards to manage the currency risk arising from its operations and financial instruments.
The Group’s risk management policies are summarized below:
Interest Rate Risk The Group’s exposure to market risk for changes in interest rates relates primarily to its long-term debt obligations with floating interest rates. The Group’s policy is to manage its interest cost using a mix of fixed and variable rate debt.
The following table demonstrates the sensitivity to a reasonably possible change in interest rates, with all other variables held constant, of the Group’s income before income tax (through the impact on floating rate borrowings) for the years ended December 31, 2020 and 2019. There is no other impact on the Group’s equity other than those already affecting income.
Effect on Net Loss before Tax Increase/Decrease in Basis Points 2020 2019
+100 ($734,980) ($1,114,874) -100 734,980 1,114,874
Integrated mIcro-electronIcs, Inc.
40 Years of manufacturing technology and Innovation 40 Years of manufacturing technology and Innovation
2020 Integrated rePort
156 157

The following table shows the information about the Group’s debt as of December 31, 2020 and 2019 that are exposed to interest rate risk presented by maturity profile:
2020 2019 Within one year $40,879,500 $78,369,092 One to five years 32,618,457 33,118,322 $73,497,957 $111,487,414
Liquidity Risk Liquidity risk is the risk that the Group will encounter difficulty in raising funds to meet commitments associated with financial instruments. The Group’s exposure to liquidity risk relates primarily to its short-term and long-term obligations. The Group seeks to manage its liquidity profile to be able to finance its capital expenditures and operations. The Group maintains a level of cash and cash equivalents deemed sufficient to finance its operations. As part of its liquidity risk management, the Group regularly evaluates its projected and actual cash flows. To cover financing requirements, the Group intends to use internally-generated funds and loan facilities with local and foreign banks. Surplus funds are placed with reputable banks.
The table below summarizes the maturity profile of the Group’s financial liabilities based on contractual undiscounted payments:
2020
On Demand Less than 3 Months
3 to 12 Months 1 to 5 Years Total
Accounts payable and accrued expenses:
Trade payables $− $176,556,142 $− $− $176,556,142 Employee-related accruals and contributions
− 22,993,540
−
−
22,993,540
Accrued expenses* − 26,815,538 − − 26,815,538 Nontrade payables − 15,625,138 − − 15,625,138 Accrued interest payable − 821,933 − − 821,933 Due to related parties − 27,333 − − 27,333 Others − 63,315 − − 63,315 Contract liabilities − 1,515,095 − − 1,515,095 Other financial liabilities 1,680,879 − − − 1,680,879 Loans payable − 193,247,087 13,243,340 − 206,490,427 Current portion of long-term debt − − 2,109,394 − 2,109,394 Noncurrent portion of long-term debt** − − − 33,678,393 33,678,393 $1,680,879 $437,665,121 $15,352,734 $33,678,393 $488,377,127 * Excluding statutory payables. ** Including future interest payments.
2019
On Demand Less than 3 Months
3 to 12 Months 1 to 5 Years Total
Accounts payable and accrued expenses:
Trade payables $− $188,022,901 $− $− $188,022,901 Accrued compensation and benefits
− 20,768,163
−
−
20,768,163
Accrued expenses* − 14,887,159 − − 14,887,159 Nontrade payables − 30,288,964 − − 30,288,964 Accrued interest payable − 2,364,614 − − 2,364,614 Due to related parties − 2,024 − − 2,024 Others − 470,296 − − 470,296 Contract liabilities − 4,742,170 − − 4,742,170 Financial liabilities on put options 22,370,085 − − − 22,370,085 Loans payable − 109,861,945 16,189,602 − 126,051,547 Current portion of long-term debt − − 28,037,902 − 28,037,902 Noncurrent portion of long-term debt** − − − 117,999,395 117,999,395 $22,370,085 $371,408,236 $44,227,504 $117,999,395 $556,005,220 * Excluding statutory payables. ** Including future interest payments.
The financial liabilities in the above tables are gross undiscounted cash flows and these amounts are to be settled through cash and cash equivalents. Furthermore, liquid assets such as cash and cash equivalents and trade receivables, and available credit lines are used by the Group to manage liquidity.
Credit lines The Group has credit lines with different financing institutions as of December 31, 2020 and 2019, as follows:
2020 2019
Financial Institution / Currency Credit Limit Available
Credit Line Credit Limit Available
Credit Line Local: USD 112,000,000 9,000,000 68,000,000 26,000,000 PHP 300,000,000 300,000,000 300,000,000 300,000,000 Foreign: USD 106,500,000 25,403,436 110,500,000 40,120,045 JPY 600,000,000 258,900,000 600,000,000 102,940,000 Singapore Dollar (SGD) 32,000,000 11,075,000 32,000,000 27,679,595 EUR 18,769,597 14,650,130 27,430,000 17,585,654 GBP 5,000,000 2,721,751 5,000,000 3,648,121
Credit Risk Credit risk is the risk that the Group’s counterparties to its financial assets will fail to discharge their contractual obligations. The Group’s major credit risk exposure relates primarily to its holdings of cash and cash equivalents and receivables from customers and other third parties. Credit risk management involves dealing with institutions for which credit limits have been established. The treasury policy sets credit limits for each counterparty. The Group trades only with recognized, creditworthy third parties. The Group has a well-defined credit policy and established credit procedures. The Group extends credit to its customers consistent with sound credit practices and industry standards. The Group deals only with reputable, competent and reliable customers who pass the Group’s credit standards. The credit evaluation reflects the customer’s overall credit strength based on key financial and credit characteristics such as financial stability, operations, focus market and trade references. All customers who wish to trade on credit terms are subject to credit verification procedures. In addition, receivable balances are monitored on an ongoing basis with the result that the Group’s exposure to bad debts is not significant.
The Group defines a financial asset as in default when internal or external information indicates that the Group is unlikely to receive the outstanding contractual amounts in full. Such internal or external information includes discontinuance of orders, financial difficulty or insolvency, probable bankruptcy or other financial reorganization. Actual historical experience shows low defaulted accounts which were also substantially recovered subsequently resulting to insignificant write-offs.
The Group’s maximum exposure to credit risk as of December 31, 2020 and 2019 is the carrying amounts of the financial assets. The Group’s maximum exposure for cash and cash equivalents excludes the carrying amount of cash on hand.
The Group has 20% and 25% of trade receivables relating to three major customers as of December 31, 2020 and 2019, respectively.
As of December 31, 2020 and 2019, the aging analysis of receivables, contract assets and miscellaneous deposits follows:
December 31, 2020
Neither
Past Due nor
Impaired
Past Due but not Impaired Specifically
Impaired Total <30 Days 30-60 Days
60-90 Days
90-120 Days >120 Days
Receivables: Trade $273,278,729 $225,019,629 $26,442,860 $10,695,524 $3,153,478 $1,009,684 $5,453,985 $1,503,569 Nontrade 2,825,231 2,469,447 65,695 66,214 18,250 2,219 55,310 148,096 Receivable from
insurance 1,095,700 −
−
−
−
−
− 1,095,700 Receivable from
employees 329,548 329,548 − − − − − − Due from related
parties 299,253 299,253
−
−
−
−
−
− Others 540,695 540,695 − − − − − −
Contract assets 54,525,401 54,525,401 − − − − − − Miscellaneous deposits 1,547,045 1,547,045 − − − − − − $334,441,602 $284,731,018 $26,508,555 $10,761,738 $3,171,728 $1,011,903 $5,509,295 $2,747,365
Integrated mIcro-electronIcs, Inc.
40 Years of manufacturing technology and Innovation 40 Years of manufacturing technology and Innovation
2020 Integrated rePort
158 159

December 31, 2019
Neither
Past Due nor
Impaired
Past Due but not Impaired Specifically
Impaired Total <30 Days 30-60 Days
60-90 Days
90-120 Days >120 Days
Receivables: Trade $284,594,422 $243,321,981 $20,071,061 $6,174,046 $4,368,587 $449,142 $9,157,890 $1,051,715 Nontrade 6,080,113 5,765,890 26,151 46,769 43,508 3,284 37,388 157,123 Receivable from
insurance 1,086,673 −
−
−
−
−
− 1,086,673 Receivable from
employees 642,995 642,995 − − − − − − Due from related
parties 439,973 439,973
−
−
−
−
−
− Others 94,696 94,696 − − − − − −
Contract assets 58,908,123 58,908,123 − − − − − − Miscellaneous deposits 1,558,138 1,558,138 − − − − − − $353,405,133 $310,731,796 $20,097,212 $6,220,815 $4,412,095 $452,426 $9,195,278 $2,295,511
The following table summarizes the credit quality of the Group’s financial assets as of December 31, 2020 and 2019:
December 31, 2020 Neither Past Due nor Impaired Past Due or
Minimal
Risk Average
Risk Fairly
High Risk High Risk Individually
Impaired Total Cash and cash equivalents $244,355,425 $− $− $− $− $244,355,425 Receivables: Trade 6,730,485 218,297,025 − − 48,251,219 273,278,729 Nontrade 2,469,473 − − − 355,758 2,825,231 Receivable from insurance − − − − 1,095,700 1,095,700 Receivable from employees 329,548 − − − − 329,548 Due from related parties 299,253 − − − − 299,253 Others 540,695 − − − − 540,695 Financial assets at FVOCI 1,124,461 − − − 1,753,589 2,878,050 Miscellaneous deposits 1,547,045 − − − − 1,547,045 $257,396,385 $218,297,025 $– $– $51,456,266 $527,149,676
December 31, 2019 Neither Past Due nor Impaired Past Due or
Minimal
Risk Average
Risk Fairly
High Risk High Risk Individually
Impaired Total Cash and cash equivalents $152,660,116 $− $− $− $− $152,660,116 Receivables: Trade 7,639,505 235,682,476 − − 41,272,441 284,594,422 Nontrade 5,765,890 − − − 314,223 6,080,113 Receivable from insurance − − − − 1,086,673 1,086,673 Receivable from employees 642,995 − − − − 642,995 Due from related parties 439,973 − − − − 439,973 Others 94,696 − − − − 94,696 Financial assets at FVOCI 1,199,763 − − − 1,753,589 2,953,352 Miscellaneous deposits 1,558,138 − − − − 1,558,138 $170,001,076 $235,682,476 $– $– $44,426,926 $450,110,478
The Group classifies credit quality as follows:
Minimal Risk - Credit can proceed with favorable credit terms; can offer term of 15 to maximum of 45 days. Average Risk - Credit can proceed normally; can extend term of 15 to maximum of 30 days.
Fairly High Risk - Credit could be extended under a confirmed and irrevocable LC and subject to semi-annual review for possible upgrade.
High Risk - Transaction should be under advance payment or confirmed and irrevocable Stand-By LC; subject to quarterly review for possible upgrade after one year.
Foreign Currency Risk The Group’s foreign exchange risk results primarily from movements of the functional currency of each legal entity against other currencies. As a result of significant transactions denominated in RMB, PHP and EUR the consolidated statements of income can be affected significantly by movements in the USD versus these currencies. In 2020 and 2019, the Group entered into currency forward contracts to hedge its risks associated with foreign currency fluctuations.
The Group also has transactional currency exposures. Such exposure arises from sales or purchases denominated in other than the Group’s functional currency. Approximately 62% and 61% of the Group’s sales for the years ended December 31, 2020 and 2019, respectively, and 58% and 48% of costs for the years ended December 31, 2020 and 2019, respectively, are denominated in currencies other than USD.
The Group manages its foreign exchange exposure risk by matching, as far as possible, receipts and payments in each individual currency. Foreign currency is converted into the relevant domestic currency as and when the management deems necessary. The unhedged exposure is reviewed and monitored closely on an ongoing basis and management will consider hedging any material exposure where appropriate. Information on the Group’s foreign currency-denominated monetary assets and liabilities and their USD equivalent follows:
Renminbi (RMB) 2020 2019 In USD In RMB In USD In RMB Cash and cash equivalents $2,351,896 RMB15,345,793 $12,454,756 RMB87,035,335 Receivables 20,873,053 136,193,743 57,840,044 404,193,179 Accounts payable and accrued expenses (26,081,420) (170,177,605) (44,575,728) (311,500,545) Net foreign currency-denominated assets
(liabilities) ($2,856,471) (RMB18,638,069) $25,719,072 RMB179,727,969
Philippine Peso (P=) 2020 2019 In USD In PHP In USD In PHP Cash and cash equivalents $1,096,126 P=52,639,248 $1,006,890 P=50,983,899 Receivables 2,015,909 96,809,988 903,770 45,762,395 Miscellaneous deposits 718,605 34,509,570 681,536 34,509,570 Accounts payable and accrued expenses (18,288,415) (878,264,558) (12,508,462) (633,365,998) Net retirement liabilities (8,989,957) (431,724,693) (7,549,797) (382,283,970) Net foreign currency-denominated
liabilities ($23,447,732) (P=1,126,030,445) ($17,466,063) (P=884,394,104)
Euro (€)
2020 2019 In USD In EUR In USD In EUR Cash and cash equivalents $2,990,044 €2,443,046 $2,919,381 €2,622,277 Receivables 10,264,297 8,386,549 10,341,564 9,289,108 Accounts payable and accrued expenses (16,388,400) (13,390,309) (9,088,738) (8,163,782) Net foreign currency-denominated assets
(liabilities) ($3,134,059) (€2,560,714) $4,172,207 €3,747,603
Information on the Group’s USD-denominated monetary assets and liabilities of the Parent Company’s subsidiaries with functional currencies other than USD and which is also affected by movements of USD compared with their respective functional currencies as at December 31, 2020 and 2019 follows: 2020 In USD In EUR In RMB In GBP Cash and cash equivalents $100,824,850 €80,925,059 RMB1,936,150 £1,098,723 Receivables 16,739,927 5,511,729 24,914,721 4,572,554 Accounts payable and accrued expenses (48,618,830) (15,520,948) (158,942,289) (3,896,969) Net foreign currency-denominated assets
(liabilities) $68,945,947 €70,915,840 (RMB132,091,418) £1,774,308
*The USD-denominated monetary assets and liabilities are translated using EUR0.81706 for $1, RMB6.5249 for $1 and GBP0.74041 for $1. 2019 In USD In EUR In RMB In GBP Cash and cash equivalents $2,592,288 €1,043,813 RMB1,064 £1,096,419 Receivables 13,763,749 3,194,786 359,633 7,786,193 Accounts payable and accrued expenses (27,643,450) (12,978,500) (31,648,618) (6,643,847) Net foreign currency-denominated assets
(liabilities) ($11,287,413) (€8,739,901) (RMB31,287,921) £2,238,765
*The USD-denominated monetary assets and liabilities are translated using EUR0.8982 for $1, RMB6.9881 for $1 and GBP0.7667 for $1.
Sensitivity Analysis The following tables demonstrate sensitivity to a reasonably possible change in the USD exchange rate, with all other variables held constant, of the Group’s income before income tax (due to changes in the fair value of monetary assets and liabilities) as of December 31, 2020 and 2019. The reasonably possible change was computed based on one year average historical movement of exchange rates between the USD and other currencies.
Integrated mIcro-electronIcs, Inc.
40 Years of manufacturing technology and Innovation 40 Years of manufacturing technology and Innovation
2020 Integrated rePort
160 161

There is no other impact on the Group’s equity other than those already affecting income. The increase in USD rate as against other currencies demonstrates weaker functional currency while the decrease represents stronger USD value.
Currency Increase/Decrease
in USD Rate Effect on Net Income before Tax
2020 2019 RMB +1% $31,134 ($284,898) -1% (31,134) 284,898 PHP +1% 246,365 167,699 -1% (246,365) (167,699) EUR +1% 49,052 (42,366) -1% (49,052) 42,366 USD* +1% 1,123,204 (138,146) -1% (1,160,951) 141,162 * The USD-denominated monetary assets and liabilities are translated using EUR0.81706 for $1, RMB6.5249 for $1 and GBP0.74041 for $1.
Derivatives As of December 31, 2020, and 2019, the outstanding forward contracts have a net fair value of $88,361 (liability) and $5,321 (asset), respectively. The changes in fair value of currency forwards recognized in 2020 and 2019 amounted to $0.1 million loss and $0.02 million gain, respectively. The changes in fair value of currency forwards are recognized in the consolidated statements of income under “Foreign exchange gains (losses) - net” account.
Fair Value Changes on Derivatives The net movements in the fair value of the Group’s derivative instruments as of December 31, 2020 and 2019 follow:
2020 2019 Financial assets: At beginning of year $5,321 $3,521 Fair value of currency forwards − 15,373 Fair value of settled instruments (5,321) (13,555) Foreign currency exchange difference − (18) At end of year $− $5,321
Financial liabilities: At beginning of year $− $− Fair value of currency forwards 92,122 − Fair value of settled currency forwards − − Foreign currency exchange difference (3,761) − At end of year $88,361 $−
34. Contingencies
The Group has various contingent liabilities arising in the ordinary conduct of business which are either pending decision by the courts or being contested. The outcome of these cases is not presently determinable.
The Group’s expanding global activities, while continuing to present a myriad of growth opportunities, also tend to increase its exposure to potential disputes with customers and suppliers. Such exposure could, in turn, directly or indirectly, affect the Group’s ability to realize its short and long-term target revenues and operating margins from its services as well as adversely impact its net assets, financial position and results of operations. In this connection, the Group is currently involved in an ongoing arbitration proceeding arising from a contractual dispute with its customer.
In the opinion of management and its legal counsel, the eventual liability under these lawsuits or claims, if any, will not have a material or adverse effect on the Group’s financial position and results of operations. The information usually required by PAS 37, Provisions, Contingent Liabilities and Contingent Assets, is not disclosed on the ground that it can be expected to prejudice the outcome of these lawsuits, claims and assessments.
35. Notes to Consolidated Statements of Cash Flows
The Group’s noncash investing activities include capitalization by the Group of depreciation related to the development phase of certain projects amounting to nil and $1.57 million for 2020 and 2019,
respectively. During the year, the Group transferred property, plant and equipment with a net book value of $2.56 million to other noncurrent assets, and licenses to intangible assets amounting to $2.11 million.
The following table shows the reconciliation of liabilities arising from financing activities:
Cash Flows Non-cash Changes
2019 Availment Settlement/
Payment Reclass Addition Declaration
Accretion of interest
expense Waived rentals
Foreign currency
translation 2020 Dividends payable $– $– ($6,504,083) $– $– $6,504,083 $– $– $– $– Loans payable 126,051,547 82,665,635 (4,974,751) − − – – – 2,747,996 206,490,427 Current portion of long-term debt 28,037,902 − (28,288,035) 2,062,455 – – – – 297,072 2,109,394 Long-term debt 114,385,913 − (80,209,436) (2,062,455) – – – – 96,509 32,210,531 Lease liabilities 33,797,712 − (10,799,326) – 10,050,921 – 1,644,189 (422,841) 1,142,605 35,413,260 Other noncurrent
liabilities 3,623,257 1,640,002 − – – – − − − 5,263,259 $305,896,331 $84,305,637 ($130,775,631) $– $10,050,921 $6,504,083 $1,644,189 ($422,841) $4,284,182 $281,486,871
Cash Flows Non-cash Changes
2018 Availment Settlement/
Payment Reclass Addition Declaration
Accretion of interest expense
Foreign currency
translation 2019 Dividends payable $– $– ($4,436,707) $– $– $4,436,707 $– $– $– Loans payable 136,338,960 11,099,338 (20,540,547) − − – – (846,204) 126,051,547 Current portion of long-term debt 63,431,844 − (46,510,457) 11,167,522 – – – (51,007) 28,037,902 Long-term debt 124,543,174 903,420 − (11,167,522) – – – 106,841 114,385,913 Lease liabilities 39,099,942 − (7,603,732) – 1,174,346 – 1,368,494 (241,338) 33,797,712 Other noncurrent
liabilities 5,249,903 − (1,626,646) – − – − − 3,623,257 $368,663,823 $12,002,758 ($80,718,089) $– $1,174,346 $4,436,707 $1,368,494 ($1,031,708) $305,896,331
Most of the loans are from existing revolving credit lines.
36. Other Matters
Corporate Recovery and Tax Incentives for Enterprises Act” or “CREATE” On February 3, 2021, the Bicameral Conference Committee, under the 18th Congress of the Philippines, ratified the reconciled version of the House Bill No. 4157 and Senate Bill No.1357 (the CREATE). Some of the key features of the CREATE bill are the following: Reduction in current income tax rate from 30% to 25% or 20%, whichever is applicable, effective
July 1, 2020; Reduction of non-deductible interest expense Effective July 1, 2020 until June 30,2023, the MCIT rate shall be one percent 1%; Exemption to tax on foreign-sourced dividends received subject to certain conditions; Imposition of improperly accumulated earnings tax is hereby repealed; Rationalization of fiscal incentives
As at February 24, 2021, the harmonized copy of the CREATE bill has been transmitted to the Office of the President for signing or approval into law. COVID-19 Pandemic The manufacturing operations of IMI was highly affected by various government mandated lockdowns in China, Philippines and Mexico and voluntary shutdowns in the Europe factories to align with the demand slowdown during the first half of the year. Revenues in the second half of the year recouped, 39% better than first half and 7% higher year-on year on the back of strong demand recovery and subsequent normalization of operations. The global demand for security and I-o-T products boosted industrial revenue while mobility-focused European and North American facilities benefitted from the rapid rise of global automotive production. In addition, IMI’s growing foothold in the profitable medical segment also led to increased higher margin sales for its manufacturing plants in Asia. To mitigate the impact of the lockdowns, various sites affected obtained approvals to run essential businesses, optimized manpower resources and implemented various cost cutting initiatives. The Group also collaborated with local government units to secure various forms of employee related subsidies as a result of the shutdowns in Bulgaria, China, Czech Republic, France, Mexico, Serbia, and Singapore. These, along with improved manufacturing efficiency drove improved margins and lower losses compared to last year. The effects of potential recurrence of pandemic related shutdowns after the reporting period may pose risks and unfavorable impact to the Company but will not materially affect the Company’s ability to continue as going concern.
Integrated mIcro-electronIcs, Inc.
40 Years of manufacturing technology and Innovation 40 Years of manufacturing technology and Innovation
2020 Integrated rePort
162 163

Corporate direCtoryintegrated Micro-electronics, inc.North Science AvenueLaguna TechnoparkSpecial Export Processing ZoneBiñan 4024, Laguna PhilippinesTel no.: +63 2 7756 6840Fax no.: +63 49 544 0322E-mail: [email protected]: www.global-imi.com
pSi technologies, incLot B2-5 Carmelray Industrial Park IISpecial Economic ZoneBarangay Milagrosa, Calamba, Laguna 4027Tel no.: +63 2 8405 5001 / +63 49 554 9990
Speedy-tech electronics ltd.Speedy-Tech Industrial Building20 Kian Teck LaneSingapore 627854Tel no.: +65 6262 1118Fax no.: +65 6262 6668
iMi technology (Shenzhen) Co., ltd. Pingshan site27, Chuang Jing RoadLongtian SubdistrictPingshan District 518118Shenzhen, People’s Republic of ChinaTel no.: +86 755 6182 3888
iMi technology (Shenzhen) Co., ltd. Kuichong siteIMI Building A2-4Kuichong Life Science Industrial ParkDaPeng New DistrictShenzhen, People’s Republic of ChinaTel no.: +86 755 8977 3788
Speedy-tech electronics (Jiaxing) Co., ltd.Building 1-4, No. 688, Heping StreetJiaxing Zhejiang Province 314001People’s Republic of ChinaTel no.: +86 573 8222 4999
iMi (Chengdu) ltd.Muwei Industrial Park, Huanghe RoadEast Industrial Zone, Xindu District, Chengdu CitySichuan Province 610500People’s Republic of ChinaTel no.: +86 28 8395 8377Fax no.: +86 28 8395 5509
iMi uSa, inc.14312 Franklin AvenueSuite A, Tustin, CA 92780, USATel no.: +1 714 734 7056Fax no.: +1 714 838 8787
integrated Micro-electronics Bulgaria eoodIndustrial Zone “Microelektronika” P.O 662140 BotevgradSofia District, BulgariaTel no.: +359 723 68 300
5th floor, entr. B, bl. 330“Deliyska Vodenitsa” StreetDruzhba 2, 1 582 Sofia, BulgariaTel no.: +359 2 9215033
integrated Micro-electronics d.o.o. nišIMI 1, 18205 niš Banja, SerbiaTel no.: +381 18 41 51 300
integrated Micro-electronics Czech republic s.r.o.Plzenská 1067, Tremošná 330 11Czech RepublicTel no.: +420 377 882 611Fax no.: +420 377 882 610
integrated Micro-electronics México, S.a.p.i. de C. VCalle 4 Poniente no. 10560 / Calle A 239Parque Industrial El SaltoC.P.45680 El Salto, Jalisco, MexicoTel. no: +52 33 4777 1500
Surface technology internationalOsborn Way Hook HampshireRG27 9HX UKTel no.: +44 (0) 1256 768070
First Avenue Poynton Industrial EstatePoynton Stockport Cheshire SK12 1NE UKTel. no.: +44 (0) 1625 884849Fax no.: +44 (0) 1625 884899
3rd Avenue Block C-5 MEZ1 Lapu-Lapu 6015Cebu, PhilippinesTel no.: +63 0 32 265 5100
Via optronics ag/gmbHSieboldstr. 18D-90411 NurembergTel no.: +49 911 597 575 0Fax no.: +49 911 597 575-110/111
Via optronics (Suzhou) Co., ltd158 - 50 Huashan Rd.FengQiao Industry ParkSuzhou new District, Jiangsu, ChinaTel no.: +86 512 6661 0700
VtS-touchsensor Co., ltd.1101-20, Myohouji-cho, HigashiOmi Shiga527-0046 JapanTel no.: +81 748 24 3440Fax no.: +81 748 24 3521
4237-1, Soshinden, Satte Saitama340-0133 JapanTel no.: +81 480 483507Fax no.: +81 480 480 617
IMI welcomes inquiries
from analysts, the
financial community,
institutional investors,
customers, media, and
the general public.
investors [email protected] governance [email protected]; [email protected]
Sales [email protected] Sustainability [email protected]
data privacy [email protected] Media [email protected] Careers [email protected]
StaKeHolder inQuirieS
SaleS offiCe – Via optronics
Headquarters and German OfficeVIA optronics GmbHSieboldstr. 18D-90411 NurembergTel no.: +49 911 597 575-0Fax no.: +49 911 597 575-110/111
uSVia optronics llC6220 Hazeltine National Dr Suite 120Orlando, FL 32822Tel no.: +1 407 745 5031Fax no.: +1 407 745 5037
aSiaVia optronics2F, No 97, Sec 2, Dunhua S Rd., Da’an Dist.Taipei, 106, TaiwanTel no.: +886 2 2703 6660
VtS-touchsensor Co., ltd.2-8-7, Asahigaoka, Hino Tokyo191-0065 Japan
SaleS offiCe – iMi
aMeriCaSiMi uSa, inc.14312 Franklin AvenueSuite A, Tustin, CA 92780, USATel no.: +1 714 734 7056Fax no.: +1 714 838 878
europeiMi france20 Rue De La Villette69328 Lyon Cedex 03FranceTel no.: +33 0 4 26 68 50 08
iMi europe 53773 HennefGermanyMobile no.: +49 172 5880066
JapaniMi Japan, inc.461-0005 Aichi-ken,Nagoya-shi, Higashi-kuHigashisakura 2-5-11Shoener Building 4th FloorTel no.: +81 52 932 1001Fax no.: +81 52 932 2002
iMi israel9 Hapatish St. Hod HasharonIsrael 4531709Tel: +972 9793 1966Fax +972 77 400 6330Mobile +972 545 602401
SHareHolder SerViCeS and aSSiStanCe For inquiries regarding dividend payments, change of address and accounts status, lost or damaged stock certificates, please contact: BPI Stock Transfer Office 3rd Floor, BPI Buendia Center
372 Senator Gil Puyat Avenue
Makati City 1209 Philippines
Tel no.: +632 8580 4693 to 95
E-mail: [email protected]
aCKnowledgMentS
Cover Concept Wunderman Thompson design and execution Kestrel IMC Corp portrait photography Cyrus Panganiban
Content StrategyOnwardIR
Integrated mIcro-electronIcs, Inc.
40 Years of manufacturing technology and Innovation 40 Years of manufacturing technology and Innovation
2020 Integrated rePort
164 165

`
Integrated MIcro-electronIcs, Inc.north scIence avenue, specIal export processIng Zone
laguna technopark, BIñan, laguna, 4024 phIlIppInestel no.: +63 2 7756 6840
www.global-imi.com