TECHNOLOGY INTENSIVE MANUFACTURING AND INNOVATION …
19
1 TECHNOLOGY INTENSIVE MANUFACTURING AND INNOVATION IN SOUTH AFRICA: A COMPARISON WITH THE BRIC COUNTRIES AND AN EMPRICAL EXAMINATION OF TECHNOLOGY BASED FIRMS David Kaplan Abstract There is considerable interest in the economic progress of the BRICS and in their capacity to enter into more technologically demanding activities. But, there is considerable variation in the rate of innovation as between the BRICS. This paper focuses on South Africa. The first part of the paper examines South Africa’s poor performance by comparison with other BRIC countries over the past two decades in respect of innovation and the development of high technology manufacturing sectors and activities. The second part of the paper examines a number of technology and innovation indices, both on the input and on the output side, to show that while in the mid-1990s, South Africa led the BRIC countries in terms of innovation, it has now fallen significantly behind. Brazil has many similarities with South Africa particularly in relation to the manufacturing sector – inter alia share in the economy and long term growth rates as between the two countries are similar. Accordingly, particular attention is paid to comparing South Africa with Brazil. While comparative statistical data are lacking, South Africa is developing comparatively few new technology based firms. The third part of the paper accordingly examines a number of high technology firms and sectors in South Africa. Utilising extensive interviews and case study material, supplemented where available by statistical data, the concern is to map the nature of the technology or innovation undertaken by South African firms; the constraints under which they operate and the extent to which current government policy addresses these constraints. The conclusion draws some broad implications of the analysis for government’s current industrial strategy.
Transcript of TECHNOLOGY INTENSIVE MANUFACTURING AND INNOVATION …

1
TECHNOLOGY INTENSIVE MANUFACTURING AND INNOVATION IN SOUTH
AFRICA: A COMPARISON WITH THE BRIC COUNTRIES AND AN EMPRICAL
EXAMINATION OF TECHNOLOGY BASED FIRMS
David Kaplan
Abstract
There is considerable interest in the economic progress of the BRICS and in their capacity to
enter into more technologically demanding activities. But, there is considerable variation in
the rate of innovation as between the BRICS.
This paper focuses on South Africa. The first part of the paper examines South Africa’s poor
performance by comparison with other BRIC countries over the past two decades in respect
of innovation and the development of high technology manufacturing sectors and activities.
The second part of the paper examines a number of technology and innovation indices, both
on the input and on the output side, to show that while in the mid-1990s, South Africa led the
BRIC countries in terms of innovation, it has now fallen significantly behind.
Brazil has many similarities with South Africa particularly in relation to the manufacturing
sector – inter alia share in the economy and long term growth rates as between the two
countries are similar. Accordingly, particular attention is paid to comparing South Africa with
Brazil.
While comparative statistical data are lacking, South Africa is developing comparatively few
new technology based firms. The third part of the paper accordingly examines a number of
high technology firms and sectors in South Africa. Utilising extensive interviews and case
study material, supplemented where available by statistical data, the concern is to map the
nature of the technology or innovation undertaken by South African firms; the constraints
under which they operate and the extent to which current government policy addresses these
constraints.
The conclusion draws some broad implications of the analysis for government’s current
industrial strategy.

2
Introduction
A key contrast between South Africa and the other BRIC countries is South Africa’s
comparatively poor performance over the past two decades in respect of innovation and the
development of high technology manufacturing sectors and activities. This is briefly outlined
in the first part of the paper.
The second part of the paper examines a number of technology and innovation indices to
show that while in the mid-1990s, South Africa led the BRIC countries in terms of
innovation, it has now fallen significantly behind.
Particular attention is paid to comparing South Africa with Brazil.1
While comparative data are lacking, South Africa is developing comparatively few new
technology based firms. The third part of the paper accordingly examines a number of high
technology firms and sectors in South Africa. Utilising extensive case study material,
supplemented where available by statistical data, the concern is to map the nature of the
technology or innovation; the constraints under which South African firms operate and the
extent to which current policy addresses these constraints.
The further development of manufacturing is currently at the center of South African
government policy to raise aggregate output and enhance economy-wide employment. The
implications of this analysis for the broad strategic direction of government’s industrial
policy are outlined in the conclusion.
1. Manufacturing Performance
Over the period 1995 – 2010, measured in constant $US, by comparison with China and
India, South Africa performs poorly in growth in manufacturing value added (MVA).
However, South Africa outperforms Brazil: the annual growth rate of MVA in South Africa
1995 – 2010 was 2.4 percent whereas it was 1.7 percent in Brazil.
1 Brazil has many similarities with South Africa particularly in relation to the manufacturing sector – inter alia
share in the economy and long term growth rates as between the two countries are similar.

3
Table 1. Manufacturing Value Added. BRICS (excluding Russia). 1995 – 2010 (constant
$US (millions)
1995 2000 2005 2010 %
change
1995 -
2010
CAGR
1995-
2010
%
change
2000-
2010
CAGR
2000 –
2010
Brazil 94987 96165 110966 122633 29 1.7 27.5 2.5
China 241973 384942 630818 1115271 361 11 190 11.2
India 52325 65753 91869 142305 172 6.9 116 8
Russia --- --- ---- --- --- -- --- --
South
Africa
20300 22926 26678 28850 42 2.4 26 2.3
Source: World Development Indicators
In terms of growth in manufacturing exports, South Africa has performed poorly by
comparison with China and India. South Africa has performed less well than Brazil, but the
difference between the two countries is marginal. South Africa has also performed better than
Russia.
Table 2. Manufacturing Exports, Trade Value. BRICS, 1995 - 2010 (current $US millions)
1995 2000 2005 2010 % change
1995 - 2010
Brazil 24703 31987 62534 72467 193
China 125168 219841 700075 1476007 1979
India 23277 32970 71319 140471 503
Russia 23061 24323 45278 58696 154
South Africa 12200 14149 26435 33169 171
Source: COMTRADE
It is in respect of high technology exports that South Africa performs particularly poorly – by
comparison with all of the BRIC countries, including Russia. Brazil’s growth rate is almost
six times that of South Africa.
Table 3. High Technology Exports. BRICS, 1995-2009 (current $US millions)
1995 2000 2005 2009 % change
1995-2009
Brazil 1,197 5,738 8,028 8,316 595
India 1,001 1,569 3,383 10,143 913
China 13,175 40,837 214,246 348,294 2543
Russia 2,162+ 4,191 3,690 4,576 112
South Africa 692 986 1,739 1,418 104
+Data for 1996
Source: World Development Indicators.

4
Currently, high technology exports are a far smaller share of manufactured exports in South
Africa than in any of the other BRIC countries. In 2010, the latest year available, high
technology exports were 7.2 percent for India; 8.85 percent for Russia; 11.4 percent for
Brazil and only 4.28 percent for South Africa. Moreover, high technology exports as a share
of manufactured exports in South Africa have been declining.
Table 4. High Technology Exports as a Percentage of Manufactured Exports
1992 -1995 1996 – 2000 2001 - 2005 2006 - 2010
Brazil 4.6 11.0 14.4 12
Russia - 11.9 14.7 7.8
India 4.72 6.2 6.2 7.1
China 8.1 15.4 26.6 28
South Africa 5.6 7.2 5.7 5.3
Source: World Development Indicators
As this brief outline has shown, South Africa performs poorly by comparison with the other
BRIC countries in respect of the more technologically sophisticated manufacturing sectors.
2. Technology and Innovation Performance Indicators
This section of the paper examines a number of economy wide technology and innovation
performance indicators in South Africa by comparison with the other BRIC countries. Two
input indicators are examined – R&D spending as a share of GDP and number of researchers
per population. Two output indicators are examined – patents (including co-invention) and
technology balance of payments (technology receipts and payments). These indicators further
confirm that South Africa is falling behind the other BRIC countries in the technology and
innovation realm.
2.1 R&D Expenditure as a Share of GDP
South Africa’s gross expenditure on R&D has been increasing and is currently very close to
the government’s declared target of 1 percent. This is somewhat below that of Russia, China
and Brazil – but higher than India. As South Africa’s economy is significantly smaller than
the other BRIC countries, overall expenditure on R&D in South Africa is significantly less.
Moreover, since GDP has tended to rise more slowly in South Africa, particularly by
comparison with China and India and, more recently with Brazil, South Africa is, over time,
devoting comparatively less overall resources to R&D.
Table 5. R&D as Percentage of GDP; BRICS, 2000- 2009
2000 2001 2002 2003 2004 2005 2006 2007 2008 2009
Brazil 1.02 1.04 0.98 0.96 0.90 0.97 1.00 1.07 1.08 -
Russia 1.05 1.18 1.25 1.29 1.15 1.07 1.07 1.12 1.04 1.25
India 0.77 0.75 0.74 0.73 0.74 0.78 0.77 0.76 - -
China 0.90 0.95 1.07 1.13 1.23 1.32 1.39 1.40 1.47 -
South
Africa
- 0.73 - 0.78 0.85 0.90 0.93 0.92 0.93 -

5
Source: World Development Indicators
2.1.2 Researchers per Population
South Africa has a far lower share of population engaged in R&D than China, Russia or
Brazil – but a higher share than India. The rate of growth has been lower than in Brazil, India
and particularly China.
Table 6. Researchers in R&D per million population; BRICs (1997 – 2007)
‘97 ‘99 2001 2003 2005 2007
Brazil - - 441 496 588 658
Russia 3594 3375 3460 3365 3230 3274
India 115 -- 110 -- 136 --
China 47 422 581 667 856 1077
South
Africa
199 -- 312 303 362 396
Source: World Development Indicators
2.1.3 National Patents and Co-Invention
Pre-1998, the number of South African patents at the Unites States Patent Office (USPTO)
significant exceeded that of any of the other BRIC countries. Indeed, the number of South
African patents was only a little less than the total for all the other BRIC countries combined.
But, while patents registered at the USPTO on the part of all the other BRIC countries have
increased significantly every year after 1998, for South Africa the number of patents
registered per annum effectively stagnated. At the end of 2011, the number of South African
patents was 13 percent of all the other BRIC countries combined.2
Currently, Brazil and Russia still have fewer patents at the USPTO. But this reflects South
Africa’s past relative strength and many of these patents are old and will expire. The numbers
of patents currently being registered by Brazil and Russia significantly exceed that of South
Africa. South Africa’s share of global and middle income country patents at the USPTO has
declined significantly.
Table 7. Patents at the USPTO (All Patent Types); BRICS 1998 – 2011
Pre-
1998
‘98 ‘99 ‘000 ‘01 ‘02 ‘03 ‘04 ‘05 ‘06 ‘07 ‘08 ‘09 ‘010 ‘011 All
Years
Brazil 836 88 98 113 125 112 180 161 98 148 118 133 148 219 254 2831
Russia 370 194 185 185 239 203 203 173 154 176 193 181 204 287 307 3254
India 405 94 114 131 180 267 356 376 493 506 578 672 729 1137 1259 7189
China 554 88 99 161 265 391 424 596 565 970 1235 1874 2270 3303 3786 16581
South
Africa
2091 132 127 125 137 123 131 115 108 127 116 124 139 142 144 3831
Source: United States Patent and Trademark Office. Patent Technology Monitoring Team
(2011) Patents by Country, State and Year – All Patent Types (December 2011)
2 For an examination of patents and other technology indicators and the factors that account for South Africa’s
performance, see Kaplan et al, 2011.

6
Since patenting activity has risen significantly globally and especially on the part of middle
income countries, South Africa’s global share and share of middle income country patenting
has declined significantly,
Globally, there has been an increasing trend towards international co-invention whereby
nationals of different countries engage in joint research resulting in co-invented patents.
National patents alone give an incomplete picture of a country’s innovative capacities.
Moreover, as the product of a joint effort, co-invented patents are generally of high value.
Emerging markets and the BRIC countries, in particular, have experienced a rapid growth in
international patenting. “Co-invented patents and Chinese patents owned by Western
multinationals have, in recent years, accounted for the largest fraction of newly granted
USPTO patents. International co-invention is also increasingly important in Indian patenting,
though less so than in China.” Kaplan et al, 2011:8. Co-invention has also been important to
Eastern European countries, especially Russia.
Prior to the mid-1990s, co-invention was insignificant for all of the BRICs. From the mid-
1990s, particularly for China, but for India and for Russia also, co-invention increased
significantly. For Brazil, the increase was less significant, but still evident. The contrast with
South Africa is marked. “Co-invented patents have not expanded rapidly in South Africa –
the total number of co-invented patents especially, as well as the rate of growth of co-
invented patents is generally lower than for comparable countries. Over time, there is no
pronounced trend in the total number of co-invented patents in South Africa. As with South
African patents therefore, co-invented patent activity by South Africans is low and there is no
discernible trend for this to increase over time.” (Kaplan et al, 2011:10) The share of co-
invented patents in South Africa’s total patent activity is significantly lower than for China,
Russia and India. The share of co-invented patents is lower in Brazil than in China, India or
Brazil. However, Brazil’s share of co-invented patents is still more than twice as high in
South Africa (Bransetter, 2009:13)
An examination of South African patenting and co-invention at the USPTO revealed only
two significant clusters of patents – namely in mining related technologies3 and in fuel
technologies4. These two clusters of patents are a larger share of total patenting in South
Africa than in other comparable countries. An examination of the quality of these patent
clusters, based on citations received,5 revealed that the mining related technology patents
were higher than for South African patents in general and was comparable with similar
3 A patent belongs to the “Mining Technologies” cluster if it belongs to one of the following 3-digit USPC
classes: 299 - Mining or In Situ Disintegration of Hard Material, 051 - Abrasive Tool Making Process, Material,
and Composition, 023 - Chemistry: Physical Processes, 037 – Excavating, 075 - Specialized Metallurgical
Processes, 172 - Earth Working.
4A patent belongs to the “Fuel Technologies” cluster if it belongs to one of the following 3-digit USPC classes:
210 - Liquid Purification or Separation; 208 - Mineral Oils: Processes and Products
5 Patent applicants at the USPTO are required to disclose knowledge of the “relevant prior art.” This entails
citations to earlier inventions and other technical advances that are antecedents of the inventions for which the
applicant is seeking patent protection.

7
patents in Australia, Canada and the United States. Fuel technology related patents, by
contrast, were of a significantly lower quality (Kaplan et al, 2011:12).
There were no other areas of significant patent activity. In biotechnology, for example, there
were very few patents and these patents appear to be significantly less highly cited than the
equivalent foreign patents (Kaplan et al, 2011:13).
Outside of mining and related technologies, where South Africa has a long tradition of
expertise and technological innovation, therefore there is no indication of innovative strength.
In the emerging high-technology areas which are patent intensive, such as biotechnology,
there are very few South Africa patents and these tend not to be of high quality.
2.1.4 Technology Balance of Payment (TBP)
The TBP consists of receipts that countries earn through the royalty and licensing payments
of technology to foreigners and the payment that are made by nationals to foreigners so as to
acquire or licence their technology.
Licensing receipts are a particularly significant measure of a country’s technological strength
and in particular, the extent of technological and innovative activity located at or close to the
global technological frontier. South Africa’s declining position with respect to the other
BRIC countries is very evident.
Table 8. Royalty and Licence Fee Receipts; BRICS, 1990 - 2010 (current US $million)
‘90 ‘95 000 001 002 003 004 005 006 007 008 009 010
Brazil 12 32 125 112 100 108 114 102 150 319 464 434 397
Russia - 4 91 60 147 174 227 260 299 393 453 494 625
India 1 1 83 37 20 24 53 206 61 163 148 193 129
China - - 80 110 133 107 236 157 205 343 571 429 830
South
Africa
19 45 49 21 19 27 37 45 46 52 54 48 59
Source: World Development Indicators
In the period 1991 -1995, South African royalty and licence fee receipts significantly
exceeded that of all the other BRIC countries. South Africa averaged royalty and licence
receipts $58 million per annum. The average for Brazil was $ 22 million; for India $1million
and for Russia well below $ 5million.6 By contrast, in the period 2000 – 2010, South African
royalty and licence fee receipts were very significantly less than that of any of the other BRIC
countries. South Africa averaged $ 42 million. The average for Brazil was $ 220 million; for
India $102 million; for Russia $ 293 million and for China $ 291 million.
Whereas all the other BRIC countries have significantly increased their royalty and licence
fee receipts over the last two decades, South Africa’s receipts have declined by 30 percent.
6 Russian earnings averaged $3.8 million for 1994 and 1995. No earlier data is available. No data are available
for China
8
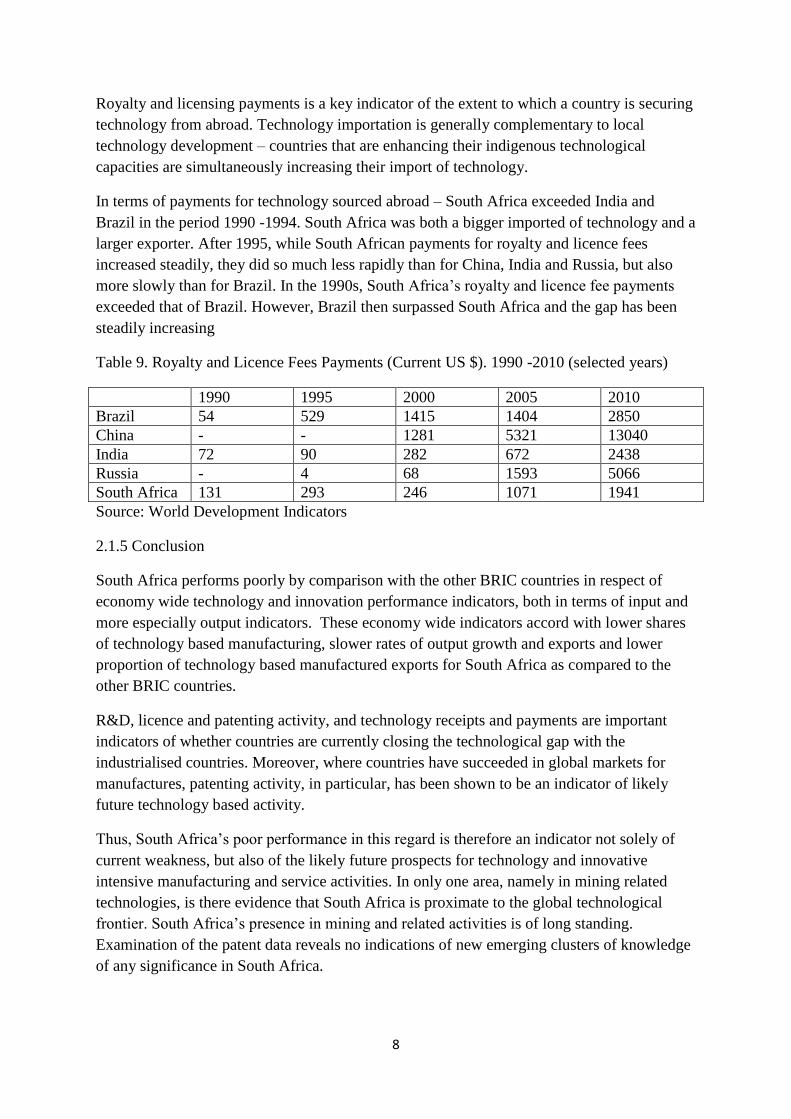
Royalty and licensing payments is a key indicator of the extent to which a country is securing
technology from abroad. Technology importation is generally complementary to local
technology development – countries that are enhancing their indigenous technological
capacities are simultaneously increasing their import of technology.
In terms of payments for technology sourced abroad – South Africa exceeded India and
Brazil in the period 1990 -1994. South Africa was both a bigger imported of technology and a
larger exporter. After 1995, while South African payments for royalty and licence fees
increased steadily, they did so much less rapidly than for China, India and Russia, but also
more slowly than for Brazil. In the 1990s, South Africa’s royalty and licence fee payments
exceeded that of Brazil. However, Brazil then surpassed South Africa and the gap has been
steadily increasing
Table 9. Royalty and Licence Fees Payments (Current US $). 1990 -2010 (selected years)
1990 1995 2000 2005 2010
Brazil 54 529 1415 1404 2850
China - - 1281 5321 13040
India 72 90 282 672 2438
Russia - 4 68 1593 5066
South Africa 131 293 246 1071 1941
Source: World Development Indicators
2.1.5 Conclusion
South Africa performs poorly by comparison with the other BRIC countries in respect of
economy wide technology and innovation performance indicators, both in terms of input and
more especially output indicators. These economy wide indicators accord with lower shares
of technology based manufacturing, slower rates of output growth and exports and lower
proportion of technology based manufactured exports for South Africa as compared to the
other BRIC countries.
R&D, licence and patenting activity, and technology receipts and payments are important
indicators of whether countries are currently closing the technological gap with the
industrialised countries. Moreover, where countries have succeeded in global markets for
manufactures, patenting activity, in particular, has been shown to be an indicator of likely
future technology based activity.
Thus, South Africa’s poor performance in this regard is therefore an indicator not solely of
current weakness, but also of the likely future prospects for technology and innovative
intensive manufacturing and service activities. In only one area, namely in mining related
technologies, is there evidence that South Africa is proximate to the global technological
frontier. South Africa’s presence in mining and related activities is of long standing.
Examination of the patent data reveals no indications of new emerging clusters of knowledge
of any significance in South Africa.

9
3. South Africa’s High Technology Firms – Development and Constraints
Why has South Africa’s rate of growth in all the areas of technological and innovative
capacity been so low and lagging that of the other BRIC countries? Why has South Africa not
succeeded in developing significant new clusters of high technology based firms which
undertake R&D and are successful in export markets or secure global patents? What
innovation and technological adaptation activities are South African firms engaged in and
what are the factors that constrain and inhibit the growth of existent technology based firms
in South Africa? Of particular importance, what are the factors that constrain and inhibit the
growth of new technology based firms?
In order to answer these questions, a number of interviews were undertaken with South
African technology-based firms. Utilising extensive case study material, supplemented where
available by statistical data, the concern is to map the nature of the technology or innovation;
the constraints under which South African firms operate and the extent to which current
policy addresses these constraints.
Technology-based firms were defined as firms which were investing considerable share of
their revenue in innovation or technological adaptation; firms whose competitive position in
the market relied heavily on technological adaptation or innovation and which were either at
the global technology frontier or were technological leaders in the local market.
Three “clusters” of firms were interviewed:
The first “cluster” of firms was located in mining equipment or specialist mining services. As
outlined earlier, this is the one area where South Africa has a significant number of valuable
patents. Complementing this technological capacity, South Africa has a large number of firms
in mining equipment and specialist services which spend considerable share of their resources
on innovation and/or significant technological adaptation and many of these firms are global
market leaders with a significant presence in globally competitive export markets. 12 firms
belonging to this cluster were interviewed. Firms were from across the size spectrum and also
included three foreign owned firms which have a strong presence in South Africa. These firm
level interviews were supplemented by interviews conducted with the relevant export
council; with one of the key publicly funded science councils that engages with this cluster
and with a relevant university based research unit.
The second “cluster” of firms had won local awards for technology development. These firms
were winners of the Technology Top 100 – an annual competitive award given to
technological leaders. These firms had all won in one or more category of technological
advance. They were all manufacturing firms. Five firms were classified as emerging
companies and had been established or engaged in technological advance relatively recently;
one firm was classified as an established firm.7 All of the firms were small. There were six
firms in this “cluster.”
7 In fact, this firm had also been established relatively recently – within the last 7 years.

10
The third “cluster” of firms was located in the ICT software sector. This is a sector where
South Africa has indeed enjoyed some success. A number of South African firms have
developed very innovative products and have succeeded on global markets. Four leading ICT
firms were interviewed – three of the firms had engaged very successfully in global markets;
the fourth was a Technology Top 100 winner and a recognised national leader in its area.
A number of the firm interviews were initially carried out in the course of a World Bank
study on technology absorption in Southern Africa, Goldberg et al, 2011.8
In addition, this firm level examination draws on an earlier study based on interviews with
high technology firms, Breitenbach et al, 2006. This study interviewed 19 high technology
firms drawn from a wide range of sectors and activities. None of the firms interviewed in this
2006 study were included in any of the interview clusters.
Finally, this section also draws on some, albeit limited, statistical data.
3.1 The Nature of Technological Change/ Innovation
Mining capital equipment and specialist service companies are producing a number of
products in which they are global market leaders – washing spirals, alumina ties, pumps,
ventilation equipment and other products. There are also a range of services in which
companies are at the global forefront – shaft sinking, geology and plant design. These
products and services have a significant technological content. Many of the products and
services were initially developed to address the particular problems faced by the South
African mining industry and then extended to the export market. For example, the poor
quality of much of South Africa’s coal required that it be extensively washed. The spirals
developed to address this challenge and the underlying technology thus developed was later
applied to washing in other situations – in the Canadian tar sands, for example. Hydropower,
shaft sinking and ventilation arising from the technical challenges of very deep level gold
mining in South Africa have similarly resulted in the accumulation of technological expertise
that is at the global forefront and that underpins the success of South African firms in global
markets.
A number of mining capital equipment and specialist service companies are also engaged in
the extensive adaptation of technologies and products derived from abroad. All of the firms
interviewed regarded the local mining industry as composed of very demanding buyers who
require globally competitive products and support. Extensive technological adaptation in
order to meet very demanding local operating and environmental conditions and the quality
requirements of the South African mining industry are regarded as clear indications that
products and services meet global standards and are recognised as such by global customers.
Two of the three foreign owned firms interviewed maintained large operations in South
Africa where they undertake extensive adaptation and bespoke design of their products such
as hammer bits and drilling consumables and services such as design drawings for the local
and the regional market. These companies are attracted by the size of the market but also by
8 Eight of the mining equipment and specialist services firms and three of the firms in ICT were interviewed in
the course of the World Bank study.

11
the extensive network of skilled specialists and input suppliers that are available to them
locally.
In summary, mining capital equipment and specialist service companies undertake extensive
technological product and process adaptation as well as extensive product and process
innovation that results in globally leading products.
Technology award winning firms were all engaged in technological adaptation. None of these
small firms were developing or manufacturing products that could be considered new to the
world. Firms were motivated to engage in technological adaptation in order to meet the
requirements and specifications of local customers or to address particular local challenges.
For example, the differences in power supply and the presence of a lot of abrasive materials
require that imported pump designs and technology be extensively adapted to meet local
conditions. In addition, two of these firms sought to engage in technological adaptation as a
means of gaining local market penetration and to challenge a well established market leader.
Cheaper product, customised product and more prompt technological back up are seen as the
key competitive advantage. All of these firms were small and had limited financial and
technological resources. They did not have the wherewithal or the incentive to engage in
substantive innovative activity.
In summary, these technology based small firms are engaged in technological adaptation
rather than frontier innovation. They are more “typical” of local small technology based
firms.
Software firms were all engaged in the development of highly innovative products. Three of
the firms were very successful in global markets. The fourth was a recognised leader in the
local market. The three firms that are successful in global markets offer a globally leading
edge product. The product serves a carefully selected market niche. The foundation of the
success of these local is technological. Innovation is the core of their business. These firms
spend an extensive share of their revenues on technological development and this
development is ongoing requiring constant new and better offerings to their customers. The
fourth firm addresses a particular local problem that requires a software based solution. As
with the other three, it spends a very high share of its revenues on technological development.
While it does not export currently, it sees future potential for exports – notably to countries
that have similar problems to those experienced in South Africa.
In summary, South Africa has developed firms in the broad ICT software area which provide
leading global products in particular niche areas or, in one case, very extensive adaptation to
meet local needs.
3.2 Constraints
Mining capital equipment and specialist service companies almost universally cited the
shortages of skills as the key constraint on their technological advance and on their overall
growth. This concern was echoed by the export council. There is further statistical
corroboration for this concern. In the ES for 2003, skills shortages were cited by all

12
categories of capital goods firms – exporters and non-exporters, foreign owned and
domestically owned – as the top constraint. In the 2007 survey, capital goods firms cited
crime as the top constraint, followed then by skills.9 Skill shortages are exacerbated by the
emigration of skills and the active recruitment of skilled persons by other countries. This is
particularly true of Australia which has attracted very large numbers of South Africans with
mining and mining related skills. All levels of skills are in short supply. Some firms were
concerned by the shortages of engineers, managers and other high level skills. Others singled
out the shortages of artisans. At least one major firm with operations in a number of
countries, saw the shortage of skills, combined with generous government support (see
below) as leading to further technology development activities being cited in Australia rather
than in South Africa.
Two other factors were widely cited by mining capital equipment and specialist service
companies as constraining technological development – namely access to finance and
infrastructure constraints. Finance was cited by four firms as a serious constraint. All of the
firms that cited finance as a serious constraint were small and locally owned firms. None of
the large firms and none of the foreign owned firms regarded finance as a significant
constraint. The concerned firms cited the reluctance of commercial banks to fund longer term
product development programmes unless they were provided with very extensive surety or
collateral. This was very difficult, if not impossible, for the firms to secure. Infrastructure
constraints were cited by almost half of the firms as a serious constraint. The single most
important constraint was power. Power outages are seen as a major constraint on productivity
and on delivery times. Poor rail transport and ports are also of concern. These logistical
constraints impact severely on the local mining industry, but they also impact directly and
adversely on the suppliers of equipment and specialist services. A final overall constraint is
that of crime. Crime is perceived to have been increasing very rapidly. This is borne out in
the ES. In 2007, crime was cited by capital goods firms as the most serious constraint.10
Technology award winning firms cited finance as a key constraint. Firms complained of
severe difficulties in raising seed capita for early product development. One firm very nearly
went out of business and had to pledge all the private assets to secure funding from the bank.
Three firms were successful in finding early stage investors. In all three cases, these were
private investors who took a direct interest in the company and who were acquainted with the
company from the outset. None of the firms succeeded in attracting an early stage private
venture capital investor. One firm did succeed in attracting a private venture capital investor,
but this was only after the product already had a fairly well-established revenue stream. In
effect, this was private equity rather than venture capital finance. Firms also cited difficulties
in acquiring finance in order to undertake the necessary marketing expenditures to launch the
product and also later to ramp up production when products proved successful.
9 Goldberg, et al, 2011:76
10 House and business robberies increased significantly over the period 2005/6 – 2009/2010. 2009/2010 –
2010/2011, household robberies declined but business robberies increased, although marginally by 1 percent. Business robberies were particularly directed at small and medium sized businesses more likely to be run on a cash basis (South African Police Service, 2011: 16-17

13
Skills shortages were cited by four of the firms as a significant constraint. A fifth firm stated
that there would be a skill constraint were they to consider expanding The one firm that did
not cite skills as a problem operated a business model whereby all of the technology
development work was outsourced to specialist engineers with clear performance and product
specifications. Only one of the firms interviewed had a (limited) positive experience with
state supports for training – the SETA system was by-passed by all the rest.
The limited availability of strong support industries and services were cited as a major
constraint by two of the firms. One firm was constrained by the lack of high quality foundries
that rendered their products very expensive and restrained the products that they could design
and develop. Another firm had major difficulties required an extensive modification to a
machine that was initially developed for another purpose and had major difficulties securing
that expertise locally where as it was readily available abroad.
Other constraining factors cited were government procurement and black economic
empowerment. Government procurement was seen to be inefficient such that the procurement
organisations did not clearly specify what they required; it was difficult to know when
tenders were sent out; tendering was expensive for small firms and procurement procedures
lacked transparency. The risks associated with tendering are particularly severe for a small
firm. Black economic empowerment with regard to equity was seen as difficult for a small
company. Small companies could not afford to have partners who were not deeply engaged in
the business while if the business, in the view of the owner, held enormous promise, there
was a clear disincentive to give equity “away” at cheap rates. One of the firms spent a
considerable length of time trying to engage black partners at an early stage of its
development. None were forthcoming, it was claimed, because the risk was perceived as too
great relative to other opportunities readily available to black investors. Finally, none of the
respondents had experience of new small technology based black owned companies in their
areas of activity. The ready availability of alternative, much less risky ventures to black
entrepreneurs was seen to discourage risk taking.
Software firms developing niche products for global markets rely heavily on highly skilled
software engineers. The competitive edge of South African firms rests in their ability to
attract highly skilled software engineers and developers at globally competitive wage rates.
South African wage rates for said to be some 60 percent of those prevailing in Europe or the
United States for a similar level of skills. The firms were firmly of the view that the quality of
their personnel was equivalent to that available anywhere. Moreover salaries are lower in
South Africa. At the same time however, three of the firms were having difficulty in
attracting sufficient numbers of local staff. Two of the firms were, as a result, forced to
employ people from outside South Africa. One of these firms located much of its
development work in India while the other firm imported software skills from India to work
in South Africa.
The cost and quality of bandwidth is cited by two of the firms as a major constraint. The
higher cost of bandwidth is also a factor in one firm favouring undertaking developmental

14
work outside of South Africa.11
Restrictions on the international movement of Intellectual
Property (IP) from South Africa is cited as the factor that would prevent one of the companies
from considering South Africa as the preferred site for the location of a major product
development office. By contrast with other technology based firms, finance is not seen as a
major constraint.
3.3 Government policy and local linkages
Mining capital equipment and specialist service companies had divergent views on
government support. A significant number of the firms – more particularly the smaller firms
– tended to have a negative picture. They were either unaware of government policies or
supports available or else they made only marginal use of the supports available. The larger
firms were more likely to utilise government supports – the tax incentive for R&D; support
for technology development under the Support Programme for Industrial Innovation (SPII) or
training under the SETA programme. The firms were universally of the view that the quality
of the publicly funded research and support institutions in regard to mining, but also in regard
to metallurgy and refining and other mining related areas had declined substantially since
1994. All of the relevant science councils – the CSIR, Mintek and Geological Sciences – had
suffered a decline in funding.12
South Africa’s largest research institution, the CSIR, which
previously had very significant programmes in relation to mining, principally in trackless
mining and rock engineering, was said to have has hardly any research capacity remaining. A
number of firms still made use of these institutions, particularly Mintek, but usage had
declined. Firms were now making much more use of research and technical support provided
by local private firms and increasingly by firms located abroad. By contrast, in Australia,
public funding for mining and mining related research has received increasingly generous
funding. As a result, in areas such as trackless mining where South Africa was previously the
global leader, capacity is now very depleted. Australian research institutions and firms are
currently very dominant. The same trends are evident in respect of university based research.
While South Africa has some capacity and some of that is recognised as world class, research
here too is said to have declined particularly relative to Australia.
Very few of the firms interviewed engaged with the universities. Only one firm had extensive
linkages with university based technological research.
Government policy is regarded by the firms interviewed as having constrained the
development of the local mining industry, principally through creating uncertainty over
property rights that adversely impact on investment decisions and through inadequate
infrastructure provision - electricity that adversely impacts on production and transport that
limits exports. Limited investment in mining has, in turn, reduced the opportunities available
to local suppliers of equipment and specialist services. It is new investments that require new
11
The West African Cable System (WACS) which went live in May 2012 will boost South Africa’s international bandwidth capacity and should result in a reduction in prices. With the launch of Seacom followed by the East African Submarine Cable System (EASSy) and now WACS, the bandwith bottleneck is no longer on the international leg. The constraints are now in the national backhaul infrastructure and pricing. However, a number of initiatives are underway that will soon alleviate this constraint 12
For further details, see Kaplan, 2012.
15
products and services and that therefore provide the major stimulus to innovation and
technological advance.
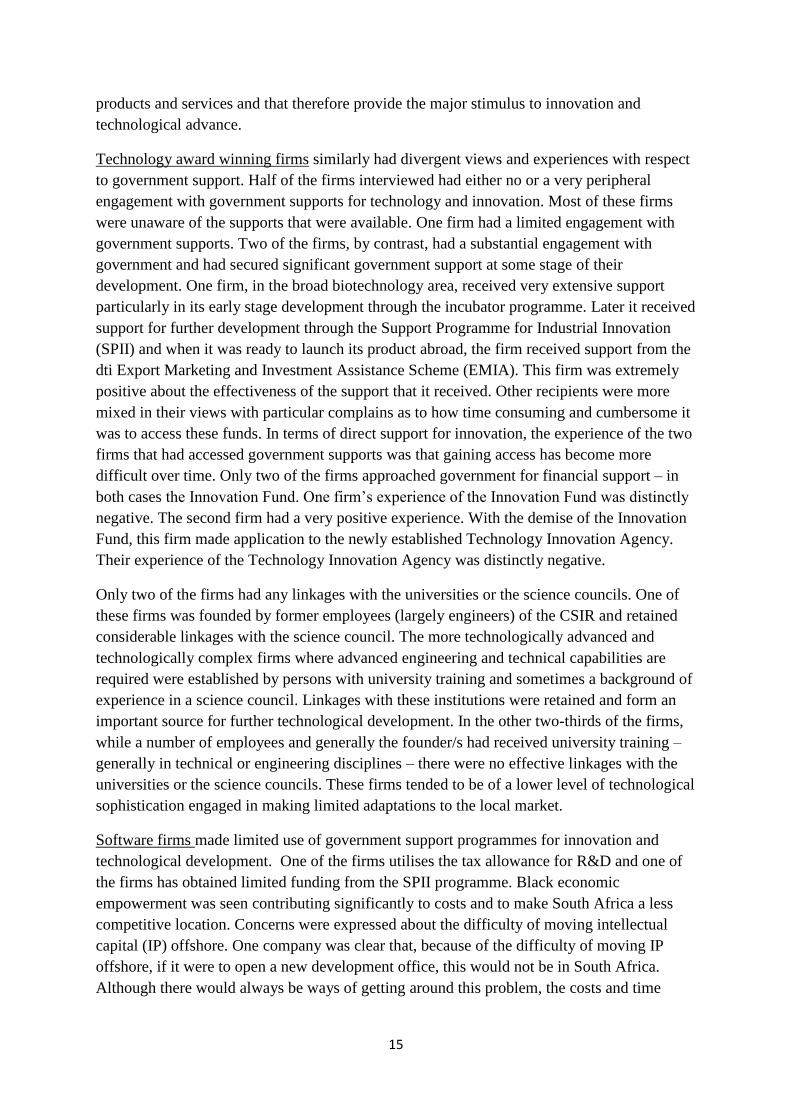
Technology award winning firms similarly had divergent views and experiences with respect
to government support. Half of the firms interviewed had either no or a very peripheral
engagement with government supports for technology and innovation. Most of these firms
were unaware of the supports that were available. One firm had a limited engagement with
government supports. Two of the firms, by contrast, had a substantial engagement with
government and had secured significant government support at some stage of their
development. One firm, in the broad biotechnology area, received very extensive support
particularly in its early stage development through the incubator programme. Later it received
support for further development through the Support Programme for Industrial Innovation
(SPII) and when it was ready to launch its product abroad, the firm received support from the
dti Export Marketing and Investment Assistance Scheme (EMIA). This firm was extremely
positive about the effectiveness of the support that it received. Other recipients were more
mixed in their views with particular complains as to how time consuming and cumbersome it
was to access these funds. In terms of direct support for innovation, the experience of the two
firms that had accessed government supports was that gaining access has become more
difficult over time. Only two of the firms approached government for financial support – in
both cases the Innovation Fund. One firm’s experience of the Innovation Fund was distinctly
negative. The second firm had a very positive experience. With the demise of the Innovation
Fund, this firm made application to the newly established Technology Innovation Agency.
Their experience of the Technology Innovation Agency was distinctly negative.
Only two of the firms had any linkages with the universities or the science councils. One of
these firms was founded by former employees (largely engineers) of the CSIR and retained
considerable linkages with the science council. The more technologically advanced and
technologically complex firms where advanced engineering and technical capabilities are
required were established by persons with university training and sometimes a background of
experience in a science council. Linkages with these institutions were retained and form an
important source for further technological development. In the other two-thirds of the firms,
while a number of employees and generally the founder/s had received university training –
generally in technical or engineering disciplines – there were no effective linkages with the
universities or the science councils. These firms tended to be of a lower level of technological
sophistication engaged in making limited adaptations to the local market.
Software firms made limited use of government support programmes for innovation and
technological development. One of the firms utilises the tax allowance for R&D and one of
the firms has obtained limited funding from the SPII programme. Black economic
empowerment was seen contributing significantly to costs and to make South Africa a less
competitive location. Concerns were expressed about the difficulty of moving intellectual
capital (IP) offshore. One company was clear that, because of the difficulty of moving IP
offshore, if it were to open a new development office, this would not be in South Africa.
Although there would always be ways of getting around this problem, the costs and time

16
involved in getting around the rules would preclude locating new developmental activities in
South Africa.
Software firms had no significant linkages with either universities or the publicly funded
science councils.
3.4 Conclusion
The most widespread constraint cited is the shortage of skills. Case studies of other sectors
such as autos and components similarly cite the skills shortage as the key constraint on
technological development and firm level advance – and this is confirmed by statistical data
(Goldberg et al, 2011:70). South African graduates employed by the firms are regarded by the
firms as being of a high quality. They are key to the progress that local firms have achieved
and, in mining equipment and specialist services, the presence of such skills attracts foreign
firms to undertake development work in South Africa. However, high quality South African
graduates are in very short supply and this imposes significant constraints on future
expansion.
An earlier study of 19 high technology firms reached a similar conclusion.“The high quality
of local graduates employed in these firms is fundamental to their success and the single most
important contribution of the national system to their development. This is enhanced where
local graduates also acquire specific exposure to commercial and industrial settings. …The
biggest single constraint, nevertheless, is that the number of high quality local graduates is
distinctly limited. This limitation is simultaneously the most fundamental constraint on the
further development of high technology firms” (Breitenbach et al, 2006:3).
Moreover, a number of firms interviewed were of the view that the quality of graduates was
declining. This view of declining quality is confirmed in another recent study (Goldberg et al,
2011:70) and in the earlier study of 19 high technology firms. “By and large, the quality of
the graduates is reckoned to be very good and comparable to the best internationally.
However, certain firms perceive the quality of graduates as declining. Certain specific skills
are in very short supply generally and in some cases this has resulted in sourcing people with
the required skills (or alternatively outsourcing the work) overseas. (Breitenbach et al,
2006:9).
The skills shortage is an important factor leading firms to locate activities abroad rather than
in South Africa. This is most evident in respect of mining capital equipment and specialist
services and software.
But, what is probably even of greater significance than the impact of the skill shortage on
existent firms is the impact that the skill shortage has had in limiting the formation of new,
smaller and less well established firms. Larger and better established firms are able to
partially mitigate the skills constraint. It is the larger and better capitalised firms, more
especially the very large firms that can afford to offer high salaries to those with scarce skills.
Moreover, these firms frequently are able to finance funding for training at tertiary
institutions and establish close relations with these institutions so as to ensure that they obtain
“privileged” access to the skills that are produced. None of these options are available to

17
smaller and newly established firms. In essence, the incidence of a shortage of skills and a
consequent tight labour market falls disproportionately on the smaller, less capitalised firms
and on the firms in formation.
The shortage of finance is the second most significant constraint cited by technology based
firms. The financial constraint is most significant at a very early stage where the firm is
seeking to develop and prove their product and is hence pre-revenue. Shortage of finance is
also a key constraint when the firm, having proven their product, seeks to “ramp up”
production in local and particularly in export markets. Again, these constraints are clearly
most binding to newly established firms or firms that have not yet entered the market. Small,
less well-established firms and especially new technology-based start-ups do not have the
complementary assets to exploit any innovation. They are far more reliant on outside funding,
particularly in the initial stages. They are therefore more subject to financial constraints and
market failure in capital provision. Risks are significant and the cost of failure is high.
A number of other constraints have been identified – infrastructure and cumbersome
regulations for example. Government supports for technology development are accessed by a
limited number of firms and those that do gain access often complain about the effort
required and the delays incurred. Business linkages with universities and with the science
councils are limited and are seen to be declining – particularly with the science councils. But
these factors tend to be of a lesser order, less pervasive and more specific to particular firms
or areas of activity.
Black economic empowerment is seen by many existent small firms as a constraint – as
outlined above. However, Black economic empowerment may have a much more pervasive
impact than can be gauged from firm interviews. What was striking in the population of firms
interviewed was the near absence of black owned entrepreneurs and firms. This is not
unexpected in respect of well-established firms since historically blacks were denied access
to business opportunities. But, very few of the new firms had been founded by black
entrepreneurs. In particular, there was a near absence of African owned entrepreneurs. No
statistical data exist, but the firms interviewed were all of the view that there were very few
black entrepreneurs founding technology based new firms.
This is a complex phenomenon and there are certainly a number of explanatory factors - more
limited access to personal saving and capital; less exposure to business opportunities;
schooling and training that do not encourage risk taking; less familial exposure to
entrepreneurship, and others. However, in addition to these factors, government policy in
regard to Black economic empowerment may have the unintended consequence of
discouraging Blacks from such entrepreneurial activity. Since Black graduates, particularly
those with technical and engineering skills, can readily find high paying posts in well
established companies, they are far less likely to engage in risk taking new ventures. Black
entrepreneurs too, are likely to find far more lucrative opportunities with existent firms. The
tendency to choose the less risky option is reinforced where personal savings are more
limited.
18
While there clearly are a number of factors that constrain the emergence and further
development of small new technology based firms in South Africa, these constraints are far
from absolute. In a wide number of areas, such firms are in evidence and are successful. But,
what is of concern is that, outside of mining equipment and specialist services, they are
relatively few in numbers.
The evidence suggests that increasing the number of new technology based firms can be
addressed though a combination of increasing the supply of skills, particularly in engineering
and technical disciplines; ensuring better access to finance, particularly early stage pre-
revenue finance and also finance to expand production and providing more incentives and
opportunities for Blacks, particularly Africans, to engage in technology based
entrepreneurship.
4. Conclusion
The further development of manufacturing is currently at the center of South African
government policy to raise aggregate output and enhance economy-wide employment.
However, in sharp contrast with the BRIC countries, growth in South African manufacturing
output has been limited and manufacturing employment has been declining consistently. Of
particular note, the sectoral composition of South African manufacturing has been changing
with a persistent decline in the share of the labour intensive sectors. This is not compensated
for by rapid growth in more technology intensive sectors. South Africa performs particularly
poorly here. Smaller and new entrant technology based firms who would have lower capital
intensity and could grow employment face particularly significant obstacles and are currently
poorly supported by existent government policies.
Two conclusions for the broad strategic direction of government’s industrial policy are
evident. First, more attention needs to be paid to enhancing the employment intensity of
manufacturing - in particular, the very sharp decline in the most labour intensive
manufacturing sectors. Second, at the other end of the spectrum and the subject of this paper,
more policy attention needs to be paid to the constraints faced by new technology based
manufacturing firm entrants and to addressing the constraints that such firms face. Skill
shortages and financial constraints are especially important and need to be addressed urgently
if South Africa is to realise its ambitious economic targets.

19
REFERENCES
Bransetter (2009) Knowledge Flows and Intellectual Property. Paper prepared for the
World Bank project Closing the Skils and Technology Gaps in South Africa (Mimeo)
Breitenbach, P., Kaplan, D and Wood, E. (2006)The Influence of Publicly Funded R&D on
National Development. 20 Case Studies of small, medium and large South African high-
technology firms recognised as SET innovation leaders to identify the value and utility of
State R&D inputs on the output and impact of firm products and services in South Africa.
(Unpublished report for the Human Sciences Research Council). Graduate School of
Business, University of Cape Town.
Goldberg, I; Kaplan, D.; Kuriakose, S.; Tuomi, K.; and Zhang, C. (2011) Fostering
Technology Absorption in Southern African Enterprises. The World Bank, Washington D.C.
Kaplan, D. (2012) South African Mining Equipment and Specialist Services: Technological
Capacity, Export Performance and Policy Resources Policy. vol.37 (4) December
Kaplan, David; Goldberg, Itzhak; Kuriakose, Smita and Bransetter, Lee (2011) Inputs and
Performance of Technology Innovation. Closing the Skills and Technology Gap in South
Africa, Background Paper 1 (October). Human Development Group, Africa Region. The
World Bank.
South African Police Service (2011) Crime Report, 2010/2011. South African Police Service.