4.0 OVERVIEW
24
4-1 4.0 OVERVIEW Reliability assurance of combined hardware and software systems requires implementation of a thorough, integrated set of reliability modeling, allocation, prediction, estimation and test tasks. These tasks allow on-going evaluation of the reliability of system, subsystem and lower-tier designs. The results of these analyses are used to assess the relative merit of competing design alternatives, to evaluate the reliability progress of the design program, and to measure the final, achieved product reliability through demonstration testing. At each step in the design-evaluate-design process, the metrics used to predict product reliability provide a mechanism for a total quality management system to provide ongoing control and refinement of the design process. Table 4-1 provides a summary of the analysis and test tasks for both hardware and software that provide reliability goals, predictions, and assessments. Figure 4-1 illustrates an overview of the interrelationships between these tasks. 4.1 System Reliability Prediction and Estimation Program . The reliability prediction and estimation program for systems which combine both hardware and software elements must be composed of a complementary set of hardware and software tasks for reliability modeling, reliability allocation, reliability prediction, reliability growth testing, and reliability qualification testing. Each of the complementary tasks should support system level tasks which combine the results of the individual hardware and software tasks and allow assessment of the overall system reliability performance. 4.1.1 System Modeling . System modeling provides a functional representation of the system under analysis. An accurate system model provides a mechanism for all reliability analyses performed. System reliability modeling for hardware and software system is an evaluation of the dependency between system services and the various hardware elements and their associated software processes. The system model is developed as an iterative process of decomposing the dependencies within the various system structural elements. As appropriate to the size and complexity of the system being analyzed, the system is first decomposed into a reliability block diagram showing the dependency between the subsystems and the system services required for a given mission or mode of operation.
Transcript of 4.0 OVERVIEW
4-1
4.0 OVERVIEW Reliability assurance of combined hardware and software systems requires implementation of a thorough, integrated set of reliability modeling, allocation, prediction, estimation and test tasks. These tasks allow on-going evaluation of the reliability of system, subsystem and lower-tier designs. The results of these analyses are used to assess the relative merit of competing design alternatives, to evaluate the reliability progress of the design program, and to measure the final, achieved product reliability through demonstration testing. At each step in the design-evaluate-design process, the metrics used to predict product reliability provide a mechanism for a total quality management system to provide ongoing control and refinement of the design process. Table 4-1 provides a summary of the analysis and test tasks for both hardware and software that provide reliability goals, predictions, and assessments. Figure 4-1 illustrates an overview of the interrelationships between these tasks. 4.1 System Reliability Prediction and Estimation Program. The reliability prediction and estimation program for systems which combine both hardware and software elements must be composed of a complementary set of hardware and software tasks for reliability modeling, reliability allocation, reliability prediction, reliability growth testing, and reliability qualification testing. Each of the complementary tasks should support system level tasks which combine the results of the individual hardware and software tasks and allow assessment of the overall system reliability performance. 4.1.1 System Modeling. System modeling provides a functional representation of the system under analysis. An accurate system model provides a mechanism for all reliability analyses performed. System reliability modeling for hardware and software system is an evaluation of the dependency between system services and the various hardware elements and their associated software processes. The system model is developed as an iterative process of decomposing the dependencies within the various system structural elements. As appropriate to the size and complexity of the system being analyzed, the system is first decomposed into a reliability block diagram showing the dependency between the subsystems and the system services required for a given mission or mode of operation.

4-2
TABLE 4-1. Reliability Prediction and Estimation Tasks
PREDICTION AND ESTIMATION PROGRAM TASK
APPLIES TO
REMARKS
HW SW
Operational Profile Development X X Operational profile development is represented in Sections 6 and 9 of this notebook.
Reliability Modeling
X X Reliability modeling for HW/SW systems is presented in Section 5. of this notebook
Reliability Allocation
X X SW Allocation Procedures are provided in 6 of this notebook
Reliability Prediction
X X Procedures for SW reliability prediction at each phase of SW development are given in 7
Environmental Stress Screening X - A SW equivalent of HW stress screening is not defined
Reliability Development/ Growth Testing
X X Procedures for use in estimating the time and resource impact of needed SW reliability growth are provided in 8
Reliability Qualification Testing
X X Both hardware and software are assumed to have exponentially distributed failure rates
Production Reliability Acceptance Testing
X X Software reliability testing can be performed from the system level using these techniques
FRACAS X X Effective hardware and software FRACAS programs are needed to deter recurrence of observed fault classes

4-3
HardwareRequirements
Analysis
SystemRequirementsAnalysis and
Design
HardwarePreliminary
Design
HardwareDetailedDesign
Fabrication HWCI Test SystemIntegrationand Test
SoftwareRequirements
Analysis
SoftwarePreliminary
Design
SoftwareDetailedDesign
Codingand Unit
Test
CSCIntegration
Test CSCI Test
SystemReliability
Requirements
System HW/SW
ReliabilityModel
System HW/SW Reliability
Allocations
ReDesign Activity
Design Activity
HW/SWReliability
Predictions
Progress Evaluation
AssessmentReport
Program Review Board Activity
HW/SW Growth Testing
Evaluate Growth
HW/SWDemo Test
EvaluateResults
AssessmentReport
Design Correction
Reallocation Needed
Reassign Resources
Not OK
To Program Managerand Engineering Manager
To Program Manager and Engneering manager
FIGURE 4-1. System Reliability Tasks
4-4
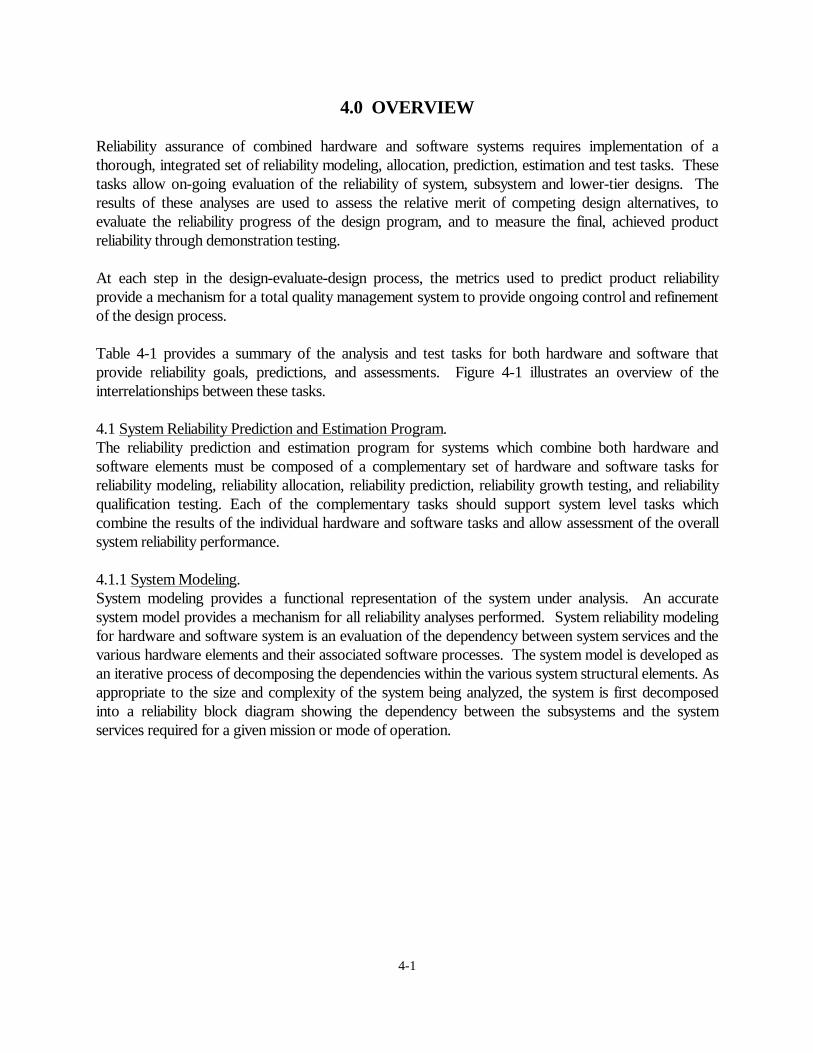
Each of the subsystems is modeled as a series of discrete and, if applicable, redundant hardware and hardware/software elements. This process is continued until the system model is detailed enough for individual hardware equipment to be identified, including those hardware elements which host software processes. Detailed models of the individual hardware elements that do not host software can then be developed in accordance with established reliability techniques. Reliability models for those hardware elements which host software must be developed next. For those cases where redundant equipment for hardware/software elements is supplied, the reliability model developed will depend on the exact method used to implement fault detection and recovery. Section 5 provides an overview of approaches to developing these models. For those cases where a single equipment with software is used, each hardware/software element is decomposed to the model shown in Figure 4-2. As shown in the figure, a single hardware/software element decomposes into a reliability block diagram which consists of a hardware block and a software block in series. This model assumes that each of the items is independent.
FIGURE 4-2. Reliability Model for HW/SW Element
The software block of the hardware/software element then decomposes into a set of software elements: non-developmental software (NDS) which includes the operating system, and newly developed software. At least one of these types of software will exist in a specific model. When software failure rates are exponential and independent, the failure rates for the software can be added directly to the failure rates for the hardware. However, the failure rates for the software elements of the system must be expressed with respect to system operating time.

4-5
Though the process for modeling software reliability, in terms of tasks, is similar to that for modeling hardware reliability, there is one major difference between them that needs to be recognized. Software systems are composed of Computer Software Configuration Items (CSCIs) which are generally independent software programs associated with Hardware Configuration Items. These CSCI’s are composed of Computer Software Units (CSUs) that perform some given software function. Even when these CSUs are implemented to be as independent from each other in terms of processing and data as much as possible, the units themselves will never be independent and cannot be considered to have independent failure rates. The operational profile provides the foundation of software reliability assessment. It is the operational profile that determines unit utilization and how often one or more units will cause a failure. The units themselves do not experience failures due to temperature, vibration, etc. Therefore, even though the failure rate of the top level CSCI’s can be modeled, it is impractical to model failure rates for individual units. Figure 4-3 illustrates this. As an alternative to modeling piece part failure rates for software CSUs the operational profile should be modeled instead.
Program
CSCI CSCI CSCI
CSUsCSUsCSUs
Data and processing not independent at CSU level even withmodular or object oriented design
FIGURE 4-3. Dependency of Software CSUs
4-6
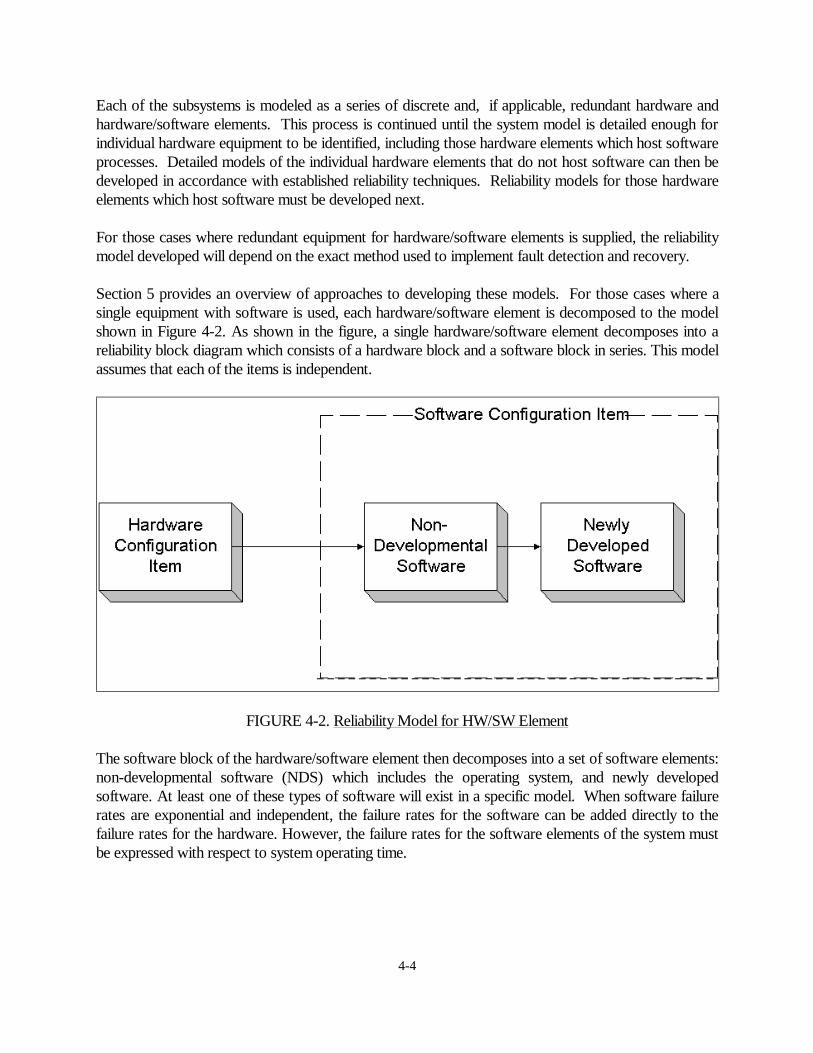
The following are some examples of hardware/software systems. Hardware/Software Example 1: Figure 4-4 illustrates the Hardware/Software (HW/SW) reliability model structure for an automobile Anti-lock Braking System (ABS). In its simplest form, the system consists of the brakes, sensors and actuators to control the applied brake pressure, and a smart system for controlling the rapid application and release of pressure many times per second. This system contains both hardware and software elements. The software in this scenario is stored on a hardware device called a Programmable Read-Only Memory (PROM) chip. A reliability analysis should take into account the individual elements of this hardware/software system.
HW Subsystem
HW Subsystem
Brakes
Pressure Sensors
Decision Controls
Application Software
SW Subsystem
HW/SW Subsystem
PROM
HW Subsystem
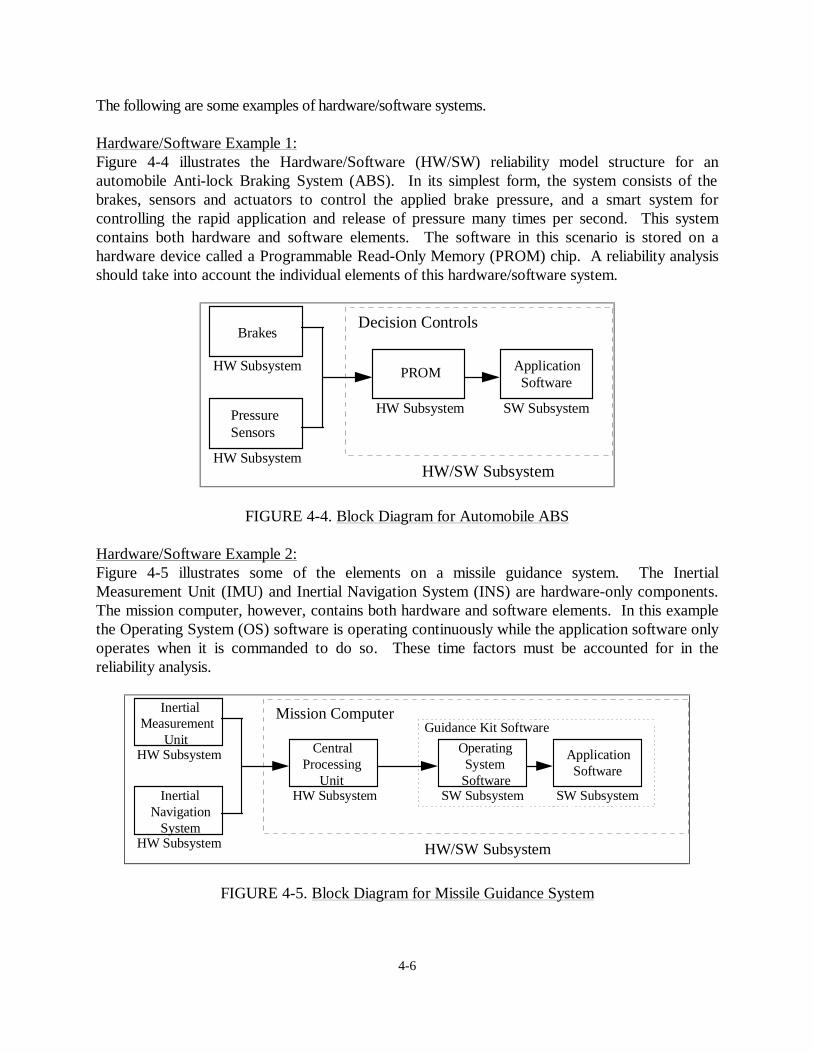
FIGURE 4-4. Block Diagram for Automobile ABS Hardware/Software Example 2: Figure 4-5 illustrates some of the elements on a missile guidance system. The Inertial Measurement Unit (IMU) and Inertial Navigation System (INS) are hardware-only components. The mission computer, however, contains both hardware and software elements. In this example the Operating System (OS) software is operating continuously while the application software only operates when it is commanded to do so. These time factors must be accounted for in the reliability analysis.
HW Subsystem
HW Subsystem
InertialMeasurement Unit
Inertial Navigation System
Mission Computer
CentralProcessing Unit
HW Subsystem
Operating System Software
Application Software
SW Subsystem SW Subsystem
HW/SW Subsystem
Guidance Kit Software
FIGURE 4-5. Block Diagram for Missile Guidance System

4-7
Hardware/Software Example 3: A third and final example of combined hardware/software systems is shown in Figure 4-6. This graphic represents a gateway server which feeds data from three types of workstations to external users. Each subsystem is composed of both hardware and software elements. The server is the only subsystem which operates continuously. The others are idle until called on for data.
NonStop Server CentralProcessing Unit
HW Subsystem
Operating System Software
Application Software
SW Subsystem SW Subsystem
HW/SW Subsystem
Server Software
DOS Workstation CentralProcessing Unit
HW Subsystem
Operating System Software
Application Software
SW Subsystem SW Subsystem
HW/SW Subsystem
DOS Software
Windows Station CentralProcessing Unit
HW Subsystem
Operating System Software
Application Software
SW Subsystem SW Subsystem
HW/SW Subsystem
Windows Software
UNIX Workstation CentralProcessing Unit
HW Subsystem
Operating System Software
Application Software
SW Subsystem SW Subsystem
HW/SW Subsystem
UNIX Software
FIGURE 4-6. Block Diagram for Gateway Server System 4.1.2 System Reliability Allocation. System reliability allocation is the process of allocating the specified system reliability goals or goal metrics (MTBF, MTTF, etc.) to each subsystem or area, hardware element, and hardware/software element in the system. This allocation process is iterative in nature as knowledge of achievable failure rates is not always available. These reliability allocations are based on the system reliability model, which must be developed prior to attempting to allocate metrics from the specification to lower tier elements. The best available method for allocation pertains to the system. At the level of the hardware/software elements, reliability allocations are decomposed to apportion the relevant metrics between the hardware element and the software which executes on the specific hardware configuration item. The best available method, as it pertains to the system, should be used to balance the allocations to each element of the system. Section 6 describes some of these methods. Allocations should be performed at the system level and include not only reliability but other design parameters as well.

4-8
Typically, the achievable failure rates for the hardware and software elements of the system will be needed to obtain allocated reliability values for each system element which is achievable and still supports the system level reliability requirements. The initial allocation is successively refined to take into account the achievable failure rate for the hardware and software elements as these become better defined and their failure rates are estimated. The high level allocation is modified while maintaining the overall system goal. Methods for obtaining reliability estimates for system hardware are well documented and discussed in Sections 4.2.2 and 4.2.3, below. Estimates of the software failure rate which is achievable can be obtained using the methods discussed in Section 4.3.3 and the procedures provided in Section 7 of this notebook. 4.1.3 System Reliability Prediction. System reliability predictions are used to assess overall design progress toward achieving the specified system reliability. Reliability predictions and estimates for the various system hardware elements (Section 4.2.3) and software elements (Section 4.3.3) are combined using a system model. The resultant reliability calculation is then compared against the specified system requirement to determine whether the current system design achieves the specified reliability. If the current design fails to achieve the needed system reliability within a specified level of confidence, appropriate corrective action should be implemented. 4.1.4 System Reliability Growth. System reliability growth consists of a combination of hardware and software reliability growth. The hardware and software growth estimates are combined, using the system reliability model, and used to estimate system reliability growth over time. Projections of hardware reliability growth and software reliability growth are based on independent growth curves. Hardware and software growth tests are conducted either: 1. separately with the results combined using the system reliability model, or 2. together with hardware and software failures identified in one test and combined using the system
reliability model. Usually, conducting separate test, analyze, and fix procedures may be appropriate since different engineering groups are often assigned to the development of hardware and software system elements. However, conducting concurrent hardware and software growth testing in a system test is not precluded and may be advantageous in consideration of cost and schedule. In this case, both hardware and software failures are identified in one test. When both hardware and software reliability growth testing are required on a program, a system level reliability growth test plan discussing all aspects of the planned growth testing and the methods to be used in estimating and reporting system reliability growth should be prepared.
4-9
4.1.5 System Reliability Qualification Testing. System reliability qualification testing for hardware/software systems is performed in accordance with reliability demonstration testing techniques currently used in industry. The failure rates for hardware and software are assumed to be constant with an exponential growth allowing use of test methods for a combined test of the hardware and software elements of the system. Software is exercised during Formal Qualification Testing in a manner that represents its operational profile. Ensuring an appropriate environment for reliability testing is discussed in Sections 4.3.6 and 8 of this notebook. 4.1.6 System-Level Failure Reporting and Corrective Action Systems (FRACAS). A FRACAS should exist for both hardware and software development. Many times the FRACAS programs are separate for software and hardware because different departments within an organization are responsible for development, failure reporting, correcting and analyzing software and hardware. A software FRACAS is implemented in a similar manner to a hardware FRACAS. Software failure events are reported, reviewed, corrected and analyzed in much the same way as hardware failures. For software, the analysis process consists of identifying the most common software failure modes and implementing defect prevention on these modes. A system-level FRACAS should be instituted as a part of the reliability assurance and control program for a combined HW/SW system. The system-level FRACAS activity should support resolution of those problems which cannot readily be assigned to either hardware or software causes. Additionally, a system-level FRACAS activity to track and assess the results of the hardware and software FRACAS activities can provide a resource for ensuring that the results of all observed failures are available for use within system safety programs. 4.2 Hardware Reliability Prediction and Estimation Program. Reliability allocation, prediction, and testing techniques for electronic hardware have been thoroughly investigated and have existing procedures documented within the industry literature. The addition of software to electronic hardware does not change the expected rate of hardware physical failures. The handbooks that are in use remain applicable to the design of electronic hardware that provides a platform for software execution. One example of an industry handbook is Mil-Hdbk-217, Reliability Prediction of Electronic Equipment. 4.2.1 Hardware Reliability Modeling. Hardware reliability modeling supports system and hardware reliability estimation, and provides a basis for the allocation of reliability goals to individual hardware elements. Reliability modeling for the hardware elements in systems that use both hardware and software is the same as for systems which consist of hardware only. Once system level modeling has decomposed the combined HW/SW system into hardware elements and software elements, general reliability techniques may be used directly to model any individual hardware elements, including those which execute software.
4-10
Section 4.1.1 provides an overview of the system modeling process that results in the decomposition of the system into individual hardware and software elements. 4.2.2 Hardware Reliability Allocation. Allocated reliability goals are assigned to each hardware element and lower-tiered indenture item on the basis of user selected criteria such as criticality or complexity. The system reliability specification value which was allocated between the various subsystems and elements as a part of the system reliability allocation process is further divided into reliability allocations for lower indenture hardware elements. Generally, the reliability allocation given to non-developmental hardware is based on the item’s previously observed reliability. Reliability allocations internal to non-developmental equipment are not generally needed. Reliability allocations to hardware being designed as a part of the system development process are usually based on a combination of the system requirements, the reliability performance of previous generations of similar equipment, and the overall criticality or complexity of the hardware device. Allocations of reliability goals for lower indenture circuit cards and modules are generally provided for developmental hardware. The allocation of reliability goals to hardware elements proceeds in exactly the same manner for hardware systems that host software processes as for hardware that does not host executable software. 4.2.3 Hardware Reliability Prediction. In order of precedence, hardware reliability predictions are based on 1) known field performance of the same equipment produced during previous production, 2) reliability demonstration test results, 3) reliability test, analyze, and fix (TAAF) or other reliability growth testing results, or 4) MTTF estimates obtained using industry available prediction methods. Hardware reliability predictions for hardware systems that host software processes proceed in the same manner as the predictions for hardware that does not host software. For hardware which hosts software, however, the hardware prediction results must be combined with the software reliability prediction results using the system model to obtain predictions of the overall system reliability. 4.2.4 Hardware Reliability Growth. Hardware reliability growth programs, in the form of a test, analyze and fix process, are often used to ensure the design reliability of newly developed hardware prior to either reliability demonstration testing or release to the field for use. 4.2.5 Hardware Reliability Qualification Testing. Detailed procedures, including measurement criteria and environmental criteria, for hardware demonstration testing are available in industry handbooks, including MIL-HDBK-781, Reliability Test Methods, Plans, and Environments for Engineering Development, Qualification, and Production. .
4-11
4.2.6 Hardware FRACAS. The procedures should be applied to all hardware which is a part of a combined hardware and software system. The hardware FRACAS program for equipment which is a part of a combined hardware and software system needs to be carefully tailored to support the system FRACAS activity, allowing the results of both hardware and software FRACAS activities to be combined. The hardware FRACAS program is generally established as a standalone program that provides information to the system FRACAS program in recognition that different organizational entities are usually assigned to the hardware and software designs. The hardware and software FRACAS efforts will need to coordinate with different design teams to resolve ongoing problems and corrective action recommendations. Also, the composition of the failure review boards needed for software failures is likely to be significantly different from that needed for hardware failures as there are different personnel required to analyze the software failures. 4.3 Software Reliability Prediction And Estimation Program. The tasks required for the prediction, evaluation, and estimation of software reliability have been presented in Table 4-1 and Figure 4-1. The software reliability prediction and estimation tasks comprise four fundamental conceptual tasks: 1. Establishment of reliability goals for software elements through modeling and allocation 2. Estimation of software design reliability through the software reliability prediction process 3. Software reliability growth through operational profile testing, and 4. Evaluation of the achieved software reliability through Formal Qualification Testing. Reliability modeling supports the allocation of reliability requirements to software, software operational profiles and hardware elements. Reliability modeling also supports assessment of system and software reliability predictions against specified reliability goals at the system level. Software reliability requirements should be allocated to functional or operational profiles as opposed to software components. This method is used because software components fail as a result of a specific functional or operational profile (input states) and not as a result of an inherent characteristic (such as wear out). Software reliability prediction is performed at each phase of the software development process up to software system test. Product and process metrics applicable to the goals of the project are collected and used to predict the failure rate that the software will exhibit at the beginning of system test and at deployment. The failure rate prediction is then used to estimate the duration of, and assurance resources required for, the reliability growth testing, which will be needed to achieve the allocated software reliability. It should be noted that being able to predict an initial failure rate with any degree of confidence requires well documented historical data based on similar applications. The testing duration and resource requirements are then compared against program schedule and resource plans to evaluate the feasibility of achieving the allocated software reliability. If the allocated

4-12
software reliability is achievable within planned schedule and resource constraints, no preliminary action is necessary. If achieving the allocated reliability will result in an unplanned impact to program schedule and resources, one of three decisions is possible: 1. Reassignment of needed resources if the impact is tolerably small, 2. Reallocation of software reliability goals if other elements of the system are achieving beyond their
allocated requirements by a sufficient margin, or 3. Design corrective action Design corrective actions may include structural changes in the system interrelationships as shown in the reliability modeling. Design changes that result in a more robust design may allow reallocation of system reliability requirements into lower-tiered software goals that are more achievable. As a part of the software reliability prediction process, a report providing an assessment of the degree of compliance of the software being developed should be provided to the program and software engineering managers. This report should contain: 1. Allocated reliability requirements 2. Potential program impact of any additional reliability growth testing that may be needed This ensures that any program impacts are identified and controlled. Procedures for software reliability prediction are provided within this notebook as a part of Section 7. An overview and discussion of the software reliability prediction process is provided in Section 4.3.3. Software reliability evaluation testing consists of reliability growth testing and acceptance and stress testing. These tests continuously evaluate and improve the reliability of the software product. Reliability qualification testing certifies for acceptance the final achieved tested software reliability. Software reliability growth testing is a process of operation (test), failure occurrence, fault isolation, and software modification to eliminate recurrence of the same and similar failures. This continuous test, analyze, and fix procedure is coupled with an ongoing evaluation of the software reliability for rate of growth and current value. The software reliability growth testing continues until models show that the software failure rate has achieved its allocated requirement. Once the reliability growth testing indicates that the software has achieved the needed maturity, the software can be subjected to reliability qualification testing either for just the software element or as an integral part of a combined hardware/software system. Reliability qualification testing for software is based on statistical test plans using failure free intervals. Both hardware and software have requirements that must be placed on their test environment to ensure that the testing adequately simulates field usage. An overview and discussion of software reliability growth and qualification testing is provided in Section 4.3.5 and Section 4.3.6 of this notebook.

4-13
Procedures for evaluating software reliability growth and selecting appropriate input environments are provided in Section 8. 4.3.1 Software Reliability Modeling. Reliability modeling of system software elements is similar in approach to the modeling performed for the overall system and for the hardware elements with subtle differences. Combining software failure rates to calculate an overall failure rate for the software introduces complexity not normally associated with combining hardware failure rates. As shown previously in Figure 4-2, the executing software can be decomposed into two separate types of software elements; re-used application software, and newly developed application software. The Operating System (OS) or executive is unique in that it operates continuously, on an interrupt driven basis with the application program, monitoring system operation and providing control of and access to processor resources for all executing processes. Thus, the failure rate of the OS is conveniently measured in failures per machine operating hour which is directly compatible with hardware failure rates. When the OS being used is a purchased product, acceptance testing should be implemented on the OS to determine if it meets the reliability level that the supplier claims. The failure rate for reused software should be obtained from previous use(s) of the software if possible. It should be noted that failure rates of reused software components are applicable only when the component’s historical operational profile is consistent with its intended operational profile. If the reused software is being used in an environment which is substantially different from its previous environment, it must be tested in the same way as newly developed software to determine reliability values. Care should be used to ensure that the failure rate for re-used code obtained from a previous use is either expressed in or converted to a rate expressed in failures per system operating hour for compatibility with hardware failure rates. The operational profile is essential for modeling software reliability. Its development consists of the customer, user, system mode, functional and operational profiles. Section 9 discusses modeling of operational profiles. 4.3.2 Software Reliability Allocation. Software reliability allocation involves the establishment of reliability goals for individual CSCIs based on a top-level reliability requirement for all software. It is a crucial early program activity that establishes the criteria for evaluating the achieved reliability of elements of the design. As shown in Table 4-2 five initial allocation procedures and a reallocation procedure are provided in Section 6 of this notebook. These procedures allow allocations to be made based on the type of execution expected, sequential or concurrent, or on the basis of operational profile, operational criticality, or achievable failure rates. Two equal-apportionment allocation procedures have been provided. Procedure 6.3-1 provides equal apportionment between software elements for sequentially executing software. Procedure 6.3-2 provides equal apportionment among software elements for concurrently executing software. These

4-14
equal apportionment allocation procedures are designed for use during proposals and early design phases when very little is known about the relative sizes, complexity, or criticality of the software being designed.
TABLE 4-2. Software Reliability Allocation Procedures
Procedure # Procedure Name Use Description
6.3-1 Equal apportionment applied to sequential software components
Use early in the SW development process when the software components are executed sequentially
6.3-2 Equal apportionment applied to concurrent software components
Use early in the SW development process and the software components are executed concurrently
6.3-3 Mission or Operational Profile Allocation
Use when the operational profile of the CSCIs are known
6.3-4 Allocation based on operational criticality factors
Use when the operational criticality characteristics of the software is known
6.3-5 Allocation based on complexity factors
Use when the complexity factors of the software components are known
6.3-6 Allocation based on achievable failure rates
Use when CSCI utilization varies significantly
6.3-7 Re-allocation based on predicted failure rates
Use to re-balance the SW reliability allocations
A re-allocation procedure is provided to allow balancing allocated values as more software design information becomes available. Re-allocation between the various software elements of a design is expected to be required early in the design process as the software design develops. 4.3.3 Software Reliability Prediction. Software reliability prediction is performed to help forecast, in conjunction with the software reliability growth model, the expected end-user reliability. Historical data is essential in predicting software reliability. Any failure data that can be collected on previous projects with a similar application and/or similar operational profiles should be collected first when making a prediction. In the event that historical data is not available, a prediction must be made based on the best available failure data. This may be failure data from similar or previous products

4-15
developed by the same organization. Along with the predictions, a confidence level should be determined, highlighting the risk associated with predicted values. Software reliability predictions are made during the software development phases that precede software system test, and are available in time to feed back into the software development process. The predictions are based on measurable characteristics of the software development process and the products produced by that process. Figure 4-7 shows the software reliability prediction process. Product and process metrics are collected and used to predict the initial failure rate and fault content. From these quantities, the reliability growth model parameters are predicted, then the growth model is used to obtain estimates of the test time and resources needed to meet reliability objectives. Up through the requirements analysis phase, the software reliability prediction can be made on the basis of primitive characteristics of the software such as estimated size and processor speed. There are techniques that measure other characteristics such as development methods, tools and organization. During the preliminary design phase through the CSCI testing phase, product/process metrics are used for prediction. As development proceeds, more and more metrics become available, and metrics that were available before are updated. The predictions become more accurate and meaningful as system test is approached. Once system test begins, the metrics are replaced with actual failure data and can be used to statistically estimate the values of the growth model parameters.
FIGURE 4-7. Software Reliability Prediction Procedure Since the failure rate of the software changes over time as the software is modified to correct faults, the prediction procedures contained in Section 7 provide values for the parameters of a software reliability growth model. A reliability growth model can be used to forecast what the failure rate λ(τ) will be at any time τ into system test. Conversely, a growth model can be used to forecast when a particular failure rate objective will be reached. The amount of execution time to reach an objective can be translated into calendar time for schedule and resource estimates. Reliability progress is evaluated as a part of the prediction process.

4-16
Note: The software reliability prediction models contained in this notebook were the best known available ones at the time it was written. These methods are helpful, but they are by no means proven or final. The user of this notebook is encouraged to establish their own software reliability prediction procedures which may be more relevant to their specific application or development. An assessment report detailing the reliability progress to date against established goals and potential schedule and resource impacts should be prepared and delivered to the Program Manager and Software Engineering Manager. These reports should be delivered at milestones representing the end of each development activity such as analysis, design, code, system test and at the end of any formal review. If the reported progress is unacceptable, a Program Review Board can be informed. The board can then determine whether design correction or re-allocation is needed to meet the specified reliability requirements in a timely, cost-effective manner. 4.3.4 Software Metrics Collection. Software metrics are measurable characteristics of the software development process and the products of that process. The specific objective of collecting the metrics described here is to allow software reliability to be predicted during the software life cycle phases preceding system test. There are five prediction techniques presented in this notebook. Each of these techniques predicts a fault parameter that can be used to predict or gauge failure rate. Table 4-3 provides a mapping between the software metrics and the phases during which they are used in the prediction process. Rome Laboratory TR-92-52, “Software Reliability Measurement and Test Integration Techniques,” contains a method for predicting software reliability summarized in Table 4-3. This method requires that a fault density parameter in terms of faults per KSLOC is predicted. The fault density parameter can then be translated to a failure rate by using a default table, collecting data or using historical data. The total estimated number of inherent defects at delivery can also be predicted by multiplying the fault density by the total number of KSLOC. These metrics are not available all at once. Different metrics become available during each life cycle phase. Metrics that were previously available become updated as work products evolve. Depending on the development phase (proposal through CSCI testing) during which the prediction is made, some subset of the metrics will be available. The metrics available during each phase enter into a software reliability prediction model associated with that phase, as described in Section 7. The metrics are collected separately for each CSCI.

4-17
TABLE 4-3. Software Reliability Prediction Factors
Factor Measure Phase data collected RL-TR-92-52 Software Reliability Measurement and Test Integration Techniques
Defects per Source Lines of Code
Concept through coding
Application Empirical difficulty factor in developing various application types
Concept through analysis
Development organization Development organization, methods, tools, techniques, documentation
Concept through design
Software anomaly management Indication of fault tolerant design
Design, code and unit test
Software traceability Traceability of design and code to requirements
Design, code and unit test
Software quality Adherence to coding standards Design, code and unit test Software language Normalizes fault density by
language type Code and unit test
Software complexity Unit complexity Code and unit test Software modularity Unit size Code and unit test Software standards review Compliance with design rules Code and unit test Raleigh Model Profile of faults detected over
the life cycle From start of design through delivery
Industry Data Defects per function points Anytime from concept through delivery
Musa Execution Model Failure rate at the start of system testing
From concept though the start of system testing
Historical Data Process and product correlation to previous failure history
Life-cycle data from previous projects within the organization.
The Raleigh1 model predicts distribution of defects over the life cycle of the software. This fault profile is used to gauge the defect removal process. This method can and should be used in conjunction with other methods for predicting the total number of inherent or latent defects. Industry data can be used to predict defects per function points. Using historical data collected from previous projects, or by using the Musa execution time model discussed next, a conversion ratio between fault density and failure rate can be determined. The total predicted defects at delivery can be predicted by multiplying this defect density by function points.
1 “Measures for Excellence”, Larry Putnam, Ware Myers, Quantitative Software Management, Yourdon Press, Englewood Cliffs, NJ, 1992.

4-18
The Musa execution time model can be used to predict the initial failure rate, or the failure rate at the start of system testing. It can be used alone or in conjunction with the other prediction models. 4.3.5 Software Reliability Growth Testing. Software reliability growth testing takes place during the software system test phase, after the software has been fully integrated. During growth testing, the software is executed in an environment with inputs that most closely simulate the way the software is expected to be used in the field. In particular, the inputs are randomly selected in accordance with the software’s operational profile. The quality of testing is directly related to reliability growth and is a function of various system level tests that validate the software from more than one perspective. System tests can validate domains, paths, states, transaction flow, error handling, etc. The quality of testing is also related to testing the functionality that is executed most often by end user, most critical to end user, and most error prone. An operational profile associates each input state or end-user function with a probability of occurrence. Testing according to the operational profile is efficient with respect to failure intensity reduction, because it reveals those faults that the user is most likely to encounter in use, those faults that contribute most to the program failure rate. When a failure is observed, the execution time, among other information, is recorded. The observed failure times are used as input to a statistical estimation technique that determines the parameters of the software reliability growth model. This way, the current reliability can be measured and the future reliability can be forecasted. Figure 4-8 depicts a failure intensity curve.
Failu
re R
ate
(λ)
Execution Time (t)
FIGURE 4-8. Software Failure Intensity Curve
Software reliability growth testing assumes that faults exist in the software and they will be uncovered during execution to produce software failures. As testing proceeds, failures will occur, the faults underlying the failures are identified and removed, the system is recompiled, and new input states are selected randomly from the operational profile. As software faults are removed, the failure intensity

4-19
should decrease over time. This should continue until enough faults have been removed from the system to meet reliability goals. Resource Usage. A software program that is not executing cannot fail. Thus, the growth model selected expresses its basic results with respect to execution time. Since project managers and software engineers may think in terms of calendar time, some growth models contain a component that addresses the relationship between execution time and calendar time by focusing on resource usage rates. Three primary resources are involved in system test: failure identification personnel, failure resolution personnel, and computer time. Failure identification personnel are the testers, the people who run test cases and detect the occurrence of failures. Failure resolution personnel are the debuggers, the people who isolate and remove the faults that cause the failures. The expenditure of failure identification personnel resource and failure resolution resource are each modeled as having a cost per unit of execution time and a cost per failure experienced. At any time, one of the three resources will be the limiting resource that determines the ratio of calendar time to execution time. Testing can only be accelerated by adding more of the limiting resource. In addition to reliability assessment, another benefit of growth testing is that the debugging activity after each failure occurrence will result in fault removal. Debugging is many times imperfect. The occurrence of one failure does not guarantee the immediate removal of one fault. Sometimes new faults are inadvertently introduced during the repair activity. Sometimes multiple, related faults are removed at once. Sometimes the causative fault behind a failure is not found. Over the long run, the reliability of reasonably maintainable software improves as growth testing continues. Section 8 of this notebook provides a detailed discussion and specific procedures for software reliability growth testing. 4.3.6 Software Reliability Qualification Testing. Reliability qualification testing is performed toward the end of system test. Its purpose is to prove with a specified statistical confidence that the software meets the stated reliability requirement. Software reliability qualification testing, like growth testing, is performed using inputs randomly selected in accordance with the operational profile the software will experience in field use. During demonstration testing, the code should be under configuration control (just as it would be between releases). Any failures that occur are merely recorded; no software repair activity takes place. Since the code is under configuration control and should be stable, multiple occurrences of the same failure should be counted. The test should represent a true operational environment. In a true environment where corrective action is available, multiple occurrences of the same failure would impact the system reliability just as occurrences of different failures would. Software that is operational, under configuration control and subjected to inputs randomly selected from a stationary (non-changing) operational profile is assumed to exhibit a constant failure rate. This implies that the inter-failure times are exponentially distributed. The exponential model is currently

4-20
employed for complex, maintained hardware systems that do not have redundancy. The exponential model is applicable to the software product alone and to the combined hardware/software system when the software is under configuration control and is operational. Three types of qualification tests are described in Section 8: fixed-duration test, sequential test, and failure-free execution period test. Each type of test has advantages and disadvantages, as summarized in Table 4-4.
TABLE 4-4. Software Reliability Qualification Test Types
Test Type Advantages Disadvantages
Fixed-Duration - used when the amount of test time and cost must be known in advance. A fixed duration test provides demonstrated failure rate to a desired confidence level.
Total test time is known in advance. An estimate can be made of true failure rate.
Takes longer than sequential test on average.
Sequential - will accept software that has a failure rate much lower than λ0 and reject software that has a failure rate much higher than λ1 more quickly than a fixed duration test having similar parameters. However, the total test time may vary significantly according to the true failure rate.
Accepts very low failure rates and rejects very high failure rates quickly. Shorter test times on average than the other types.
Total test duration is undetermined; maximum duration must be planned for.
Failure-Free Execution Interval - will accept software that has a failure rate lower than λ0 more quickly than a fixed duration test. Producer’s and consumer’s risks usually range from 10% (low risk) to 30% (high risk). The lower the risks, the longer the test.
Will accept very quickly if true failure rate is much better than required.
Can take a long time if true failure rate is close to that required

4-21
4.3.7 Software Failure Reporting and Corrective Action System (FRACAS). A software FRACAS is an efficient closed-loop management tool established to identify and correct deficiencies in software. The software FRACAS program must be carefully tailored to support providing the information required by the system level FRACAS program. Software FRACAS is based on the systematic reporting and analysis of software failures during testing. Software FRACAS includes documented procedures for reporting failures, analyzing failures to determine their root causes, and establishing effective corrective action to prevent future recurrence of the failure. Figure 4-9 illustrates a software FRACAS process.
System Level FRACAS
Software Level FRACAS
Failure event reported
Failure event reviewed
Failure event corrected
Failure event verified ascorrect and closed
Root causes analyzed
Improvements to developmentprocess made
Not Corrected
Properly
SymptomsSteps toreproduceConditionsInputs
PriorityStatus
Not software OR does not
require corrective action Root causeCorrectiveactioninformation
FIGURE 4-9. Software FRACAS
As a part of the process, each failure must be documented and reported, with sufficient information to identify the software element involved, the symptoms of the failure, input and other conditions preceding the failure, and, for the purposes of software reliability growth modeling, the cumulative execution time at the moment of failure. The failure should be verified, if possible, by repeating the

4-22
circumstances that led to it. All files and other pertinent data must be preserved. The root cause of the fault that caused the software failure should be determined. Corrective action requires a change to the software code. The failure report is closed out when there is formal concurrence by individuals other than those who performed the corrective action. Software FRACAS should be augmented by the establishment of a "defect prevention" program. In a defect prevention program, not only is the fault removed from the code but attention is also focused on the root cause of the fault, how it got there in the first place. A fault in the code may be the result of any of the known fault types described in Table 4-5 2:
TABLE 4-5. List of Known Fault Types Activity introducing fault Fault type or root cause Requirements Missing requirements
Misinterpreted requirements Requirements not clear Changed requirements Conflicting requirements
Design Design not to requirements Missing design Top level design logic Low level design logic Design not robust
Code Code not implemented to design Code not implemented to requirements Missing code Initialization error Compiled typos Storing error Mismatched parameters Math operations not robust I/O operations not robust Memory errors Domain errors
Maintenance and corrective action New fault generated in maintenance Seeking out and eliminating the root cause of the fault modifies the development process to reduce or completely eliminate the cause and prevent a whole class of related faults. If that cannot be done, then the objective is to at least expedite detection of these faults.
2 “Tactical Software Reliability Guidebook” Technology Transfer #95092967A-GEN, SEMATECH, Fulton, S., Neufelder, AM, , Austin, Tx, 1995.

4-23
After the fault is isolated and removed, information about the fault should be fed back to the programmers, who establish and categorize the root cause of the fault. This is called the "causal analysis." Corrective action includes not only the removal of the immediate fault on hand but modification to the development process to eliminate the recurrence of the class of similar faults. Often, just making programmers aware of the root cause will discourage recurrence. One technique, called Orthogonal Defect Classification (ODC)3,4 is used by industry to analyze software defects. This method requires that the following information in Table 4-6 be tracked during the correction of a defect. The data collected is then regularly analyzed to determine: • Maturity of the software associated with defect types, • Most common failure modes, and eliminate them, and • Causality of problems and associated methods to reduce defects
3 Ram Chillarege, “Orthogonal Defect Classification - A concept for in process Measurements” IEEE Transactions on Software Engineering, 11/92. 4 David Rentschler, “Implementing Orthogonal Defect Classification”, Transactions from the Fifth International Conference on Software Quality, October 1995, pages 277-279.

4-24
TABLE 4-6. Orthogonal Defect Classification
Classification type Description Detection method What activity detected the defect? Each detection method must be orthogonal
in that there is no overlap between them. Some examples include: • Reviews • Inspections • Audits • Internal test • External test • External use
Types This is directly related to what is repaired in the software. These types include but are not limited to: • Requirements defects • Design defects • Coding defects • Defects due to a corrective action Ideally, the development organization should tailor this list to those most commonly related to the defects on a specific application.
Trigger This is an orthogonal list of activities that caused the defect to be discovered or observed. Some examples are: • Installation • Startup • Normal operations • Change in configuration • Corrective action • Change in input domain • Error handling • Environmental influences such as loss of power or communication • Change in customer requirements • Operator error
Source The place in the source code where the defect exists or existed.