
4 Unstoppable trends - Citi
32
68 OUTLOOK 2021 CITI PRIVATE BANK CONTENTS 4.1 4.2 4.3 4.4 4.5 Unstoppable trends are changing the world Greening the world Digitization: The age of hyper-connectivity is upon us The rise of Asia: Asian development in a “G2 world” Increasing longevity: The healthcare opportunity 4 Unstoppable trends
Transcript of 4 Unstoppable trends - Citi

68OUTLOOK 2021CITI PRIVATE BANK
CONTENTS
4.1
4.2
4.3
4.4
4.5
Unstoppable trends are changing the world
Greening the world
Digitization: The age of hyper-connectivity is upon us
The rise of Asia: Asian development in a “G2 world”
Increasing longevity: The healthcare opportunity
4 Unstoppable trends
INVESTMENT PRODUCTS: NOT FDIC INSURED · NOT CDIC INSURED · NOT GOVERNMENT INSURED · NO BANK GUARANTEE · MAY LOSE VALUE

69UNSTOPPABLE TRENDS OUTLOOK 2021CITI PRIVATE BANK
S T E V E N W I E T I N G - Chief Investment Strategist and Chief Economist
4.1
Unstoppable trends are changing the world
Unstoppable trends are reshaping the world around us. As well as transforming the ways we live and work, they are creating long-term opportunities and risks for portfolios.
� Unstoppable trends are powerful multi-year phenomena that are transforming business and everyday life
� As disruptive forces, they create both risks and opportunities for your core and opportunistic portfolios
� Our latest trends focus upon this new era of 5G-enabled “hyper-connectivity” and the transition to a more sustainable world
� We continue to advocate the existing trends of The rise of Asia and Increasing longevity

70UNSTOPPABLE TRENDS OUTLOOK 2021CITI PRIVATE BANK
Amid the worst pandemic in more than a century, it might seem counterintuitive to focus upon anything apart from COVID-19 and its fallout. After all, the virus and the measures in response to it have affected almost every aspect of life in 2020. In financial markets, COVID’s eruption moved every single asset price in the world, and its departure will likely do the same. Despite the pandemic’s present influence, though, there are many forces that will have a much greater bearing upon portfolios over time. We call these “Unstoppable trends.”
An Unstoppable trend is a major, multi-year phenomenon that is more than likely to transform the world around us. These trends take many forms, including technological advances, demographic developments and new behaviors. They often appear comparatively slow moving, but tend to gather force and influence over time. In the process, they increasingly present a fundamental challenge or threat to the status quo, ultimately impacting every industry and every investment portfolio.
Over the last two years, we have recommended that you build portfolio exposure to a variety of Unstoppable trends:
The rise of Asia addresses the steady shift in global economic power from West to East, driven by the region’s urbanization, growth of the middle class, and advancements in home-grown technologies.
Increasing longevity explores how the aging of the world’s population will impact future growth and consumption patterns, with an emphasis on healthcare.
Digitization recognizes how digital innovation is revolutionizing companies and industries, shaking up long-established ways of doing business. Artificial intelligence, automation, robotics, cybersecurity and fintech are among the elements that we have highlighted.
The future of energy highlights how we expect advancing technologies to drive global adoption of alternative energy while fossil fuels gradually fade.
By their very nature, these trends are multi-year and powerful. As such, they continue to evolve throughout economic cycles. In turn, having portfolio exposure to the likely beneficiaries of these trends can provide resilient growth potential. By the same token, we also advise limiting exposure to businesses and sectors that are most likely suffer as these disruptive forces take hold and accelerate.
The events of 2020 have certainly reinforced our case for investing in Unstoppable trends. Many of the assets that relate directly to our existing themes have performed strongly amid in the pandemic. In fact, technologies developed over the past ten years served as substitutes for entire economic ecosystems when the pandemic collapsed part of the global economy. For the most part, digitization companies such as online retailers, telemedicine providers, teleconferencing providers, social media and digital entertainment providers have enjoyed increased demand owing to social distancing and lockdown measures.
Some of the key markets and sectors linked to The rise of Asia, meanwhile, have also shown notable resilience in 2020. This is especially true of China, whose total equity market capitalization made a new all-time record high in October 2020. Likewise, renewable energy sources have continued to perform better than global equities in general and traditional energy in particular, in line with The future of energy.
Admittedly, the strong performance of many assets related to our unstoppable trends during the pandemic has left many of them very highly valued. When COVID-19 retreats, many of the

71UNSTOPPABLE TRENDS OUTLOOK 2021CITI PRIVATE BANK
economic and market distortions that it has created are likely to unwind. Some companies and sectors that have proved most vulnerable to lockdowns and social distancing may continue to outperform in 2021 and beyond, but others may see revenue growth slow or even reverse. We advise that you position portfolios accordingly – see Exploiting mean reversion.
To be clear, though, we recommend maintaining core portfolio exposure to our existing unstoppable trends for five to ten years or more. We very much expect these trends to persist, both in the near term and over the long term. Indeed, the pandemic may have accelerated some of them. However, we also caution against excessive exposure at this point. Price gains for technologies in 2020 have resulted in many full allocations to digital disruptors from becoming very large overweight positions. This calls for rebalancing, rather than complete divestment.
For 2021 and beyond, we present two new unstoppable trends:
As part of Digitization, we highlight the rollout of fifth generation or 5G wireless data technology. We believe this development will mark a new phase of the digital revolution, enabling a vast increase in the number of devices connected to the internet. In Digitization: The age of hyper-connectivity is upon us, we make the case for investing in both the enablers and beneficiaries of 5G.
Greening the world concerns the world’s transition to a more sustainable existence. In 2020, electricity from renewable energy became cheaper than that from key fossil fuels for the first time ever. This is likely to hasten the greening of energy use over the coming years. We see potential arising from further technological advances, electrification and an energy efficiency drive.
As before, our latest trends are offered as additions to – rather than replacements for – our existing trends. We therefore take the opportunity to update and reiterate key elements of The rise of Asia and Increasing longevity.

72UNSTOPPABLE TRENDS OUTLOOK 2021CITI PRIVATE BANK
M A L C O L M S P I T T L E R - Investment Strategist
J O S E P H F I O R I C A - Head of Global Equity Strategy
4.2
Greening the world
Market forces – rather than government mandates alone – are now powering the switch from fossil fuels to renewables. The investment case for renewables just became even more compelling.
� The “greening” of energy supplies is now being driven by market forces more than legislation
� We expect further gains in technological innovation, electrification and efficiency in coming years
� We identify multiple potential beneficiaries such electric carmakers, battery makers, infrastructure suppliers and installers, and smart appliance makers
� By contrast, fossil fuel energy companies are likely to come under increasing pressure over the coming decades
73UNSTOPPABLE TRENDS OUTLOOK 2021CITI PRIVATE BANK
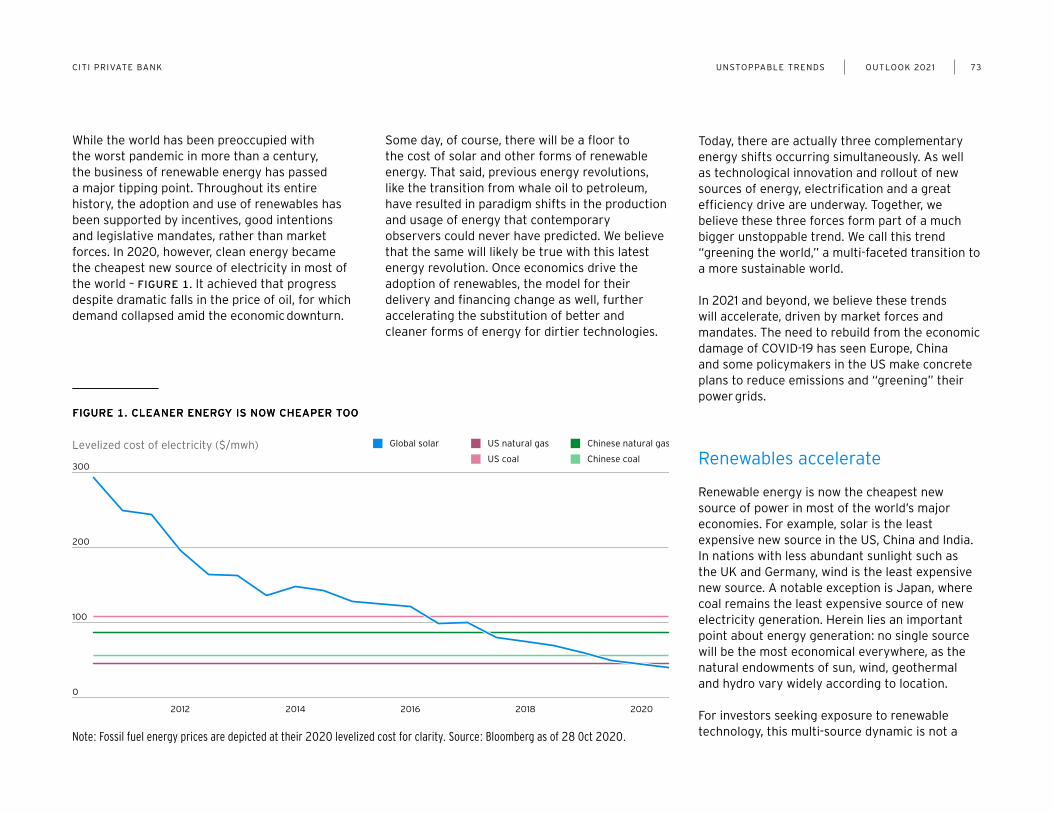
While the world has been preoccupied with the worst pandemic in more than a century, the business of renewable energy has passed a major tipping point. Throughout its entire history, the adoption and use of renewables has been supported by incentives, good intentions and legislative mandates, rather than market forces. In 2020, however, clean energy became the cheapest new source of electricity in most of the world – FIGURE 1. It achieved that progress despite dramatic falls in the price of oil, for which demand collapsed amid the economic downturn.
Some day, of course, there will be a floor to the cost of solar and other forms of renewable energy. That said, previous energy revolutions, like the transition from whale oil to petroleum, have resulted in paradigm shifts in the production and usage of energy that contemporary observers could never have predicted. We believe that the same will likely be true with this latest energy revolution. Once economics drive the adoption of renewables, the model for their delivery and financing change as well, further accelerating the substitution of better and cleaner forms of energy for dirtier technologies.
Today, there are actually three complementary energy shifts occurring simultaneously. As well as technological innovation and rollout of new sources of energy, electrification and a great efficiency drive are underway. Together, we believe these three forces form part of a much bigger unstoppable trend. We call this trend “greening the world,” a multi-faceted transition to a more sustainable world.
In 2021 and beyond, we believe these trends will accelerate, driven by market forces and mandates. The need to rebuild from the economic damage of COVID-19 has seen Europe, China and some policymakers in the US make concrete plans to reduce emissions and “greening” their power grids.
Renewables accelerate
Renewable energy is now the cheapest new source of power in most of the world’s major economies. For example, solar is the least expensive new source in the US, China and India. In nations with less abundant sunlight such as the UK and Germany, wind is the least expensive new source. A notable exception is Japan, where coal remains the least expensive source of new electricity generation. Herein lies an important point about energy generation: no single source will be the most economical everywhere, as the natural endowments of sun, wind, geothermal and hydro vary widely according to location.
For investors seeking exposure to renewable technology, this multi-source dynamic is not a Note: Fossil fuel energy prices are depicted at their 2020 levelized cost for clarity. Source: Bloomberg as of 28 Oct 2020.
FIGURE 1. CLEANER ENERGY IS NOW CHEAPER TOOFIGURE 1. CLEANER ENERGY IS NOW CHEAPER TOO
Global solar Chinese natural gas
Chinese coal
US natural gas
US coal
20202018201620142012
Levelized cost of electricity ($/mwh)
0
300
200
100

74UNSTOPPABLE TRENDS OUTLOOK 2021CITI PRIVATE BANK
major issue. The manufacturers of both solar technology and wind turbines can both prosper as market forces determine the right technology for each location. However, investors should be wary of projects that are not well suited to a particular location.
The main winners from the transition to renewable energy sources are likely to be energy consumers, both households and companies. The biggest losers will be within the traditional fossil fuel industries. We also see potential winners among energy producers. In 2020 to date, the MSCI Global Alternative Energy Index has outperformed world equities. And it has outperformed the traditional energy sector to an even greater extent – FIGURE 2.
An electrifying trend
As the price of electricity falls, end-users of energy will find it less expensive to use electricity instead of traditional fuels. This transition will require new technologies in areas as diverse as vehicles, heating and large-scale manufacturing. It is the innovators of these new techniques who are most likely to thrive in our greener energy future, as firms that cling to traditional methods find themselves facing a shrinking market and an unsustainable cost curve.
Burning fuel releases energy in the form of heat. It is then possible to harness and convert that heat into electricity. For many applications, however, the process ends earlier. When heating buildings, for example, there is no need to go
through the trouble of converting fuel to heat, heat to electricity, and finally back into heat. Using oil or natural gas boilers and furnaces avoids this costly round trip. Likewise, in many industrial settings – such as chemicals manufacturing – energy is utilized as either heat or movement without ever passing through a wire. Heat, motion and electricity are all forms of energy, but it is expensive in terms of waste to transform one type into another so factories have had an incentive to use their energy sources wisely. For instance using fuel to spin a steam turbine and then using the defuse heat to accelerate a chemical reaction. These sorts of solutions have been built up over generations,
and will require creative new technologies to take advantage of abundant clean electric power.
In transportation, the example is crystal clear. Battery-powered electric car sales are rapidly ramping up. New industries, like charging station vendors, have arisen. Markets have taken note, with the equity value of global electric vehicle producers and their suppliers rocketing up in 2020. The most prominent example is Tesla, whose market capitalization stands at more than one-third of the MSCI Global Auto Sector Index, despite selling only a little over 0.5% of all cars worldwide in 2019.
Source: Bloomberg, as of 4 Nov 2020. Indices are unmanaged. An investor cannot invest directly in an index.They are shown for illustrative purposes only. Past performance is no guarantee of future returns. Real results may vary.
FIGURE 2. RENEWABLES’ SHINING PERFORMANCE
Jan 2019 = 100 MSCI AC World Energy IndexMSCI Global Alternative Energy Index MSCI AC World
20
220
Apr 19 Jul 19 Oct 19 Jan 20 Apr 20 Jul 20 Oct 20
170
120
70
75UNSTOPPABLE TRENDS OUTLOOK 2021CITI PRIVATE BANK
Among new heating technologies, improved heat pumps are also changing the game. Rather than the notoriously inefficient process of creating new heat from electricity, these pumps move heat around instead, effectively functioning as air conditioners running in reverse. New air and geothermal heat pumps are approaching cost parity with fossil fuels for heating and are already less expensive than traditional compression-based air conditioners.
For industrial applications, electrification will likely find a mix of solutions with heat pumps, electric motors and existing hydrogen turbines powered by green sources of hydrogen. While governments around the world may pass laws and green energy targets, falling prices will ultimately drive the mass electrification of industry, as producers can otherwise relocate to avoid higher taxes and tougher regulations.
Likely beneficiaries of electrification include electric carmakers, battery makers and, eventually, heavy industry innovators.
Efficiency: Batteries now included
As more appliances and vehicles undergo electrification, energy efficiency will become increasingly important. This means getting the most out of batteries and helping utilities manage dramatically higher usage.
A prior case that shows how efficiency improvements might play out is through the straightforward shift to LED lighting. Early iterations of this technology were often inferior to traditional lightbulbs, combining odd shades of light, humming transformers and high upfront price points. However, market forces and technological improvements have since solved these teething problems.
Even as the emerging green energy revolution drives down the price of electricity, efficiency gains are likely to continue rapidly. Part of this has to do with how much efficiency is due to improvements in mobile computing as computers require less power to perform well. Likewise, one of the key factors behind electric cars’ growing appeal is their ability to achieve similar or better performance with far less energy.
Battery technology remains a relatively expensive link within the electrification chain. Getting the most out of the least electricity will continue to drive down power usage even in the face of falling electricity prices. Efficiency gains often come accompanied by a host of other improvements, making use of cheap computing to establish “smart grids” that can efficiently toggle power to lower overall usage, or just reducing heat waste and the need for additional cooling in industrial spaces and data centers alike.
Emerging technologies in residential and commercial buildings have enabled two-way communication between grids and appliances, enabling some appliances to be “turned off” when they are not needed. In addition, tightly regulated heat pumps and other heating, ventilation and air conditioning systems will make for more comfortable and attractive residential, commercial and industrial spaces. Faced with the opportunity to make structural improvements while offices remain empty during the present pandemic, a number of commercial real estate investment trusts (REITs) have sought to undergo large-scale efficiency upgrades. Their aims are to lower costs and increase the attractiveness of their properties.
Likely beneficiaries include the suppliers and installers of residential and commercial infrastructure, as well as battery makers, “smart” appliance manufacturers, and select REITs.
05. UNSTOPPABLE TRENDSGREENING THE WORLD - V1

76UNSTOPPABLE TRENDS OUTLOOK 2021CITI PRIVATE BANK
A greener future post-COVID
There is a growing consensus that the world needs to find new and better ways of doing things once the pandemic is defeated. Switching to cleaner and more sustainable sources of energy is an obvious example of how we can do this. At the same time, there is a belief that many governments will probably borrow and spend more in order to stimulate growth in the coming years. Capital investment in renewable energy and related infrastructure will likely play a prominent role in such initiatives.
The European Union’s €750bn recovery fund will have a green emphasis, both in terms of focus as well as fundraising. The EU has promised to raise 30% of the required debt by issuing green bonds. In addition, it has pledged that all of the spending must contribute to its emission-cutting goals. In addition, a number of EU-wide green taxes are under consideration to support the eventual repayment of the fund.
As part of its COVID recovery plan, China in April announced an extension of electric car subsidies and tax breaks through 2022. Previously, these were set to expire in 2020. What is more, China has started spending $1.5bn to grow its electric car-charging network by 50% in 2020. President Xi Jinping lately announced China’s goal of reaching carbon neutrality by 2060, planning investments of more than $5 trillion in renewable power generation, while shuttering coal-fired plants or retrofitting them with carbon capture technology.
Make your portfolios greener, too
There are many wise ways that you can build exposure to the greening of the world in portfolios. Targeting firms at the cutting edge of new energy development, electrification, or energy efficiency can offer exposure to this unstoppable trend.
At the same time, shifting out of fossil fuel assets could avoid the negative impact from the most obvious losers of the transition. That said, the benefits from fossil fuel divestment have diminished as traditional energy has fallen to below 3% of global equity market capitalization. To date, most publicly-traded innovators in green technology tend to skew towards European- and Chinese-listed firms, while many US opportunities are in the private space or at the project level.
Finally, while we see many areas that the green revolution is only beginning to touch, we suggest a strong focus on cost and quality. Green energy and transportation did not become Unstoppable trends until they were price and quality competitive. With global policy aligning with improving economics, we see the global winds blowing towards a decade or more of intense investment and innovation in renewable technologies.

77UNSTOPPABLE TRENDS OUTLOOK 2021CITI PRIVATE BANK
The switch from fossil fuels to renewables is integral to the process of “greening the world.” However, it is also only one facet of our transition to a more sustainable existence. This is as true for investors as it is for the whole of society. The emergence of a greener world has implications for the ways that we approach every investment. Indeed, as companies move more aggressively to adopt new, greener standards, we are able to identify attractive possibilities across every asset class. These leading companies can enable us to build entire core and opportunistic allocations that reflect sustainable principles. We might describe process as “greening your portfolio.”
As the world goes greener, the opportunities for investors are likely to multiply over the coming years. The opportunities extend beyond the companies that develop or deliver the infrastructure for the green revolution. They include firms that are making commitments to lower their emissions, raise environmental and ethical standards throughout their supply chains, and explore new forms of financing, such as green bonds, so as to attract a different investor base.
We see multiple drivers for the drive to go green. Legislation remains an important influence, with initiatives such as the European Union’s “carbon
border tax,” a proposed levy on imports coming into the EU based on carbon emissions during production. Increasingly aware consumers are also demanding change through their buying patterns, forcing corporations to rethink how they operate. Importantly, the baseline economic case is strengthening. As in the case of renewable energy, embracing sustainability is no longer simply the right thing to do, but also best for business.
The way you invest can also make the world greener by influencing the value of green companies relative to others. As well as helping to effect positive societal change, greening your portfolio has the potential to support investment and social outcomes. We see more opportunities here than ever before. For example, green bonds – which fund sustainable infrastructure and new technologies – could serve as part of a core portfolio’s fixed income allocation. Equities relating to renewable energy and the circular economy could provide targeted thematic exposure for a core portfolio or alpha-seeking potential within your opportunistic portfolio. The possibilities extend beyond the public markets, with many innovative private companies seeking funding from sophisticated investors who seek returns and diversification, while also serving the greater good.
Your relationship team stands ready to help you explore the possibilities for greening your portfolio.
Greening your portfolio as the world goes green
H A R L I N S I N G H U R O F S K YGlobal Head of Sustainable Investing
78UNSTOPPABLE TRENDS OUTLOOK 2021CITI PRIVATE BANK
J O E F I O R I C A - Head of Global Equity Strategy
M A L C O L M S P I T T L E R - Investment Strategist
4.3
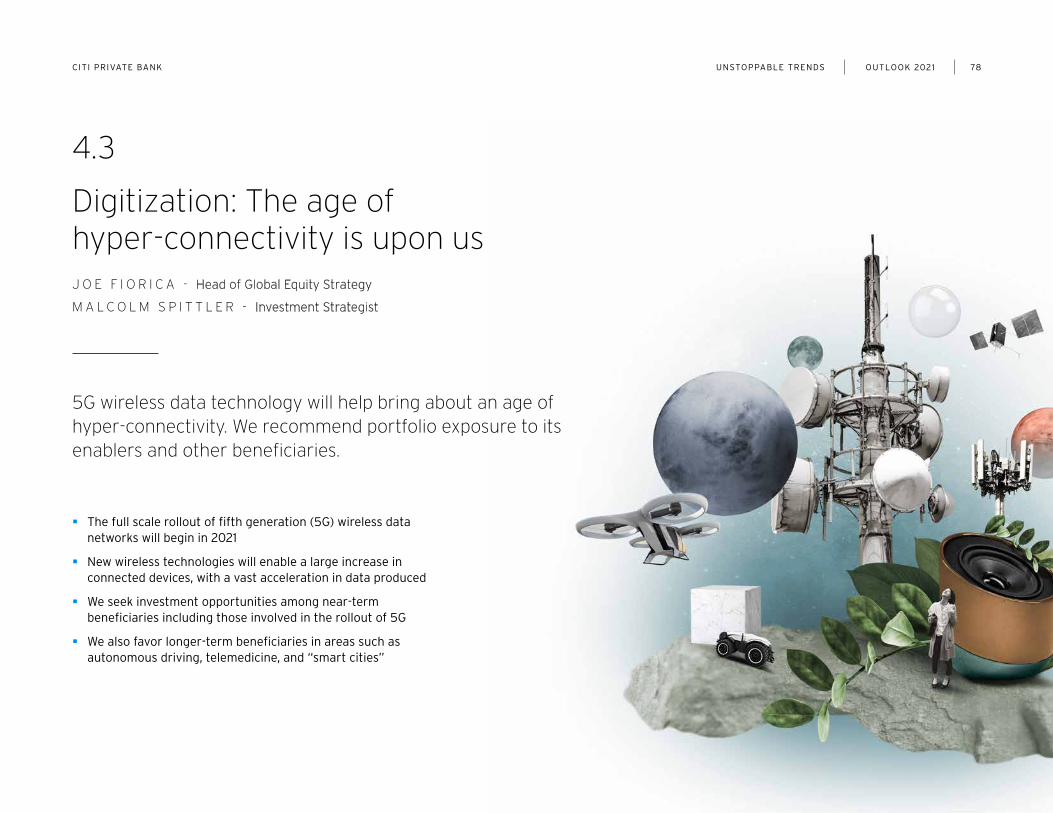
Digitization: The age of hyper-connectivity is upon us
5G wireless data technology will help bring about an age of hyper-connectivity. We recommend portfolio exposure to its enablers and other beneficiaries.
� The full scale rollout of fifth generation (5G) wireless data networks will begin in 2021
� New wireless technologies will enable a large increase in connected devices, with a vast acceleration in data produced
� We seek investment opportunities among near-term beneficiaries including those involved in the rollout of 5G
� We also favor longer-term beneficiaries in areas such as autonomous driving, telemedicine, and “smart cities”

79UNSTOPPABLE TRENDS OUTLOOK 2021CITI PRIVATE BANK
The world is in the midst of a digital revolution that is about to enter a new phase. Over recent decades, digitally disruptive innovations have brought about a transformation of how we live and work. In particular, internet connectivity has led to profound shifts in how businesses sell goods and services, organize themselves and their workforces, and gather information. Likewise, the ways that individuals communicate, consume, enjoy entertainment and even find love are now dramatically different. As far-reaching as these changes have been, the digital revolution has far to go. And we believe it is about to take another great leap forward, as emerging technologies enable faster and wide-ranging coverage across the globe.
Hyper-connectivity: High speeds and broader reach
Fifth generation – or 5G – wireless networking technology is the latest standard for broadband cellular networks. In dense urban cores, and critical locations such as hospitals, 5G may enable download speeds up to 100 times faster than those available on existing 4G networks. What is more, in these locations communication latency – the delay between an input or request for data and the network’s response – is only one-tenth of existing cellular levels. For dense urban cores, 5G has the potential to boost performance substantially, with far more connections available and revolutionary faster speed. For most users, the technology will be more of an evolution, with a small boost in speed and improvement in latency.
While 5G has been available for a couple of years, we think 2021 will be the true start of the rollout of fifth generation or “5G” wireless data. Apple and Android have both launched flagship phones that can fully utilize 5G, while the number of cell towers that can support 5G standards is increasing in the most important markets in the US, China and Europe. But while 5G sounds like a consolidated new technology, it is actually simply an umbrella standard, encompassing a basket of technologies that have radically different costs and benefits. While many commentators and marketing campaigns will focus on the benefits of ultra-fast high band wireless, the more stable but much less speedy 5G protocols will enable millions of users first-time access to reliable internet connectivity, ultimately benefiting digitally-focused innovators across a range of industries.
While 5G will revolutionize broadband speed in dense urban areas, another emerging technology
has the potential to offer reliable coverage to areas yet unreached by high- speed internet providers. Satellite internet constellations such as Starlink could become a significant disruptor, with large numbers of low-earth orbit satellites being launched to provide broadband access. This could result in high-speed internet in remote parts of both the developed and developing worlds for the first time.
The big winner from hyper-connectivity: Making data more valuable
The benefits of this hyper-connectivity could be extensive. Many more machines within factories could start communicating with one another, helping to maximize output, reduce downtime and minimize waste. Farmers will be able to monitor
Source: Office of the Chief Investment Strategist, Citi Private Bank, as of 31 Oct 2020
FIGURE 1. EMERGING HYPER-CONNECTIVE TECHNOLOGIES AND THEIR BENEFICIARIES
TECHNOLOGIES BENEFICIARIES
ULTRA-FAST WIRELESS (HIGH-BAND 5G) AUTONOMOUS VEHICLES, WEARABLES, “SMART CITIES”, AUGMENTED REALITY
WIDER COVERAGE (MEDIUM- AND LOW-BAND 5G, SATELLITE)
FINTECH, E-COMMERCE, EDUCATION TECHNOLOGY, CYBER SECURITY
80UNSTOPPABLE TRENDS OUTLOOK 2021CITI PRIVATE BANK
their crops’ condition effortlessly and tend to them from afar. Buildings will automatically calibrate their own energy use based on real-time occupancy, while power suppliers will manage supply and demand more efficiently – see Greening the world. Healthcare providers will be able to track the well-being of hundreds of millions of people simultaneously, receiving early warnings of heart attacks and strokes before they strike.
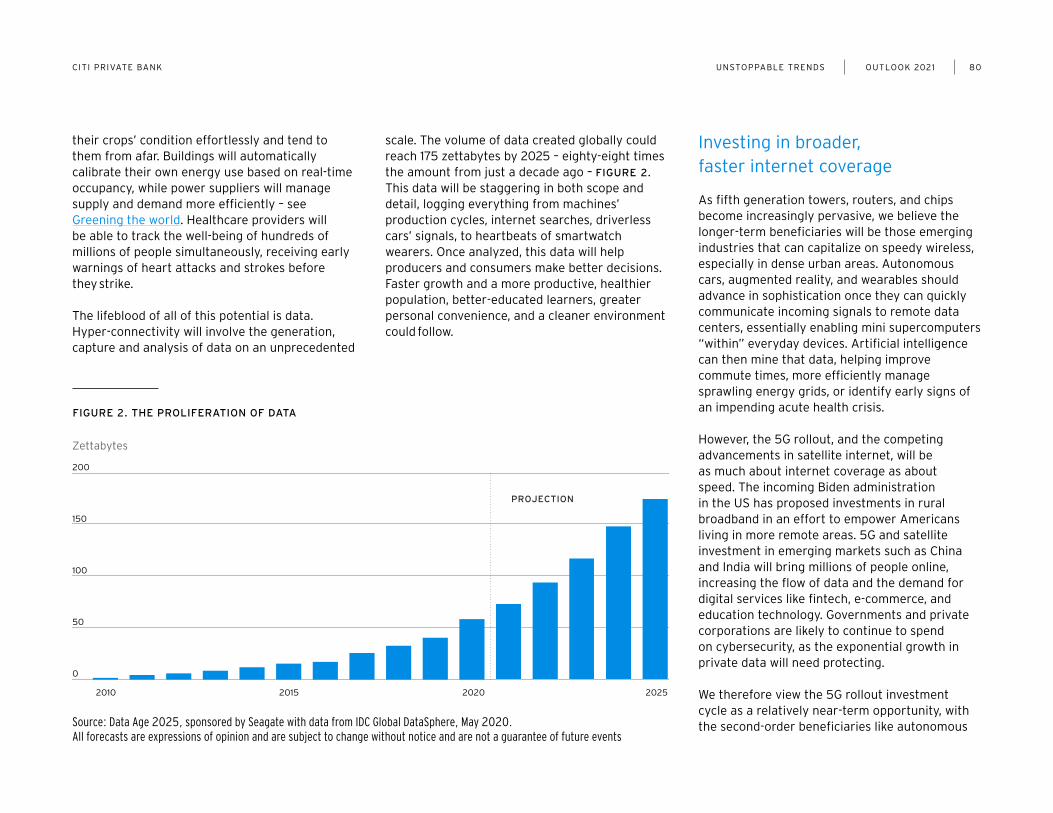
The lifeblood of all of this potential is data. Hyper-connectivity will involve the generation, capture and analysis of data on an unprecedented
scale. The volume of data created globally could reach 175 zettabytes by 2025 – eighty-eight times the amount from just a decade ago – FIGURE 2. This data will be staggering in both scope and detail, logging everything from machines’ production cycles, internet searches, driverless cars’ signals, to heartbeats of smartwatch wearers. Once analyzed, this data will help producers and consumers make better decisions. Faster growth and a more productive, healthier population, better-educated learners, greater personal convenience, and a cleaner environment could follow.
Investing in broader, faster internet coverage
As fifth generation towers, routers, and chips become increasingly pervasive, we believe the longer-term beneficiaries will be those emerging industries that can capitalize on speedy wireless, especially in dense urban areas. Autonomous cars, augmented reality, and wearables should advance in sophistication once they can quickly communicate incoming signals to remote data centers, essentially enabling mini supercomputers “within” everyday devices. Artificial intelligence can then mine that data, helping improve commute times, more efficiently manage sprawling energy grids, or identify early signs of an impending acute health crisis.
However, the 5G rollout, and the competing advancements in satellite internet, will be as much about internet coverage as about speed. The incoming Biden administration in the US has proposed investments in rural broadband in an effort to empower Americans living in more remote areas. 5G and satellite investment in emerging markets such as China and India will bring millions of people online, increasing the flow of data and the demand for digital services like fintech, e-commerce, and education technology. Governments and private corporations are likely to continue to spend on cybersecurity, as the exponential growth in private data will need protecting.
We therefore view the 5G rollout investment cycle as a relatively near-term opportunity, with the second-order beneficiaries like autonomous Source: Data Age 2025, sponsored by Seagate with data from IDC Global DataSphere, May 2020.
All forecasts are expressions of opinion and are subject to change without notice and are not a guarantee of future events
FIGURE 2. THE PROLIFERATION OF DATA
Zettabytes
0
200
150
100
50
2010 2015 2020 2025
PROJECTION
81UNSTOPPABLE TRENDS OUTLOOK 2021CITI PRIVATE BANK
driving, telemedicine, and “smart cities” as longer-term winners. Like the telegraph, telephone, and dial-up internet before it, 5G is simply the next step in a centuries-long process that has dramatically improved communications across borders and geographies. It is with that framework in mind that we look forward to the benefits of the 5G rollout ahead, but we see the wider Unstoppable trend of Digitization as likely to long outlive the next generation of internet delivery.
Digitization drives other unstoppable trends
We also expect hyper-connectivity to accelerate some of our other Unstoppable trends. Most obviously, this includes other elements of digital disruption. For example, the vast increase in data we foresee will need to be stored securely, out of reach of cyber-criminals and others. This stands to benefit cyber-security specialists – see Cybersecurity: Safeguarding the data revolution. Likewise, we expect 5G to enable increasing adoption of artificial intelligence and robotics, including driverless cars – see Digital disruption: Artificial intelligence.
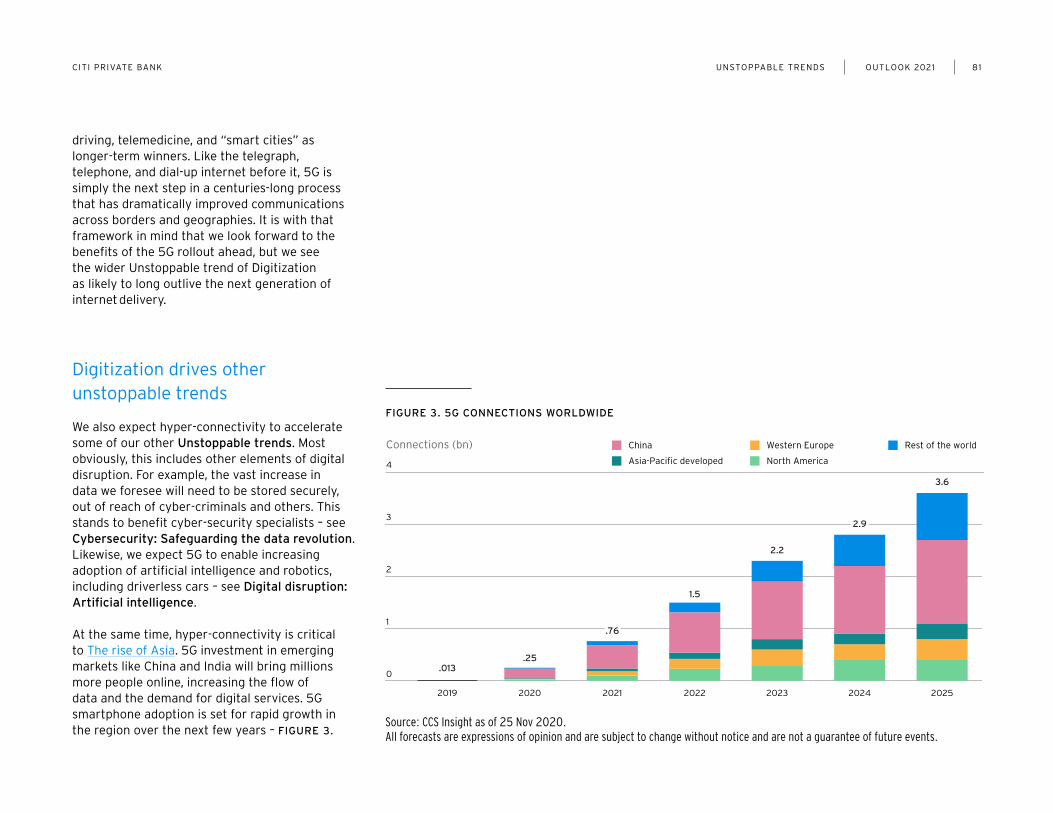
At the same time, hyper-connectivity is critical to The rise of Asia. 5G investment in emerging markets like China and India will bring millions more people online, increasing the flow of data and the demand for digital services. 5G smartphone adoption is set for rapid growth in the region over the next few years – FIGURE 3.
Source: CCS Insight as of 25 Nov 2020. All forecasts are expressions of opinion and are subject to change without notice and are not a guarantee of future events.
FIGURE 3. 5G CONNECTIONS WORLDWIDE
3.6
2.2
1.5
.25.013
2.9
2019 2020 2021 2022 2023 2024 2025
Connections (bn)
4
3
2
1
0
Rest of the worldWestern Europe
North America
China
Asia-Pacific developed
.76

82UNSTOPPABLE TRENDS OUTLOOK 2021CITI PRIVATE BANK
The development of smart cities – urban areas that use data and sensors to make better decisions about resources and improve residents’ lives – will help drive to the region’s ongoing urbanization. Likewise, 5G’s applications in telemedicine, remote surgery and geriatric care are central to today’s world of Increasing longevity. Also, the boom in connectivity and data processing enabled by the 5G revolution will likely aid the smarter more efficient power grid we see emerging from Greening the world.
Note: Hyper-connectivity basket leverages Citi Research Theme Machine and includes companies with high exposure to the following categories: mobile network transition, data storage, cloud computing, internet of things, e-commerce, artificial intelligence, fintech, cyber security, wearable tech, smart mobile devices demand, virtual reality, automation/robotics. Source: Bloomberg and Citi Private Bank (OCIS) as of 6 Nov 2020. Past performance is no guarantee of future results. Indices are unmanaged. An investor cannot invest directly in an index. They are shown for illustrative purposes only. Past performance is no guarantee of future returns. Real results may vary.
FIGURE 4. HYPER-CONNECTIVITY HAS OUTPERFORMED
2010 = 100 MSCI AC World Info TechHyper-connectivity basket MSCI AC World
0
800
600
400
200
20122010 2014 2016 2018 2020
83UNSTOPPABLE TRENDS OUTLOOK 2021CITI PRIVATE BANK
D AV I D B A I L I N - Chief Investment Officer
K E N P E N G - Head of Asia Investment Strategy
4.4
The rise of Asia: Asian development in a “G2 world”
With Asia’s importance in the world economy rising, we also expect continued strategic competition between the US and China. Both developments offer compelling potential investment opportunities.
� We expect a continuing shift in economic power towards Asia over the coming decades
� Deglobalization led by the decoupling of the US and China – the “G2 powers” – is also likely
� A “G2 world” where the two super-powers compete for clients across two divergent ecosystems may allow global investors to build more diversified portfolios
� We see a broad range of opportunities linked to the emergence of separate technological standards, the acceleration of middle class consumption in Asia, and supply chain diversification away from China

84UNSTOPPABLE TRENDS OUTLOOK 2021CITI PRIVATE BANK
Asia is on the rise. Its comparative success in managing the pandemic is just the latest example of its prowess. Using extensive testing, contact tracing, temperature monitoring and enforcement of its regulations through technology, many countries in the region had lower incidence of the disease and large parts of their economies recovered more quickly.
The past year stands also as a milestone in Asia-Pacific’s economic achievements. In 2020, the region’s gross domestic product in purchasing power parity terms will overtake that of the rest of the world combined for the first time since the nineteenth century. And we expect it to pull further ahead over the coming decades. Asia is set to account for the vast majority of growth of the world’s middle class by 2030, or some 1.5 billion people in total. It will likely add a hundred cities with a population of above one million. It is also home to the world’s largest free trade area recently setup under the Regional Comprehensive Economic Partnership (RCEP).
For these reasons and more, we believe The rise of Asia represents an unstoppable trend – see Outlook 2019.
As Asia’s global economic and political significance continues to grow, we see increasing tension between the world’s two foremost powers, the US and China. The recent trade wars between the two is merely an obvious manifestation of this conflict. China is seeking to rival the US in industries where the latter has been dominant for decades. China’s growing military might and
assertiveness within Asia, as well as its growing economic ties to other nations, represent further challenges to the US.
The US is likely to respond to China differently under a Biden administration. In fact, unlike the “go it alone” strategy employed by President Trump, it is probable that President-elect Biden will rally like-minded nations to pressure China on issues such as intellectual property protection, fairness in trade terms and conditions, and access to markets among other issues. Thus, while negotiations may lead to a better partnership on some issues, like climate change, it is likely that competition and the different standards of their two spheres of influence will cause investors to consider where to put their capital.
We believe that the ongoing G2 polarization, Asia’s continued rise, and the interplay between the two have important implications for global investors. We therefore consider various potential scenarios and the opportunities and risks that we see for your portfolio.

85UNSTOPPABLE TRENDS OUTLOOK 2021CITI PRIVATE BANK
Source: Office of the Chief Investment Strategist, Citi Private Bank, as of 8 Nov 2020.
FIGURE 1. WHAT NEXT FOR G2 RELATIONS?
SCENARIO FEATURES MARKET IMPLICATIONS
STRATEGIC COMPETITION (BASE CASE)
� Strategic competition in the technology and security realm
� Moderate escalations in trade and corporate restrictions
� No military conflict
Invest in domestic and regional demand, dual tech standards, extra infrastructure, supply chain relocation
EASING TENSIONS (BULL CASE)
� More diplomatic engagement
� China adapts friendlier foreign policies
� Return of multilateral trade deals
� No escalation in economic restrictions
Positive global growth, stable international trade
INTENSIFIED DECOUPLING (BEAR CASE)
� Proxy military engagement, likely in South China Sea
� Severe disruptions of supply chains and commercial activity
Invest in defense, gold, avoid South China Sea
G2 polarization: Can a realignment of economic interests reduce risks?
The G2 struggle has escalated since we addressed it in Mid-Year Outlook 2019. In particular, the US has applied a variety of measures to exclude certain Chinese technology companies from the US and restrict China’s access to supplies of US-dominated strategic technologies. Ideological differences over issues such as human rights have sharpened. COVID-19’s origins in China have heightened the standoff, and have persuaded some countries to fall in behind the US.
We expect that the US will actively re-engage with European allies, Japan, Australia and others to create common goals and standards for trade, technology, climate and health policies. China, too, will develop its own standards and practices.
Our base case for G2 relations is based upon an increase in strategic competition – FIGURE 1. We believe this will be characterized by moderate escalations in trade and corporate restrictions, but no military confrontation between the US and China or their proxies. Of course, there are other possible scenarios, but we believe that completely decoupling the economic ties between the two countries would be prohibitively costly and hence unlikely.
China’s economic ties with certain countries could still strengthen further, even as polarization with the US continues. The signing of the RCEP with 14 other nations including Japan and Australia is an example of such ties. There is a widespread
belief that China is now going to refocus inwards to drive its development. While this is true, it is not the full story. President Xi has emphasized that China is “open for business” and will become more so. The nation is running pilot schemes in the Greater Bay Area to ease work visa policies, increase foreign ownership and broaden the industries open for foreign investment. Critically, capital account convertibility will be tested, which would be a critical step towards making the Chinese yuan a more accepted reserve currency.
Stronger Chinese economic ties with the rest of the world will allow more investors to share in the country’s growth. We believe this is likely even as the US and China decouple further. Whether China’s efforts to open up will prove sufficient will remain unclear. In the past, though, the Chinese leadership has successfully adjusted policies at times of international tension. Further opening up to share its growth potential with more outsiders is the right place for China to start this time.

86UNSTOPPABLE TRENDS OUTLOOK 2021CITI PRIVATE BANK
The G2 technology divide
Technology has become a key battleground in the G2 world. Increasingly, we may see the emergence of two separate rival internets and different technology platforms that overlap in selected markets globally. Despite US efforts to cut China off from US technology, we believe that over time, China can find alternative sources – FIGURE 2 – and increasingly develop homegrown substitutes.
The US’s current chokehold is in semiconductor chip design and fabrication equipment. This will
remain a huge advantage in the age of 5G, and create significant issues for China’s advances in areas from high-end smartphones to its space exploration program.
In the coming decade, however, the US advantage here may fade. Advances in modern computing have been about shrinking the size of silicon based transistors so more can fit on ever smaller chips, as posited in “Moore’s Law”. But further increases in density will run into limits in the coming decade. Further gains in computing power would thus require alternatives, such as quantum computing, extremely strong and thin graphene,
or energy conserving nanomagnets. Both China and the US have already made early progress in quantum computing technology, which has become a priority in China’s $2 trillion 2025 technology investment plan. These technologies are still in their infancy, with no obvious leader in setting standards, which may level the playing field between the G2 powers in the future.
Positioning for the rise of Asia and a G2 world
With the rise of Asia and G2 polarization both set to endure, we believe that you should position core portfolios for both trends. Meaningful allocations to China and Asia more broadly can help make globally diversified portfolios more resilient. Since we highlighted the rise of Asia as an Unstoppable trend in 2018, the MSCI Asia ex-Japan has returned 36%, while MSCI China and CSI 300 indices recorded 58% and 78% respectively, compared to 47% for the S&P 500.
Importantly for investors, ongoing G2 polarization may represent a favorable development. As the US and China decouple, with the emergence of separate supply chains across two distinct centers of economic gravity, correlations between assets on each side may decrease. This would be helpful from the perspective of building diversified portfolios.
Sustaining two separate standards in technology would require greater capital investment in infrastructure and research on each side. Among
Note: % shown as of China’s total semiconductor imports, semiconductor imports include those under HS code of 8541 Light-Emit Diodes and 8542 Integrated Circuits. Source: Haver Analytics, Bloomberg, as of 12 Nov 2020.
FIGURE 2. SOURCES OF CHINA’S SEMICONDUCTOR IMPORTS
China’s semiconductor imports ($bn)
16
12
8
4
0
Jan ‘18Jun ‘17 Jun ‘18 Jun ‘19 Jan ‘20 Jun ‘20Jan ‘19
Taiwan Malaysia USSouth Korea Japan

87UNSTOPPABLE TRENDS OUTLOOK 2021CITI PRIVATE BANK
the beneficiaries could be semiconductor makers that are neither from the US nor China. These include semiconductor equipment makers from Taiwan, Korea and Europe. Likewise, 5G infrastructure and cybersecurity providers globally might also see increased demand. Southeast Asia (SEA) is likely to be among key beneficiaries of capital investment from both the US and China.
Indeed, SEA has already benefited from companies diversifying their supply chains away from China, both in technology and beyond. Such activity picked up pace in 2018 amid the escalating trade war. Naturally, SEA wishes to continue serving both Chinese and US markets. To do so, the region will need to make greater investment in traditional infrastructure. Likely beneficiaries include companies involved in construction, industrial automation, shipping commodities, and real estate.
In China, we see numerous opportunities related to its continuing development, as articulated in the 14th Five Year Plan. Domestically, the objectives are self-sufficiency in core technologies and developing domestic demand through new urbanization. Industries such as consumer brands, e-commerce, logistics, travel & leisure, healthcare, insurance and wealth management stand to gain.
At the same time, we recommend exposure to China’s ongoing “opening-up.” Greater capital market activity is essential for the adoption of the Chinese yuan into a true international reserve currency, as well as adding reasons to attract to foreign capital. Wealth management, brokerage,
real estate, healthcare and education are areas that are likely to see most positive impact from this.
As to the global challenge of climate change, Asian countries and companies are already playing a major role. Many are developing and installing infrastructure that changes how energy is produced and consumed. Investments in companies with high environmental, social and governance (ESG) standards may receive additional attention. Building up ESG standards can help foreign investors overcome their lack of knowledge in the local business environment. This is likely to favor alternative energy, electric vehicles, and firms with strong governance – see also Unstoppable trends: Greening the world.

88UNSTOPPABLE TRENDS OUTLOOK 2021CITI PRIVATE BANK
J O E C O R D I - Equity Analyst, Citi Investment Management
A R C H I E F O S T E R - Co-Head of Global Equities, Citi Investment Management
W I E T S E N I J E N H U I S - Senior Portfolio Manager, Global Equities, Citi Investment Management
4.5
Increasing longevity: The healthcare opportunity
The rapid aging of the world’s population presents many challenges for society, particularly related to healthcare. For a variety of innovative companies, we believe this represents an opportunity.
� The world’s elderly population is growing quite rapidly
� Addressing the healthcare needs of this population poses many challenges, highlighted by the COVID-19 pandemic
� For the providers of innovative healthcare-related solutions, we see increasing longevity as an opportunity
� We recommend core portfolio exposure to personalized medicine and cancer treatment, healthcare infrastructure and pandemic preparedness, and remote monitoring and devices

89UNSTOPPABLE TRENDS OUTLOOK 2021CITI PRIVATE BANK
The world is facing an unprecedented demographic shift. As of 2019, the global population aged over 65 stood at 703 million, or one in every eleven people. By 2050, this is set to have more than doubled to 1.5 billion, or one in every six people. The “very senior” cohort – those aged over 80 – is likely to increase even more rapidly, from 143 million to 426 million. This pattern is the result of many decades of improving life expectancy and declining fertility. As we set out in Outlook 2019, we see increasing human longevity as an Unstoppable trend and opportunity.
Such dramatic aging of the global population has far-reaching implications for the economy, business, social relations, voting patterns and more. Meeting the healthcare needs of many more elderly people will be a particularly pressing priority worldwide. Currently, more than three-quarters of those aged 65 and over have at least two chronic conditions. Spending per capita on healthcare in developed nations for someone aged over 85 can be as much as six times greater than for a 59-year old. But while the increase in future healthcare needs represents a challenge for society, we believe it creates opportunities for a wide range of innovative companies.
The COVID-19 pandemic has put renewed focus upon both aging and healthcare. The virus has disproportionately affected the elderly in every country, while highlighting the vulnerability of existing healthcare systems. At the same time, the exceptional circumstances have accelerated the adoption of innovative technologies and treatments. We believe technological adoption will outlast the pandemic, benefiting both
patients and healthcare innovators alike. In particular, we see various opportunities across three areas relating to this Unstoppable trend.
Personalized medicine and cancer treatment
Cancer is already the second-leading cause of death worldwide. Its prevalence increases with advancing age: four-fifths of new cancers occur after the age of 55, with over a quarter of new cancer diagnoses among those aged 65 to 74.1
As a result, case numbers could increase significantly over the coming decades.
Personalized medicine is likely to help to address this looming challenge. Throughout history, healthcare has typically focused upon treating people with one-size-fits-all remedies only once they fall sick. However, breakthroughs in our understanding of DNA will increasingly enable a more preventative approach based on an individual’s genetic make-up. Personalized medicine seeks to identify an individual’s susceptibility to disease, prevent disease if possible, detect problems earlier on, and then customize treatment. We are already seeing the benefits of personalized medicine across several therapeutic areas, particularly for cancer treatment.
An important and novel diagnostic tool within personalized medicine is the liquid biopsy. Whereas traditional biopsies extract tissue, a liquid biopsy relies upon screening bodily fluids for tumor DNA. As well as the potential for earlier detection, this non-invasive test enables better real-time assessment following diagnosis. The liquid biopsy represents one of the most important clinical advancements in cancer detection. In the US alone, the addressable market opportunity could reach $30bn to $130bn in the years ahead.2
2 Citi GPS, Disruptive Innovations VI, August 2018
1 National Cancer Institute, Cancer Treatment and Survivorship Facts and Figures, 2017
FIGURE 1. THE GRAYING OF THE WORLD
1950 1990 2030 2070
Share of people aged over 60 (%)
30
15
0
PROJECTION
Source: United Nations, 2019 Revision of World Population Prospects Report. As of August 2019. Accessed December 2019. All forecasts are expressions of opinion and are subject to change without notice and are not intended to be a guarantee of future events.

90UNSTOPPABLE TRENDS OUTLOOK 2021CITI PRIVATE BANK
We also see opportunity on the therapeutic side. Drug companies are increasingly seeking to developed novel therapies that seek to change the way we treat certain conditions. Immuno-oncology, for example, takes advantage of the body’s immune system to fight cancer. CAR-T – chimeric antigen receptor T-cell – therapy reprograms an individual patient’s immune-system cells to resist the cancer, which can work effectively even in certain advanced cases.
Healthcare infrastructure and pandemic preparedness
Public and private healthcare and biopharmaceutical spending have increased over the last few years. However, the COVID-19 pandemic has highlighted the still-significant under-resourcing of healthcare systems across the world, particularly in diagnostic testing capacity. In response, we believe that capital expenditure on diagnostics and testing will rise meaningfully in the years ahead.
We also expect greater government support for vaccine development and additional pressure to improve vaccination rates. We believe that vaccination rates and pricing power will broadly move higher in the years ahead. Rather than investing in the biopharmaceutical vaccine makers themselves, our preferred exposure to this area is through life sciences companies that provide tools for vaccine development and manufacture, as well as the makers of vaccine packaging and providers of transport.
Telehealth enabled patients to get necessary treatment during the pandemic, while greater internet speed and software have enhanced the remote consultation experience. Patients have saved traveling and waiting time, as well as costs. More and more insurers have agreed to reimburse policyholders for virtual medical visits. We expect continued strong growth in the years ahead.

91UNSTOPPABLE TRENDS OUTLOOK 2021CITI PRIVATE BANK
Remote monitoring and devices
During 2020’s lockdowns, the need for and use of remote monitoring via innovative devices has grown. Wearable technologies – such as smart watches – are helping to give early warnings of health and fitness issues, as well as monitoring existing conditions and events. These include cardiovascular disorders, diabetes, epileptic fits, and falls suffered by the elderly at home.
For elderly users and for society as a whole, there are numerous potential benefits of wearable technologies. They can help users, home care helpers and healthcare providers monitor for the correct and timely ingestion of medicines, and for the early identification of silent, but potentially fatal emergencies health, including arrhythmias and pre-stroke brain activity. Wearable technologies can thus help elderly users remain independent, easing the pressure on often-stretched social care systems and families. We have long regarded the wearables market as having significant growth potential and the pandemic has only reinforced our view.
There may also be significant potential in non-wearable technology. Significant progress has occurred in the development of products that improve patient outcomes as well as diagnosis rates. Some of the products in development – including a small artificial intelligence enabled “pill” – have the potential to detect certain disorders and cancers. The deployment of less invasive diagnostic tools will increase mass screening and save many lives.
Increasing longevity
The investment opportunities arising from the Unstoppable trend of Increasing longevity extend well beyond the large-cap pharmaceutical companies. They include many nimble innovators that also relate to our other unstoppable trends, such as Digitization and The rise of Asia. Given the specialized nature of the opportunity set, actively managed strategies may provide a targeted way to build exposure, rather than broad-based passive exposure. Over a full economic cycle, we believe that such exposure could help improve your core portfolio’s risk-adjusted returns, enhancing its overall resilience.
1 1 1 OUTLOOK 2021CITI PRIVATE BANK
Glossary
ASSET CLASS DEFINITIONS:
Cash is represented by US 3-month Government Bond TR, measuring the US dollar-denominated active 3-Month, fixed-rate, nominal debt issues by the US Treasury.
Commodities asset class contains the index composites — GSCI Precious Metals Index, GSCI Energy Index, GSCI Industrial Metals Index, and GSCI Agricultural Index — measuring investment performance in different markets, namely precious metals (e.g., gold, silver), energy commodity (e.g., oil, coal), industrial metals (e.g., copper, iron ore), and agricultural commodity (i.e., soy, coffee) respectively. Reuters/ Jeffries CRB Spot Price Index, the TR/CC CRB Excess Return Index, an arithmetic average of commodity futures prices with monthly rebalancing, is used for supplemental historical data.
Emerging Markets (EM) Hard Currency Fixed Income is represented by the FTSE Emerging Market Sovereign Bond Index (ESBI), covering hard currency emerging market sovereign debt. Global Developed Market Corporate Fixed Income is composed of Bloomberg Barclays indices capturing investment debt from seven different local currency markets. The composite includes investment grade rated corporate bonds from the developed-market issuers.
Global Developed Market Equity is composed of MSCI indices capturing large-, mid- and small-cap representation across 23 individual developed-market countries, as weighted by the market capitalization of these countries. The composite covers approximately 95% of the free float-adjusted market capitalization in each country.
Global Developed Investment Grade Fixed Income is composed of Barclays indices capturing investment-grade debt from twenty different local currency markets. The composite includes fixed-rate treasury, government-related, and investment grade rated corporate and securitized bonds from the developed-market issuers. Local market indices for US, UK and Japan are used for supplemental historical data.
Global Emerging Market Fixed Income is composed of Barclays indices measuring performance of fixed-rate local currency emerging markets government debt for 19 different markets across Latin America, EMEA and Asia regions. iBoxx ABF China Govt. Bond, the Markit iBoxx ABF Index comprising local currency debt from China, is used for supplemental historical data.
Global High Yield Fixed Income is composed of Barclays indices measuring the non-investment grade, fixed-rate corporate bonds denominated in US dollars, British pounds and Euros. Securities are classified as high yield if the middle rating of Moody’s, Fitch, and S&P is Ba1/BB+/BB+ or below, excluding emerging market debt. Ibbotson High Yield Index, a broad high yield index including bonds across the maturity spectrum, within the BB-B rated credit quality spectrum, included in the below-investment-grade universe, is used for supplemental historical data.
Hedge Funds is composed of investment managers employing different investment styles as characterized by different sub categories – HFRI Equity Long/Short: Positions both long and short in primarily equity and equity derivative securities; HFRI Credit: Positions in corporate fixed income securities; HFRI Event Driven: Positions in companies currently or prospectively involved in wide variety of corporate transactions; HFRI Relative Value: Positions based on a valuation discrepancy between multiple securities; HFRI Multi Strategy: Positions based on realization of a spread between related yield instruments; HFRI Macro: Positions based on movements in underlying economic variables and their impact on different markets; Barclays Trader CTA Index: The composite performance

1 12 OUTLOOK 2021CITI PRIVATE BANK
of established programs (Commodity Trading Advisors) with more than four years of performance history.
High Yield Bank Loans are debt financing obligations issued by a bank or other financial institution to a company or individual that holds legal claim to the borrower’s assets in the event of a corporate bankruptcy. These loans are usually secured by a company’s assets, and often pay a high coupon due to a company’s poor (non-investment grade) credit worthiness.
Private Equity characteristics are driven by those for Developed Market Small Cap Equities, adjusted for illiquidity, sector concentration, and greater leverage.
INDEX DEFINITIONS:
The Bloomberg Barclays Global Aggregate Bond Index is a flagship measure of global investment grade debt from twenty-four local currency markets. This multi-currency benchmark includes treasury, government-related, corporate and securitized fixed-rate bonds from both developed and emerging markets issuers.
Bloomberg Barclays US Corporate Bond Index measures the investment grade, fixed-rate, taxable corporate bond market. It includes US dollar denominated securities publicly issued by US and non-US industrial, utility and financial issuers.
Bloomberg Barclays US Treasury Index measures US dollar-denominated, fixed-rate, nominal debt issued by the US Treasury.
Bloomberg-JP Morgan Asia currency index is a spot index of the most actively traded currency pairs in Asia’s emerging markets valued against the US dollar.
FTSE All-World Index is a stock market index representing global equity performance that covers over 3,100 companies in 47 countries starting in 1986.
The FTSE Nareit Mortgage REITs Index is a free-float adjusted, market capitalization-weighted index of US Mortgage REITs. Mortgage REITs include all tax-qualified REITs with more than 50 percent of total assets invested in mortgage loans or mortgage-backed securities secured by interests in real property.
MSCI AC Asia ex-Japan Index captures large and mid-cap representation across 2 of 3 Developed Markets (DM) countries* (excluding Japan) and 9 Emerging Markets (EM) countries* in Asia. With 1,187 constituents, the index covers approximately 85% of the free float-adjusted market capitalization in each country.
MSCI China Index captures large and mid-cap representation across China A shares, H shares, B shares, Red chips, P chips and foreign listings (e.g. ADRs). With 704 constituents, the index covers about 85% of this China equity universe.
MSCI Emerging Markets Index captures large- and mid- cap representation across twenty-four Emerging Markets (EM) countries. With 837 constituents, the index covers approximately 85% of the free float-adjusted market capitalization in each country.
1 13 OUTLOOK 2021CITI PRIVATE BANK
MSCI Emerging Markets (EM) Latin America Index captures large and mid-cap representation across five Emerging Markets (EM) countries in Latin America. With 113 constituents, the index covers approximately 85% of the free float-adjusted market capitalization in each country.
The MSCI Global Alternative Energy Index includes developed and emerging market large-, mid- and small-cap companies that derive 50% or more of their revenues from products and services in Alternative energy.
The MSCI AC World Automobiles Index is composed of large- and mid-cap automobile stocks across emerging and developed countries.
The MSCI World Information Technology Index tracks the large- and mid-cap IT segments across 23 developed markets countries.
The MSCI World Index covers large- and mid-cap equities across 23 Developed Markets countries. With 1,603 constituents, the index covers approximately 85% of the free float-adjusted market capitalization in each country.
Nasdaq 100 is a large-cap growth index consisting of 100 of the largest US and international non-financial companies listed on the Nasdaq Stock Market based on market capitalization.
The Russell 2000 Index measures the performance of the small-cap segment of the US equity universe. The Russell 2000 Index is a subset of the Russell 3000 Index representing some 10% of the total market capitalization of that index.
The S&P 500 Index is a capitalization-weighted index that includes a representative sample of 500 leading companies in leading industries of the US economy. Although the S&P 500 focuses on the large-cap segment of the market, with over 80% coverage of US equities, it is also an ideal proxy for the total market.
The S&P Global Dividend Aristocrats is designed to measure the performance of the highest dividend yielding companies within the S&P Global Broad Market Index (BMI) that have followed a policy of increasing or stable dividends for at least ten consecutive years.
The VIX or the Chicago Board Options Exchange (CBOE) Volatility Index, is a real-time index representing the market’s expectation of 30-day forward-looking volatility, derived from the price inputs of the S&P 500 index options.
OTHER TERMINOLOGY:
Adaptive Valuations Strategies is Citi Private Bank’s own strategic asset allocation methodology. It determines the suitable long-term mix of assets for each client’s investment portfolio.
Correlation is a statistical measure of how two assets or asset classes move in relation to one another. Correlation is measured on a scale of 1 to -1. A correlation of 1 implies perfect positive correlation, meaning that two assets or asset classes move in the same direction all of the time. A correlation of -1 implies perfect negative correlation, such that two assets or asset classes move in the opposite direction to each other all the time. A correlation of 0 implies zero correlation, such that there is no relationship between the movements in the two over time.

1 14 OUTLOOK 2021CITI PRIVATE BANK
Disclosures
In any instance where distribution of this communication (“Communication”) is subject to the rules of the US Commodity Futures Trading Commission (“CFTC”), this communication constitutes an invitation to consider entering into a derivatives transaction under US CFTC Regulations §§ 1.71 and 23.605, where applicable, but is not a binding offer to buy/sell any financial instrument.
This Communication is prepared by Citi Private Bank (“CPB”), a business of Citigroup, Inc. (“Citigroup”), which provides its clients access to a broad array of products and services available through Citigroup, its bank and non-bank affiliates worldwide (collectively, “Citi”). Not all products and services are provided by all affiliates, or are available at all locations.
CPB personnel are not research analysts, and the information in this Communication is not intended to constitute “research”, as that term is defined by applicable regulations. Unless otherwise indicated, any reference to a research report or research recommendation is not intended to represent the whole report and is not in itself considered a recommendation or research report.
This Communication is provided for information and discussion purposes only, at the recipient’s request. The recipient should notify CPB immediately should it at any time wish to cease being provided with such information. Unless otherwise indicated, (i) it does not constitute an offer or recommendation to purchase or sell any security, financial instrument or other product or service, or to attract any funding or deposits, and (ii) it does not constitute a solicitation if it is not subject to the rules of the CFTC (but see discussion above regarding communication subject to CFTC rules) and (iii) it is not intended as an official confirmation of any transaction.
Unless otherwise expressly indicated, this Communication does not take into account the investment objectives, risk
profile or financial situation of any particular person and as such, investments mentioned in this document may not be suitable for all investors. Citi is not acting as an investment or other advisor, fiduciary or agent. The information contained herein is not intended to be an exhaustive discussion of the strategies or concepts mentioned herein or tax or legal advice. Recipients of this Communication should obtain advice based on their own individual circumstances from their own tax, financial, legal and other advisors about the risks and merits of any transaction before making an investment decision, and only make such decisions on the basis of their own objectives, experience, risk profile and resources.
The information contained in this Communication is based on generally available information and, although obtained from sources believed by Citi to be reliable, its accuracy and completeness cannot be assured, and such information may be incomplete or condensed. Any assumptions or information contained in this Communication constitute a judgment only as of the date of this document or on any specified dates and is subject to change without notice. Insofar as this Communication may contain historical and forward looking information, past performance is neither a guarantee nor an indication of future results, and future results may not meet expectations due to a variety of economic, market and other factors. Further, any projections of potential risk or return are illustrative and should not be taken as limitations of the maximum possible loss or gain. Any prices, values or estimates provided in this Communication (other than those that are identified as being historical) are indicative only, may change without notice and do not represent firm quotes as to either price or size, nor reflect the value Citi may assign a security in its inventory. Forward looking information does not indicate a level at which Citi is prepared to do a trade and may not account for all relevant assumptions and future conditions. Actual conditions may vary substantially from estimates which could have a negative impact on the value of an instrument.
Views, opinions and estimates expressed herein may differ from the opinions expressed by other Citi businesses or affiliates, and are not intended to be a forecast of future events, a guarantee of future results, or investment advice,
and are subject to change without notice based on market and other conditions. Citi is under no duty to update this document and accepts no liability for any loss (whether direct, indirect or consequential) that may arise from any use of the information contained in or derived from this Communication.
Investments in financial instruments or other products carry significant risk, including the possible loss of the principal amount invested. Financial instruments or other products denominated in a foreign currency are subject to exchange rate fluctuations, which may have an adverse effect on the price or value of an investment in such products. This Communication does not purport to identify all risks or material considerations which may be associated with entering into any transaction.
Structured products can be highly illiquid and are not suitable for all investors. Additional information can be found in the disclosure documents of the issuer for each respective structured product described herein. Investing in structured products is intended only for experienced and sophisticated investors who are willing and able to bear the high economic risks of such an investment. Investors should carefully review and consider potential risks before investing.
OTC derivative transactions involve risk and are not suitable for all investors. Investment products are not insured, carry no bank or government guarantee and may lose value. Before entering into these transactions, you should: (i) ensure that you have obtained and considered relevant information from independent reliable sources concerning the financial, economic and political conditions of the relevant markets; (ii) determine that you have the necessary knowledge, sophistication and experience in financial, business and investment matters to be able to evaluate the risks involved, and that you are financially able to bear such risks; and (iii) determine, having considered the foregoing points, that capital markets transactions are suitable and appropriate for your financial, tax, business and investment objectives.
This material may mention options regulated by the US Securities and Exchange Commission. Before buying or selling options you should obtain and review the current version of the Options Clearing Corporation booklet, Characteristics and

1 15 OUTLOOK 2021CITI PRIVATE BANK
Risks of Standardized Options. A copy of the booklet can be obtained upon request from Citigroup Global Markets Inc., 390 Greenwich Street, 3rd Floor, New York, NY 10013 or by clicking the following links,
theocc.com/components/docs/riskstoc.pdf and theocc.com/components/docs/about/publications/november_2012_supplement.pdf and theocc.com/components/docs/about/publications/october_2018_supplement.pdf
If you buy options, the maximum loss is the premium. If you sell put options, the risk is the entire notional below the strike. If you sell call options, the risk is unlimited. The actual profit or loss from any trade will depend on the price at which the trades are executed. The prices used herein are historical and may not be available when you order is entered. Commissions and other transaction costs are not considered in these examples. Option trades in general and these trades in particular may not be appropriate for every investor. Unless noted otherwise, the source of all graphs and tables in this report is Citi. Because of the importance of tax considerations to all option transactions, the investor considering options should consult with his/her tax advisor as to how their tax situation is affected by the outcome of contemplated options transactions.
None of the financial instruments or other products mentioned in this Communication (unless expressly stated otherwise) is (i) insured by the Federal Deposit Insurance Corporation or any other governmental authority, or (ii) deposits or other obligations of, or guaranteed by, Citi or any other insured depository institution.
Citi often acts as an issuer of financial instruments and other products, acts as a market maker and trades as principal in many different financial instruments and other products, and can be expected to perform or seek to perform investment banking and other services for the issuer of such financial instruments or other products. The author of this Communication may have discussed the information contained therein with others within or outside Citi, and the author and/or such other Citi personnel may have already acted on the basis of this
information (including by trading for Citi’s proprietary accounts or communicating the information contained herein to other customers of Citi). Citi, Citi’s personnel (including those with whom the author may have consulted in the preparation of this communication), and other customers of Citi may be long or short the financial instruments or other products referred to in this Communication, may have acquired such positions at prices and market conditions that are no longer available, and may have interests different from or adverse to your interests.
IRS Circular 230 Disclosure: Citi and its employees are not in the business of providing, and do not provide, tax or legal advice to any taxpayer outside Citi. Any statement in this Communication regarding tax matters is not intended or written to be used, and cannot be used or relied upon, by any taxpayer for the purpose of avoiding tax penalties. Any such taxpayer should seek advice based on the taxpayer’s particular circumstances from an independent tax advisor.
Neither Citi nor any of its affiliates can accept responsibility for the tax treatment of any investment product, whether or not the investment is purchased by a trust or company administered by an affiliate of Citi. Citi assumes that, before making any commitment to invest, the investor and (where applicable, its beneficial owners) have taken whatever tax, legal or other advice the investor/beneficial owners consider necessary and have arranged to account for any tax lawfully due on the income or gains arising from any investment product provided by Citi.
This Communication is for the sole and exclusive use of the intended recipients, and may contain information proprietary to Citi which may not be reproduced or circulated in whole or in part without Citi’s prior consent. The manner of circulation and distribution may be restricted by law or regulation in certain countries. Persons who come into possession of this document are required to inform themselves of, and to observe such restrictions. Citi accepts no liability whatsoever for the actions of third parties in this respect. Any unauthorized use, duplication, or disclosure of this document is prohibited by law
and may result in prosecution.
Other businesses within Citigroup Inc. and affiliates of Citigroup Inc. may give advice, make recommendations, and take action in the interest of their clients, or for their own accounts, that may differ from the views expressed in this document. All expressions of opinion are current as of the date of this document and are subject to change without notice. Citigroup Inc. is not obligated to provide updates or changes to the information contained in this document.
The expressions of opinion are not intended to be a forecast of future events or a guarantee of future results. Past performance is not a guarantee of future results. Real results may vary.
Although information in this document has been obtained from sources believed to be reliable, Citigroup Inc. and its affiliates do not guarantee its accuracy or completeness and accept no liability for any direct or consequential losses arising from its use. Throughout this publication where charts indicate that a third party (parties) is the source, please note that the attributed may refer to the raw data received from such parties. No part of this document may be copied, photocopied or duplicated in any form or by any means, or distributed to any person that is not an employee, officer, director, or authorized agent of the recipient without Citigroup Inc.’s prior written consent.
Citigroup Inc. may act as principal for its own account or as agent for another person in connection with transactions placed by Citigroup Inc. for its clients involving securities that are the subject of this document or future editions of the Quadrant.
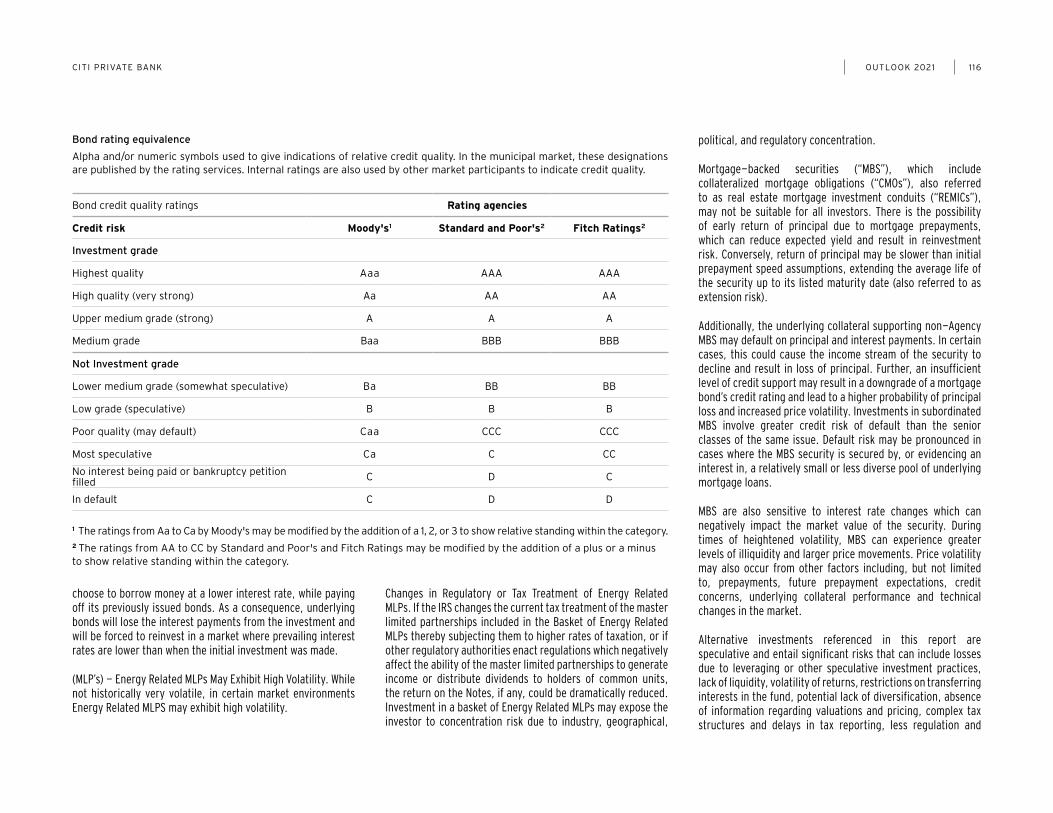
Bonds are affected by a number of risks, including fluctuations in interest rates, credit risk and prepayment risk. In general, as prevailing interest rates rise, fixed income securities prices will fall. Bonds face credit risk if a decline in an issuer’s credit rating, or creditworthiness, causes a bond’s price to decline. High yield bonds are subject to additional risks such as increased risk of default and greater volatility because of the lower credit quality of the issues. Finally, bonds can be subject to prepayment risk. When interest rates fall, an issuer may
1 16 OUTLOOK 2021CITI PRIVATE BANK
Bond rating equivalence
Alpha and/or numeric symbols used to give indications of relative credit quality. In the municipal market, these designations are published by the rating services. Internal ratings are also used by other market participants to indicate credit quality.
Bond credit quality ratings Rating agencies
Credit risk Moody's1 Standard and Poor's2 Fitch Ratings2
Investment grade
Highest quality Aaa AAA AAA
High quality (very strong) Aa AA AA
Upper medium grade (strong) A A A
Medium grade Baa BBB BBB
Not Investment grade
Lower medium grade (somewhat speculative) Ba BB BB
Low grade (speculative) B B B
Poor quality (may default) Caa CCC CCC
Most speculative Ca C CC
No interest being paid or bankruptcy petition filled C D C
In default C D D
1 The ratings from Aa to Ca by Moody's may be modified by the addition of a 1, 2, or 3 to show relative standing within the category.2 The ratings from AA to CC by Standard and Poor's and Fitch Ratings may be modified by the addition of a plus or a minus to show relative standing within the category.
choose to borrow money at a lower interest rate, while paying off its previously issued bonds. As a consequence, underlying bonds will lose the interest payments from the investment and will be forced to reinvest in a market where prevailing interest rates are lower than when the initial investment was made.
(MLP’s) - Energy Related MLPs May Exhibit High Volatility. While not historically very volatile, in certain market environments Energy Related MLPS may exhibit high volatility.
Changes in Regulatory or Tax Treatment of Energy Related MLPs. If the IRS changes the current tax treatment of the master limited partnerships included in the Basket of Energy Related MLPs thereby subjecting them to higher rates of taxation, or if other regulatory authorities enact regulations which negatively affect the ability of the master limited partnerships to generate income or distribute dividends to holders of common units, the return on the Notes, if any, could be dramatically reduced. Investment in a basket of Energy Related MLPs may expose the investor to concentration risk due to industry, geographical,
political, and regulatory concentration.
Mortgage-backed securities (“MBS”), which include collateralized mortgage obligations (“CMOs”), also referred to as real estate mortgage investment conduits (“REMICs”), may not be suitable for all investors. There is the possibility of early return of principal due to mortgage prepayments, which can reduce expected yield and result in reinvestment risk. Conversely, return of principal may be slower than initial prepayment speed assumptions, extending the average life of the security up to its listed maturity date (also referred to as extension risk).
Additionally, the underlying collateral supporting non-Agency MBS may default on principal and interest payments. In certain cases, this could cause the income stream of the security to decline and result in loss of principal. Further, an insufficient level of credit support may result in a downgrade of a mortgage bond’s credit rating and lead to a higher probability of principal loss and increased price volatility. Investments in subordinated MBS involve greater credit risk of default than the senior classes of the same issue. Default risk may be pronounced in cases where the MBS security is secured by, or evidencing an interest in, a relatively small or less diverse pool of underlying mortgage loans.
MBS are also sensitive to interest rate changes which can negatively impact the market value of the security. During times of heightened volatility, MBS can experience greater levels of illiquidity and larger price movements. Price volatility may also occur from other factors including, but not limited to, prepayments, future prepayment expectations, credit concerns, underlying collateral performance and technical changes in the market.
Alternative investments referenced in this report are speculative and entail significant risks that can include losses due to leveraging or other speculative investment practices, lack of liquidity, volatility of returns, restrictions on transferring interests in the fund, potential lack of diversification, absence of information regarding valuations and pricing, complex tax structures and delays in tax reporting, less regulation and
1 17 OUTLOOK 2021CITI PRIVATE BANK
higher fees than mutual funds and advisor risk.
Asset allocation does not assure a profit or protect against a loss in declining financial markets.
The indexes are unmanaged. An investor cannot invest directly in an index. They are shown for illustrative purposes only and do not represent the performance of any specific investment. Index returns do not include any expenses, fees or sales charges, which would lower performance.
Past performance is no guarantee of future results.
International investing entails greater risk, as well as greater potential rewards compared to US investing. These risks include political and economic uncertainties of foreign countries as well as the risk of currency fluctuations. These risks are magnified in countries with emerging markets, since these countries may have relatively unstable governments and less established markets and economics.
Investing in smaller companies involves greater risks not associated with investing in more established companies, such as business risk, significant stock price fluctuations and illiquidity.
Factors affecting commodities generally, index components composed of futures contracts on nickel or copper, which are industrial metals, may be subject to a number of additional factors specific to industrial metals that might cause price volatility. These include changes in the level of industrial activity using industrial metals (including the availability of substitutes such as manmade or synthetic substitutes); disruptions in the supply chain, from mining to storage to smelting or refining; adjustments to inventory; variations in production costs, including storage, labor and energy costs; costs associated with regulatory compliance, including environmental regulations; and changes in industrial, government and consumer demand, both in individual consuming nations and internationally. Index components concentrated in futures contracts on agricultural products, including grains, may be subject to a number of additional factors specific to agricultural products that might
cause price volatility. These include weather conditions, including floods, drought and freezing conditions; changes in government policies; planting decisions; and changes in demand for agricultural products, both with end users and as inputs into various industries.
The information contained herein is not intended to be an exhaustive discussion of the strategies or concepts mentioned herein or tax or legal advice. Readers interested in the strategies or concepts should consult their tax, legal, or other advisors, as appropriate.
Diversification does not guarantee a profit or protect against loss. Different asset classes present different risks.
Citi Private Bank is a business of Citigroup Inc. (“Citigroup”), which provides its clients access to a broad array of products and services available through bank and non-bank affiliates of Citigroup. Not all products and services are provided by all affiliates or are available at all locations. In the U.S., investment products and services are provided by Citigroup Global Markets Inc. (“CGMI”), member FINRA and SIPC, and Citi Private Advisory, LLC (“Citi Advisory”), member FINRA and SIPC. CGMI accounts are carried by Pershing LLC, member FINRA, NYSE, SIPC. Citi Advisory acts as distributor of certain alternative investment products to clients of Citi Private Bank. CGMI, Citi Advisory and Citibank, N.A. are affiliated companies under the common control of Citigroup.
Outside the U.S., investment products and services are provided by other Citigroup affiliates. Investment Management services (including portfolio management) are available through CGMI, Citi Advisory, Citibank, N.A. and other affiliated advisory businesses. These Citigroup affiliates, including Citi Advisory, will be compensated for the respective investment management, advisory, administrative, distribution and placement services they may provide.
Citibank, N.A., Hong Kong / Singapore organised under the laws of U.S.A. with limited liability. This communication is distributed in Hong Kong by Citi Private Bank operating through Citibank N.A., Hong Kong Branch, which is registered in Hong
Kong with the Securities and Futures Commission for Type 1 (dealing in securities), Type 4 (advising on securities), Type 6 (advising on corporate finance) and Type 9 (asset management) regulated activities with CE No: (AAP937) or in Singapore by Citi Private Bank operating through Citibank, N.A., Singapore Branch which is regulated by the Monetary Authority of Singapore. Any questions in connection with the contents in this communication should be directed to registered or licensed representatives of the relevant aforementioned entity. The contents of this communication have not been reviewed by any regulatory authority in Hong Kong or any regulatory authority in Singapore. This communication contains confidential and proprietary information and is intended only for recipient in accordance with accredited investors requirements in Singapore (as defined under the Securities and Futures Act (Chapter 289 of Singapore) (the “Act” )) and professional investors requirements in Hong Kong(as defined under the Hong Kong Securities and Futures Ordinance and its subsidiary legislation). For regulated asset management services, any mandate will be entered into only with Citibank, N.A., Hong Kong Branch and/or Citibank, N.A. Singapore Branch, as applicable. Citibank, N.A., Hong Kong Branch or Citibank, N.A., Singapore Branch may sub-delegate all or part of its mandate to another Citigroup affiliate or other branch of Citibank, N.A. Any references to named portfolio managers are for your information only, and this communication shall not be construed to be an offer to enter into any portfolio management mandate with any other Citigroup affiliate or other branch of Citibank, N.A. and, at no time will any other Citigroup affiliate or other branch of Citibank, N.A. or any other Citigroup affiliate enter into a mandate relating to the above portfolio with you. To the extent this communication is provided to clients who are booked and/or managed in Hong Kong: No other statement(s) in this communication shall operate to remove, exclude or restrict any of your rights or obligations of Citibank under applicable laws and regulations. Citibank, N.A., Hong Kong Branch does not intend to rely on any provisions herein which are inconsistent with its obligations under the Code of Conduct for Persons Licensed by or Registered with the Securities and Futures Commission, or which mis-describes the actual services to be provided to you.

1 18 OUTLOOK 2021CITI PRIVATE BANK
Citibank, N.A. is incorporated in the United States of America and its principal regulators are the US Office of the Comptroller of Currency and Federal Reserve under US laws, which differ from Australian laws. Citibank, N.A. does not hold an Australian Financial Services Licence under the Corporations Act 2001 as it enjoys the benefit of an exemption under ASIC Class Order CO 03/1101 (remade as ASIC Corporations (Repeal and Transitional) Instrument 2016/396 and extended by ASIC Corporations (Amendment) Instrument 2020/200).
In the United Kingdom, Citibank N.A., London Branch (registered branch number BR001018), Citigroup Centre, Canada Square, Canary Wharf, London, E14 5LB, is authorised and regulated by the Office of the Comptroller of the Currency (USA) and authorised by the Prudential Regulation Authority. Subject to regulation by the Financial Conduct Authority and limited regulation by the Prudential Regulation Authority. Details about the extent of our regulation by the Prudential Regulation Authority are available from us on request. The contact number for Citibank N.A., London Branch is +44 (0)20 7508 8000.
Citibank Europe plc is registered in Ireland with company registration number 132781. It is regulated by the Central Bank of Ireland under the reference number C26553 and supervised by the European Central Bank. Its registered office is at 1 North Wall Quay, Dublin 1, Ireland. Ultimately owned by Citigroup Inc., New York, USA. Citibank Europe plc, UK Branch is registered as a branch in the register of companies for England and Wales with registered branch number BR017844. Its registered address is Citigroup Centre, Canada Square, Canary Wharf, London E14 5LB. VAT No.: GB 429 6256 29. It is authorised by the Central Bank of Ireland and by the Prudential Regulation Authority. It is subject to supervision by the Central Bank of Ireland, and subject to limited regulation by the Financial Conduct Authority and the Prudential Regulation Authority. Details about the extent of our authorisation and regulation by the Prudential Regulation Authority, and regulation by the Financial Conduct Authority are available from us on request.
From 1 Jan 2021:Citibank Europe plc (UK Branch), is a branch of Citibank Europe plc, which is authorised by the European Central Bank and regulated by the Central Bank of Ireland and
the European Central Bank (reference number is C26553).
Citibank Europe plc (UK Branch) is also authorised by the Prudential Regulation Authority and with deemed variation of permission. Citibank Europe plc (UK Branch) is subject to regulation by the Financial Conduct Authority and limited regulation by the Prudential Regulation Authority. Details of the temporary permissions regime, which allows EEA�based firms to operate in the UK for a limited period while seeking full authorisation, are available on the FCA’s website.
Citibank Europe plc (UK Branch) is registered as a branch in the register of companies for England and Wales with registered branch number BR017844. Its registered address is Citigroup Centre, Canada Square, Canary Wharf, London E14 5LB. VAT No.: GB 429 6256 29.
Citibank Europe plc is registered in Ireland with number 132781, with its registered office at 1 North Wall Quay, Dublin 1. Citibank Europe plc is regulated by the Central Bank of Ireland. Ultimately owned by Citigroup Inc., New York, USA.
Citibank Europe plc, Luxembourg Branch is a branch of Citibank Europe plc with trade and companies register number B 200204. It is authorised in Luxembourg and supervised by the Commission de Surveillance du Secteur Financier. It appears on the Commission de Surveillance du Secteur Financier register with company number B00000395. Its business office is at 31, Z.A. Bourmicht, 8070 Bertrange, Grand Duchy of Luxembourg. Citibank Europe plc is registered in Ireland with company registration number 132781. It is regulated by the Central Bank of Ireland under the reference number C26553 and supervised by the European Central Bank. Its registered office is at 1 North Wall Quay, Dublin 1, Ireland.
In Jersey, this document is communicated by Citibank N.A., Jersey Branch which has its registered address at PO Box 104, 38 Esplanade, St Helier, Jersey JE4 8QB. Citibank N.A., Jersey Branch is regulated by the Jersey Financial Services Commission. Citibank N.A. Jersey Branch is a participant in the Jersey Bank Depositors Compensation Scheme. The Scheme offers protection for eligible deposits of up to £50,000.
The maximum total amount of compensation is capped at £100,000,000 in any 5 year period. Full details of the Scheme and banking groups covered are available on the States of Jersey website www.gov.je/dcs, or on request.
In Canada, Citi Private Bank is a division of Citibank Canada, a Schedule II Canadian chartered bank. References herein to Citi Private Bank and its activities in Canada relate solely to Citibank Canada and do not refer to any affiliates or subsidiaries of Citibank Canada operating in Canada. Certain investment products are made available through Citibank Canada Investment Funds Limited (“CCIFL”), a wholly owned subsidiary of Citibank Canada. Investment Products are subject to investment risk, including possible loss of principal amount invested. Investment Products are not insured by the CDIC, FDIC or depository insurance regime of any jurisdiction and are not guaranteed by Citigroup or any affiliate thereof.
This document is for information purposes only and does not constitute an offer to sell or a solicitation of an offer to buy any securities to any person in any jurisdiction. The information set out herein may be subject to updating, completion, revision, verification and amendment and such information may change materially.
Citigroup, its affiliates and any of the officers, directors, employees, representatives or agents shall not be held liable for any direct, indirect, incidental, special, or consequential damages, including loss of profits, arising out of the use of information contained herein, including through errors whether caused by negligence or otherwise.
CCIFL is not currently a member, and does not intend to become a member of the Mutual Fund Dealers Association of Canada (“MFDA”); consequently, clients of CCIFL will not have available to them investor protection benefits that would otherwise derive from membership of CCIFL in the MFDA, including coverage under any investor protection plan for clients of members of the MFDA.
© 2020 Citigroup Inc. Citi, Citi and Arc Design and other marks used herein are service marks of Citigroup Inc. or its affiliates, used and registered throughout the world.