4. Logistics Network in SADC and Namibia4. Logistics Network in SADC and Namibia 4-5 Photo:...
73
4. Logistics Network in SADC and Namibia 4-1 4. Logistics Network in SADC and Namibia 4.1 Regional cargo flows in SADC 4.1.1 Logistics network in SADC Figure 4.1 shows an overall picture of the current logistics network in SADC, including ports, airports, railways and corridors (trunk roads). Business people look at the picture when they need to provide logistics services in SADC and consider which route fits their needs in terms of cost, time, security, and additional services and functions. Source: Tripartite Corridors eGIS "SADC Transport Corridors - Roads, Ports and Border Posts" Figure 4.1: Current Network of Ports, Airports, Railways and Roads in SADC " Z " Z " Z " Z " Z " Z " Z " Z " Z ! ( P ! ( P ! ( P ! ( P ! ( P ! ( P ! ( P ! ( P ! ( P ! ( P ! ( P ! ( P ! ( P ! ( P " ) " " ) " " ) " " ) " " ) " " ) " " ) " " ) " " ) " " ) " " ) " " ) " " ) " " ) " " ) " " ) " Maseru Maputo Kigali Lusaka Luanda Harare Mbabane Pretoria Gaborone Lilongwe Kinshasa Windhoek Bujumbura Brazzaville Dar es Salaam Angola South Africa Congo, DRC Namibia Zambia Tanzania Mozambique Botswana Zimbabwe Kenya Congo Malawi Gabon Lesotho Burundi Rwanda Swaziland Somalia Wete Maun Tete Uige Bisho Kanye Beira Mzuzu Koani Lindi Tanga Moshi Mongu Kabwe Ndola Mansa Mbeya Outjo Otavi Luena Pemba Gweru Durban Moyeni Songea Iringa Kibaha Mtwara Mkoani Arusha Kigoma Tabora Mwanza Serowe Kasane Kasama Namibe Huambo Onjiva Masuku Ngunza Caxito Matadi Lucapa Ghanzi Mouila Mutare Xai-Xai Lobatse Mochudi Singida Mombasa Bubanza Solwezi Chipata Karibib Cabinda Malange Saurimo Kahemba Kinkala Tsabong Gobabis Chimoio Pretoria Blantyre Morogoro Benguela Madingou Bandundu Rehoboth Luderitz Menongue Bulawayo Masvingo Hlatikulu Quelimane Shinyanga Karasburg Bethanien Maltahohe Cape Town Inhambane Tchibanga Sumbawanga Ndalatando Walvis Bay Mocambique East London Francistown Livingstone Otjiwarongo Richards Bay Mohales Hoek Johannesburg Mbanza Congo Keetmanshoop Port Elizabeth Pietersburg (Polokwane) " ) " National Capital ! ( P Port " Z Airport Railway Primary road Local road Corridors Beira Central Dar es Salaam Lobito-Beguela Maputo Nacala North-South Northern Trans-Caprivi Trans-Cunene Trans-Kalahari Trans-Oranje International boundary Ê 0 500 1,000 250 km
Transcript of 4. Logistics Network in SADC and Namibia4. Logistics Network in SADC and Namibia 4-5 Photo:...
4. Logistics Network in SADC and Namibia
4-1
4. Logistics Network in SADC and Namibia
4.1 Regional cargo flows in SADC
4.1.1 Logistics network in SADC
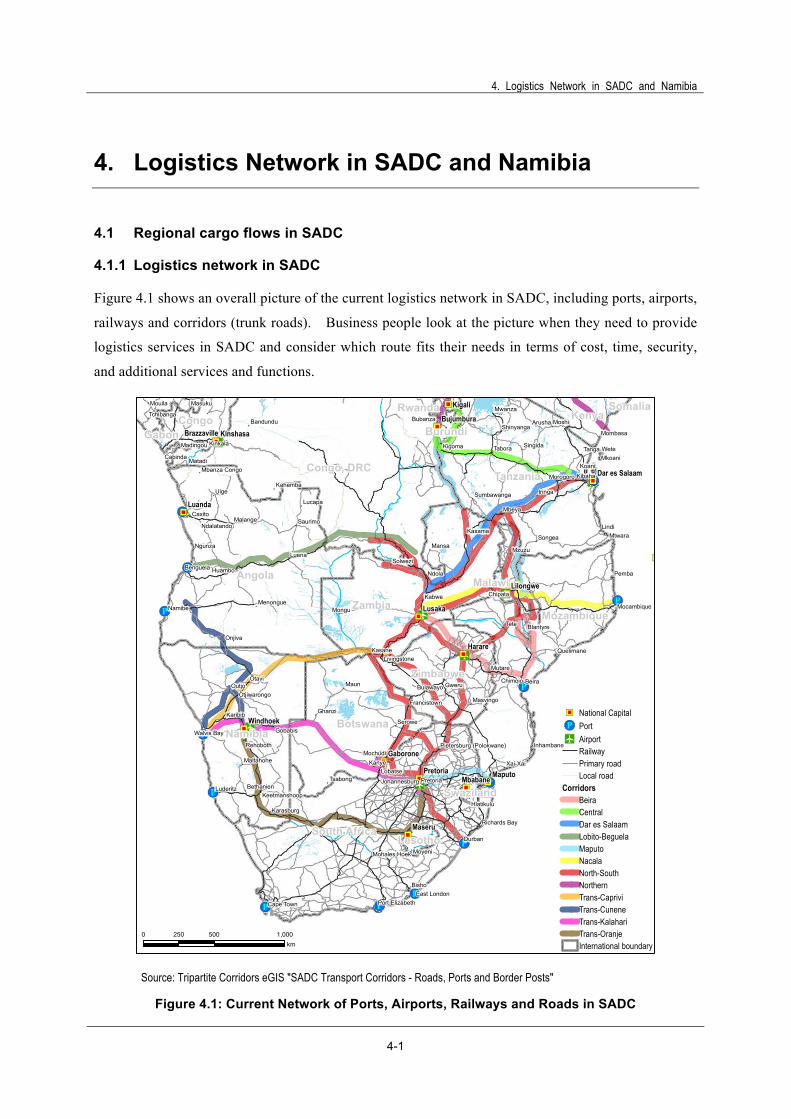
Figure 4.1 shows an overall picture of the current logistics network in SADC, including ports, airports,
railways and corridors (trunk roads). Business people look at the picture when they need to provide
logistics services in SADC and consider which route fits their needs in terms of cost, time, security,
and additional services and functions.
Source: Tripartite Corridors eGIS "SADC Transport Corridors - Roads, Ports and Border Posts"
Figure 4.1: Current Network of Ports, Airports, Railways and Roads in SADC
"Z
"Z
"Z
"Z
"Z
"Z
"Z
"Z "Z
!(P
!(P
!(P
!(P
!(P
!(P!(P!(P!(P
!(P
!(P
!(P
!(P
!(P
")" ")"
")"
")"
")"
")"")"
")"
")"
")"
")"
")"
")"
")"
")"")"
")"
")"
")"
Maseru
Maputo
Kigali
Lusaka
Luanda
Harare
Mbabane
Pretoria
Gaborone
Lilongwe
Kinshasa
Windhoek
Bujumbura
Brazzaville
Dar es Salaam
Angola
South Africa
Congo, DRC
Namibia
Zambia
Tanzania
Mozambique
Botswana
Zimbabwe
KenyaCongo
Malawi
Gabon
Lesotho
Burundi
Rwanda
Swaziland
Somalia
Wete
Maun
Tete
Uige
Bisho
Kanye
Beira
Mzuzu
Koani
Lindi
Tanga
Moshi
Mongu
Kabwe
Ndola
Mansa
Mbeya
OutjoOtavi
Luena
Pemba
Gweru
Durban
Moyeni
Songea
Iringa
Kibaha
Mtwara
Mkoani
Arusha
Kigoma Tabora
Mwanza
Serowe
Kasane
Kasama
Namibe
Huambo
Onjiva
Masuku
Ngunza
Caxito
Matadi
Lucapa
Ghanzi
Mouila
Mutare
Xai-XaiLobatse
Mochudi
Singida
Mombasa
Bubanza
Solwezi
Chipata
Karibib
Cabinda
Malange Saurimo
Kahemba
Kinkala
Tsabong
Gobabis
Chimoio
Pretoria
Blantyre
Morogoro
Benguela
Madingou
Bandundu
Rehoboth
Luderitz
Menongue
Bulawayo
Masvingo
Hlatikulu
Quelimane
Shinyanga
Karasburg
Bethanien
Maltahohe
Cape Town
Inhambane
Tchibanga
Sumbawanga
Ndalatando
Walvis Bay
Mocambique
East London
Francistown
Livingstone
Otjiwarongo
Richards Bay
Mohales Hoek
Johannesburg
Mbanza Congo
Keetmanshoop
Port Elizabeth
Pietersburg (Polokwane)
")" National Capital
!(P Port
"Z Airport
Railway
Primary road
Local road
Corridors
Beira
Central
Dar es Salaam
Lobito-Beguela
Maputo
Nacala
North-South
Northern
Trans-Caprivi
Trans-Cunene
Trans-Kalahari
Trans-Oranje
International boundary
�Ê0 500 1,000250
km
Master Plan for Development of an International Logistics Hub for SADC Countries in the Republic of Namibia Final Report Appendix
4-2
There are different “natural” positions among major gateway ports mainly according to their locations
and size of economies of their immediate hinterland.
A current main gateway to SADC is Durban Port that has the largest hinterland in South Africa, and
the port is connected with the inland countries via the North-South Corridor. Walvis Bay Port is the
gateway to the Atlantic Ocean and is connected with the inland countries via the Trans–Caprivi,
Trans–Kalahari Corridors and so on. The gateway to the Indian and Pacific Oceans is Dar es Salaam
Port that is connected with the inland countries via the Dar es Salaam Corridor.
4.1.2 Cargo volume of SADC countries
4.1.2.1 Total cargo volume
The cargo volume of SADC which is the sum of import and export1 is estimated 420.5 million tons in
2010 (refer to Table 4.1). Among them, South Africa accounted for 59% (248.0 million tons), and
other countries with ports accounted for 32% (135.5 million tons), and inland countries represented
9% (37.0 million tons), respectively.
Table 4.1: Trade volume of SADC countries in 2010 Unit: million tons
Countries Export Import Total (export and import) Share in total (%)
Angola 95.0 10.0 105.0 25.0% Botswana* 2.0 5.0 7.0 1.7% DRC 3.0 4.0 7.0 1.7% Lesotho* 0.0 0.0 0.0 0.0% Malawi* 1.0 2.0 3.0 0.7% Mozambique 4.0 6.0 10.0 2.4% Namibia 3.0 5.5 8.5 2.0% South Africa 190.0 58.0 248.0 59.0% Swaziland* 1.5 1.5 3.0 0.7% Tanzania 3.0 9.0 12.0 2.9% Zambia* 4.0 4.0 8.0 1.9% Zimbabwe* 3.0 6.0 9.0 2.1% Total 309.5 111.0 420.5 100.0%
Countries with seaports excluding South Africa 105.0 34.5 135.5 32.2%
Countries without seaports 11.5 18.5 37.0 8.8% Note: * countries which don’t have seaports; Angola’s export includes crude oil (95 million ton). Source: Compiled by JICA Study Team based on the graph of "2012 Journal of Transport and Supply Chain Management" (pp
202-203)
4.1.2.2 Seaborne cargo
In SADC countries, a very large share of international trade with the world is transported by sea. The
total trade volume of SADC Countries by all modes was 420.5 millions tons in 2010. Of this, the
total volume of seaborne cargo amounts to 388.2 million tons in 2010 (refer to Table 4.2).
1 Island countries such as the Republic of Mauritius and the Republic of Seychelles are not included in this analysis.

4. Logistics Network in SADC and Namibia
4-3
Table 4.2: Estimated seaborne cargo volume by countries Unit: tons
Country 2010 2011 2012 2013 Volume Share Volume Share Volume Share Volume Share
Namibia 5,248,981 2% 5,530,767 2% 6,522,205 - 6,505,928 - South Africa 248,787,484 85% 264,469,818 85% 268,652,855 - - - Mozambique 14,078,500 5% 19,435,200 6% - - - - Tanzania 10,993,080 4% 12,084,000 4% 13,713,389 - - - Angola 14,071,985 5% 10,599,296 3% 11610484 - 11,823,704 - Total 293,180,030 100% 312,119,081 100% - - - - Angola’s Crude Oil 95,000,000 - - - - - - Grand Total 388,180,030 - - - - - - Note: Container cargo volume of South Africa was converted from TEU basis to weight basis by using a 13.5ton/TEU conversion factor.
The conversion factor is calculated from data from Durban Port (http://www.ports.co.za/durban-harbour.php). The volume of Angola’s crude oil was converted from barrels basis to weight basis by using a conversion factor of 1.928 million barrels/day into tons/year.
Source: Namport (Namibia); Summary of cargo handled at ports of South Africa January-December 2012, national port authority of South Africa expressed in TEU in January-December 2012 (Transnet, South Africa); Relatorio-e-Contas 2011 (CFM, Mozambique); Tanzania Port Authority Annual Statistical Report for 2012-13(TPA, Tanzania); Boletim estatistico anual 2013(CNC, Angola); EIA data (Angola’s crude oil)
4.1.2.3 Airborne cargo
The total air cargo volume handled in southern Africa was 0.5 million tons, and 52% of the total air
cargo was handled at OR Tambo Airport in 2009 (refer to Table 4.3). Therefore, forwarders’
warehouses are accumulated around OR Tambo Airport. Both air cargo and seaborne cargo from
Durban Port is collected, consolidated and transhipped to the inland countries in these warehouses.
Table 4.4 indicates major logistics companies which handle Air Cargo.
Table 4.3: Air transport freight in 2009 Unit: ton
Countries Air cargo volume (A) Share Major airport Air cargo volume (B) Share (B/A) Angola 53,339 11% Luanda 53,339 100% Botswana 0% Congo, Dem. Rep. 88,183 18% Kinshasa 67,544 77% Lesotho 0% Malawi 4,303 1% Lilongwe 4,303 100% Mozambique 10,462 2% Maputo 7,373 70% Namibia 7,315 2% Hosea Kutako 6,362 87% South Africa 266,989 55% OR Tambo 252,063 94% Swaziland 0% Tanzania 25,868 5% Julius Nyerere 18,844 73% Zambia 4,756 1% Lusaka 4,756 100% Zimbabwe 20,155 4% Harare 20,155 100% Total 481,370 100% Total 434,739 90% Source: World Airport Traffic Report, ACI, 2009
Table 4.4: Major logistics companies handling air cargo Name of companies
1 Air Menzies International SA (Pty) Ltd 2 DHL Global Forwarding SA 3 DHL International Pty Ltd 4 Kuehne & Nagel (Pty) Ltd. 5 Lonrho Logistics Pty Ltd 6 Morgan Air Cargo Pty Ltd 7 Safcor Freight (Pty) Ltd 8 Schenker South Africa (Pty) Ltd 9 Skyservices (Pty) Ltd
10 UTi South Africa (Pty) Ltd Source: Interviews with logistics companies

Master Plan for Development of an International Logistics Hub for SADC Countries in the Republic of Namibia Final Report Appendix
4-4
4.1.2.4 Total trade volume and cargo handling volume
The total trade volume of SADC countries amounts to 420.5 million tons of which more than 90 % of
international cargo is handled by the seaports. Therefore, intra-SADC trade can explain the
difference between the seaborne cargo volume and the total trade volume. The intra-SADC trade
volume was 31.2 million tons in 2010.
The trade volume of intra-SADC is also calculated from trade volume of inland countries (37 million
tons) minus transit trade volume. The transit trade volume from gateway ports to the inland countries
is examined and the trade volume of intra-SADC is estimated in section 4.1.3.
Source: JICA Study Team
Figure 4.2: Total trade volume and cargo handling volume in SADC countries
Interviewees of logistics companies mentioned that the cargo landed at Durban and OR Tambo Airport
are often shipped to the landlocked areas of SADC after custom clearance. Photographs in the next
page were taken at a warehouse near OR Tambo Airport. Mining equipment which had cleared the
customs process at City Deep in Johannesburg or OR Tambo Airport is transported to this warehouse
and sorted by countries or mining sites2.
This means that not all the cargo is transported to the inland countries as bonded cargo but also a
certain volume of cargos (maybe a large portion of cargo) is transported to the inland countries as
intra- SADC trade. Therefore, it is important to estimate volumes of transit cargo and intra-SADC
trade.
2 It means that the warehouse is not a bonded warehouse but a “normal” warehouse.
Seaports: 388.2 million tons�
Airports: 0.5 million tons�
Total of SADC trade volume: 420.5 million tons�
388.7 million tons�
Countries without seaports: 37.0 million tons (8.8%)�
Transit�
Transit�
Transit�
Intra SADC Trade�South Africa: 248.0 million tons (59.0%)�
Countries with seaports excluding South Africa: 135.5 million tons (32.2%)�
Cargo volume of transit cargo and intra-SADC trade: around 30 million tons�
4. Logistics Network in SADC and Namibia
4-5
Photo: Equipment for mining re-exported to inland countries
4.1.3 Cargo volume and cargo flow in the gateway ports
4.1.3.1 Total cargo volume
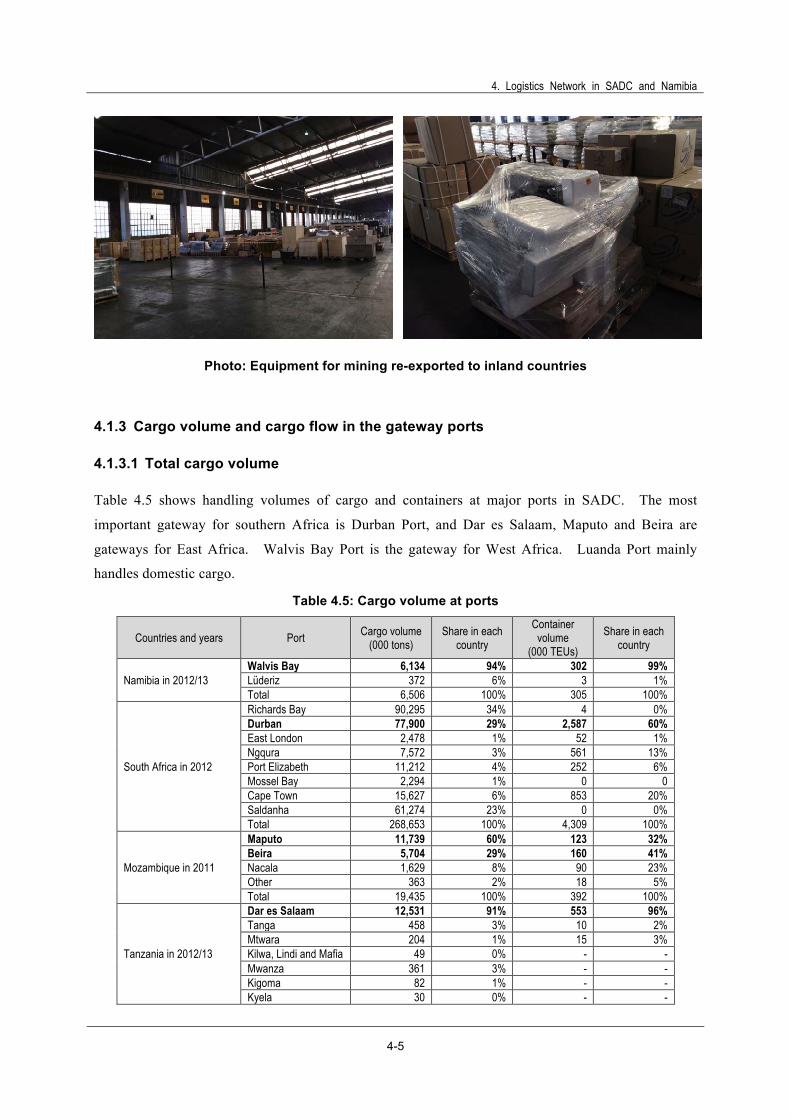
Table 4.5 shows handling volumes of cargo and containers at major ports in SADC. The most
important gateway for southern Africa is Durban Port, and Dar es Salaam, Maputo and Beira are
gateways for East Africa. Walvis Bay Port is the gateway for West Africa. Luanda Port mainly
handles domestic cargo.
Table 4.5: Cargo volume at ports
Countries and years Port Cargo volume (000 tons)
Share in each country
Container volume
(000 TEUs) Share in each
country
Namibia in 2012/13 Walvis Bay 6,134 94% 302 99% Lüderiz 372 6% 3 1% Total 6,506 100% 305 100%
South Africa in 2012
Richards Bay 90,295 34% 4 0% Durban 77,900 29% 2,587 60% East London 2,478 1% 52 1% Ngqura 7,572 3% 561 13% Port Elizabeth 11,212 4% 252 6% Mossel Bay 2,294 1% 0 0 Cape Town 15,627 6% 853 20% Saldanha 61,274 23% 0 0% Total 268,653 100% 4,309 100%
Mozambique in 2011
Maputo 11,739 60% 123 32% Beira 5,704 29% 160 41% Nacala 1,629 8% 90 23% Other 363 2% 18 5% Total 19,435 100% 392 100%
Tanzania in 2012/13
Dar es Salaam 12,531 91% 553 96% Tanga 458 3% 10 2% Mtwara 204 1% 15 3% Kilwa, Lindi and Mafia 49 0% - - Mwanza 361 3% - - Kigoma 82 1% - - Kyela 30 0% - -
Master Plan for Development of an International Logistics Hub for SADC Countries in the Republic of Namibia Final Report Appendix
4-6
Countries and years Port Cargo volume (000 tons)
Share in each country
Container volume
(000 TEUs)
Share in each country
Total 13,713 100% 578 100%
Angola in 2013
Luanda 8,715 74% 408 80% Lobito 1,803 15% 61 12% Namibe 736 6% 22 4% Other 570 5% 42 8% Total 11,824 100% 512 100%
Cargo volume by countries
Namibia 6,506 2% 305 5% RSA 268,653 84% 4,309 71% Mozambique 19,435 6% 392 6% Tanzania 13,713 4% 578 9% Angola 11,824 4% 512 8%
Grand Total 320,131 100% 6,096 100% Source: Namport (Namibia); Summary of cargo handled at port of South Africa January-December 2012, national port
authority of South Africa expressed in TEU in January-December 2012 (Transnet, South Africa); Relatorio-e-Contas 2011 (CFM, Mozambique); Tanzania Port Authority Annual Statistical Report for 2012-13(TPA, Tanzania); Boletim estatistico anual 2013(CNC, Angola)
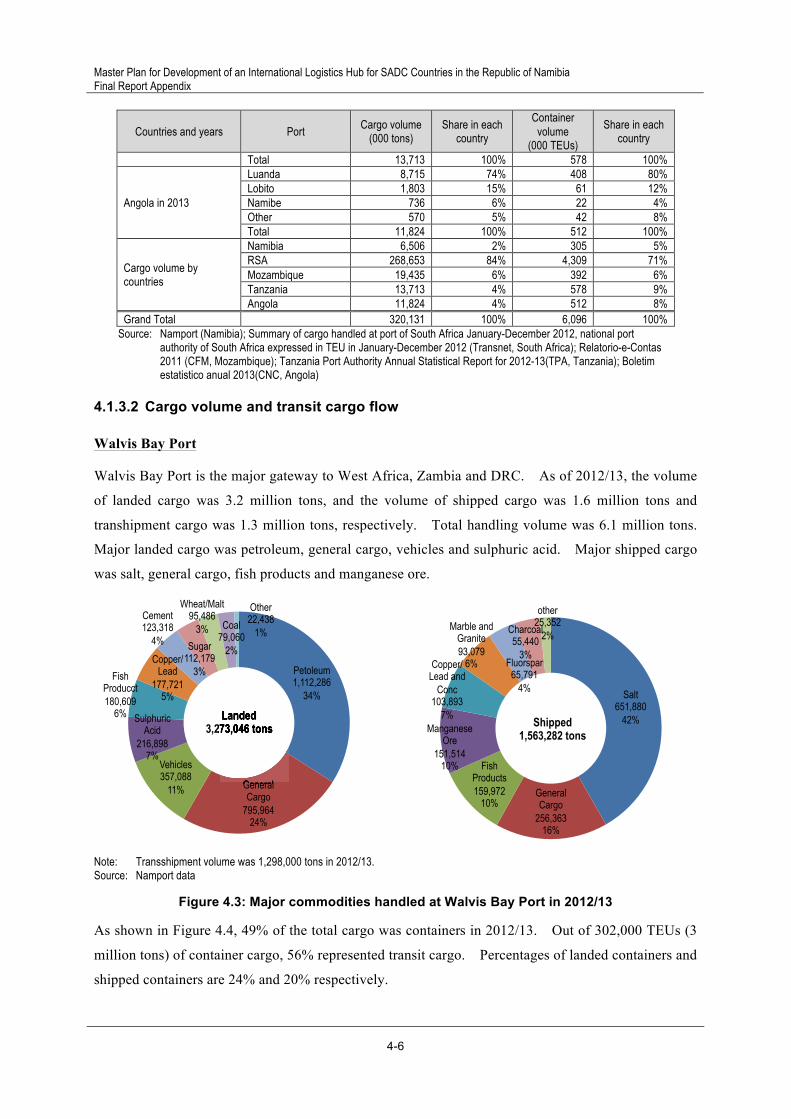
4.1.3.2 Cargo volume and transit cargo flow
Walvis Bay Port
Walvis Bay Port is the major gateway to West Africa, Zambia and DRC. As of 2012/13, the volume
of landed cargo was 3.2 million tons, and the volume of shipped cargo was 1.6 million tons and
transhipment cargo was 1.3 million tons, respectively. Total handling volume was 6.1 million tons.
Major landed cargo was petroleum, general cargo, vehicles and sulphuric acid. Major shipped cargo
was salt, general cargo, fish products and manganese ore.
Note: Transshipment volume was 1,298,000 tons in 2012/13. Source: Namport data
Figure 4.3: Major commodities handled at Walvis Bay Port in 2012/13
As shown in Figure 4.4, 49% of the total cargo was containers in 2012/13. Out of 302,000 TEUs (3
million tons) of container cargo, 56% represented transit cargo. Percentages of landed containers and
shipped containers are 24% and 20% respectively.
Petoleum 1,112,286
34%
General Cargo
795,964 24%
Vehicles 357,088
11%
Sulphuric Acid
216,898 7%
Fish Producct 180,609
6%
Copper/Lead
177,721 5%
Cement 123,318
4% Sugar 112,179
3%
Wheat/Malt 95,486
3% Coal 79,060
2%
Other 22,438
1%
Landed 3,273,046 tons�
General
Landed 3,273,046 tons
Salt 651,880
42%
General Cargo
256,363 16%
Fish Products 159,972
10%
Manganese Ore
151,514 10%
Copper/Lead and
Conc 103,893
7%
Marble and Granite 93,079
6% Fluorspar 65,791
4%
Charcoal 55,440
3%
other 25,352
2%
Shipped 1,563,282 tons�

4. Logistics Network in SADC and Namibia
4-7
Source: Namport
Figure 4.4: Breakdown of handling cargos at Walvis Bay Port
Table 4.6 shows the destination and origin of transit cargo. The total transit cargo volume was
around 720,000 tons in 2012/13, of which Angola’ share was 37% (280,000 tons), Zambia’s share was
29% (207,000 tons), Zimbabwe’s share was 18% (139,000 tons) and DRC’s share was 8% (57,000
tons), respectively.
Table 4.6: Destination and origin of transit cargo Unit: 000 tons
To destination From origin Total
Containers Break bulk Total Containers Break
bulk Total Containers Break bulk Total Share
(%) Angola 265.8 1.6 267.4 0.5 0 0.5 266.3 1.6 267.9 37% Botswana 3.8 28.1 31.8 0 0 0 3.8 28.1 31.8 4% DRC 49.7 3.3 53 3.5 0 3.5 53.2 3.3 56.5 8% Congo 1.1 0.4 1.4 0 0 0 1.1 0.4 1.5 0% Malawi 0 3.2 3.2 2.3 0 2.3 2.3 3.2 5.5 1% Mozambique 0 0.2 0.2 0 0 0 0 0.2 0.2 0% South Africa 1.3 0.9 2.3 6.4 1.6 8 7.7 2.5 10.3 1% Zambia 87.5 67.9 155.4 51.9 0 51.9 139.4 67.9 207.3 29% Zimbabwe 10.1 128.6 138.7 0 0 0 10.1 128.6 138.7 19% Total 419.3 234.2 653.4 64.6 1.7 66.3 483.9 235.8 719.8 100% Note: Number of total transit container (full and empty) is assumed to be two times of full container.
Conversion factor 13.4ton/TEU=(total container weight3012-transshipmennt container weight1255.6)/(number of total container 301.8-number of transhipment contair170.3)
Source: Transit data (number of full container), transhipment and total are based on Namport data.
Container 3,012,030
49%
Bulk and Breakbulk,
etc. 3,121,830
51%
Total Cargo 6,133,860 tons
Landed 70,987 24%
Shipped 60,492 20%
Transship 170,338
56%
Container 301,817 TEUs
Master Plan for Development of an International Logistics Hub for SADC Countries in the Republic of Namibia Final Report Appendix
4-8
Total
To destinations
Figure 4.5: Destination and origin of transit cargo
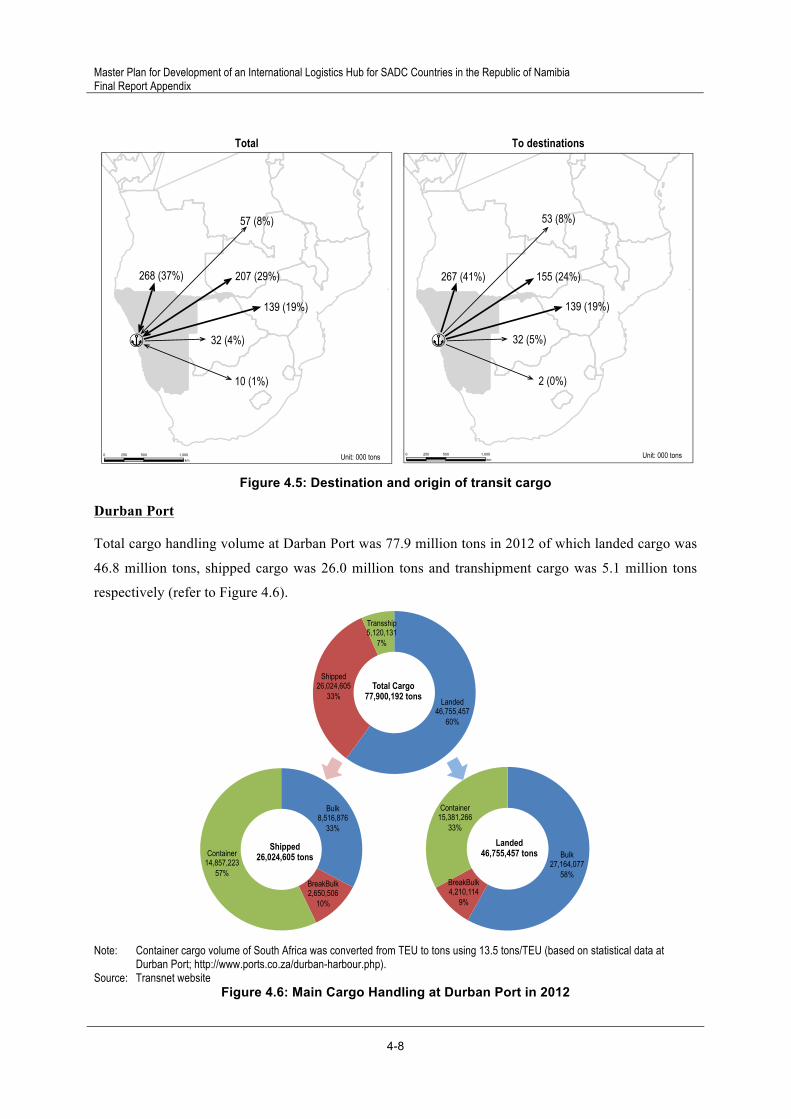
Durban Port
Total cargo handling volume at Darban Port was 77.9 million tons in 2012 of which landed cargo was
46.8 million tons, shipped cargo was 26.0 million tons and transhipment cargo was 5.1 million tons
respectively (refer to Figure 4.6).
Note: Container cargo volume of South Africa was converted from TEU to tons using 13.5 tons/TEU (based on statistical data at
Durban Port; http://www.ports.co.za/durban-harbour.php). Source: Transnet website
Figure 4.6: Main Cargo Handling at Durban Port in 2012
0 500 1,000250km
268 (37%) 207 (29%)
139 (19%)
32 (4%)
10 (1%)
57 (8%)
Unit: 000 tons 0 500 1,000250km
267 (41%) 155 (24%)
139 (19%)
32 (5%)
2 (0%)
53 (8%)
Unit: 000 tons
Landed 46,755,457
60%
Shipped 26,024,605
33%
Transship 5,120,131
7%
Total Cargo 77,900,192 tons
Bulk 27,164,077
58% BreakBulk 4,210,114
9%
Container 15,381,266
33%
Landed 46,755,457 tons�
Bulk 8,516,876
33%
BreakBulk 2,650,506
10%
Container 14,857,223
57%
Shipped 26,024,605 tons�

4. Logistics Network in SADC and Namibia
4-9
According to a report titled “9th Annual State of Logistics Survey for South Africa” (2013, Council for
Scientific and Industrial Research; CSIR), it is estimated that 48% of cargo imported to SADC
countries though South Africa is transported by road from Durban Port, while 52% is transported by
coastal ships. The report also estimates that approximately 60% of cargo by volume is destined for
Zambia, the DRC and Angola, while 40% is destined for Zimbabwe, Mozambique and Malawi. The
JICA Study Team estimated that it can further be divided as 30% for Zambia, 26% for Zimbabwe,
20% for DRC, 12% for Mozambique, 7% for Angola, 4% for Malawi and 1% for Tanzania,
respectively.
As indicated in Table 4.7, the cargo volume of transhipment and transit is not divided into transit
import (to SADC countries) and transit export (from SADC countries). Therefore, the study team
estimated from proportions of import and export to the sum of import and export. For example,
transit import of bulk cargo accounts for
436 x 31,374/(31,374 + 11,167) = 321 (000 tons).
The report doesn’t mention such information on exported cargo from SADC countries through South
Africa. Therefore, the study team assumes that transit export cargo is almost the same as the import
in this analysis. Table 4.8 shows estimated cargo volume of transhipment and transit, and Table 4.9
and Figure 4.7 show estimated of transit cargo volumes (both of destination and origin).
Table 4.7: Estimated cargo volume
Kinds of cargo Container volume (000 TEUs)
Cargo volume (000 tons)
Bulk cargo
Import 31,012 Coastwise 362 Subtotal 31,374 Export 9,458
Coastwise 1,710 Subtotal 11,167
Transhipment and Transit 436
Container cargo
Landed
Deep sea 1,133 15,302 Coastwise 6 79 Transhipment and Transit 173 2,340
Subtotal 1,313 17,721
Shipped
Deep sea 1,081 14,595 Coastwise 19 262 Transhipment and Transit 174 2,345
Subtotal 1,274 17,202
Total
Import 46,755 Export 26,025
Transhipment and transit 5,120 Total 77,900
Note: Conversion factor is set as 13.5ton/TEU based on the data of "http://www.ports.co.za/" Source: Cargo volume is based on Port Statistics (Transnet Website). "Figure Imported Cargo Flow
from Durban" is based on "State of Logistics Survey for South Africa 2012"
Conversion
*13.5ton/TEU

Master Plan for Development of an International Logistics Hub for SADC Countries in the Republic of Namibia Final Report Appendix
4-10
Table 4.8: Estimated volume of transhipment and transit cargos
000 tons Note
Import (to SADC countries)
Transhipment Bulk 321 52% of import Container 1,171 Transit 1,378 48% of import
Export (from SADC countries)
Transhipment Bulk 114 52% of export Container 1,171 Transit 1,187 48% of export
Total Transhipment 2,777
Transit 2,565 Total 5,342
Source: JICA Study Team
Table 4.9: Destination and origin of transit cargo Unit: 000 tons
Destination Origin Total Share Zambia 413 356 769 30% Zimbabwe 358 309 667 26% DRC 276 237 513 20% Mozambique 165 142 308 12% Angola 96 83 179 7% Malawi 55 47 103 4% Tanzania 14 12 26 1% Total 1,378 1,187 2,564 100% Source: JICA Study Team
Total
To Destination
Source: JICA Study Team
Figure 4.7: Destination and origin of transit cargo
Maputo Port
Cargo handled at Maputo Port amounted to 11.7 million tons in 2011, and 86% of which was bulk
cargo such as iron ore, magnetite, coal and so on (Figure 4.8). According to “Maputo-Mozambique's
biggest port (MPDC)”, the proportion of transit export was 65% of all cargo transport, and its major
0 500 1,000250km
179 (7%)769 (30%)
667 (26%)
103 (4%)
308 (12%)
513 (20%)
Unit: 000 tons
Transshipment 2,777
0 500 1,000250km
96 (7%) 413 (30%)
358 (26%)
55 (4%)
165 (12%)
276 (20%)
Unit: 000 tons

4. Logistics Network in SADC and Namibia
4-11
destinations were South Africa (90%), Swaziland (8%) and Zimbabwe (2%) as indicated in Figure 4.9.
The transit cargo handled at Maputo Port was 7.6 million tons, and 6.9 million tons of the transit cargo
came from South Africa (refer to Table 4.10 and Figure 4.10).
Source: Relatório-e-Contas 2011 (CFM) p.3, Maputo-Mozambique's biggest port (MPDC) pp.11, 12 and16.
Figure 4.8: Kinds of cargo handled at Maputo Port in 2011
Note: Cargo volume by commodity is estimated based on the ratio of "Maputo-Mozambique's biggest port (MPDC) pp.11-12" Source: Relatório-e-Contas-2011 (CFM) p.3, Maputo-Mozambique's biggest port (MPDC) pp.11, 12 and16.
Figure 4.9: Proportion of transit cargo and its major market at Maputo Port in 2011
Table 4.10: Origin of transit cargo
Weight (000 tons) ShareTransit 7,630 100%
Origin South Africa 6,867 90% Swaziland 610 8% Zimbabwe 153 2%
Source: JICA Study Team, based on "Maputo-Mozambique's biggest port (MPDC) p.16"
Bulk cargo (ferro,
magnetite, coal, etc.)
10,049,814 86%
General cargo
796,837 7%
Container 704,328
6%
Vehicles 187,821
1%
Total Cargo 11,738,800 tons�
Import 3,521,640
30%
Export 586,940
5%
South Africa 6,867,198
90%�
Swaziland 610,418
8%�
Zambabwe 152,604
2%�
Transit 7,630 65%
Total Cargo 11,738,800 tons�

Master Plan for Development of an International Logistics Hub for SADC Countries in the Republic of Namibia Final Report Appendix
4-12
Source: JICA Study Team
Figure 4.10: Origin of transit cargo
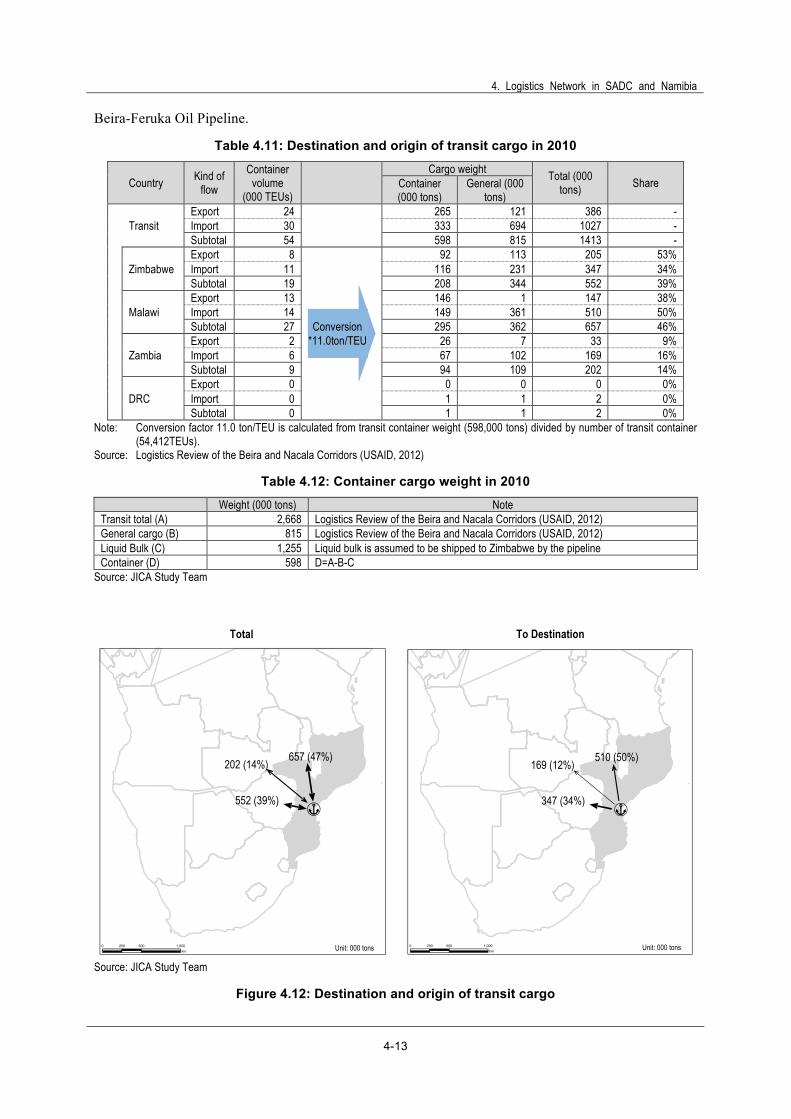
Beira Port
Cargo handled at Beira Port amounted to 4.0 million tons in 2010. Of this 32% was general cargo,
31% was liquid bulk cargo and 37% was other cargo respectively (Figure 4.11). Almost all of the
liquid bulk cargo was transported to Zimbabwe through the Beira-Feruka Oil Pipeline.
Source: Logistics Review of the Beira and Nacala Corridors (USAID, 2012)
Figure 4.11: Kinds of cargo handled at Beira Port in 2010
According to a report titled “Logistics Review of the Beira and Nacala Corridors” which was prepared
by USAID in 2012, the transit cargo represented 66% of the total cargo volume. The report also
confirmed that 68% (1.8 million tons) of the transit cargo is for Zimbabwe, 25% (0.7 million tons) is
for Malawi, 8%(0.2 million tons) is for Zambia, and the rest is for DRC. Out of 1.8 million tons of
transit cargo to Zimbabwe, 1.3 million tons of Liquid bulk cargo was transported through the
0 500 1,000250km
153 (2%)
6,867 (90%)610 (8%)
Unit: 000 tons
General Cargo
1,291,961 32%
Liquid Bulk Cargo
1,254,631 31%
Other 1,465,208
37% Total Cargo
4,011,800 tons�
Export (Domestic)
562,400 14%
Import (Domestic)
781,500 20%
Export (Transit) 607,200
15%
Import (Transit)
2,060,700 51%
Total Cargo 4,011,800�
4. Logistics Network in SADC and Namibia
4-13
Beira-Feruka Oil Pipeline.
Table 4.11: Destination and origin of transit cargo in 2010
Country Kind of flow
Container volume
(000 TEUs)
Cargo weight Total (000 tons) Share Container
(000 tons) General (000
tons)
Transit Export 24
265 121 386 - Import 30 333 694 1027 - Subtotal 54 598 815 1413 -
Zimbabwe Export 8
92 113 205 53%Import 11 116 231 347 34% Subtotal 19 208 344 552 39%
Malawi Export 13 146 1 147 38% Import 14 149 361 510 50% Subtotal 27 295 362 657 46%
Zambia Export 2 26 7 33 9% Import 6 67 102 169 16% Subtotal 9 94 109 202 14%
DRC Export 0 0 0 0 0% Import 0 1 1 2 0% Subtotal 0 1 1 2 0%
Note: Conversion factor 11.0 ton/TEU is calculated from transit container weight (598,000 tons) divided by number of transit container (54,412TEUs).
Source: Logistics Review of the Beira and Nacala Corridors (USAID, 2012)
Table 4.12: Container cargo weight in 2010
Weight (000 tons) Note Transit total (A) 2,668 Logistics Review of the Beira and Nacala Corridors (USAID, 2012) General cargo (B) 815 Logistics Review of the Beira and Nacala Corridors (USAID, 2012) Liquid Bulk (C) 1,255 Liquid bulk is assumed to be shipped to Zimbabwe by the pipeline Container (D) 598 D=A-B-C
Source: JICA Study Team
Total
To Destination
Source: JICA Study Team
Figure 4.12: Destination and origin of transit cargo
0 500 1,000250km
552 (39%)
202 (14%)
Unit: 000 tons
657 (47%)
0 500 1,000250km
347 (34%)
169 (12%)
Unit: 000 tons
510 (50%)
Conversion *11.0ton/TEU

Master Plan for Development of an International Logistics Hub for SADC Countries in the Republic of Namibia Final Report Appendix
4-14
Dar es Salaam Port
Cargo handled at Dar es Salaam Port amounted to 12.5 million tons in 2012/13. Of this import cargo
was 10.4 million tons, export cargo was 2.0 million tons and transhipment cargo was 87,000 tons,
respectively. Major import cargo was liquid bulk and container cargo, and 91% of export cargo was
container cargo (refer to Figure 4.13).
Regarding Transit cargo which amounts to 4.1 million tons in 2012/13, 45% of the transit cargo was
for Zambia, 23% was for DRC, 15% was for Rwanda, 7% was for Burundi, 5% was for Uganda, and
the rest was for Malawi etc. 550,000 Tons of petroleum was transported to Zambia via the
TAZAMA pipeline. The pipeline originally had the capacity to transport 1.1 million tons of petroleum
but the current rate of operation is around 50% due to the ageing of the facility.
Note: Transhipment cargo (87,000 tons) is not included. Source: Tanzania Port Authority Annual Statistical Report for 2012-13 (TPA)
Figure 4.13: Major commodities handled at Dar es Salaam Port in 2012/13
Table 4.13: Destination and origin of transit cargo in 2012/13 Unit: 000 tons
Break & dry
bulk Liquid bulk Container Total Share
Tanzania
Imports 2,183 2,334 2,405 6,923 - Exports 108 75 1,215 1,397 - Transhipment 0 0 0 87 - Subtotal 2,291 2,409 3,620 8,407 -
Transit Imports 406 1,929 1,161 2,945 100% Exports 0 0 628 628 100% Subtotal 406 1,929 1,789 3,574 100%
Zambia Imports 118 598* 313 1,030 35% Exports 0 0 279 279 44% Subtotal 118 598* 592 1,309 37%
DRC Imports 19 312 370 702 24% Exports 0 0 264 264 42% Subtotal 19 312 634 965 27%
Burundi Imports 26 137 125 287 10% Exports 0 0 21 21 3% Subtotal 26 137 146 308 9%
Rwanda Imports 93 235 281 610 21%
Break Bulk 841,259
8% Dry Bulk
1,747,997 17%
Liquid Bulk 4,263,342
41%
Container 3,565,707
34%
Import 10,418,305 tons�
Break Bulk 107,704
5%
Liquid Bulk 74,514
4%
Container 1,843,414
91%
Export 2,025,632 tons�
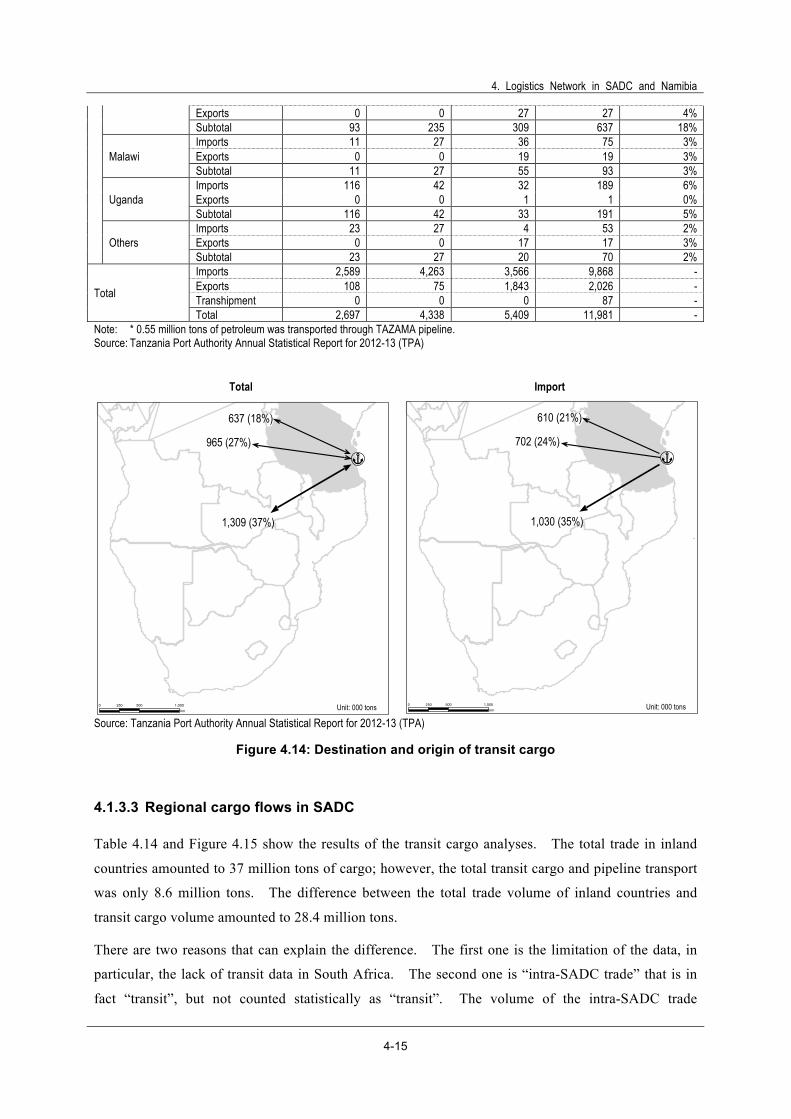
4. Logistics Network in SADC and Namibia
4-15
Exports 0 0 27 27 4% Subtotal 93 235 309 637 18%
Malawi Imports 11 27 36 75 3% Exports 0 0 19 19 3% Subtotal 11 27 55 93 3%
Uganda Imports 116 42 32 189 6% Exports 0 0 1 1 0% Subtotal 116 42 33 191 5%
Others Imports 23 27 4 53 2% Exports 0 0 17 17 3% Subtotal 23 27 20 70 2%
Total
Imports 2,589 4,263 3,566 9,868 - Exports 108 75 1,843 2,026 - Transhipment 0 0 0 87 - Total 2,697 4,338 5,409 11,981 -
Note: * 0.55 million tons of petroleum was transported through TAZAMA pipeline. Source: Tanzania Port Authority Annual Statistical Report for 2012-13 (TPA)
Total
Import
Source: Tanzania Port Authority Annual Statistical Report for 2012-13 (TPA)
Figure 4.14: Destination and origin of transit cargo
4.1.3.3 Regional cargo flows in SADC
Table 4.14 and Figure 4.15 show the results of the transit cargo analyses. The total trade in inland
countries amounted to 37 million tons of cargo; however, the total transit cargo and pipeline transport
was only 8.6 million tons. The difference between the total trade volume of inland countries and
transit cargo volume amounted to 28.4 million tons.
There are two reasons that can explain the difference. The first one is the limitation of the data, in
particular, the lack of transit data in South Africa. The second one is “intra-SADC trade” that is in
fact “transit”, but not counted statistically as “transit”. The volume of the intra-SADC trade
0 500 1,000250km
1,309 (37%)
965 (27%)
Unit: 000 tons
637 (18%)
0 500 1,000250km
1,030 (35%)
702 (24%)
Unit: 000 tons
610 (21%)

Master Plan for Development of an International Logistics Hub for SADC Countries in the Republic of Namibia Final Report Appendix
4-16
calculated from the seaborne cargo and the total trade volume is 31.2 million tons, which is similar to
the difference between the total trade volume of inland countries and transit cargo (28.4 million tons).
According to logistics companies, some import cargo landed at Durban is shipped to inland countries
after customs clearance at Johannesburg. Such “re-exported” cargo is not counted as transit cargo.
In the next stage of this master plan study, it is necessary to analyse such cargo flow in more detail, in
order to find a solution to enable Namibia to have such a market as well as transit cargo transport.
In order to achieve 1 million TEUs of container handling at Walvis Bay Port in 2020 as Namport
planned, it is indispensable to increase transport volume to its hinterland, i.e. the landlocked areas of
SADC. That is why it is necessary to endeavour to expand its market to that area. Currently,
Angola is a major destination of transhipped and transit cargo through Walvis Bay Port (refer to
section 4.1.3) because Angola has a market with population of 50 million. On the other hand, ports
in Angola are improving in terms of physical infrastructure and cargo handling services day-by-day.
Given these facts, the major sustainable markets for Namibia will be the landlocked areas of SADC
that cannot have their own ports.
Table 4.14: Estimated flow of transit cargo in SADC Unit: 000 tons
Angola Zambia DRC Zimbabwe Malawi Botswana Total Others Total
Walvis Bay Total 268 207 57 139 6 32 708 12 720 Import 267 155 53 139 3 32 650 4 653
Durban Total 179 769 513 667 103 - 2,231 333 2,564 Import 96 413 276 358 55 - 1,199 179 1,378
Maputo Total - - - 153 - - 153 7,477 7,630 Import - - - - - - - - -
Beira Total - 202 2 552 657 - 1,413 - 1,413 Import - 169 2 347 510 - 1,028 - 1,028
Dar es Salaam
Total - 1,309 965 - 93 - 2,367 1,206 3,525 Import - 1,030 702 - 75 - 1,807 1,139 2,898
Total Total 447 2,440 1,536 1,510 858 32 6,824 9,028 15,852 Import 364 1,720 1,033 844 643 32 4,635 1,322 5,957
Note: Others include South Africa, Mozambique, Rwanda, Burundi, Uganda, etc. Source: JICA Study Team

4. Logistics Network in SADC and Namibia
4-17
Source: JICA Study Team
Figure 4.15: Estimated cargo flow of SADC
Total Import
Source: JICA Study Team
Figure 4.16: Flow of total transit cargo in SADC excluding pipeline
Seaports: 388.2 million tons�
Airports: 0.5 million tons�
Total of SADC trade volume: 420.5 million tons�
388.7 million tons�
Transit: 7.5 million�
Transit: 2.2 million�
Transit: 4.6 million�
Intra-SADC Trade: 420.5 - 388.7 = 31.8 million (! 30 million)
Countries without seaports: 37.0 million tons (8.8%) Transit cargo: 6.8 (2.2 + 4.8) Zimbabwe 1.5 Zambia 2.4 DRC 1.5 Malawi 0.9 Angola 0.4 Pipeline: 1.8 Intra-SADC trade: 37.0 - (6.8 + 1.8) = 28.4 million (! 30 million)�
Pipeline: 1.8 million�
South Africa: 248.0 million tons (59.0%)
Transit cargo: 2.6 (Durban)�
Countries with seaports excluding South Africa: 135.5 million tons (32.2%) Transit Cargo: Walvis Bay 0.7 Maputo 7.6 Beira 1.4 Dar es Salaam 3.5
�
0 500 1,000250km
1,309
965
2,367
2,231
708
153
1,413
268207
57
139
32
179
769
513
667153
202
552
Unit: 000 tons
103657
93
0 500 1,000250km
1,030
702
1,807
1,199
650
1,028
267155
53
139
32
96
413
276
358
169
347
Unit: 000 tons
55510

Master Plan for Development of an International Logistics Hub for SADC Countries in the Republic of Namibia Final Report Appendix
4-18
4.2 Competitiveness and position of Namibia as a gateway to the inland countries
4.2.1 Profiles of available shipping services
4.2.1.1 Frequency of shipping service
Overview of container shipping service
Durban Port is well connected to the rest of the world and has about 150 container ship calls in one
month. As a gateway port for West Africa, Walvis Bay Port has about 55 container ship calls in one
month, of which 22 each from West Africa and Asia, and 9 from Europe. As a gateway port for East
Africa, Dar es Salaam has 35 containership calls in one month, of which 13 are from the Middle East
and 16 from Asia.
Source: Walvis Bay and Durban is based on FTW (Nos. 2103 and 2104). Beira is based on "Ports and Ships Website", shipping line
HP and "marine traffic.com" Dar es Salaam is based on the TPA website and shipping line HP and "marine traffic.com".
Figure 4.17: Container shipping service of gateway ports in SADC per month
Walvis Bay Port
Shipping lines calling at Walvis Bay Port in one month (from 19/05/2014 to 16/06/2014) are indicated
in Table 4.15. Major shipping lines are Maersk, CMA CGM, MSC and MACS.
Table 4.15: Shipping service at Walvis Bay Port Month Day Name of ship Line WA NA Med UK FE Aus May 19 Safmarine Lonaa SA14003 DAL/MSK/SAF !
May 19 Atlantic Eland 402 CSA/HLC
! May 21 Charlotte Schulte 1404 CMA/MSK/SAF
!
May 21 Charlotte Schulte 1403 CMA/MSK/SAF ! May 23 CMA-CGM Africa One WW727W CMA !
!
3 calls per month
3 calls per month
13 calls per month
16 calls per month
West Africa 8 calls per month
Asia 8 calls per month
Europe 41 calls per month
North America 27 calls per month
Australasia 21 calls per month
20 calls per month
18 calls per month
18 calls per month
15 calls per month
East Africa�
Europe�
Middle East
Asia
Asia
East Africa�
West Africa�
Middle East�
Asia�
America�
East Africa�
Europe�
Australasia�
22 calls per month�
22 calls per month�
9 calls per month�
1 calls per month�
1 calls per month�Durban
Walvis Bay
Beira
Dar es Salaam

4. Logistics Network in SADC and Namibia
4-19
Month Day Name of ship Line WA NA Med UK FE Aus May 23 CMA-CGM Amber DH453W CMA/DEL ●
●
May 23 Irenes Loaos 1406 MSK/SAF ●
● ● May 23 Maersk Cadiz 1404 CMA/MSK/SAF
●
May 25 Bright Sky 4118 MAC
● May 28 Clemens Schulte 1401 CMA/MSK/SAF ●
May 28 Clemens Schulte 1402 CMA/MSK/SAF
● May 28 Glovis Champion 7 GLV/HOE/HUA
● ●
May 29 AS Castor ZA420A MSC ● May 30 Chicaao DH455W CMA/DEL ●
● May 30 Clara Maersk 1410 MSK/SAF ●
● ●
May 30 Maersk Conakry 1406 CMA/MSK/SAF
● May 31 JPO Leo MU745 CMA/DEL ●
June 2 Ulsnis ZA419A MSC ● June 4 Cad Schulte 1402 CMA/MSK/SAF
●
June 4 Blue Master 4119 MAC
● June 4 Carl Schulte 1401 CMA/MSK/SAF ●
June 6 Safmarine Chilka 1406 CMA/MSK/SAF
● June 6 Tove Maersk 1406 MSK/SAF ●
● ●
June 7 CMA-CGM Puccini DH457W CMA/DEL ●
● June 7 Maersk Cameroun 1404 CMA/KEE/MSK/SAF
●
June 7 Msc Grace ZA422A MSC ● June 8 Chief MU745 CMA/DEL ● June 10 Safmarine Lonaa SA14003 SAF ● June 11 Wieland 1402 CMA/MSK/SAF
●
June 11 Wieland 1401 CMA/MSK/SAF ● June 13 Maersk Cabo Verde 1404 CMA/MSK/SAF
●
June 13 Maersk Westport 1406 MSK/SAF ●
● June 14 CMA-CGM Mozart DH459W CMA/DEL ●
●
June 14 Minna MU749 CMA/DEL ● June 15 Veaa Virao ZA423A MSC ●
22 1 4 5 15 1
Note: WA West Africa, NA North America, Med Mediterranean, FE Far East, Aus Australasia Source: Freight and Trade Weekly (Nos. 2103, 2104).
Durban Port
Shipping lines calling at Durban during one month (19/05/2014 - 16/06/2014) are indicated in Table
4.16. Major shipping lines are Maersk, CMACGM, MSC, PIL, MACS and so on.
Table 4.16: Shipping service at Durban Port Month Day Name of ship Line WA EA NA/
SA Eur ME/ IND FE Aus
May 19 Bright Sky 4118 MAC ● May 19 Falshoeft 903 UAF ● May 19 GSL Africa 783 GSUZIM ● May 19 Rhodos 143B DAL/MOL/MSK/SAF ● ● ● May 20 Diaporos 1403 CMA/MSK/SAF ● ● May 20 Msc Nicole ZN416A MSC ● May 20 UAL Pioneer 514.. UAL ● May 21 Hoeah Detroit 57 GLV/HOE/HUA ● May 21 Kota Lahir 077 HLC/KLI/MOL/PIL ● May 21 Msc Nilgun 003 MSC/MSK/SAF ● May 21 Thai Harvest 025 GRB/UNG ● May 22 Cosco Yinakou 059E COS/EMC/MBA ● ● ● ● May 22 MCP Linz 8R009R CMA/DEUUAF ● May 22 Msc Barbara NZ421 R MSC/HLC/HSL/LTI ● ● May 22 Northern Dependant 1408 DAL/MSK/SAF ● May 22 Rickmers Malaysia 1415 DAL/MOL/MSK/OAC/SAF ● May 23 Msc Messina IZ421A MSC ● ● ● May 23 Safmarine Lonaa SA14003 SAF ●

Master Plan for Development of an International Logistics Hub for SADC Countries in the Republic of Namibia Final Report Appendix
4-20
Month Day Name of ship Line WA EA NA/ SA Eur ME/
IND FE Aus
May 24 Msc Azov 418A MSC ● May 24 Toledo C0412 WWL ● ● May 25 CSCL Panama 0053W CSC/HLC/KLI/NDS/NYK/SMU/STS ● May 25 JPO Leo MU745 CMA/DEL ● May 25 Kota Nekad NKD072 PIL ● ● May 25 Maersk Santana 412E CMA/CSV/HJS/SAF ● May 25 MscAjaccio F1418R MSC ● May 25 Niledutch Cheetah 30204A NDS ● May 25 Wehr Elbe 205 HSD/STS ● May 26 Hammonia Africum 784 GSL/ZIM ● May 26 Louis S MU57 CMA/DEL ● ● May 26 MOL Proficiency 144B DAL/MOL/MSK/SAF ● ● ● May 27 Msc Positano ZN417A MSC ● May 28 Blue Master 4119 MAC ● May 28 Border 111S MSC/DAUMOUMSK/OAC/SAF ● May 28 Kota Akbar AKA 150 PIL ● ● May 28 Msc Martina 011 MSC/MSK/SAF ● May 29 Ital Fulaida 0454-049E COS/EMC/MBA ● ● ● ● May 29 Mornina Composer C0413 WWL ● May 29 Msc Rita NZ422R MSC/HLC/HSL/LTI ● ● May 29 NOCC Katteaat 014 GLV ● May 29 NYK Isabel 0363E CSC/HLC/KLI/NDS/NYK/STS/ZIM ● ● May 29 Sagitta 1408 DAL/MSK/SAF ● May 31 Chief MU745 CMA/DEL ● May 31 Glovis Superior 003 GLV ● ● ● May 31 Seroia Enam IZ422A MSC ● ● ● June 1 CSCL Oceania 413E CMA/CSV/HJS/SAF ● June 1 Kota Nazar NZR072 PIL ● ● June 1 NYK Made 0323W CSC/HLC/KLI/NDS/NYK/SMU/STS ● June 1 Santa Ines 419W MSC ● June 2 Alexandra 143B DAL/MOL/MSK/SAF ● ● ● June 2 Bosun MU737 CMA/DEL ● ● June 2 Glovis Superior 003 GLV ● ● June 2 Kota Hakim HKM357 PIL ● ● June 2 Kota Harum HRU152 PIL ● ● June 2 Marie 1421 GAL ● June 2 Santa Felicita 785 GSL/ZIM ● June 3 Kota Lambang 093 HLC/KLI/MOL/PIL ● June 3 Msc Denisse ZN418A MSC ● June 5 Henry Rickmers 1408 DAL/MSK/SAF ● June 5 Ninabo Express NZ423R MSC/HLC/HSL/LTI ● ● June 5 Rickmers Malaysia 1417 DAL/MOL/MSK/OAC/SAF ● June 6 Hoeah Antwerp 6 GLV/HOE/HUA ● ● ● June 6 Petrohue 1Z423A MSC ● ● ● June 6 Polonia MUS59E CMA/DEL ● ● June 6 Tomar C0414 WWL ● June 7 Caecilia Shulte 36S MSC/DAL/MOUMSK/OAC/SAF ● June 7 MCP Linz 8R009R CMA/DEUUAF ● ● June 8 Amoliani 143B DAL/MOL/MSK/SAF ● ● ● June 8 CMA-CGM Tosca 396E CMA/CSV/HJS/SAF ● June 8 CSCL Montevideo 0121W CSC/HLC/KLI/NDS/NYK/SMU/STS ● June 8 Hoeah Cooenhaaen 28 GLV/HOE/HUA ● June 8 Jolly Quarzo 091 LMC/STS ● ● June 8 Msc Natalia F1420R MSC ● June 8 Msc Aaadir 420A MSC ● June 8 MscArica FI419R MSC ● ● June 8 Niledutch Gazelle 206 HSD/STS ● June 8 uuiry cu LM I LNRi/J I J ● June 9 RDO Honour 30205A NDS ● June 10 Budapest Bridge 017 HLC/KLI/MOL/PIL ●
4. Logistics Network in SADC and Namibia
4-21
Month Day Name of ship Line WA EA NA/ SA Eur ME/
IND FE Aus
June 10 Msc Jasmine ZN419A MSC ● June 11 Maersk Vama 022 MSC/MSK/SAF ● June 12 Atlantic Impala 403 CSA/HLC ● June 12 Balao 1403E CSC/HLC/KLI/NDS/NYK/STS/ZIM ● ● June 12 Glovis Caravel 1 HOE ● June 12 Ital Fiducia 0456-058E COS/EMC/MBA ● ● ● ● June 12 Kota Anaaun AGN158 PIL ● ● June 12 Maersk Inverness 1408 DAL/MSK/SAF ● June 13 Falshoeft 904 UAF ● ● June 13 Glovis Spirit 005 GLV ● ● June 13 Portuaal IZ424A MSC ● ● ● June 13 Sophie 4120 MAC ● June 14 Alliance Norfolk 61 HOE/HUA ● ● ● June 14 Daphne MU751W CMA/DEL ● June 14 Hoeah London 51 GLV/HOE/HUA ● June 14 Mac Paris NZ424R MSC/HLC/HSL/LTI ● ● June 14 MscAmalfi 421A MSC ● June 15 CSCL San Jose 0053W CSC/HLC/KLI/NDS/NYK/SMU/STS ● June 15 Msc Texas FI421 R MSC ● ● June 15 Santa Rosa 415E CMA/CSV/HJS/SAF ● June 15 Thai Dawn 144 GRB/UNG ● June 16 Dubai Star 786 GSUZIM ● June 16 Katherine 144B DAL/MOL/MSK/SAF ● ● ● June 16 Letavia MU739 CMA/DEL ● ●
41 18 20 18 27 21 15 Note: WA West Africa, EA East Africa, NA North America, SA South America, Eur Europe, ME Middle East, IND India, Aus Australasia Source: Freight and Trade Weekly (Nos. 2103, 2104).
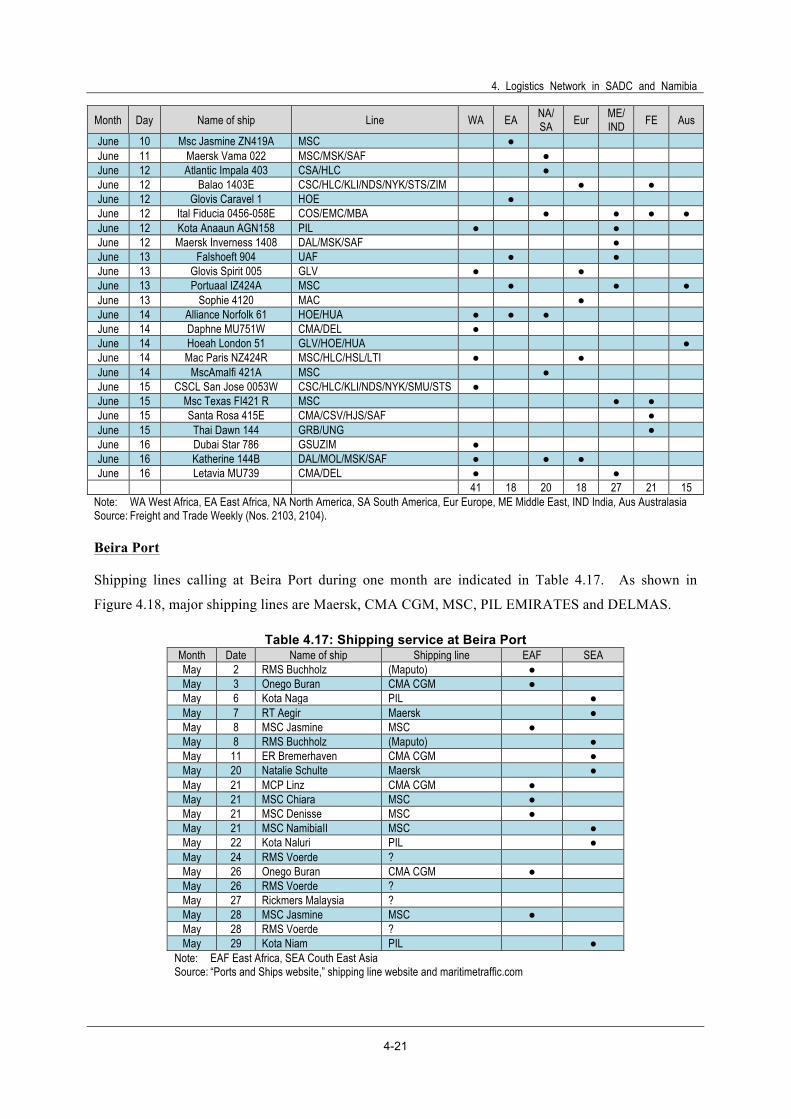
Beira Port
Shipping lines calling at Beira Port during one month are indicated in Table 4.17. As shown in
Figure 4.18, major shipping lines are Maersk, CMA CGM, MSC, PIL EMIRATES and DELMAS.
Table 4.17: Shipping service at Beira Port Month Date Name of ship Shipping line EAF SEA May 2 RMS Buchholz (Maputo) ● May 3 Onego Buran CMA CGM ● May 6 Kota Naga PIL ● May 7 RT Aegir Maersk ● May 8 MSC Jasmine MSC ● May 8 RMS Buchholz (Maputo) ● May 11 ER Bremerhaven CMA CGM ● May 20 Natalie Schulte Maersk ● May 21 MCP Linz CMA CGM ● May 21 MSC Chiara MSC ● May 21 MSC Denisse MSC ● May 21 MSC NamibiaII MSC ● May 22 Kota Naluri PIL ● May 24 RMS Voerde ? May 26 Onego Buran CMA CGM ● May 26 RMS Voerde ? May 27 Rickmers Malaysia ? May 28 MSC Jasmine MSC ● May 28 RMS Voerde ? May 29 Kota Niam PIL ●
Note: EAF East Africa, SEA Couth East Asia Source: “Ports and Ships website,” shipping line website and maritimetraffic.com

Master Plan for Development of an International Logistics Hub for SADC Countries in the Republic of Namibia Final Report Appendix
4-22
Source: http://www.cornelder.co.mz/index.php/shippinglines
Figure 4.18: Frequency of calls of shipping lines
Dar es Salaam Port
Shipping lines, which were scheduled to call at Dar es Salaam during one month, are as indicated in
Table 4.18. Major shipping lines are Maersk (9 calls), CMA CGM (7 callings), MSC (7 calls), PIL
(5 calls), Evergreen (3 calls), and Messina (3 calls).
Table 4.18: Shipping service at Dar es Salaam Port Month Date Name of s/hip Agent ME EU SEA FE SA EAF May 05 JOLLY PERLA MESSINA ! !
May 06 MAERSK ALABAMA MAERSK ! May 07 COMMODORE CMA CGM
!
May 08 WESTERLAND CMA CGM
! May 10 JPO SAGITTARIUS MAERSK !
May 11 CAPE MOSS EVERGREEN
! May 11 MSC JEMIMA MSC !
May 11 MV MANTENHA MSC May 12 KOTA NIPAH PIL
! ! May 12 MSC DENISSE MSC
!
May 13 ADA S MAERSK May 14 MV BRAVO CMA CGM
! May 15 APULIA ESS !
May 15 MSC ANAHITA MSC ! May 15 MV KATHARINA CMA CGM ! May 17 CAPE MAAS EVERGREEN
!
May 17 HARLAD S MAERSK May 18 MSC JEANNE MSC !
May 19 CITY OF BEIJING SINOTASHIP
! May 19 KOTA HENING PIL !
May 20 HAMMONIA BAVARIA MAERSK
! May 20 MSC JASMINE MSC
!
May 21 KOTA FAJAR PIL
! ! May 21 KOTA TEGUH PIL !
May 23 JOLLY PERLA MESSINA
! May 24 ER CAEN MAERSK
May 24 HS CHALLENGE CMA CGM ! May 26 EMIRATES NILE ESS
!
May 27 ER COPENHAGEN MAERSK May 28 JOLLY QUARZO MESSINA
! May 29 CMA CGM IGUACU CMA CGM !
June 1 CAPE MALE CMA CGM
! June 1 MSC IMMA MSC !
June 1 THEA S MAERSK ! June 2 KOTA NELAYAN PIL
! !
June 3 HAMMONIA HUSSUM MAERSK June 4 MESSINI EVERGREEN
! 13 3 13 3 2 1
Note: ME Middle East, EU Europe, SEA South East Asia, FE Far East, SA South Africa, EAF East Africa Source: TPA website, shipping line HP and marine traffic.com.
4. Logistics Network in SADC and Namibia
4-23
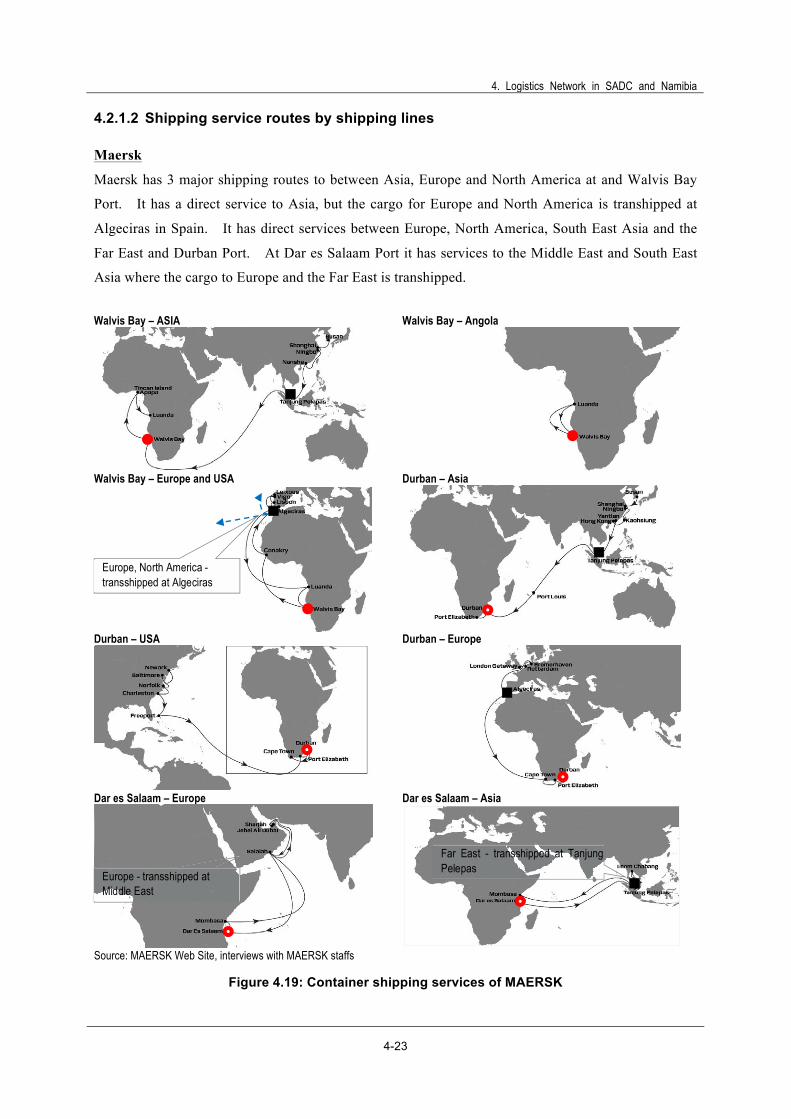
4.2.1.2 Shipping service routes by shipping lines
Maersk
Maersk has 3 major shipping routes to between Asia, Europe and North America at and Walvis Bay
Port. It has a direct service to Asia, but the cargo for Europe and North America is transhipped at
Algeciras in Spain. It has direct services between Europe, North America, South East Asia and the
Far East and Durban Port. At Dar es Salaam Port it has services to the Middle East and South East
Asia where the cargo to Europe and the Far East is transhipped.
Walvis Bay – ASIA
Walvis Bay – Angola
Walvis Bay – Europe and USA
Durban – Asia
Durban – USA
Durban – Europe
Dar es Salaam – Europe
Dar es Salaam – Asia
Source: MAERSK Web Site, interviews with MAERSK staffs
Figure 4.19: Container shipping services of MAERSK
Europe, North America - transshipped at Algeciras
Europe - transshipped at Middle East
Far East - transshipped at Tanjung Pelepas
Master Plan for Development of an International Logistics Hub for SADC Countries in the Republic of Namibia Final Report Appendix
4-24
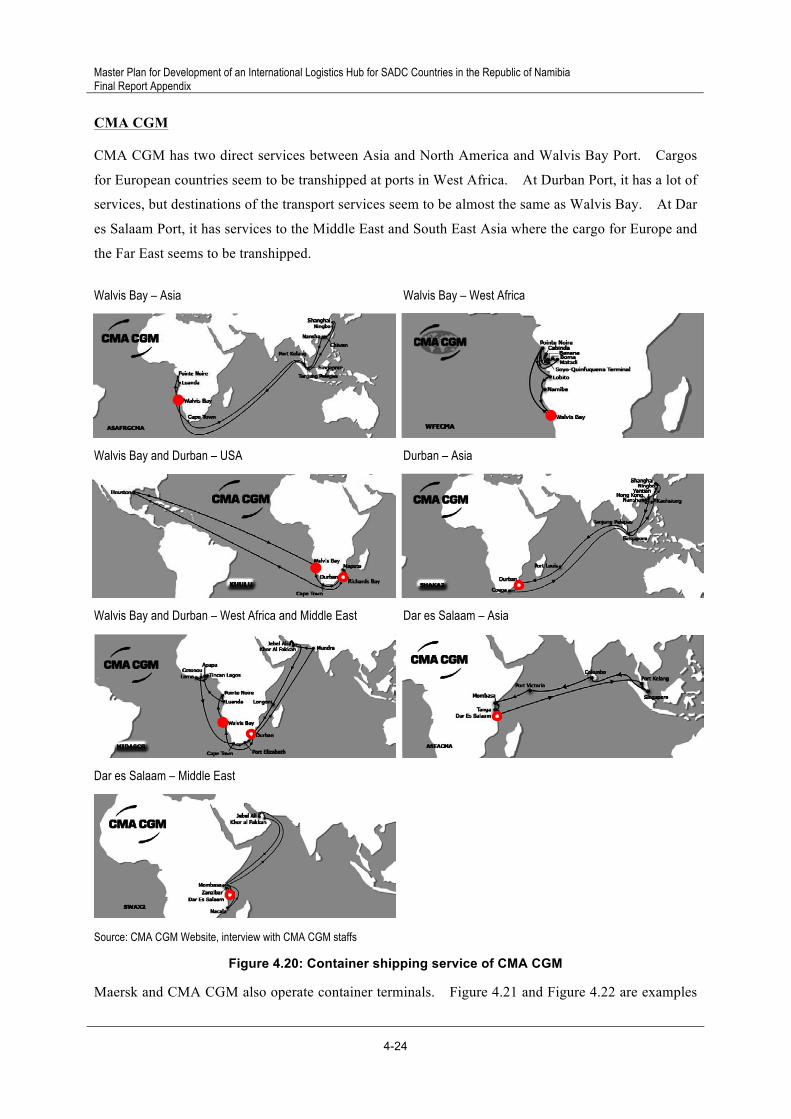
CMA CGM
CMA CGM has two direct services between Asia and North America and Walvis Bay Port. Cargos
for European countries seem to be transhipped at ports in West Africa. At Durban Port, it has a lot of
services, but destinations of the transport services seem to be almost the same as Walvis Bay. At Dar
es Salaam Port, it has services to the Middle East and South East Asia where the cargo for Europe and
the Far East seems to be transhipped.
Walvis Bay – Asia
Walvis Bay – West Africa
Walvis Bay and Durban – USA
Durban – Asia
Walvis Bay and Durban – West Africa and Middle East
Dar es Salaam – Asia
Dar es Salaam – Middle East
Source: CMA CGM Website, interview with CMA CGM staffs
Figure 4.20: Container shipping service of CMA CGM
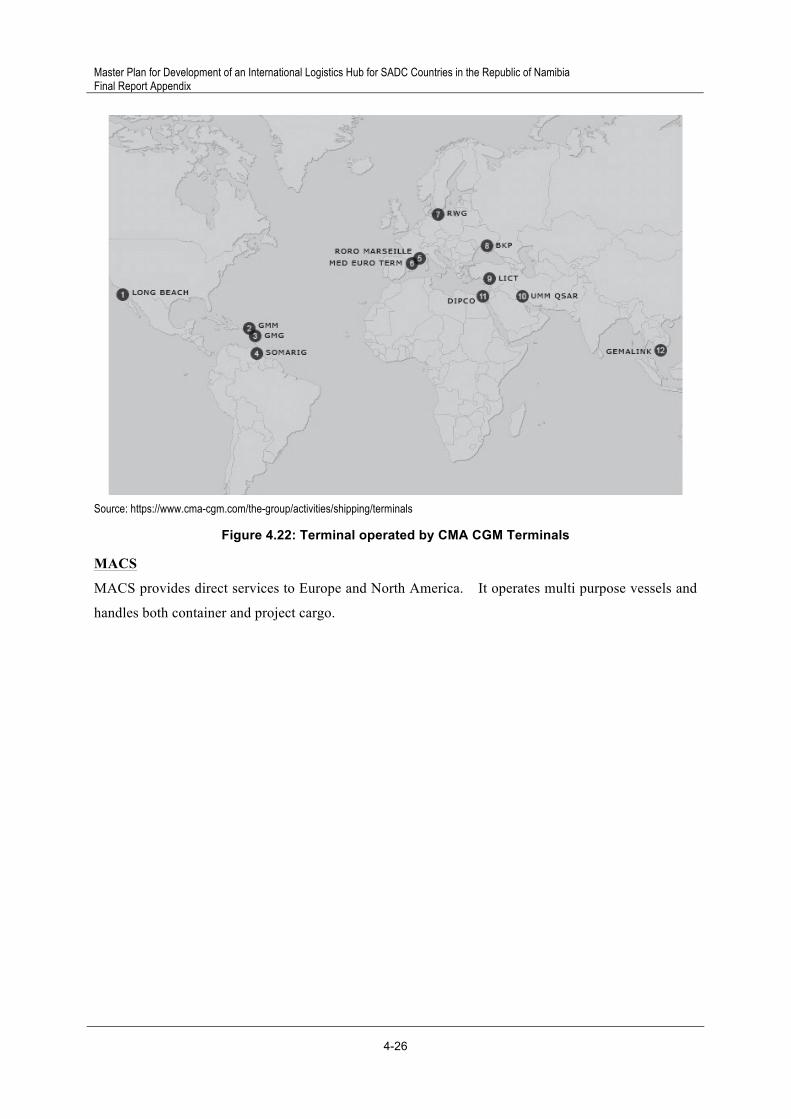
Maersk and CMA CGM also operate container terminals. Figure 4.21 and Figure 4.22 are examples

4. Logistics Network in SADC and Namibia
4-25
of CMA CGM. Figure 4.21 show container terminals operated by Terminal Link which is a
subsidiary of CMA CGM, and Figure 4.22 show container terminals operated by CMA CGM
Terminals. A.P. Moller-Maersk has a subsidiary for container terminal operation, called APM
Terminals. The APM Terminals operate 70 ports in 67 countries.
Note: Terminal Link is a joint venture of CMA CGM (51%) and China Merchants Holdings International (49%) Source: https://www.cma-cgm.com/the-group/activities/shipping/terminals
Figure 4.21: Terminal operated by Terminal Link
Master Plan for Development of an International Logistics Hub for SADC Countries in the Republic of Namibia Final Report Appendix
4-26
Source: https://www.cma-cgm.com/the-group/activities/shipping/terminals
Figure 4.22: Terminal operated by CMA CGM Terminals
MACS
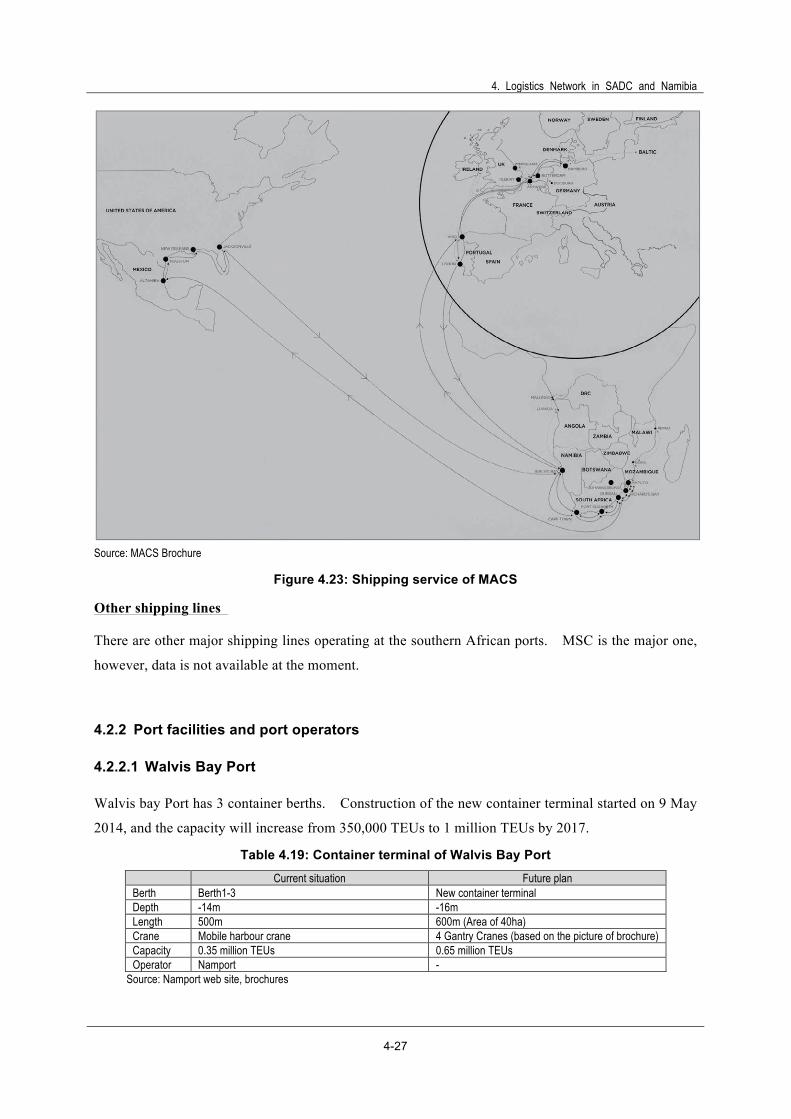
MACS provides direct services to Europe and North America. It operates multi purpose vessels and
handles both container and project cargo.
4. Logistics Network in SADC and Namibia
4-27
Source: MACS Brochure
Figure 4.23: Shipping service of MACS
Other shipping lines
There are other major shipping lines operating at the southern African ports. MSC is the major one,
however, data is not available at the moment.
4.2.2 Port facilities and port operators
4.2.2.1 Walvis Bay Port
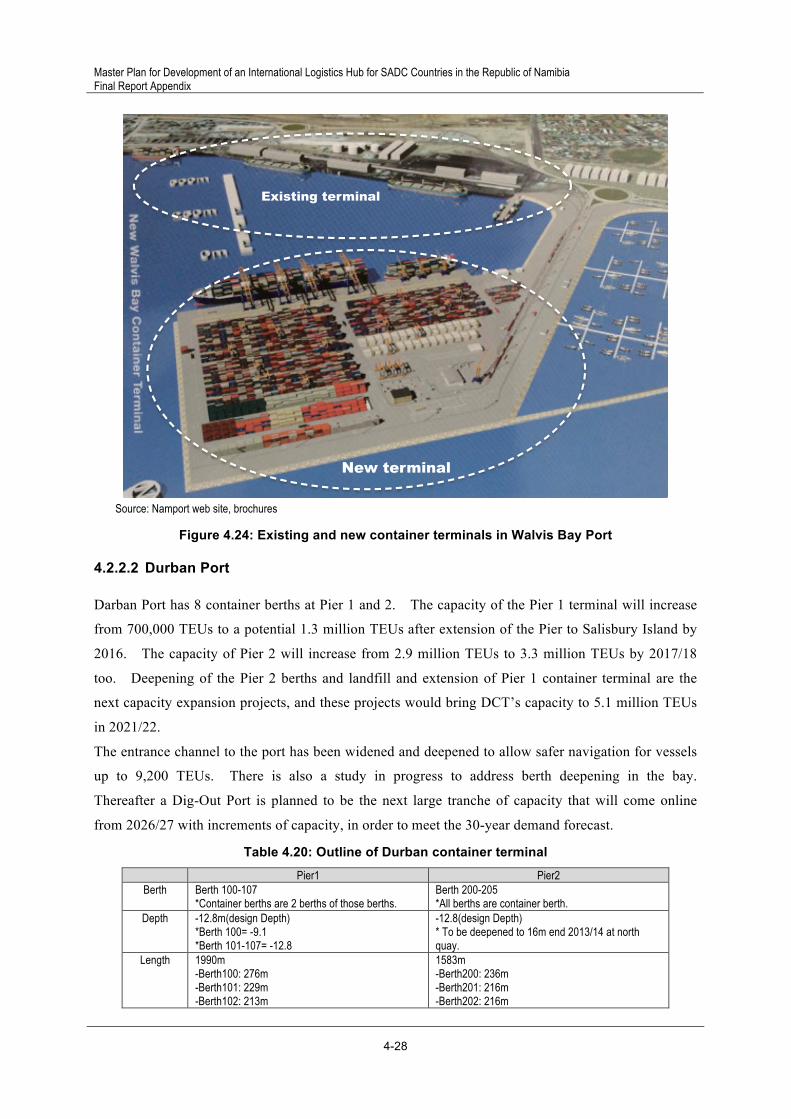
Walvis bay Port has 3 container berths. Construction of the new container terminal started on 9 May
2014, and the capacity will increase from 350,000 TEUs to 1 million TEUs by 2017.
Table 4.19: Container terminal of Walvis Bay Port
Current situation Future plan Berth Berth1-3 New container terminalDepth -14m -16m Length 500m 600m (Area of 40ha) Crane Mobile harbour crane 4 Gantry Cranes (based on the picture of brochure) Capacity 0.35 million TEUs 0.65 million TEUs Operator Namport -
Source: Namport web site, brochures
Master Plan for Development of an International Logistics Hub for SADC Countries in the Republic of Namibia Final Report Appendix
4-28
Source: Namport web site, brochures
Figure 4.24: Existing and new container terminals in Walvis Bay Port
4.2.2.2 Durban Port
Darban Port has 8 container berths at Pier 1 and 2. The capacity of the Pier 1 terminal will increase
from 700,000 TEUs to a potential 1.3 million TEUs after extension of the Pier to Salisbury Island by
2016. The capacity of Pier 2 will increase from 2.9 million TEUs to 3.3 million TEUs by 2017/18
too. Deepening of the Pier 2 berths and landfill and extension of Pier 1 container terminal are the
next capacity expansion projects, and these projects would bring DCT’s capacity to 5.1 million TEUs
in 2021/22.
The entrance channel to the port has been widened and deepened to allow safer navigation for vessels
up to 9,200 TEUs. There is also a study in progress to address berth deepening in the bay.
Thereafter a Dig-Out Port is planned to be the next large tranche of capacity that will come online
from 2026/27 with increments of capacity, in order to meet the 30-year demand forecast.
Table 4.20: Outline of Durban container terminal
Pier1 Pier2 Berth Berth 100-107
*Container berths are 2 berths of those berths. Berth 200-205 *All berths are container berth.
Depth -12.8m(design Depth) *Berth 100= -9.1 *Berth 101-107= -12.8
-12.8(design Depth) * To be deepened to 16m end 2013/14 at north quay.
Length 1990m -Berth100: 276m -Berth101: 229m -Berth102: 213m
1583m -Berth200: 236m -Berth201: 216m -Berth202: 216m
New terminal
Existing terminal

4. Logistics Network in SADC and Namibia
4-29
Pier1 Pier2 -Berth103: 235m -Berth104: 351m -Berth105: 235m -Berth105: 213m -Berth105: 238m
-Berth203: 305m -Berth204: 305m -Berth205: 305m
Crane 6 gantry crane (Observation from Google Map) 20 gantry crane (Observation from Google Map) Capacity 0.7 million TEUs 2.9 million TEUs Operator Transnet Transnet
Source: Transnet web site, Google map
Current Plan
Future Layout Plan in 2019
Source: TRANSNET PORT TERMINALS- Connectivity through our ports Moshe Motlohi, Executive Manager Strategy - 29 October 2013,
pp.55-59.
Figure 4.25: Current and future plan of Durban container terminal (1/2)
North QuayEast Quay
South Quay
Master Plan for Development of an International Logistics Hub for SADC Countries in the Republic of Namibia Final Report Appendix
4-30
Long Term Potential Layout
Future Plan for Durban-Artist's View of the new Dig-Out Port at ex-DIA Site
Source: TRANSNET PORT TERMINALS- Connectivity through our ports Moshe Motlohi, Executive Manager Strategy - 29 October 2013,
pp.55-59.
Figure 4.26: Current and future plan of Durban container terminal (2/2)
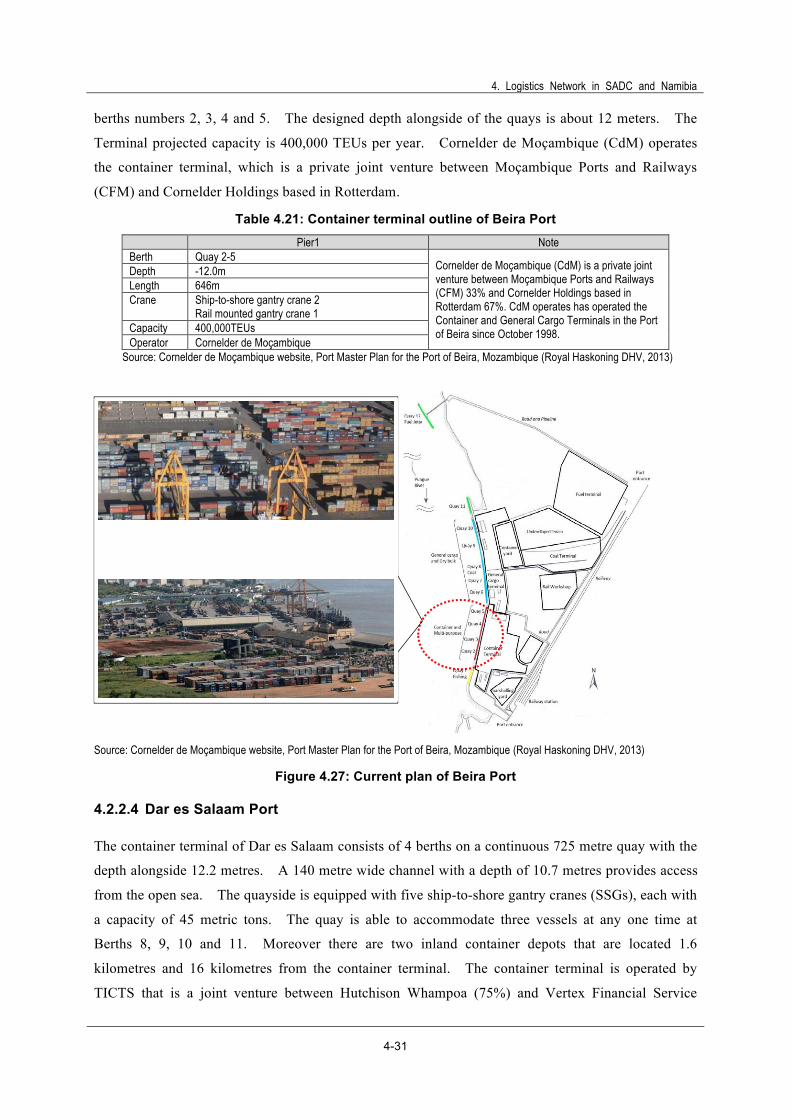
4.2.2.3 Beira Port
Container The container terminal of Beira Port has a berth length of 645 meters, which comprises of
Toyota
4. Logistics Network in SADC and Namibia
4-31
berths numbers 2, 3, 4 and 5. The designed depth alongside of the quays is about 12 meters. The
Terminal projected capacity is 400,000 TEUs per year. Cornelder de Moçambique (CdM) operates
the container terminal, which is a private joint venture between Moçambique Ports and Railways
(CFM) and Cornelder Holdings based in Rotterdam.
Table 4.21: Container terminal outline of Beira Port
Pier1 Note Berth Quay 2-5
Cornelder de Moçambique (CdM) is a private joint venture between Moçambique Ports and Railways (CFM) 33% and Cornelder Holdings based in Rotterdam 67%. CdM operates has operated the Container and General Cargo Terminals in the Port of Beira since October 1998.
Depth -12.0m Length 646m Crane Ship-to-shore gantry crane 2
Rail mounted gantry crane 1 Capacity 400,000TEUs Operator Cornelder de Moçambique
Source: Cornelder de Moçambique website, Port Master Plan for the Port of Beira, Mozambique (Royal Haskoning DHV, 2013)
Source: Cornelder de Moçambique website, Port Master Plan for the Port of Beira, Mozambique (Royal Haskoning DHV, 2013)
Figure 4.27: Current plan of Beira Port
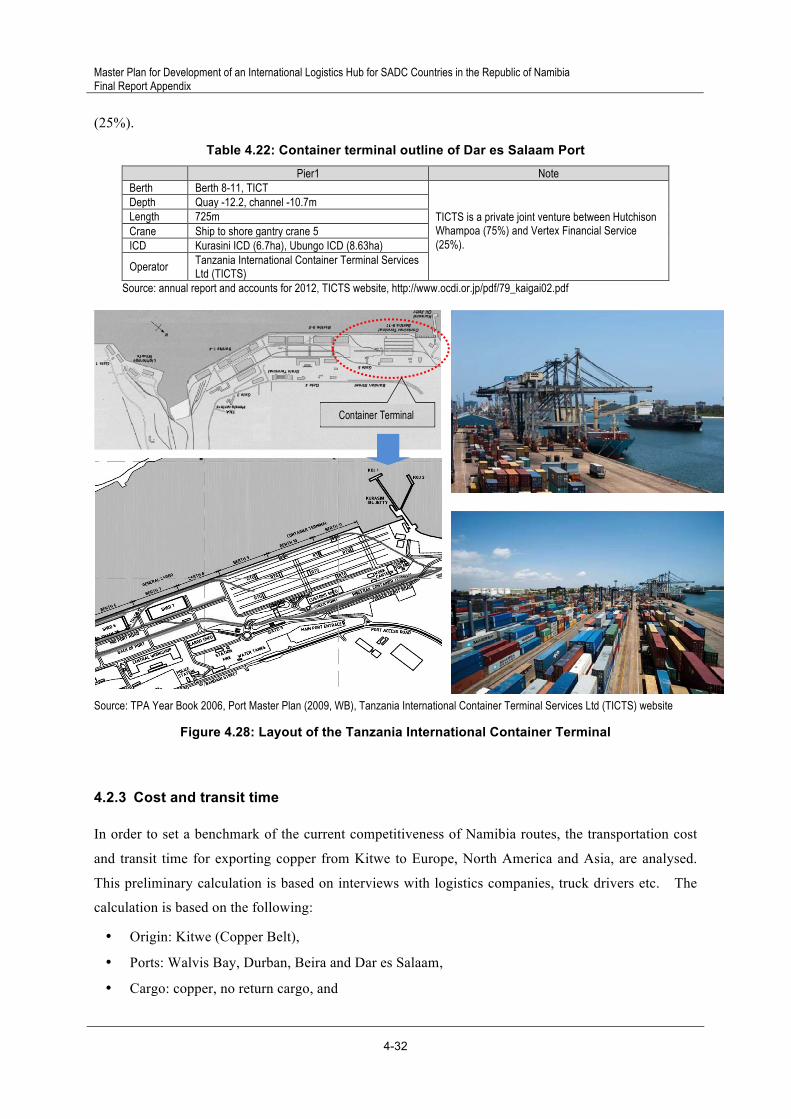
4.2.2.4 Dar es Salaam Port
The container terminal of Dar es Salaam consists of 4 berths on a continuous 725 metre quay with the
depth alongside 12.2 metres. A 140 metre wide channel with a depth of 10.7 metres provides access
from the open sea. The quayside is equipped with five ship-to-shore gantry cranes (SSGs), each with
a capacity of 45 metric tons. The quay is able to accommodate three vessels at any one time at
Berths 8, 9, 10 and 11. Moreover there are two inland container depots that are located 1.6
kilometres and 16 kilometres from the container terminal. The container terminal is operated by
TICTS that is a joint venture between Hutchison Whampoa (75%) and Vertex Financial Service
Master Plan for Development of an International Logistics Hub for SADC Countries in the Republic of Namibia Final Report Appendix
4-32
(25%).
Table 4.22: Container terminal outline of Dar es Salaam Port
Pier1 Note Berth Berth 8-11, TICT
TICTS is a private joint venture between Hutchison Whampoa (75%) and Vertex Financial Service (25%).
Depth Quay -12.2, channel -10.7m Length 725m Crane Ship to shore gantry crane 5 ICD Kurasini ICD (6.7ha), Ubungo ICD (8.63ha)
Operator Tanzania International Container Terminal Services Ltd (TICTS)
Source: annual report and accounts for 2012, TICTS website, http://www.ocdi.or.jp/pdf/79_kaigai02.pdf
Source: TPA Year Book 2006, Port Master Plan (2009, WB), Tanzania International Container Terminal Services Ltd (TICTS) website
Figure 4.28: Layout of the Tanzania International Container Terminal
4.2.3 Cost and transit time
In order to set a benchmark of the current competitiveness of Namibia routes, the transportation cost
and transit time for exporting copper from Kitwe to Europe, North America and Asia, are analysed.
This preliminary calculation is based on interviews with logistics companies, truck drivers etc. The
calculation is based on the following:
• Origin: Kitwe (Copper Belt),
• Ports: Walvis Bay, Durban, Beira and Dar es Salaam,
• Cargo: copper, no return cargo, and
4. Logistics Network in SADC and Namibia
4-33
• Unit price includes trucking cost, security cost, border cost and all other necessary costs.
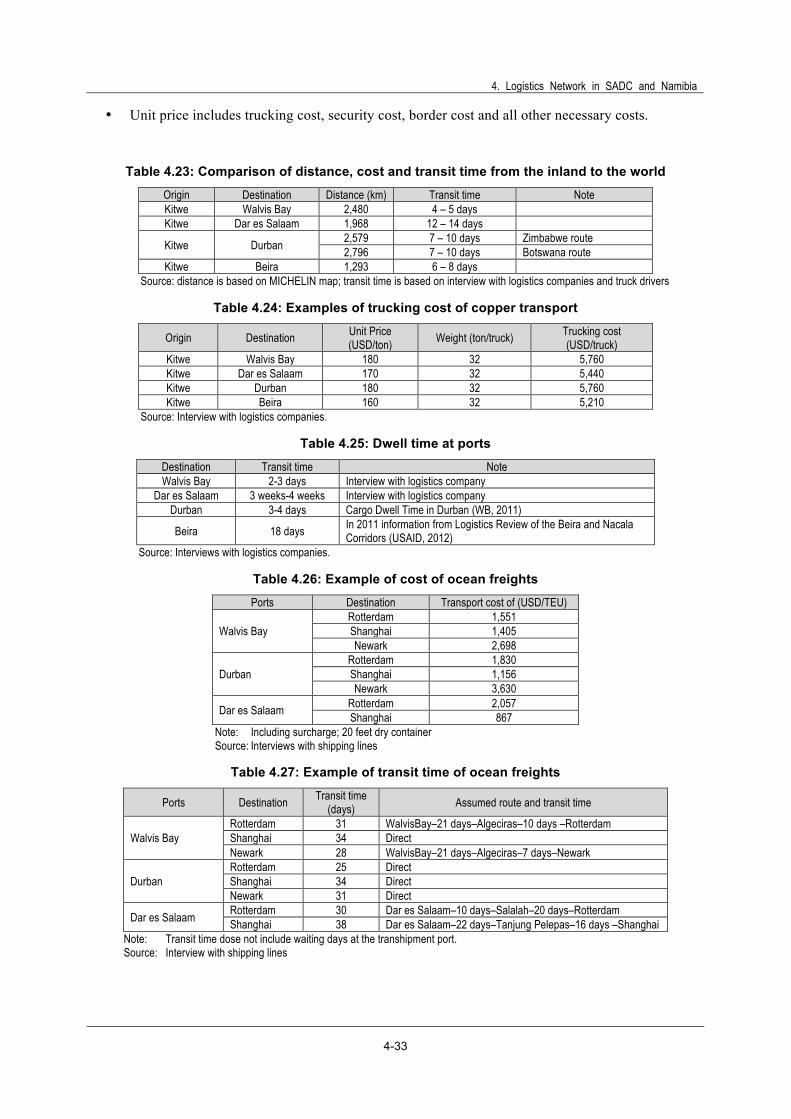
Table 4.23: Comparison of distance, cost and transit time from the inland to the world
Origin Destination Distance (km) Transit time Note Kitwe Walvis Bay 2,480 4 – 5 days Kitwe Dar es Salaam 1,968 12 – 14 days
Kitwe Durban 2,579 7 – 10 days Zimbabwe route 2,796 7 – 10 days Botswana route
Kitwe Beira 1,293 6 – 8 days Source: distance is based on MICHELIN map; transit time is based on interview with logistics companies and truck drivers
Table 4.24: Examples of trucking cost of copper transport
Origin Destination Unit Price (USD/ton) Weight (ton/truck) Trucking cost
(USD/truck) Kitwe Walvis Bay 180 32 5,760 Kitwe Dar es Salaam 170 32 5,440 Kitwe Durban 180 32 5,760 Kitwe Beira 160 32 5,210
Source: Interview with logistics companies.
Table 4.25: Dwell time at ports
Destination Transit time Note Walvis Bay 2-3 days Interview with logistics company
Dar es Salaam 3 weeks-4 weeks Interview with logistics company Durban 3-4 days Cargo Dwell Time in Durban (WB, 2011)
Beira 18 days In 2011 information from Logistics Review of the Beira and Nacala Corridors (USAID, 2012)
Source: Interviews with logistics companies.
Table 4.26: Example of cost of ocean freights
Ports Destination Transport cost of (USD/TEU)
Walvis Bay Rotterdam 1,551 Shanghai 1,405 Newark 2,698
Durban Rotterdam 1,830 Shanghai 1,156 Newark 3,630
Dar es Salaam Rotterdam 2,057 Shanghai 867
Note: Including surcharge; 20 feet dry container Source: Interviews with shipping lines
Table 4.27: Example of transit time of ocean freights
Ports Destination Transit time (days) Assumed route and transit time
Walvis Bay Rotterdam 31 WalvisBay–21 days–Algeciras–10 days –Rotterdam Shanghai 34 Direct Newark 28 WalvisBay–21 days–Algeciras–7 days–Newark
Durban Rotterdam 25 Direct Shanghai 34 Direct Newark 31 Direct
Dar es Salaam Rotterdam 30 Dar es Salaam–10 days–Salalah–20 days–Rotterdam Shanghai 38 Dar es Salaam–22 days–Tanjung Pelepas–16 days –Shanghai
Note: Transit time dose not include waiting days at the transhipment port. Source: Interview with shipping lines

Master Plan for Development of an International Logistics Hub for SADC Countries in the Republic of Namibia Final Report Appendix
4-34
4.2.4 Result of calculation
As the result of the preliminary calculation, it is confirmed that Walvis Bay Port has a time advantage
regarding export to Asia and North America. The port seems to have a cost advantage as well. It is,
however, noted that the precondition of this preliminary calculation is “one way”. In reality, it is
quite easy to get return cargo at Durban unlike at Walvis Bay and therefore in practice the total
trucking cost is much lower for the Durban route. This means that higher availability of return cargo
is an important factor that makes the Durban route most preferred. This means that improvement in
availability of return cargo is one of the critical factors for Namibia to lower the land transport costs.
Table 4.28: Result of calculation
Ports Destination Transportation cost (USD) Transit time (days) Trucking Ocean Total Trucking Port Ocean Total
Walvis Bay Rotterdam 5760 1551 7311 4 2 31 37 Shanghai 5760 1405 7165 4 2 28 34 Newark 5760 2698 8458 4 2 34 40
Durban Rotterdam 5760 1830 7590 7 3 25 35 Shanghai 5760 1156 6916 7 3 34 44 Newark 5760 3630 9390 7 3 31 41
Dar es Salaam Rotterdam 5440 2057 7497 12 21 30 63 Shanghai 5440 867 6307 12 21 38 71
Note: Total of transportation cost=trucking cost (one vehicle) plus ocean freight (TEU); hence unit is different with each other. Source: JICA Study Team

4. Logistics Network in SADC and Namibia
4-35
Source: JICA Study Team based on interviews with logistics companies.
Figure 4.29: Estimated transportation cost
5,760$/truck
1551$/TEU
2698$/TEU
1405$/TEU
5440$/truck
2057$/TEU
867$/TEU
1156$/TEU
5760$/truck (2880$/truck*)
1830$/TEU
3630$/TEU
Master Plan for Development of an International Logistics Hub for SADC Countries in the Republic of Namibia Final Report Appendix
4-36
Source: JICA Study Team based on interview with logistics companies.
Figure 4.30: Estimated transit time
4 days
31 days
34 days
28days
2 days
12 days
30days
38days
21 days
34days
7days
25days
31days
3 days

4. Logistics Network in SADC and Namibia
4-37
4.2.5 Positioning Namibia: implications of regional cargo flow, shipping service, and port facility
4.2.5.1 Cargo volume and flow
Rapid growth of cargo handling volume at Walvis Bay Port depends on transhipment demand. 60%
of the cargo handled at the port is transhipped to other countries in West Africa, in particular, Angola.
It is quite likely that direct cargo for Angola will increase and demand for transhipment at Walvis Bay
will decrease overtime. Therefore, it is important for Walvis Bay Port to increase the cargo for
inland countries that currently accounts for 20 %. It should be also be noted that the cargo for inland
countries is not only in the form of transit transportation, but also a large portion of the cargo is in the
form of re-export to inland countries, most typically such cargo re-exported to inland countries after
customs clearance at the port of Durban and City Deep of Johannesburg. The reason and the system
of the re-export should be further analysed to find a way to increase the cargo for inland countries
through Walvis Bay.
As for truck transportation, it is a notable characteristic of Namibia that the majority of trucking
companies have profiles of close business relationships with South Africa and thus handles a lot of
traffic with South Africa. On the other hand, only a few trucking companies operate the service for
inland countries and thus traffic volume to and from inland countries is insignificant. There is no
significant supplier of services for transporting cargo for inland countries. Henceforth, it is important
to explore measures to increase the supply of trucks in case demand for transit cargo for inland
countries is strategically generated and need to respond to it quickly on short notice.
As for airborne cargo in SADC, OR Tambo Airport in Johannesburg handles the majority of volume
and acts as hub airport in southern Africa. The cargo once landed at OR Tambo Airport is mostly
forwarded to final destinations via land transportation and rarely transferred via air except for “air
courier”. Airports in Namibia handle a very small volume of cargo now. It is, however, expected
that an increase in seaborne cargo will induce an increase in airborne cargo and air passengers. It is
important to identify a context and magnitude of links between seaborne cargo and air transportation,
and to prepare a viable plan to utilize the airports.
4.2.5.2 Shipping service
The frequency of shipping services at Walvis Bay Port is the second highest following the port of
Durban in southern Africa. Thanks to its relatively new role as a transhipment hub for West Africa,
Walvis Bay Port is not a “low frequency port” anymore as much as many people in international
logistics business still remember as it was five years ago. At the same time, the present frequency is
not good enough for many clients to shift their operation from Durban routes to Walvis Bay routes.
Master Plan for Development of an International Logistics Hub for SADC Countries in the Republic of Namibia Final Report Appendix
4-38
Walvis Bay is still a “once a week for each direction” port when it is compared with a “daily service to
anywhere” port of Durban.
Aside from this emerging role as a transhipment port, Walvis Bay has its natural geographical
advantage, which is to be the first and last port between southern Africa and Europe or North America.
However, this advantage is not yet fully exploited. There is only one shipping company, MACS,
providing a direct service for Europe and North America. It is strategically more and more important
for Walvis Bay Port to get a direct service for Europe and North America in order to use its natural
advantage and differentiate its role from the other gateways, especially Durban-Johannesburg.
4.2.5.3 Port facility
Walvis Bay Port has a physical advantage. It has a -14 metres deep container terminal and a new
container terminal with -16m quays is under construction to be completed in 2017. Gateway ports in
the other countries are either along a river or within a narrow bay and thus have very limited room for
expansion.
The ports in other countries, however, also have ambitious development plans to expand their capacity
by the development of new areas outside the current ports, on average around 2020. Thus, within 6-7
years time, competition among regional gateway ports will be expected to be very stiff. Given these
expected improvements of the ports, it will be more critical for users to compare different gateways
not only in terms of physical capacity of a port, but as a package of international logistics services to
link a port and its hinterland when they decide which gateway to use. Hence Namibia needs to be
prepared to transform itself as a complete package of logistics services, especially to transform Walvis
Bay Port from the present “transhipment dependent port” to a “gateway/ supply depot for inland
SADC”. This requires the development of supporting infrastructure, including provision of a large
space for logistics business within the port area (especially warehouses for value addition), road
development around the port, and dredging of the channel etc.
As for the operation of container terminals, other ports in SADC are pursuing PPP options. The ports
in Namibia also need to explore proactively ways to use PPP quickly and wisely.
4.2.5.4 Cost and transit time
Walvis Bay Port seems to have a cost advantage over Durban in terms of land transport when
compared regarding of one-way cargo. In practice, however, the trucking cost is significantly
reduced if there is return cargo. It is often noted that the trucking cost of Walvis Bay becomes high
due to the fact that it is not easy to find return cargo in Walvis Bay unlike in Durban or Johannesburg
where return cargo is often readily available. Hence Walvis Bay corridors need to increase not only
total throughput but also availability of return cargo at the ends of the corridors (ie. Walvis Bay and

4. Logistics Network in SADC and Namibia
4-39
Lusaka/Kitwe). This is one of the key elements required to reduce the trucking cost of linking the
port and hinterland (inland SADC).
4.3 Demand for logistics services in Namibia In section 4.2, the situation of Namibia in SADC is reviewed by comparing it with other major
gateways and corridors. In this section, a focus is put more on Namibia itself. It is necessary to
analyse trade and transport data in order to illustrate the demand structure of logistics services (market
segments) in Namibia.
4.3.1 Analysis of international trade data of Namibia
For the analysis of trade data of Namibia and other countries, the terms and phrases in this section are
defined as follows:
• Trade or international trade consists of import and export, and exclude transit and transhipment.
• Transit is through cargo such as a cargo landed at Walvis Bay and transported by truck to Zambia directly. Basically, transit cargo is accounted as trade between country of origin and country of final destination in the statistics.
• Transhipment is cargo transferred from vessel to vessel at a way port in order to reach the final destination stated on the Bill of Lading (B/L).
Basically, trade statistics are based on the customs declaration data; therefore, classification of
commodity or goods in the trade statistics should be in accordance with “Harmonized Commodity
Description and Coding System (HS code)”. For convenience of analysis of trade data, the study
team defined thirty commodity classes as shown in Table 4.29 based on four digit HS code taking
account of major commodities of Namibian trade.
Table 4.29: Commodity class and HS code
No. Commodity HS code (2 digits or 4 digits) 1 Live Animals, Meat & Edible Meat Offal 01 (Live Animals), 02(Meat & Edible Meat Offal) 2 Fish and Crustaceans 03 (Fish & Crustaceans) 3 Vegetable and Fruits 07 (Edible Vegetables), 08 (Ed. Fruits & Nuts, Peel Of Citrus/Melons) 4 Prepared Foodstuffs 04 (Dairy, Eggs, Honey, & Ed. Products), 15, 16, 18-21 5 Beverage 22 (Beverages, Spirits & Vinegar) 6 Cereals & Milling Industry Products 10 (Cereals), 11(Milling Industry Products)
7 Animal Feed 12 (Oil Seeds/Misc. Grains/Med. Plants/Straw), 23 (Residues From Food Industries, Animal Feed)
8 Sugars & Sugar Confectionery 17 (Sugars & Sugar Confectionery) 9 Other Agricultural Products 05, 06, 09, 12-15, 41
10 Fertilizer 31 (Fertilizers) 11 Petroleum, Oil and Gas 2709 - 2713 12 Copper ores and concentrates 2603 (Copper Ores and Concentrates) 13 Zinc ores and concentrates 2608 (Zinc Ores and Concentrates) 14 Manganese ores and concentrates 2602 (Manganese Ores and Concentrates) 15 Coal 2701 - 2708 16 Salt 2501 (Salt and Pure Sodium Chloride, Whether or not Cont.) 17 Marble, Fluorspar 2515 (Marble, Travertine Etc. And Alabaster, Crude Etc.) -2516 18 Diamonds and other precious stones, ore 71 (Pearls, Stones, Prec. Metals, Imitation Jewellery, Coins)

Master Plan for Development of an International Logistics Hub for SADC Countries in the Republic of Namibia Final Report Appendix
4-40
No. Commodity HS code (2 digits or 4 digits) 19 Other Ore, Slag, Stone and Sand 25 (Salt, Sulphur, Earth & Stone, Lime & Cement), 26 (Ores Slag & Ash) 20 Metal and Metal Products 72-76, 78-81 21 Chemicals and Industrial Material 15,28,29, 32-36, 38,39, 40,42,43,68,70 22 Garment, Textiles and fabric 42,43,50-67 23 Wood and Wood Products 44 (Wood & Articles of Wood, Wood Charcoal), 45,46 24 Paper and Printed Matter 47 (Pulp of Wood, Waste & Scrap of Paper), 48, 49 25 Cement, Construction Material 25, 27, 39, 68, 69, 94
26 Household articles, Pharmaceutical products 24, 30, 33, 34, 36, 37, 39, 69, 70, 73, 74, 76, 82-85, 87, 91,92, 94-96
27 Passenger Car, Truck, Motorcycle 8426-8427, 8701-8705,8711,8716
28 Rail locomotive, coaches, Aircraft and Vessel
86 (Railway or Tramway Locomotives, Rolling Stock, Track Fixtures & Fittings, Signals), 87, 88
29 Machinery and Parts 84, 85, 87-92 30 Other unclassified goods 93, 95, 97, 98
Note: Actual correspondence table correspond to little less than 6,000 commodities by four digits HS code. Source: JICA Study Team
4.3.1.1 International trade in SADC: a background of market segments for logistics services in Namibia
International trade, namely, export and import of goods in SADC countries is dominated by South
Africa and Angola. Major export items of South Africa in 2012 are precious stones, metals (22% of
total export value of South Africa), ores, slag and ash (15%) mineral fuels, oils, distillation products
(11%), while major import items are machinery, electronic equipment and vehicles (33%) and mineral
fuels, oils, distillation products (22%). Export of Angola in 2012, according to International Trade
Centre, is dominated by mineral fuels, oils, distillation products (98%), and major import commodities
are machinery, electronic equipment and vehicles (34%), articles of iron or steel (5%) and mineral
fuels, oils, distillation products (5%). Namibia is average in SADC countries regarding international
trade value in 2012.
Figure 4.31: GDP per capita and trade value in 2012
International trade flow based on “UN ComTrade” is shown in Figure 4.32. Export and import

4. Logistics Network in SADC and Namibia
4-41
between South Africa and other continents such as Asia, Europe and America are remarkable, and
international trade between SADC countries is considerably lower than trade with other continents.
Figure 4.32: International trade value in SADC
Figure 4.33 illustrates international trade excluding trade with other continents relevant to SADC
countries. From trade by value in 2011, significant international trade is between South Africa and
Namibia, Botswana and Zimbabwe in terms of value. In terms of weight of commodity, trade
between South Africa and Mozambique, Angola and Central Africa is significant.
Figure 4.33 International trade value of SADC countries within Africa

Master Plan for Development of an International Logistics Hub for SADC Countries in the Republic of Namibia Final Report Appendix
4-42
Figure 4.34: International trade volume of SADC countries within Africa
4.3.1.2 International trade in Namibia
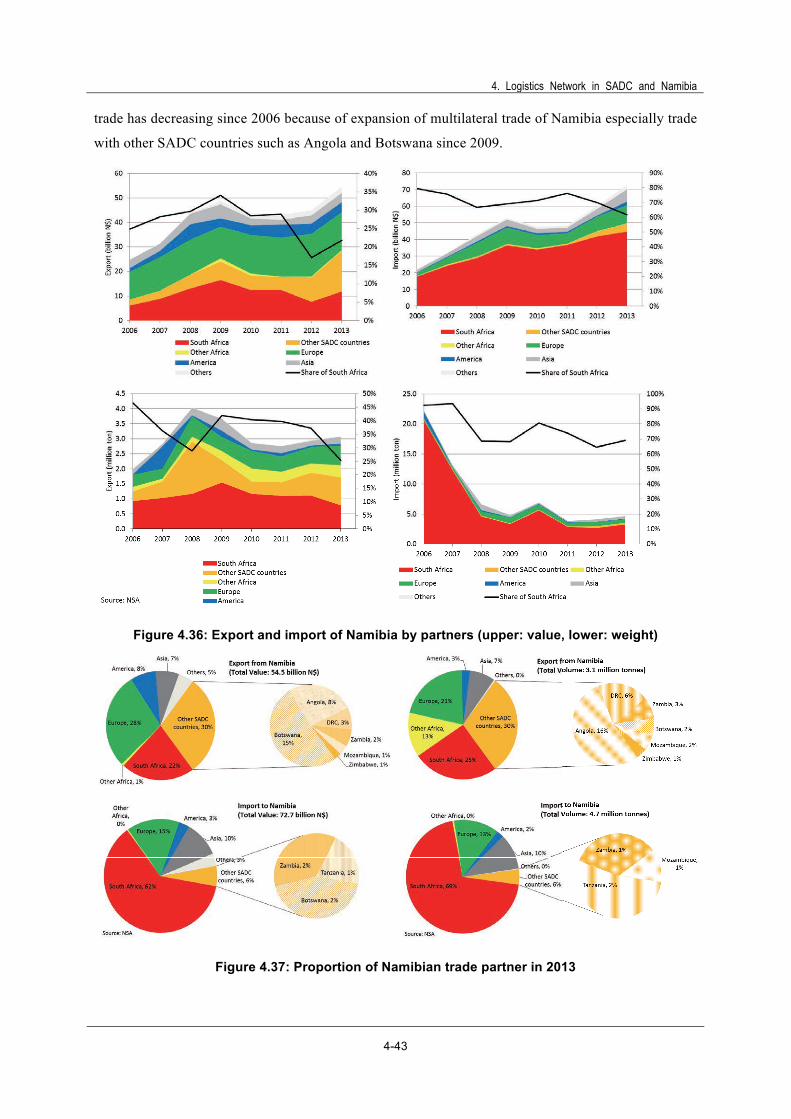
Figure 4.35 illustrates the international trade in Namibia from 2006 to 2013 excluding transit and
trans-shipment. In 2013, the export and import value in Namibia reached 54.5 billion and 72.7
billion N$ respectively, and average annual growth rates were 11.9% and 18.4% respectively. In
terms of trade volume in weight, import volume from 2006 to 2009 has decreased because of
reduction of import of cement, animal feed such as wheat and maize.
Source: NSA
Figure 4.35: International trade value and volume of Namibia in 2006–2013
South Africa is the most important trading partner for Namibia, which accounts for 62% of Namibian
import and 22% of export in terms of value in 2013. However, the South African share in Namibian
4. Logistics Network in SADC and Namibia
4-43
trade has decreasing since 2006 because of expansion of multilateral trade of Namibia especially trade
with other SADC countries such as Angola and Botswana since 2009.
Figure 4.36: Export and import of Namibia by partners (upper: value, lower: weight)
Figure 4.37: Proportion of Namibian trade partner in 2013

Master Plan for Development of an International Logistics Hub for SADC Countries in the Republic of Namibia Final Report Appendix
4-44
Major export items of Namibia in 2013 in terms of trade value are:
• “Diamonds and other precious stones, ore” (N$ 13.4 billion and 25% of total export value),
• “Fish and crustaceans” (N$ 7.1 billion, 13%),
• “Other ore, slag, stone and sand” except copper, zinc and manganese ore (N$ 6.8 billion, 12%), and
• “Machinery and parts” (N$ 6.8 billion, 12%) includes “floating or submersible drilling or production platforms” (N$ 3.0 billion, 5% of total export value).
Major import items in 2013 in terms of trade value are:
• “Machinery and parts” (N$ 15.0 billion and 21% of total import value),
• “Passenger car, truck, motorcycle” (N$ 9.1 billion, 12%), and
• “Petroleum, oil and gas” (N$ 7.1 billion, 10%).
Major export items by weight are:
• “Salt” (725,000 tons and 24% of total export volume), to central Africa, especially Nigeria, South Africa and Europe,
• “Fish and crustaceans” (372,000 tons, 12%) to Europe, Congo DRC and South Africa, and
• “Chemicals and industrial material” (332,000 tons, 12%) including “disodium carbonate” (286,000 tons, 9% of total export volume) to Angola and South Africa.
In terms of weight, major import items in 2013 are:
• “Petroleum, oil and gas” (770,000 tons and 16% of total import volume) from South Africa, Europe and Tanzania,
• “Household articles, pharmaceutical products” (653,000 tons, 14%) from South Africa, and
• “Garment, textiles and fabric” (538,000 tons, 11%) from South Africa.

4. Logistics Network in SADC and Namibia
4-45
Source: NSA
Figure 4.38: Export and import volume and value of Namibia in 2013
Figure 4.39 and Figure 4.40 show the export and import value and volume by customs in Namibia in
2013 excluding transit cargo through Namibia and transhipment at the port. Three major customs
offices, Walvis Bay, Trans Kalahari and Ariamsvlei accounted for more than half the total export and
import of Namibia. Especially, Walvis Bay accounts for 47% of exports and 31% of imports of
Namibia in terms of commodity weight. Major export items at Walvis Bay are “salt” (44% of export
from Walvis Bay), “fish and crustaceans” (15%), “zinc ores and concentrates” (6%). Major import
items are “petroleum, oil and gas” (44%), “chemicals and industrial material” (17%) such as sulphuric
acid and sodium hydrogen carbonate, and “sugars & sugar confectionery” (8%).
On the other hand, Trans Kalahari and Ariamsvlei that are borders on the Trans–Kalahari and Trans–
Orange, respectively are import surplus. The trade volume through Ariamsvlei has been stable since
2006 and major imported items in 2013 are animal feed and maize. The trade volume through Trans
Kalahari has increased since 2006 and major imported items through Trans–Kalahari in 2013 are
maize and household articles such as cigarettes, glassware, detergent and soap.
On the contrary, Oshikango, the border with Angola is export surplus and major commodities exported
are disodium carbonate, gravel, cement and maize.
Export and import volume through Katima Mulilo, the border with Zambia is comparatively small at
present.

Master Plan for Development of an International Logistics Hub for SADC Countries in the Republic of Namibia Final Report Appendix
4-46
Figure 4.39: Export and import value by custom offices in 2013
Figure 4.40: Export and import volume by custom offices in 2013
As shown in Figure 4.41, which indicates freight volume at major border customs offices, Katima
Mulilio and Tsumeb have grown rapidly since 2009. Trade volumes at other customs points have
remained flat.

4. Logistics Network in SADC and Namibia
4-47
Figure 4.41: Change in export, import value and volume at major border customs points
Table 4.30: Major trade commodities at major customs offices in 2013 Customs Office Export (000 tons) Import (000 tons) Walvis Bay Export total 1,449.9 (100%) Import total 1,461.9 (100%)
Salt 633.6 (44%) Petroleum, Oil and Gas 647.2 (44%)
Fish and Crustaceans 215.3 (15%) Chemicals and Industrial Material 253.3 (17%)
Zinc ores and concentrates 90.7 (6%) Sugars & Sugar Confectionery 121.3 (8%)
Marble, Fluorspar 88.4 (6%) Machinery and Parts 118.8 (8%)
Manganese ores and concentrates 81.5 (6%) Cereals & Milling Industry Products 102.1 (7%)
Other Ore, Slag, Stone and Sand 61.7 (4%) Coal 47.0 (3%)
Metal and Metal Products 56.5 (4%) Metal and Metal Products 41.6 (3%)
Copper ores and concentrates 49.5 (3%) Passenger Car, Truck, Motorcycle 22.1 (2%) Trans Kalahari Export total 424.2 (100%) Import total 836.8 (100%)
Beverage*1 142.9 (34%) Household articles, Pharmaceutical products 162.6 (19%)
Wood and Wood Products*2 42.2 (10%) Cereals & Milling Industry Products 106.6 (13%)
Passenger Car, Truck, Motorcycle 34.4 (8%) Metal and Metal Products 106.3 (13%)
Petroleum, Oil and Gas 33.6 (8%) Chemicals and Industrial Material 63.7 (8%)
Salt 28.9 (7%) Beverage 49.6 (6%) Live Animals, Meat & Edible Meat Offal 24.2 (6%) Wood and Wood Products 48.7 (6%)
Other Ore, Slag, Stone and Sand 21.2 (5%) Prepared Foodstuffs 46.5 (6%) Ariamsvlei Export total 248.6 (100%) Import total 477.3 (100%)
Live Animals, Meat & Edible Meat Offal 62.6 (25%) Animal Feed 116.3 (24%)
Salt 47.4 (19%) Metal and Metal Products 55.7 (12%)
Fish and Crustaceans 34.5 (14%) Passenger Car, Truck, Motorcycle 43.4 (9%)
Metal and Metal Products 33.7 (14%) Chemicals and Industrial Material 40.6 (8%)
Wood and Wood Products 15.2 (6%) Wood and Wood Products 31.1 (7%)
Beverage 10.6 (4%) Prepared Foodstuffs 30.5 (6%) Noordoewer Export total 208.6 (100%) Import total 307.3 (100%)
Vegetable and Fruits *3 36.4 (17%) Prepared Foodstuffs 46.8 (15%)
Wood and Wood Products*4 35.1 (17%) Metal and Metal Products 32.7 (11%)
Live Animals, Meat & Edible Meat Offal 24.6 (12%) Vegetable and Fruits 32.3 (11%)
Chemicals and Industrial Material 23.4 (11%) Chemicals and Industrial Material 29.2 (10%)
Metal and Metal Products 19.6 (9%) Cereals & Milling Industry Products 21.7 (7%)
Salt 11.8 (6%) Paper and Printed Matter 18.4 (6%)
Fish and Crustaceans 10.9 (5%) Household articles, Pharmaceutical products 16.2 (5%)
Luderitz Export total 133.2 (100%) Import total 173.6 (100%)
Metal and Metal Products 90.0 (68%) Other Ore, Slag, Stone and Sand 91.1 (52%)
Zinc ores and concentrates 21.0 (16%) Petroleum, Oil and Gas 69.8 (40%)
Fish and Crustaceans 10.2 (8%) Metal and Metal Products 5.5 (3%)
Master Plan for Development of an International Logistics Hub for SADC Countries in the Republic of Namibia Final Report Appendix
4-48
Customs Office Export (000 tons) Import (000 tons) F. P. Du Toit Export total 0.0 - Import total 917.8 (100%)
- - - Garment, Textiles and fabric 486.9 (53%)
- - - Household articles, Pharmaceutical products 418.7 (46%)
Oshikango Export total 440.4 (100%) Import total 3.5 (100%)
Chemicals and Industrial Material 289.0 (66%) Beverage 2.3 (66%)
Other Ore, Slag, Stone and Sand 33.1 (8%) - - -
Household articles, Pharmaceutical
products 16.4 (4%) - - -
Tsumeb Export total 0.7 - Import total 209.2 (100%)
- - - Copper ores and concentrates 207.1 (99%) Note: *1 Dominated by beer made from malt; *2 Dominated by wood charcoal; *3 Dominated by fresh grapes; *4 Fuel wood, wood
charcoal Source: NSA
4.3.1.3 Transit cargo through Namibia
There are two existing sets of statistics relevant to transit cargo through Namibia, customs data
provided by NSA and cross-border cargo relevant to Walvis Bay Port provided by Namport.
• Transit cargo based on customs data excludes some items such as transit of refined copper from Zambia to sea through Walvis Bay Port.
• Walvis Bay Port data includes only transit cargo relevant to Walvis Bay Port and excludes other transport corridors such as transit from South Africa to Angola.
Transit cargo by customs database
As shown in the following figures, major transit cargo through Namibia is cargo from South Africa to
Angola in terms of weight (30% in 2013) and United Kingdom to Zimbabwe (25%) and Zambia
(13%). On the other hand, in terms of value of cargo, the share of transit cargo from South Africa to
Angola is 48% and cargo from Europe to southern Africa is significant.
Source: NSA
Figure 4.42: Transit cargo by origins and destinations in 2013

4. Logistics Network in SADC and Namibia
4-49
Source: NSA
Figure 4.43: Transit volume by origin and destination country in 2013
The commodity of transit cargo is, as shown in Figure 4.44, Table 4.31 and Table 4.32, dominated by
motor vehicles from the United Kingdom to Zimbabwe and Zambia in terms of weight.
Figure 4.44: Transit cargo by commodity in 2013 based on customs data
Table 4.31: Major transit volume by commodity and origins and destination in 2013
Origins Destinations Commodity by HS4digits Volume (tons) Share United Kingdom Zimbabwe Motor Vehicles For Transport Of Goods 6,083 8% United Kingdom Zimbabwe Motor Cars & Vehicles For Transporting Persons 5,850 8% United States Zimbabwe Tractors (Other Than Works Trucks) Of Heading 8709 4,455 6% United Kingdom Zambia Motor Vehicles For Transport Of Goods 4,182 6% United Kingdom Zimbabwe Tractors (Other Than Works Trucks) Of Heading 8709 3,022 4% Others 52,320 69% Total 75,912 100%
Source: NSA

Master Plan for Development of an International Logistics Hub for SADC Countries in the Republic of Namibia Final Report Appendix
4-50
Table 4.32: Major transit value by commodity and origins and destination in 2013
Origins Destinations Commodity by HS4digits Value (N$ million) Share
South Africa Angola Parts & access for motor vehicles 452.5 22.4%
France South Africa Machinery, plant or laboratory equipment, whether or not electrically heated, for the treatment of materials by a process involving a change of temperature such as heating, cooking, roasting, distilling, rectifying, sterilising, and pasteur
217.4 10.8%
United Kingdom Zimbabwe Motor cars & vehicles for transporting persons 184.1 9.1% Italy South Africa Steam turbines & other vapour turbines, parts 113.8 5.6%
Spain South Africa Steam or other vapour generating boilers (other than central heating hot water boilers capable also of producing low pressure steam); super-heated water boilers.
97.1 4.8%
Others 952.7 47.2% Total 2,017.6 100.0%
Source: NSA
Cross-border cargo relevant to Walvis Bay Port
Table 4.33 shows the cross-border cargo relevant to Walvis Bay Port. Transit cargo by land transport
from other neighbouring SADC countries to Walvis Bay Port for shipping was about 63,455 tons in
2013 (243 tons/day) and transit cargo landed at Walvis Bay Port and transported to other neighbouring
SADC countries was larger than the opposite direction by far, 554,017 tons in 2013 (2,125 tons/day).
Average annual growth rates of transit cargo from other SADC countries to Walvis Bay Port in
2010-2013 was 17.9% and transit cargo from Walvis Bay Port to other SADC countries was 20.6%.
Table 4.33: Annual cross-border cargo to/from Walvis Bay Port
Year
From other SADC countries to Walvis Bay Port From Walvis Bay port to other SADC countries 12m
container (Nos)
6m container (Nos) Bulk (ton) Total (ton)
12m container
(nos) 6m container
(nos) Bulk (ton) Total (ton)
2009 6 268 62 5,614 2,915 757 8,680 117,100 2010 69 1,823 96 38,764 7,025 2,138 48,496 316,056 2011 42 1,890 143 39,287 5,920 2,584 145,656 386,776 2012 89 2,578 2,912 57,320 7,976 2,964 231,690 546,202 2013 119 2,968 287 63,455 8,569 2,956 220,689 554,017
Note: Total ton is based on the assumption that content of 12m (40ft) container is 32 ton, 6m (20ft) container is 20 ton. Source: Namport
Major transit cargo landed at Walvis Bay Port and transported to other countries by land-transport are
cars for Zimbabwe (21%) and Zambia (12%), machinery and parts for Angola (14%).
Table 4.34: Transit cargo from Walvis Bay Port to SADC countries in 2013 Unit: 1,000 tons
Angola DRC South Africa Zambia Zimbabwe Others Total Passenger Car, Truck, Motorcycle 3.5 (1%) 2.7 (0%) 0.2 (0%) 65.4 (12%) 118.0 (21%) 31.5 (6%) 221.3 (40%)
Machinery and Parts 78.4 (14%) 2.0 (0%) 0.3 (0%) 11.6 (2%) 2.8 (1%) 2.3 (0%) 97.5 (18%) General 33.4 (6%) 1.1 (0%) 1.1 (0%) 6.9 (1%) 0.4 (0%) N/A N/A 42.8 (8%) Household articles, Pharmaceutical products
37.2 (7%) 0.4 (0%) 0.0 (0%) 2.3 (0%) 0.5 (0%) 0.1 (0%) 40.5 (7%)
Live Animals, Meat & Edible Meat Offal 2.7 (0%) 18.8 (3%) 0.0 (0%) 3.6 (1%) 1.5 (0%) 0.2 (0%) 26.7 (5%)
Fish and Crustaceans 2.7 (0%) 8.8 (2%) 0.0 (0%) 12.6 (2%) 0.0 (0%) 0.0 (0%) 24.1 (4%)
Others 60.0 (11%) 6.7 (1%) 1.3 (0%) 32.3 (6%) 0.3 (0%) 0.5 (0%) 101.1 (18%) Total 217.9 (39%) 40.4 (7%) 3.0 (1%) 134.7 (24%) 123.5 (22%) 34.4 (6%) 554.0 (100%)
Source: Namport
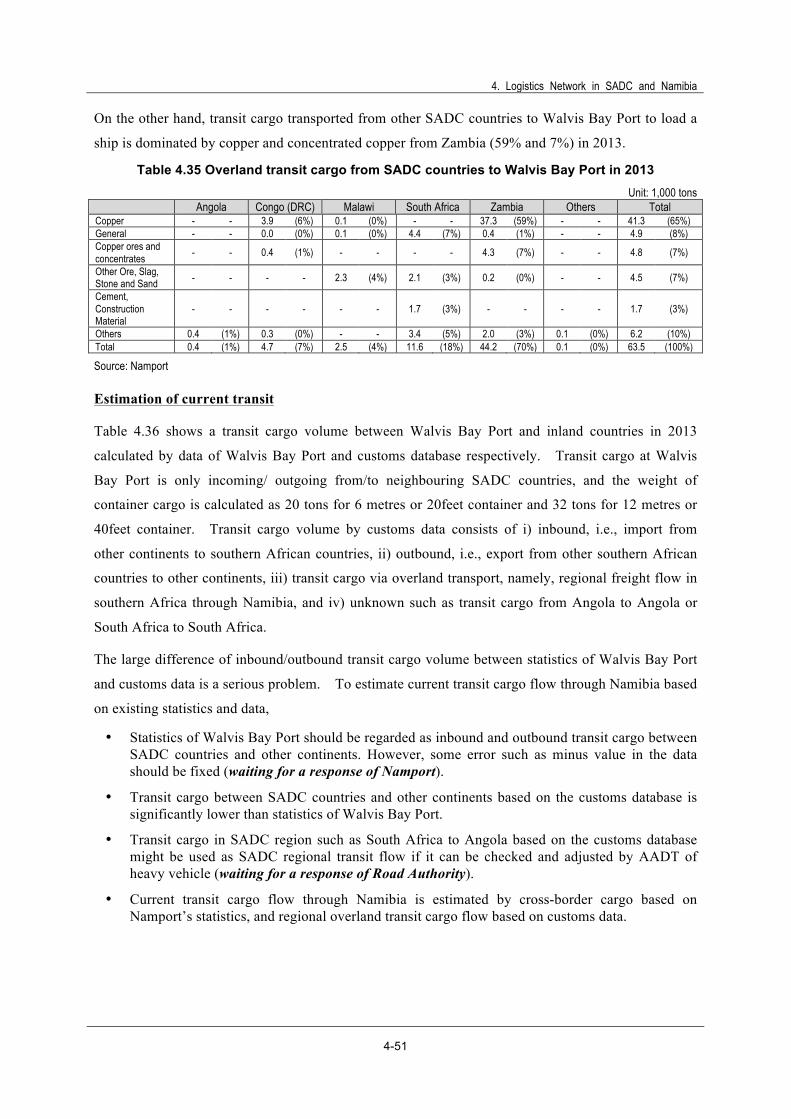
4. Logistics Network in SADC and Namibia
4-51
On the other hand, transit cargo transported from other SADC countries to Walvis Bay Port to load a
ship is dominated by copper and concentrated copper from Zambia (59% and 7%) in 2013.
Table 4.35 Overland transit cargo from SADC countries to Walvis Bay Port in 2013 Unit: 1,000 tons
Angola Congo (DRC) Malawi South Africa Zambia Others Total
Copper - - 3.9 (6%) 0.1 (0%) - - 37.3 (59%) - - 41.3 (65%) General - - 0.0 (0%) 0.1 (0%) 4.4 (7%) 0.4 (1%) - - 4.9 (8%) Copper ores and concentrates - - 0.4 (1%) - - - - 4.3 (7%) - - 4.8 (7%)
Other Ore, Slag, Stone and Sand - - - - 2.3 (4%) 2.1 (3%) 0.2 (0%) - - 4.5 (7%)
Cement, Construction Material
- - - - - - 1.7 (3%) - - - - 1.7 (3%)
Others 0.4 (1%) 0.3 (0%) - - 3.4 (5%) 2.0 (3%) 0.1 (0%) 6.2 (10%) Total 0.4 (1%) 4.7 (7%) 2.5 (4%) 11.6 (18%) 44.2 (70%) 0.1 (0%) 63.5 (100%)
Source: Namport
Estimation of current transit
Table 4.36 shows a transit cargo volume between Walvis Bay Port and inland countries in 2013
calculated by data of Walvis Bay Port and customs database respectively. Transit cargo at Walvis
Bay Port is only incoming/ outgoing from/to neighbouring SADC countries, and the weight of
container cargo is calculated as 20 tons for 6 metres or 20feet container and 32 tons for 12 metres or
40feet container. Transit cargo volume by customs data consists of i) inbound, i.e., import from
other continents to southern African countries, ii) outbound, i.e., export from other southern African
countries to other continents, iii) transit cargo via overland transport, namely, regional freight flow in
southern Africa through Namibia, and iv) unknown such as transit cargo from Angola to Angola or
South Africa to South Africa.
The large difference of inbound/outbound transit cargo volume between statistics of Walvis Bay Port
and customs data is a serious problem. To estimate current transit cargo flow through Namibia based
on existing statistics and data,
• Statistics of Walvis Bay Port should be regarded as inbound and outbound transit cargo between SADC countries and other continents. However, some error such as minus value in the data should be fixed (waiting for a response of Namport).
• Transit cargo between SADC countries and other continents based on the customs database is significantly lower than statistics of Walvis Bay Port.
• Transit cargo in SADC region such as South Africa to Angola based on the customs database might be used as SADC regional transit flow if it can be checked and adjusted by AADT of heavy vehicle (waiting for a response of Road Authority).
• Current transit cargo flow through Namibia is estimated by cross-border cargo based on Namport’s statistics, and regional overland transit cargo flow based on customs data.

Master Plan for Development of an International Logistics Hub for SADC Countries in the Republic of Namibia Final Report Appendix
4-52
Table 4.36: Transit cargo volume in 2013 Unit: tons
No Commodities
Cross-border through Walvis Bay Port Transit based on customs data
Inbound (landed at Walvis Bay
Port)
Outbound (shipped at
Walvis Bay Port)
Inbound (landed at Walvis Bay
Port)
Outbound (shipped at
Walvis Bay Port)
Transit transport Unknown
1 Live Animals, Meat & Edible Meat Offal 26,740 84 79 0 176
2 Fish and Crustaceans 24,114 192 389 0 108 3 Vegetable and Fruits 64 0 2 0 3,404 4 Prepared Foodstuffs 21,974 688 34 0 1,143 3 5 Beverage 1,108 80 15 0 1,233 70
6 Cereals & Milling Industry Products 936 40 1 0 296
7 Animal Feed 52 0 0 0 113 8 Sugars & Sugar
Confectionery 153 9 0 0 151 9 Other Agricultural Products 128 0 44 0 2,195 10 Fertilizer 42 0 2 0 288 11 Petroleum, Oil and Gas 5,023 0 26 0 645 120
12 Copper ores and concentrates 0 4,756 0 0
13 Zinc ores and concentrates 0 0 0 0 14 Manganese ores and
concentrates 9 0 0 0 15 Coal 0 0 0 0 0 16 Salt 129 0 0 0 0 17 Marble, Fluorspar 20 0 12 0 5 18 Diamonds and other
precious stones, ore 0 0 0 0 151
19 Other Ore, Slag, Stone and Sand 0 4,532 0 0 1,353
20 Metal and Metal Products 1,583 140 46 47 3,036 48
21 Chemicals and Industrial Material 15,928 1,020 365 36 420 19
22 Garment, Textiles and fabric 6,860 280 78 1 872 2
23 Wood and Wood Products (ex.Wood charcoal) 20,600 52 9 0 1,677 1
24 Paper and Printed Matter 15,108 0 6 1 1,472 1
25 Cement, Construction Material 4,768 1,720 0 0 3,144 8
26 Household articles, Pharmaceutical products 40,524 996 431 4 4,564 1
27 Passenger Car, Truck, Motorcycle 221,274 34 32,027 92 1,373 980
28 Rail locomotive, coaches, Aircraft and Vessel 0 0 27 0 117
29 Machinery and Parts 97,463 1,109 3,743 66 5,168 257 30 Other unclassified goods 5,032 1,600 0 0 0 98 General Cargo 43,230 4,899 - - - - 99 Copper 1,540 41,328 - - - -
Total 554,401 63,559 37,338 247 33,102 1,510 Source: Cross-border through Walvis Bay Port is provided by Namport, Transit based on Customs Data is based on NSA.
4.3.1.4 Logistics flow in Namibia
Based on Namibian trade data as above, the composition of international freight volume relevant to
Namibia is summarized in Figure 4.453.
3 It should be noted, however, that following problems in data should be improved in order to more precisely illustrate

4. Logistics Network in SADC and Namibia
4-53
Note: Transhipment is based on fiscal year. Transit is based on Namport’s statistics and only transit cargo through Walvis Bay Port. Source: Export and import are based on customs data provided by NSA; transit and transhipment is based on Namport statistics.
Figure 4.45: International Freight Volume relevant to Namibia
4.3.1.5 Potential of transit cargo through Namibia
In view of geopolitics and socio-economics such as population distribution, Zambia is one of the most
important countries that has a potential of increasing transit cargo through Namibia.
As shown in Figure 4.46, major international trade partners of Zambia are Asia, South Africa and
DRC in terms of weight. Zambian trade with Europe and America is smaller than with those regions
but the import volume from Europe and America is 394 thousand ton (6.6 % of Zambia’s total import)
and export is 608 thousand ton (2.6% or Zambia’s total export) in 2013.
context of demand for logistics service in Namibia: i) Transit cargo data provided by NSA excludes some transit cargo such as copper from Zambia and volume of almost all commodities is underestimated. Therefore it should be used for only SADC regional transit cargo with adjustment by cargo truck volume; ii) Transhipment cargo volume should be updated (waiting for a response of Namport).

Master Plan for Development of an International Logistics Hub for SADC Countries in the Republic of Namibia Final Report Appendix
4-54
Figure 4.46: Zambian international trade in 2013
Note: Export of copper from Zambia to Switzerland is excluded because it differs from actual freight flow. .
Figure 4.47: Zambian trade volume with Europe and America
Table 4.37 shows the comparison of Zambian international trade with Europe/America and
cross-border cargo at Walvis Bay Port in 2013. International trade between Zambia and
Europe/America is estimated using both directions, namely, export/import data of Zambia with
Europe/America in 2013 and export/import data of Europe/America with Zambia in 2012 based on
UN ComTrade.
Transit cargo from Walvis Bay Port to Zambia is about 135 thousand tons (34% of Zambian import
from Europe/America) and transit from Zambia to Walvis Bay Port is 44 thousand tons (19% of export
from Zambia to Europe/America) in 2013.

4. Logistics Network in SADC and Namibia
4-55
Table 4.37: Transit Cargo between Walvis Bay and Zambia and Zambian Trade with Europe/America
Unit: tons
Commodity
Transit Cargo between Walvis Bay and Zambia in 2013 (tons)
Estimated Zambian international trade with Europe and America in 2013 (tons)
Transit from Zambia to Walvis Bay Port
Transit from Walvis Bay to Zambia
From Zambia to Europe and America
From Europe and America to Zambia
Live Animals, Meat & Edible Meat Offal 0 3,552 3 4,447 Fish and Crustaceans 32 12,616 9 179 Vegetable and Fruits 0 64 1,617 311 Prepared Foodstuffs 628 1,227 387 7,182 Beverage 80 268 51 456 Cereals & Milling Industry Products 40 0 339 7,726 Animal Feed 0 0 300 323 Sugars & Sugar Confectionery 0 0 117,769 2,256 Other Agricultural Products 0 128 12,521 620 Fertilizer 0 0 24 34,072 Petroleum, Oil and Gas 0 21 0 3,183 Copper ores and concentrates 4,336 0 1,443 0 Zinc ores and concentrates 0 0 150 0 Manganese ores and concentrates 0 0 3,994 0 Coal 0 0 0 100 Salt 0 59 0 7 Marble, Fluorspar 0 20 0 0 Diamonds and other precious stones, ore 0 0 1,568 10 Other Ore, Slag, Stone and Sand 192 0 228 110,481 Metal and Metal Products 0 570 28,783 17,840 (Copper) 37,328 840 27,507 20 Chemicals and Industrial Material 20 9,588 3,463 27,471 Garment, Textiles and fabric 160 180 17,308 11,672 Wood and Wood Products 32 252 103 116 Paper and Printed Matter 0 13,816 41 11,979 Cement, Construction Material 0 1,340 0 6,380 Household articles, Pharmaceutical products 760 2,344 12,067 27,381 (General cargo) 372 6,948 N/A N/A Passenger Car, Truck, Motorcycle 25 65,388 182 86,652 Rail locomotive, coaches, Aircraft and Vessel 0 0 22 779 Machinery and Parts 232 11,598 484 37,037 Other unclassified goods 0 3,908 29 156 Total 44,237 134,726 230,392 398,835
Note: Export of copper from Zambia to Switzerland is excluded because it is differ from actual freight flow. Source: Zambian international trade is based on UN ComTrade, transit cargo relevant to Walvis Bay Port is provided by Namport.
Some commodities in UN ComTrade such as sugar from Zambia to Europe/America is smaller than
actual flow; therefore, in further analysis on potential transit cargo through Namibia more reliable data
should be used.
4.3.2 Six different groups of cargo flows through the corridors in Namibia
Analyses of international trade and transit trade of Namibia, traded goods going though Namibia can
be classified into the following 6 groups. Groups from 1 to 4 are traditional flows of goods, and their
volume occupies a major portion of cargo flows in Namibia both in terms of value and volume.
“Group 5: flows between Walvis Bay and SADC inland countries” is rather new and still small but
rapidly increasing. The logistics industry in Namibia could find new opportunities for rapid growth

Master Plan for Development of an International Logistics Hub for SADC Countries in the Republic of Namibia Final Report Appendix
4-56
by expanding the transport volume of this group. Transporting goods of this group has better
prospects to promote new types of logistics industries, such as “supply depot warehouses of consumer
goods” in the middle to long-term.
Flows of group 6 have not been observed yet. However, there is potential that the southern regions
of Namibia could achieve self-sustaining economic growth by enhancing economic links with the
Northern Cape, together with efficient use of Lüderitz Port.
Group 1: flows for domestic demand
Route - WB to Trans-Kalahari to Windhoek - RSA to Trans-Kalahari and Trans-Orange to Windhoek
Mode Mostly road. Some portion by Rail. Demand Limited to population of 2 million. Supply Existing logistics bases in Walvis Bay/Swakopmund and Windhoek serve and meet the demand.
Prospects - Future demand depends upon population increase and level of consumption within Namibia. - More cargo could be shifted on the rail if it becomes a competitive option. This will remove immediate pressure on the
road infrastructure.
Group 2: flows for exports originating from Namibia
Route - Trans-Kalahari and Trans-Orange to RSA (beer & beef) - WB – Trans-Kalahari to RSA (not so much) - WB – to EU (fish) - WHK airport to Belgium, UK, Botswana (diamonds)
Mode All modes (it depends upon goods and market) Demand Relatively well established market Supply Existing logistics bases in Namibia serve and meet the demand.
Prospects - Future demand depends upon supply capacity of Namibia. - Vital importance for existing main industries, but its growth margin will be limited in terms of quantity.
Group 3: flows from South Africa to Angola (one-way “pipeline” transit)
Route - RSA – Trans-Kalahari – Trans-Cunene to Oshikango (and to Angola). (Consumer goods) - RSA – Trans-Orange – Trans-Cunene to Oshikango (and to Angola). (Perishable goods)
Mode Road
Demand - Serves southern part of Angola. - Stable demand for cargo originating in South Africa.
Supply South African Trucks in transit. (Need to confirm)
Prospects - No substantial changes in demand structure within 5-10 years. Per Capita income of Angola is already over US$5000,
thus demand structure is as mature as the one in Namibia. - There is no other alternative route to compete. (Need to confirm)
Group 4: flows from Walvis Bay to Angola (one-way transit) Route WB to Trans-Cunene to Oshikango. Mode Road Demand - Serves southern part of Angola.
- Demand for cargo originating from places other than South Africa. - The largest among the flows through WB and the corridors so far.
Supply Namibian Trucks. Prospects - No substantial changes in demand structure within 5-10 years. Per Capita income of Angola is already over US$5000,
thus demand structure is as mature as the one in Namibia.

4. Logistics Network in SADC and Namibia
4-57
- In the longer term (10 years and beyond), part of flows from Walvis Bay – Angola will shift to direct route to Angolan ports.
- Large portion of cargo could be shifted on the rail if sections between Walvis Bay to Otavi are rehabilitated and it becomes a competitive option. This will remove immediate pressure on the road infrastructure.
Group 5: flows between Walvis Bay and SADC inland countries (Zambia, DRC, Zimbabwe) Route WB to WLNDC to Katima Mulilo and to Lusaka (Zambia) and Lubumbashi (DRC). Mode Road Demand - DRC: everything is imported.
- Zambia-Copperbelt: inbound (inputs for copper mines), outbound (copper and copper processed products). - Zambia-Lusaka: inbound (consumer goods, inputs for manufacturing, second-hand cars), outbound (sugar, soybean,
timber). - Use of Namibian route is increasing but still very small to be recognized as a substantial player. - Frozen fish, chicken from Walvis Bay to Zambia and DRC. - Second Hand Cars to Zambia and Zimbabwe (on own wheels).
Supply - Namibian route is, in general, not competitive at the moment. Many logistics players believe that direct freight cost through Namibia is much higher than the other routes (Ports of Dar es Salaam and Beira). The route to South -Africa has been dominant as its gateway function to export copper and its supply depot functions for the whole region.
- Current volume is too small. It is suspected that most of (not all) of the Namibian logistics industry, which is small, is satisfied with serving demand from current domestic market and not really interested in this market (need to confirm).
- Namibian Trucks are seen as expensive. - Zambian Trucks often find no return cargo to pick up in Walvis Bay. - Second hand vehicles are increasing but mode of transport is “on its own wheels”.
Prospects - Immediate term, Namibia route should get more volume as soon as possible. - Immediate targets are copper industry related flows of cargo. - Short to mid term, put focus on cargo flows between EU/US and Zambia/DRC. - Supply of trucks for international transit movementsshould be increased dramatically by establishing closer alliance with
logistics industry in neighbouring countries. - There will be substantial changes in demand structure within 5-10 years. Per Capita income of Zambia is still less than
US$5,000, thus demand structure will change as the income level rises. - Road transport will be the main mode in the short to mid term (say until throughput is tripled). When the volume
reaches the point where Namibia is recognized to be a substantial player, modal shift to rail will be realistic.
Group 6: flows between Northern Cape to Lüderitz Route Northern Cape (RSA) – Trans-Orange - Lüderitz Mode Mostly road. Expected to shift some to rail after completion of extension of railway into the port. Demand Limited to fish and zinc export originating in Namibia. Supply Existing logistics bases in Lüderitz serve and meet the present demand. Only 1/3 of the port capacity is used. Prospects - Future demand depends upon how far Lüderitz can capture potential demand in Northern Cape, RSA.
- Most cargo could be shifted by rail if it becomes a competitive option, especially for mining products both in Namibia (zinc) and Northern Cape (manganese).
- It is very important to be tactically flexible and progressive to involve any possible FDIs to develop the Port of Lüderitz and rail network.
4.3.2.1 Volume of six groups of cargo flows along the corridors
Volumes of above-mentioned 6 groups of cargo flows along the corridors in Namibia are illustrated in
the following figure and table. It is clearly seen that flows between Namibia and South Africa
dominate and presumed to account for around 70% of the current logistics market in terms of volume.

Master Plan for Development of an International Logistics Hub for SADC Countries in the Republic of Namibia Final Report Appendix
4-58
Source: Estimates in Namibia Integrated Transport Master Plan (2013)
Figure 4.48: Trade volume along the Corridors in Namibia
4.4 Distance and transit time between gateway port and inland countries
Figure 4.49 shows location of major towns in inland countries and 3 ports (Walvis Bay, Durban and
Dar es Salaam). Distances between gateway port and inland countries are indicated in Figure 4.50,
and Transit time between gateway port and inland countries are indicated in Figure 4.51, respectively.
Namibia-RSA 3.2�
Namibia-RSA (via Botswana)
2.2�
Walvis Bay-Zambia 0.7�
0.2 Namibia-Zambia�
Walvis Bay-Angola 0.6�
Angola-RSA 0.6�
0.6 Walvis
Bay-WHK �
Namibia-RSA (G1+2)
Angola-RSA (Group3)
Walvis Bay-WHK (Group 1)
Walvis Bay-Angola (Group 4) Walvis Bay-Zambia (Group 5)
Lüderitz-RSA (Group 6)
0.4�
0.2�
Angola� Zambia�
Botswana�
South Africa (RSA)�
Katima Mulilo�
Oshikango�
Tsumeb�
Nakop�
Noordoewer�
Windhoek�
Keetmanshoop�
Karibib�
Buitepos�
Otjiwarongo�
Okahandja�
Grunau�
Walvis Bay�
Lüderitz�
Numbers are in million tons/ year.

4. Logistics Network in SADC and Namibia
4-59
Figure 4.49: Trucking route with inland countries from gateway port at southern Africa

Master Plan for Development of an International Logistics Hub for SADC Countries in the Republic of Namibia Final Report Appendix
4-60
Figure 4.50: Distance of 3 ports and major cities in inland countries

4. Logistics Network in SADC and Namibia
4-61
Figure 4.51: Transit Time between 3 ports and major cities in inland cuntries
Master Plan for Development of an International Logistics Hub for SADC Countries in the Republic of Namibia Final Report Appendix
4-62
Table 4.38: Distance between Walvis Bay and Ndolaand Lubunbashi
Walvis Bay Kolwezi via Katima
Mulilo Distance Time days Road condition Documents required at the
border Namibia Walvis Bay port 1
Walvis Bay to Karibib Karibib to Otliwarongo
210 193
C - Good C - Good
Ottiwarongo to Otavi 119 C - Good Otavi to Wenela 865 C - Good 1,387 2
Border post Wenela Sesheke 0.5
Manifest Commercial Invoice F178 goods over R50,000 SAD 500 (Bill of entry) SADC 500 (Certificate) Packing list
Zambia Sesheke to Livingstone 195 C - Good Livingstone to Lusaka 476 C - Good Lusaka to Kapiri Mposhi 206 C - Good
Kapiri Mposhi to Kitwe Kitwe to Chililabombwe Chililabombwe to Kasumbalesa
153 76 22
C - Good / Fair C - poor C - Poor / Fair
1130 2
Border post Kasumbulesa 3
Manifest, original bill, bill/L, BIVAC certificate, maritime and road insurances cross border transport permit delivered by origin truck country. International road permit
DRC Kasumbalesa to Lubumbashi Lubumbashi to Likasi
88 124
C - Good C - Good
Likasi to Kolwezi 185 E - Good 397 2 Totals 2914 10.5 Source: Africa Road Corridors handbook
Table 4.39: Cost between Walvis Bay and Ndola and Lubumbashi
Description of charge Costs
Remarks Local currency
Local transporters
Foreign transporters
Namibia N$ US$ N$ N$ Harbour permit per 6mths 2009 361 35 361 361 Diesel cost 7 975 10,009 10,009
Visa 390 38 0 390 Burundi, DRC, Rwanda, Uganda
Carrier licence per annum for all Trucks 1,200 117 0 1,200 Department for Permits
+264 284 7000
Mass distance per 100km 34,000kg 0 24 0 250 US$9 per 100km rounded
Drive left side of the road
Total 1,189 10,369 12,209 Border post Customs Immigration Zambia Kwacha US$ US$ US$ None for SADC Countries
Diesel cost 7,377 1,765 1,765 1,765 Foreigners are allowed 90 days per year
Visa 0 0 0 0
Carrier licence per annum for all Trucks 1,200 117 0 117
Yellow card over 7months truck/ tractor 350,000 67 67 67
Yellow card over 7mtonhs trailer 0 0 0 0 A mobile ZRA unit operates on the 65km stretch
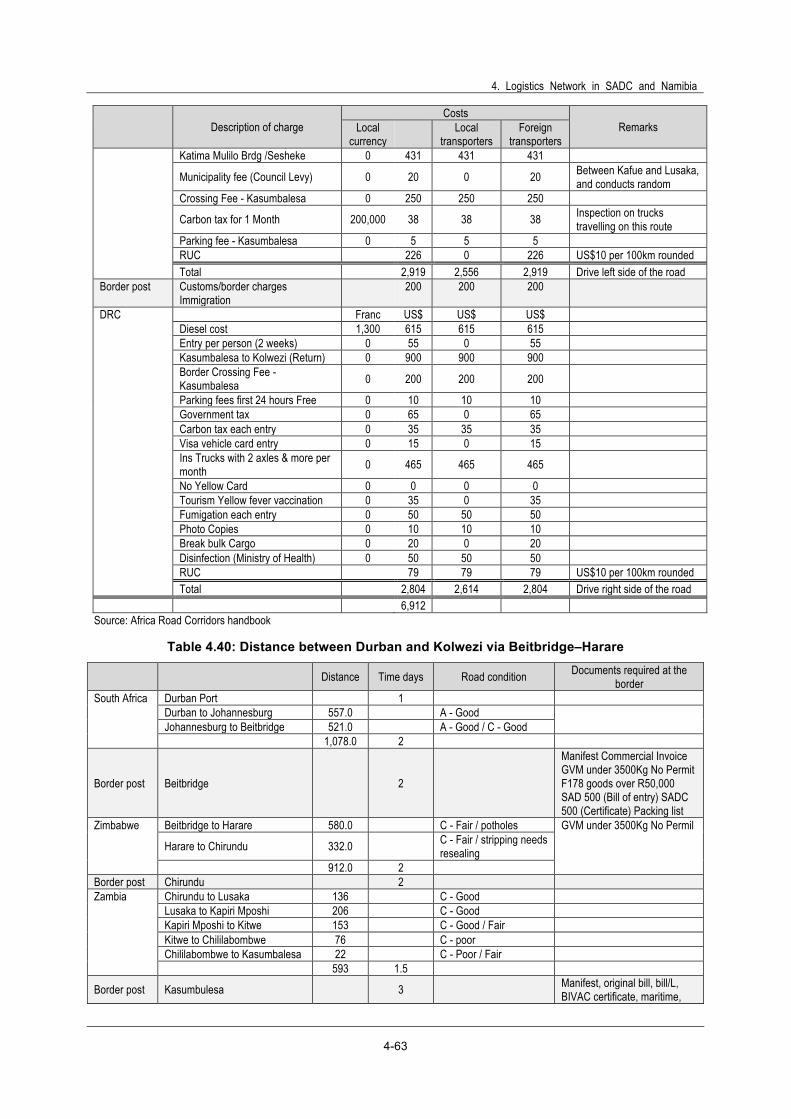
4. Logistics Network in SADC and Namibia
4-63
Description of charge Costs
Remarks Local currency
Local transporters
Foreign transporters
Katima Mulilo Brdg /Sesheke 0 431 431 431
Municipality fee (Council Levy) 0 20 0 20 Between Kafue and Lusaka, and conducts random
Crossing Fee - Kasumbalesa 0 250 250 250
Carbon tax for 1 Month 200,000 38 38 38 Inspection on trucks travelling on this route
Parking fee - Kasumbalesa 0 5 5 5 RUC 226 0 226 US$10 per 100km rounded
Total 2,919 2,556 2,919 Drive left side of the road Border post Customs/border charges 200 200 200 Immigration DRC Franc US$ US$ US$ Diesel cost 1,300 615 615 615 Entry per person (2 weeks) 0 55 0 55 Kasumbalesa to Kolwezi (Return) 0 900 900 900
Border Crossing Fee - Kasumbalesa 0 200 200 200
Parking fees first 24 hours Free 0 10 10 10 Government tax 0 65 0 65 Carbon tax each entry 0 35 35 35 Visa vehicle card entry 0 15 0 15
Ins Trucks with 2 axles & more per month 0 465 465 465
No Yellow Card 0 0 0 0 Tourism Yellow fever vaccination 0 35 0 35 Fumigation each entry 0 50 50 50 Photo Copies 0 10 10 10 Break bulk Cargo 0 20 0 20 Disinfection (Ministry of Health) 0 50 50 50 RUC 79 79 79 US$10 per 100km rounded
Total 2,804 2,614 2,804 Drive right side of the road
6,912 Source: Africa Road Corridors handbook
Table 4.40: Distance between Durban and Kolwezi via Beitbridge–Harare
Distance Time days Road condition Documents required at the border
South Africa Durban Port 1 Durban to Johannesburg 557.0 A - Good Johannesburg to Beitbridge 521.0 A - Good / C - Good 1,078.0 2
Border post Beitbridge 2
Manifest Commercial Invoice GVM under 3500Kg No Permit F178 goods over R50,000 SAD 500 (Bill of entry) SADC 500 (Certificate) Packing list
Zimbabwe Beitbridge to Harare 580.0 C - Fair / potholes GVM under 3500Kg No Permil
Harare to Chirundu 332.0 C - Fair / stripping needs resealing
912.0 2 Border post Chirundu 2 Zambia Chirundu to Lusaka 136 C - Good Lusaka to Kapiri Mposhi 206 C - Good Kapiri Mposhi to Kitwe 153 C - Good / Fair Kitwe to Chililabombwe 76 C - poor Chililabombwe to Kasumbalesa 22 C - Poor / Fair 593 1.5 Border post Kasumbulesa 3
Manifest, original bill, bill/L, BIVAC certificate, maritime,

Master Plan for Development of an International Logistics Hub for SADC Countries in the Republic of Namibia Final Report Appendix
4-64
Distance Time days Road condition Documents required at the border
and road insurances cross border transport permit Delivered by origin truck country, International road permit
DRC Kasumbalesa to Lubumbashi 88 C - Good Lubumbashi to Likasi 124 C - Good Likasi to Kolwezi 185 E - Good 397 2 Total 2980 15.5 Source: Africa Road Corridors handbook
Table 4.41: Cost between Durban and Kolwezi via Beitbridge - Harare
Description of charge Costs
Remarks Local currency
Local transporters
Foreign transporters
South Africa Rand US$ Rand Rand Harbour permit per year 2009 225 22 225 225 Diesel cost 12.4 1,425 14,704 14,704 Visa 0 0 0 0 Transport permit 2,660 258 2,660 2,660 Permit application Fee 760 74 760 760 Fuel levy applicable 40 cents per litre 0 0 0 0 Durban - Marianhill (Intertoll) 60 6 60 60 Toll - Marianhill -Joburg (Tolcon) 1,292 125 1,292 1,292 Toll - Joburg-Warmbaths (Bakwena) 338 8 338 338 Toll - Warmbaths-Beitbridge (Intertoll) 1,086 105 1,086 1,086 Total 1,909 19,701 19,701 Drive left side of the road
Border post Customs Immigration
Zimbabwe Zimbabwe
dollar US$ US$ US$ VISA
Diesel cost 0 1,104 1,104 1,104 None for SADC Countries
Visa 0 0 0 0 Application and Permit for Bi-Literal & COMESA
Carriers licence (COMESA & B/L) 0 150 150 0 Application US$150 and Permit US$500
Carriers licence 28 days Bots & Tanzania 0 500 0 500
Yellow card over 7months truck/ tractor 0 120 120 120
No movement of Dangerous Goods 18hrs - 06hrs
Yellow card over 7months trailer 0 0 0 0 New Limp Bridge per crossing 0 27 27 27 Carbon tax Horse pm 0 30 30 30 Carbon tax Trailer pm 0 10 10 10 Goods inspection fee 0 25 25 25 Parking fee per night 0 5 5 5
RUC Beitbridge - Chirundu 182 0 182 US$10 per 100km rounded
Total 2,153 1,471 2,003 Drive left side of the road
Border post Customs Immigration
Zambia Kwacha US$ US$ US$ Diesel cost 7377 926 926 926 None for SADC Countries
Visa 0 0 0 0 Foreigners are allowed 90 days per year
Carriers license per year 586000 113 113 113
Yellow card over 7months truck/ tractor 350000 67 67 67
Yellow card over 7months trailer 0 0 0 0 A mobile ZRA unit

4. Logistics Network in SADC and Namibia
4-65
Description of charge Costs
Remarks Local currency
Local transporters
Foreign transporters
operates on the 65km stretch
Municipality fee (council levy) 0 20 0 20 Between Kafue and Lusaka, and conducts random
Crossing Fee - Kasumbalesa 0 250 250 250
Carbon tax US$ per Month 200,000 38 38 38 Inspection on trucks travelling on this route
Parking fee - Kasumbalesa 0 5 5 5
RUC Chirundu - Kasumbalesa 119 0 119 US$ 10 per 100km rounded
Total 1538 1399 1538 Drive left side of the road Border post Customs/border charges 200 200 200 Immigration
DRC
Franc US$ US$ US$ Diesel cost 1300 615 615 615 Entry per person (2 weeks) 0 55 0 55 Kasumbalesa to Kolwezi (Return) 0 900 900 900 Border Crossing Fee - Kasumbalesa 0 200 200 200 Parking fees first 24 hours free 0 10 10 10 Government tax 0 65 0 65 Carbon tax each entry 0 35 35 35 Visa vehicle card entry 0 15 0 15 Ins trucks with 2 axles & more per month 0 465 465 465 No Yellow Card 0 0 0 0 Tourism yellow fever vaccination 0 35 0 35 Fumigation each entry 0 50 50 50 Photocopies 0 10 10 10 Break bulk Cargo 0 20 0 20
Disinfection (Ministry of Health) 0 50 50 50 RUC 79 79 79 US$10 per 100km
rounded
2804 2614 2804 Drive right side of the road
8405 Source: Africa Road Corridors handbook
Table 4.42: Distance between Dar es Salaam and Lusaka
Distance
Time days Road condition
Documents required at the border
Tanzania Dar es Salaam Port
2
Dar es Salaam to Morogoro 195
C - Good
Morogoro to Iringa 298
C - Good / Fair / Poor
Iringa to Uyole 285
C - Fair
Uyole to Tunduma 108
E - Good
886 3 T
Border post Tunduma Nakonde
2
Manifest Commercial Invoice F178 goods over R50,000 SAD 500 (Bill of entry) SADC 500 (Certificate) Packing list, C45 C65 Customs Licence
Zambia Nakonde to Mpika 359
C - Poor / Potholed
Mpika to Serenje 236
C - Poor / Potholed
Serenje to Kapin Mposhi 205
C - Good
Kapiri Mposhi to Lusaka 206
C - Good
1,006 2 T
Totals 1,892 9 A
Source: Africa Road Corridors handbook
Master Plan for Development of an International Logistics Hub for SADC Countries in the Republic of Namibia Final Report Appendix
4-66
Table 4.43: Cost between Dar es Salaam and Lusaka
Description of Charge Costs Local
currency Local
transporters Foreign
transporters Remarks
Tanzania Shilling US$ US$ US$ Harbour permit per year 2009 Diesel cost 1,400 844 844 844
P/port valid over 6 months/ yellow fever 80,850 50 0 50 Visa Burundi, DRC,
Rwanda, South Africa
Transport permit trailer expire in 31 December 485,100 300 300 300
No movement of dangerous goods 18 hrs – 06 hrs
Yellow card over 7 months truck/tractor 0 0 0 0
Yellow card over 7 months trailer 0 0 0 0
RUC 284 0 284 US$16 per 100km rounded
Total 1477 1144 1477 Drive left side of the road Border post Customs/border charges 125 125 125 Immigration Zambia Kwacha US$ US$ US$
Diesel cost 7377 1571 1571 1571 None for SADC Countries
Visa 0 0 0 0 Foreigners are allowed 90 days per year
Carriers license per year 586000 113 113 113 Tanzanian Vehicles
Yellow card over 7 months truck/tractor 350000 67 67 67
Yellow card over 7 months trailer 0 0 0 0
Municipality fee (council levy) 0 20 0 20 Carbon Tax US$ 1 Month 0 38 12 12
Parking Nakonde per day - Zamesco 0 24 24 24
Tanzania vehicles US$16 per 100km rounded
RUC 322 0 322 SADC US$10 per 100km rounded
Total 2280 1913 2254 Drive left side of the road
3758 3056 3732 Source: Africa Road Corridors handbook
4.5 Review of the transport network model of the “National, Regional and International Integrated Transport Master Plan”
To contribute to consideration and evaluation of the proposed national transport program in the
“Namibia Integrated Transport Master Plan (hereinafter referred to as “Transport Master Plan”)”, the
existing and future traffic demand regarding road and rail transport include both passenger and freight
flows in Namibia are forecast using the conventional four step demand forecast model consisting of a
trip generation model, trip distribution model, modal split model and assignment model.
4.5.1 Zoning system
In the Transport Master Plan, a traffic analysis zone system is defined to estimate traffic generation
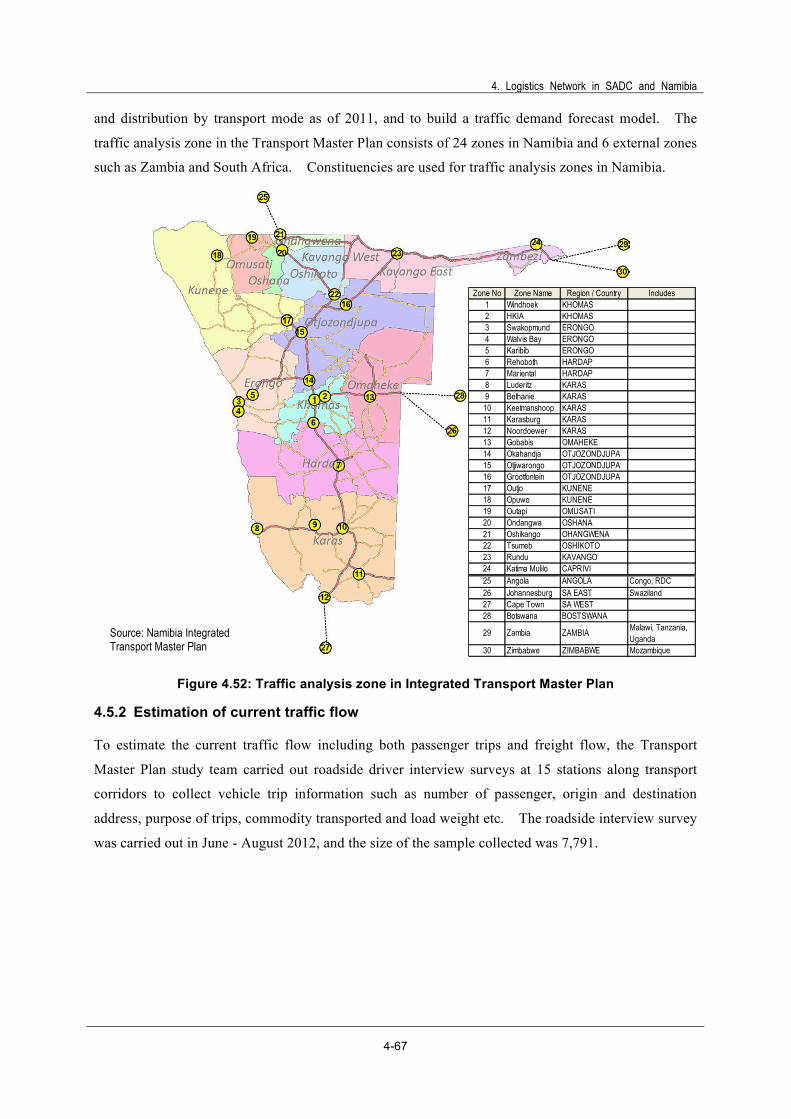
4. Logistics Network in SADC and Namibia
4-67
and distribution by transport mode as of 2011, and to build a traffic demand forecast model. The
traffic analysis zone in the Transport Master Plan consists of 24 zones in Namibia and 6 external zones
such as Zambia and South Africa. Constituencies are used for traffic analysis zones in Namibia.
Figure 4.52: Traffic analysis zone in Integrated Transport Master Plan
4.5.2 Estimation of current traffic flow
To estimate the current traffic flow including both passenger trips and freight flow, the Transport
Master Plan study team carried out roadside driver interview surveys at 15 stations along transport
corridors to collect vehicle trip information such as number of passenger, origin and destination
address, purpose of trips, commodity transported and load weight etc. The roadside interview survey
was carried out in June - August 2012, and the size of the sample collected was 7,791.
Zone No Zone Name Region / Country Includes1 Windhoek KHOMAS2 HKIA KHOMAS3 Swakopmund ERONGO4 Walvis Bay ERONGO5 Karibib ERONGO6 Rehoboth HARDAP7 Mariental HARDAP8 Luderitz KARAS9 Bethanie KARAS
10 Keetmanshoop KARAS11 Karasburg KARAS12 Noordoewer KARAS13 Gobabis OMAHEKE14 Okahandja OTJOZONDJUPA15 Otjiwarongo OTJOZONDJUPA16 Grootfontein OTJOZONDJUPA17 Outjo KUNENE18 Opuwo KUNENE19 Outapi OMUSATI20 Ondangwa OSHANA21 Oshikango OHANGWENA22 Tsumeb OSHIKOTO23 Rundu KAVANGO24 Katima Mulilo CAPRIVI25 Angola ANGOLA Congo, RDC26 Johannesburg SA EAST Swaziland27 Cape Town SA WEST28 Botswana BOSTSWANA
29 Zambia ZAMBIA Malawi, Tanzania,Uganda
30 Zimbabwe ZIMBABWE Mozambique
Source: Namibia Integrated Transport Master Plan (2013)
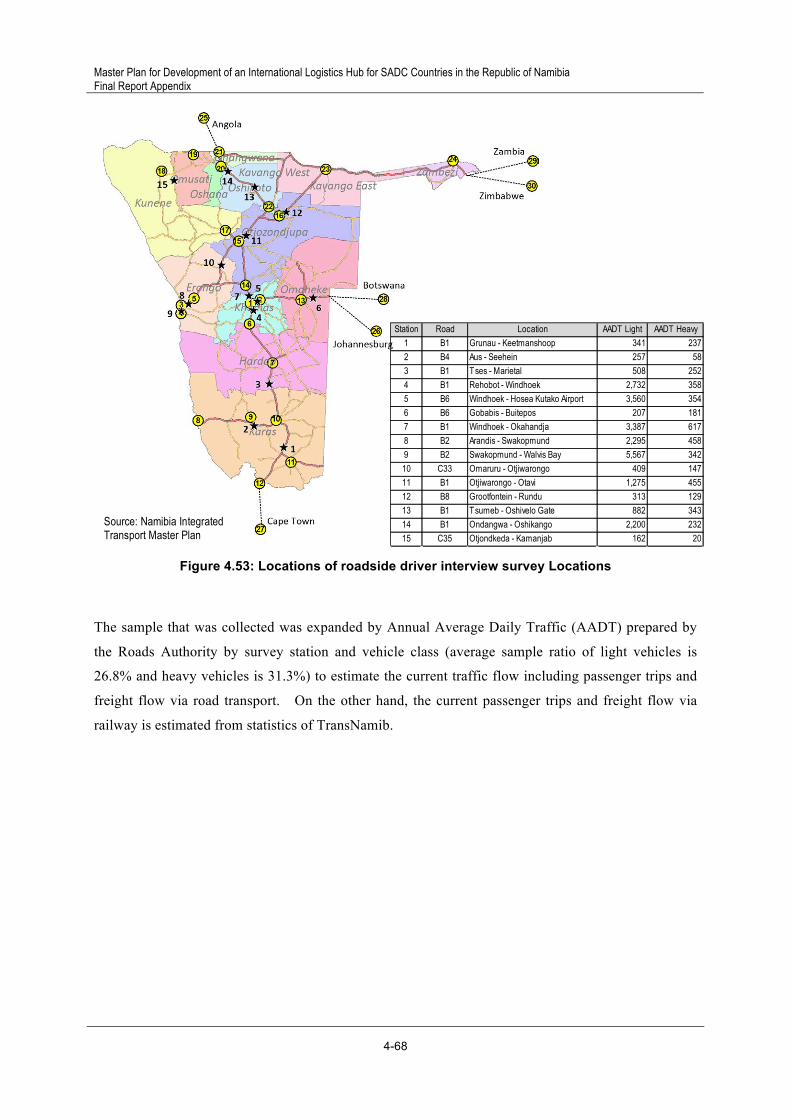
Master Plan for Development of an International Logistics Hub for SADC Countries in the Republic of Namibia Final Report Appendix
4-68
Figure 4.53: Locations of roadside driver interview survey Locations
The sample that was collected was expanded by Annual Average Daily Traffic (AADT) prepared by
the Roads Authority by survey station and vehicle class (average sample ratio of light vehicles is
26.8% and heavy vehicles is 31.3%) to estimate the current traffic flow including passenger trips and
freight flow via road transport. On the other hand, the current passenger trips and freight flow via
railway is estimated from statistics of TransNamib.
Station Road Location AADT Light AADT Heavy1 B1 Grunau - Keetmanshoop 341 2372 B4 Aus - Seehein 257 583 B1 Tses - Marietal 508 2524 B1 Rehobot - Windhoek 2,732 3585 B6 Windhoek - Hosea Kutako Airport 3,560 3546 B6 Gobabis - Buitepos 207 1817 B1 Windhoek - Okahandja 3,387 6178 B2 Arandis - Swakopmund 2,295 4589 B2 Swakopmund - Walvis Bay 5,567 34210 C33 Omaruru - Otjiwarongo 409 14711 B1 Otjiwarongo - Otavi 1,275 45512 B8 Grootfontein - Rundu 313 12913 B1 Tsumeb - Oshivelo Gate 882 34314 B1 Ondangwa - Oshikango 2,200 23215 C35 Otjondkeda - Kamanjab 162 20
Source: Namibia Integrated Transport Master Plan (2013)

4. Logistics Network in SADC and Namibia
4-69
Source: Namibia Integrated Transport Master Plan, 2013
Figure 4.54: Estimated current traffic volume in Integrated Transport Master Plan
4.5.3 Demand forecast model
Future person trips and freight flow is basically forecast by (i) trip generation model to calculate the
number of passenger trips and freight volume leaving and arriving at each traffic analysis zone, (ii)
trip distribution model to calculate the number of passenger trips and freight volume from one traffic
analysis zone to another zone called OD volume, (iii) modal split model to decide the share of
passenger trips and freight volume of different transport modes from one zone to another, and (iv)
traffic assignment model for calculating the number of passenger trips and freight volume by
alternative route from origin zone to destination zone in the transport network in accordance with
travel time and cost between two zones.
In the Transport Master Plan, future person trip generation at each traffic analysis zone is calculated
by the annual population growth rate by region defined by United Nations’ Population Forecast.
Details of the person trip distribution model are not indicated in the Transport Master Plan report.
However, the present pattern seems to be adapted to future person trip OD. The modal split model
for person trip seems to be ignored because of the low number of railway passengers (average daily
railway passengers in 2011 was about 200 passengers/day). Forecast future person trip OD is
converted to passenger vehicle OD by vehicle composition and vehicle occupancy which means a ratio
of vehicle type and number of passengers per vehicle. Forecast future vehicular OD for passenger
vehicles is assigned on the shortest route between origin zone and destination zone in the road network
decided by travel time and travel cost by road link in accordance with actual distance, structure and
condition of each road link.
Estimated Average Daily Traffic Volume in 2011 (vehicles in both directions)
Estimated Average Daily Freight Volume by Railway in 2011 (tons by section)

Master Plan for Development of an International Logistics Hub for SADC Countries in the Republic of Namibia Final Report Appendix
4-70
Freight flow is divided into (i) domestic which is export/import to/from SADC countries, (ii) regional
trade in SADC, and (iii) transit cargo through Namibia according to the Transport Master Plan.
In the Transport Master Plan, export and import to/from SADC is calculated by elasticity of trade
volume to GDP growth rate. The Transport Master Plan study team calculated that the annual GDP
growth rate of Namibia is 5.5% and elasticity of trade volume to GDP is 1.5, as a result, annual growth
rate of trade volume relevant to Namibia and SADC is 8.25% p.a.
According to the Transport Master Plan, the future trade volume within SADC is based on the
estimation of “Definition and Investment Strategy for a Core Strategic Transport Network for Eastern
and Southern Africa (PPAIF, 2011)”. The future trade in SADC is, according to the PPIAF report,
forecast by following flow chart.
Figure 4.55: Trade flows forecast in SADC in Integrated Transport Master Plan

4. Logistics Network in SADC and Namibia
4-71
In the PPIAF report, a regional transport model is built for choice of transport corridor and transport
mode such as road or railway in order to estimate freight volume and evaluate corridor development.
The transport model is developed based on forecast future trade matrices in SADC. The Regional
transport model is estimated by the following factors.
• Trade volume after a decade,
• Network component characteristics and strategic priority rating including service area,
• Traffic volume in 2030,
• Potential traffic,
• Development potential,
• Infrastructure capacity,
• Redundancy support,
• Network condition, and
• Strategic priority rating and total score.
The Transport Master Plan study team reviewed the future corridor freight volume forecast by the
PPIAF report and compared it with available data on Namibia such as foreign trade statistics, heavy
traffic volumes near borders and transit freight volume prepared by WBCG. According to that,
PPIAF’s future freight volume by corridor has some anomalies such as,
• Trans-Orange is not covered in the PPIAF study.
• Future freight demand of WNLDC is overestimated, and
• SADC regional freight demand for Trans-Cunene is underestimated.
For these reasons, the Transport Master Plan study team modified PPIAF’s future freight demand by
corridor as follows,
• Freight volume of Trans-Orange is estimated by the difference between total export/import volume of Namibia and the aggregate of export/import volume of three corridors and seaborne freight.
• The balance of Trans-Cunene and WNLDC is modified under total of future freight demand forecast of those two corridors by PPAIF report.
4.5.4 Future freight demand
Table 4.44 shows the results of future freight demand forecast in the Transport Master Plan.
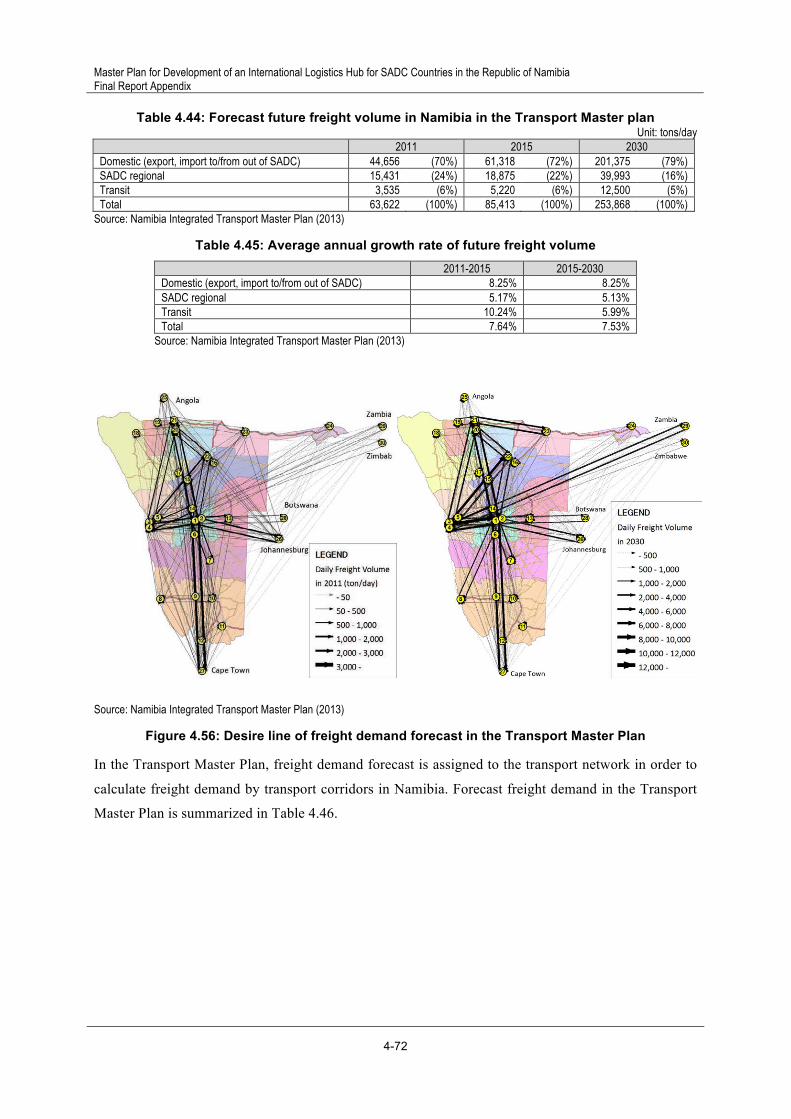
Master Plan for Development of an International Logistics Hub for SADC Countries in the Republic of Namibia Final Report Appendix
4-72
Table 4.44: Forecast future freight volume in Namibia in the Transport Master plan Unit: tons/day
2011 2015 2030 Domestic (export, import to/from out of SADC) 44,656 (70%) 61,318 (72%) 201,375 (79%) SADC regional 15,431 (24%) 18,875 (22%) 39,993 (16%) Transit 3,535 (6%) 5,220 (6%) 12,500 (5%) Total 63,622 (100%) 85,413 (100%) 253,868 (100%)
Source: Namibia Integrated Transport Master Plan (2013)
Table 4.45: Average annual growth rate of future freight volume
2011-2015 2015-2030 Domestic (export, import to/from out of SADC) 8.25% 8.25% SADC regional 5.17% 5.13% Transit 10.24% 5.99% Total 7.64% 7.53%
Source: Namibia Integrated Transport Master Plan (2013)
Source: Namibia Integrated Transport Master Plan (2013)
Figure 4.56: Desire line of freight demand forecast in the Transport Master Plan
In the Transport Master Plan, freight demand forecast is assigned to the transport network in order to
calculate freight demand by transport corridors in Namibia. Forecast freight demand in the Transport
Master Plan is summarized in Table 4.46.

4. Logistics Network in SADC and Namibia
4-73
Table 4.46: Forecast trade volume along the Corridors in Namibia Unit: million tons/year
2011 Average annual
growth rate 2011-2015
2015 Average annual
growth rate 2015-2030
2030
Trans-Orange (Noordoewer / Nakop – Grünau) 3.595 5.5% 4.451 14.9% 7.768
Transit traffic from landlocked countries 0 N/A 0 N/A 0
Regional trade (road + rail) 3.595 5.5% 4.451 14.9% 7.768
Namibia-South Africa 3.232 4.9% 3.921 15.3% 6.928
Angola-South Africa 0.363 9.9% 0.530 12.2% 0.841 Trans-Kalahari (Buitepos - Windhoek) 2.456 5.5% 3.039 14.9% 5.295
Transit traffic from landlocked countries 0.013 11.4% 0.020 36.8% 0.070
Regional trade 2.443 5.4% 3.019 14.7% 5.225
Namibia / Botswana 0.046 2.6% 0.051 -2.5% 0.046
Namibia-South Africa 2.155 4.9% 2.614 15.3% 4.618
Angola-South Africa 0.242 9.9% 0.353 12.3% 0.561 WNLDC (Tsumeb - Katima Mulilo) 0.899 13.8% 1.510 28.0% 4.050
Transit traffic from landlocked countries 0.724 14.9% 1.260 30.0% 3.600
Regional trade (Namibia / Zambia - DRC - Zimbabwe) 0.175 9.3% 0.250 15.8% 0.450 Trans-Cunene (Tsumeb - Oshikango) 1.254 8.7% 1.752 9.5% 2.520
Transit traffic to Angola 0.574 8.7% 0.800 6.5% 1.030
Regional trade 0.680 8.8% 0.952 11.9% 1.490
Namibia / Angola 0.075 -2.1% 0.069 6.6% 0.089
Angola-South Africa 0.605 9.9% 0.883 12.2% 1.401 Source: Namibia Integrated Transport Master Plan (2013)
Table 4.47: Trade volume along the corridors in Namibia
Cargo Volume (million tons/year, 2011)
Trans-Orange (Noordoewer/Nakop - Grünau) 3.6
Transit traffic from landlocked countries 0.0
Regional trade (road + rail) 3.6
Namibia-South Africa (G1+2) 3.2
Angola-South Africa (G3) 0.4 Trans-Kalahari (East: Buitepos - Windhoek) 2.5
Transit traffic from landlocked countries 0.0
Regional trade 2.4
Namibia / Botswana (G5) 0.0
Namibia-South Africa (G1+2) 2.2
Angola-South Africa (G3) 0.2 Trans-Kalahari (West: Walvis Bay - Windhoek) (G1) 0.6 Trans-Caprivi (Tsumeb - Katima Mulilo) 0.9
Transit traffic from landlocked countries (G5) 0.7
Regional trade (Namibia/Zambia - DRC - Zimbabwe) 0.2 Trans-Cunene (Tsumeb - Oshikango) 1.3
Transit traffic to Angola (G4) 0.6
Regional trade 0.7
Namibia/Angola 0.1
Angola-South Africa (G3) 0.6 Total 8.8
Source: Estimates in Namibia Integrated Transport Master Plan (2013)