3FEVDUJPO PG TVMQIVS MJNJUT JO BWJBUJPO GVFM … · Draft 0.1 17/07/2009 Draft Interim report for...
91
Transcript of 3FEVDUJPO PG TVMQIVS MJNJUT JO BWJBUJPO GVFM … · Draft 0.1 17/07/2009 Draft Interim report for...

Research project EASA.2008/C11
Reduction of sulphur limits in aviation fuel standards (SULPHUR)
11 January 2010

Copyright © EASA 2009
This document is supplied by QinetiQ for the European Aviation Safety Agency (EASA) under contract number R.2008.C11
Reduction of sulphur limits in aviation fuel standards (SULPHUR)
QinetiQ/09/01835 Issue 1.1 11/01/2010

QinetiQ/09/01835 Page 2
Disclaimer
The information provided in the Report includes the personal views or recommendations of the respective authors, and does not necessarily reflect the views of EASA, or indicate a commitment to a pa rticular course of action. The material is not a substitute for current legisl ative and regulatory provisions.
Ownership of all copyright and other intellectual p roperty rights in this material including any documentation, data and tech nical information, remains vested to the European Aviation Safety Agen cy. Reproduction, or use of this material, must be authorized by express written permission from the European Aviation Safety Agency. The Agency sha ll always be acknowledged as the copyright owner of the informat ion.

QinetiQ/09/01835 Page 3
Administration page Customer Information
Customer reference number R.2008.C11
Project title Sulphur Reduction in Aviation Fuel
Customer Organisation European Aviation Safety Agency (EASA)
Customer contact Stephen Arrowsmith and Erika Herms
Contract number R.2008.C11
Milestone number
Date due 21/09/2009
Authors
Mike Miller
01252 396435 [email protected]
Cody Technology Park, Room 2008, Building A7, Ively Road, Farnborough, Hampshire GU14 0LX
Peter Brook
01252 397072 [email protected]
Cody Technology Park, Room 1005, Building A7, Ively Road, Farnborough, Hampshire GU14 0LX
Chris Eyers
01252 392269 [email protected]
Cody Technology Park, Room 2008, Building A7, Ively Road, Farnborough, Hampshire GU14 0LX
Release Authority
Name Simon Dodd
Post Project Manager
Date of issue 21/09/2009
Record of changes
Issue Date Detail of Changes
Draft 0.1 17/07/2009 Draft Interim report for EASA comment
Draft 0.2 04/09/2009 Draft Final report
1 21/09/2009 Final report
1.1 11/01/2010 Updated Figures 5-1 and 5-2 to include newly released (2008) data


QinetiQ/09/01835 Page 5
Executive summary
The objective of the work described in this report is to investigate the reduction of sulphur limits in aviation fuel by assessing and where possible quantifying the impact that would be made upon relevant aircraft hardware, the environment, human health and associated facets.
The current upper value as stipulated by Defence Standard 91-91 and ASTM D1655 is 3000ppm(m) whilst there is no mandatory minimum value. However, the mean fuel sulphur concentration within the United Kingdom and the United States is significantly lower than the stipulated maximum value and is about 600-800 ppm(m).
To assess the effect of a reduction in aviation fuel sulphur concentration investigations have been made under the following headings:
• Global and local environmental effects including the impact upon human
mortality • Effect of a reduction in specification limits on global fuel production • Effect of low sulphur fuel on aircraft gas turbine engines and aircraft fuel
systems • Operational effects of aircraft • Comparison with fuel sulphur reduction in other transport sectors • Recommended route to achieving a change in the Fuel Sulphur Content • Cost effectiveness analysis
The following conclusions have been reached:
A reduction in fuel sulphur content could be achieved by the HDS process. Producers were approached to determine likely costs specific to aviation fuel. No firm data were obtained due to issues of confidentiality. Indicative costs were therefore estimated based upon desulphurisation of diesel fuel. These were of the order of €0.01 – €0.015/l.
Annual global commercial aviation fuel burn is approx. 200Mtonnes. Based upon current fuel supply data, it has been estimated that a reduction from the current 3000ppm(m) maximum fuel sulphur concentration to interim values of 2000ppm(m), 1500ppm(m), 600ppm(m), 300ppm(m) and 10ppm(m) would respectively require about 5%,15%, 50%, 75% and 99% of the total fuel supply to be treated. Costs to achieve these partial reductions are relatively modest down to 1500ppm(m), using various market accommodation measures, as indicated in the table below. Beyond this, costs rise more steeply toward the €250-€375M per annum total for full desulphurisation.

QinetiQ/09/01835 Page 6
Fuel sulphur content
(ppm(m))
% fuel sulphur
reduction
Relative cost
3000 0% 0%2000 5-10% 1-5%1500 10-15% 5-10%600 40-60% 20-30%300 60-80% 70-90%10 99% 100%
Aircraft movements are predicted to grow by 4 to 5% per annum and an assessment has been undertaken to determine possible commercial aviation sulphur emissions to year 2050, based upon three high/medium/low feedstock sulphur scenarios. In order to stabilise the current level of global aviation sulphur emissions under all three scenarios, the FSC limit would need to be reduced along the following timelines:
2016: between 600 and 1500ppm(m)
2026: between 300 and 600ppm(m)
at some point between 2036 and 2050: below 300ppm(m)
A reduction in fuel sulphur content will provide benefits in terms of health and the environment. It is estimated that a reduction in average fuel sulphur content from the current 600ppm(m) to 10ppm(m) would result in a 0.07% decrease in aircraft landing-take-off (LTO) cycle PM–based mortality, possibly representing about 25% of aircraft-emission related premature mortality. At low sulphur contents (<500ppm), health impacts may be further improved as gas turbine combustion test data suggests that the relative quantity of more harmful sub-10nm PM is significantly reduced. Other health and environmental benefits from LTO-based emissions are assessed to be small relative to the PM impact reduction.
Lack of scientific understanding over climate change mechanisms makes it difficult to predict the overall climate impact of reduced sulphur with any certainty. A slight increase in global warming potential is probable due to the reduced direct cooling effect from sulphate particulates. No further quantification has been attempted.
An emerging issue of ground-level PM impacts of sulphur-related emissions at altitude has been raised. Further research is required to quantify this effect. If significant quantities of aircraft PM are transported to ground level in harmful form, this could add significantly to the benefit of sulphur removal.
An outline cost-benefit analysis has been undertaken using the LTO-cycle PM-related benefits. European data suggests this 0.07% reduction in global aviation PM-related mortality can be monetised at a value between €0.5B and €1.65B per year (based on forecast for year 2020). A US methodology suggests a global mean of $0.9B (year 2000). Cruise PM could increase these values. Monetisation of the potential climate warming (or cooling) has the potential to totally negate or significantly increase these monetised benefit values.
In order to achieve a specification change, four major steps have been identified:

QinetiQ/09/01835 Page 7
• Formal request to industry bodies
• Review of case by industry bodies
• Where necessary, define and undertake test programme to ensure engine compliance and safety
• Ballot
It is estimated that to achieve a reduction in fuel sulphur content from the current 3000ppm(m) down to 10 ppm(m) will take about 10 years. Intermediate reductions in the limit could be achieved in a shorter timescale.

QinetiQ/09/01835 Page 8
List of contents 1 Introduction 11
2 Characteristics of fuel sulphur related emissions 13 2.1 Background 13 2.2 The effect of fuel sulphur concentration on particulate size and
concentration 14 2.3 Relationship between fuel composition and smoke formation 18 2.4 Summary of changes in sulphur related emissions characteristics 20
3 Health and environmental impacts through changes in local air quality (LAQ) 22 3.1 Introduction 22 3.2 Particulate Matter (PM) emissions 22 3.2.1 Health and local environmental impacts of PM emissions 22 3.2.2 Using the FOA to calculate PM emissions at a representative large
airport 25 3.2.3 Simplified assessment of PM mass concentration changes at a
representative large airport resulting from changes in FSC 27 3.2.4 Assessment of changes in PM-related health impacts at a
representative large airport resulting from changes in FSC 28 3.2.5 Potential monetised impact of sulphur-related aircraft LTO PM
emissions 29 3.3 Sulphur Dioxide (SO2) emissions 29 3.3.1 Health and local environmental impacts of SO2 emissions 29 3.3.2 SO2 emissions at a representative large airport 30 3.3.3 Simplified assessment of SO2 mass concentration changes at a
representative large airport resulting from changes in FSC 31 3.3.4 Assessment of changes in SO2-related health and environmental
impacts at a representative large airport resulting from changes in FSC 31
3.4 LAQ effects from emissions at altitude 32 3.5 Summary of aircraft-related health and local environmental impacts 32
4 Climate impacts 34 4.1 Sulphate-based particulates 34 4.2 Contrails and cirrus 35 4.3 Ozone chemistry 37 4.4 Carbon dioxide and water emissions 37 4.5 Summary of climate impacts 38
5 The effect that a reduction in specification limits would have upon global fuel production and fuel properties 39 5.1 Global variations and trends in fuel sulphur content 39 5.1.1 Summary of mean fuel sulphur values 42 5.2 How the sulphur reduction would be achieved 42 5.3 Refining capacity 43

QinetiQ/09/01835 Page 9
5.4 Impact of increased hydrodesulphurisation on jet fuel properties 44 5.4.1 Acidity 45 5.4.2 Aromatics/naphthalenes 45 5.4.3 Mercaptan sulphur 45 5.4.4 Density (and specific energy) 45 5.4.5 Freezing point 45 5.4.6 Hydrogen content 46 5.4.7 Smoke point 46 5.4.8 Copper corrosion 46 5.4.9 Thermal stability 46 5.4.10 Water separation 46 5.4.11 Lubricity 46 5.4.12 Conductivity 46 5.4.13 Antioxidants 47 5.4.14 Summary of the impact of reducing fuel sulphur content on
specification properties. 47 5.4.15 Summary of impact of HDS process 48 5.5 Alternative fuels 48 5.5.1 Synthetic fuel from the Fischer Tropsch process 49 5.5.2 Synthetic fuel from other processes 50 5.5.3 Fatty acid methyl esters 50 5.5.4 Hydrogenated vegetable oil 50 5.5.5 Alcohols 51 5.5.6 Alternative Fuel Summary 51
6 The effect of low sulphur fuel on aircraft engine and fuel systems 53 6.1 Lubricity 53 6.2 Elastomer compatibility 53 6.3 Peroxide formation 53 6.4 Thermal stability 54 6.5 Effect of fuel sulphur upon combustion hardware 54 6.6 Summary of the effects upon engine and fuel systems 55
7 The operational effects of changing fuel sulphur content 56 7.1 Introduction 56 7.2 Operational Effects 56 7.2.1 Fuel Savings from density and energy changes in the HDS process 56 7.2.2 Combustion Efficiency 58 7.2.3 Carbon dioxide and water emissions 59 7.3 Other operational effects 60 7.3.1 Winter diesel 60 7.3.2 Pipeline operation 60 7.4 Summary of operational effects from changes in FSC 60
8 Comparison with fuel sulphur reduction in other transport sectors 62 8.1 Introduction 62

QinetiQ/09/01835 Page 10
8.2 Changes to global road transport fuel specifications 62 8.2.1 Europe 62 8.2.2 Rest of the world - Gasoline 62 8.2.3 Rest of the world - Diesel 63 8.3 Marine fuels 64 8.4 Motivation for the reduction in road transport FSC 67
9 Route to jet fuel specification change - costs, benefits, barriers and opportunities 68 9.1 Introduction 68 9.2 Estimates of the cost of sulphur reduction in jet fuel 68 9.3 Environmental benefits 71 9.3.1 Health and local environmental effects 71 9.3.2 Global climate effects 71 9.4 Assessment of reductions in the FSC limit 71 9.4.1 Assessment of reduction in total fuel sulphur mass for various
maximum FSCs 71 9.4.2 Future trends in sulphur-related emissions from commercial aviation 74 9.4.3 Impact of reduced sulphur limits on the three sulphur scenarios 78 9.5 Comparing costs and benefits of reduction in maximum allowable fuel
sulphur content 80 9.6 Barriers and opportunities 82 9.6.1 Aviation fuel specification sulphur limits 82 9.6.2 Regulation 83
10 Conclusions 85
11 References / Bibliography 87
12 Appendix 90

QinetiQ/09/01835 Page 11
1 Introduction The objective of the work described in this report is to assess and where possible quantify the impact that would be made upon relevant aircraft hardware, the environment, human health and associated facets, if the specified maximum fuel sulphur concentration in aviation fuel were to be reduced.
A reduction in the fuel sulphur content of aviation fuel has immediate obvious effects, such as a reduction in the quantity of SO2 emitted into the atmosphere. Other, less obvious impacts would be a reduction in the number of particulates being emitted. Fewer particulates emitted into the upper atmosphere has implications with respect to direct radiative forcing and less directly to contrail formation and also their physical appearance. Closer to ground level, a reduction in fuel sulphur has a direct impact upon human health through reduced SO2 and through reduced particulates. It could be argued that the impact of a reduction in fuel sulphur would be wholly positive. However, there are implications related to engine reliability and cost which need to be considered in order to make an informed decision on a legislated reduction in fuel sulphur content.
Particulate emissions from aircraft gas turbine engines consist of non-volatile, organic-volatile and organic-sulphate components, the physical properties of which are influenced, inter alia, by the composition of the fuel. The fuel sulphur content has an impact either directly or indirectly upon factors such as the mass, size and chemical composition of the particulates produced in the combustion process. If the fuel sulphur content were to be reduced, a direct consequence would be a reduction in gaseous SO2 and in the particle number concentration as well as a shift in the size distribution of volatile sulphate particles. An indirect influence occurs in the hydrodesulphurisation process currently used as the sulphur reduction process at the refinery. In this process, aromatic species within the fuel are broken down into aliphatic chains, the result of which is a fuel which will burn with more efficiently with a consequent reduction in the formation of non-volatile and volatile particulate matter.
To assess the effect of a reduction in aviation fuel sulphur concentration, investigations have been made under the following headings:
• Global and local environmental effects including the Impact upon human
mortality • Effect of a reduction in specification limits on global fuel production • Effect of low sulphur fuel on aircraft gas turbine engines and aircraft fuel
systems • Operational effects of aircraft • Comparison with fuel sulphur reduction in other transport sectors • Recommended route to achieving a change in the Fuel Sulphur Content • Cost effectiveness analysis
These areas are reviewed individually in this report. In addition a comparison with fuel sulphur reduction in other transport sectors is carried out, resulting in a recommended route to achieving a change in the fuel sulphur content for aviation kerosene. Wherever adequate data is available, the objective of this work has been to quantify the impact that each of the above described facets would have.
QinetiQ/09/01835 Page 12
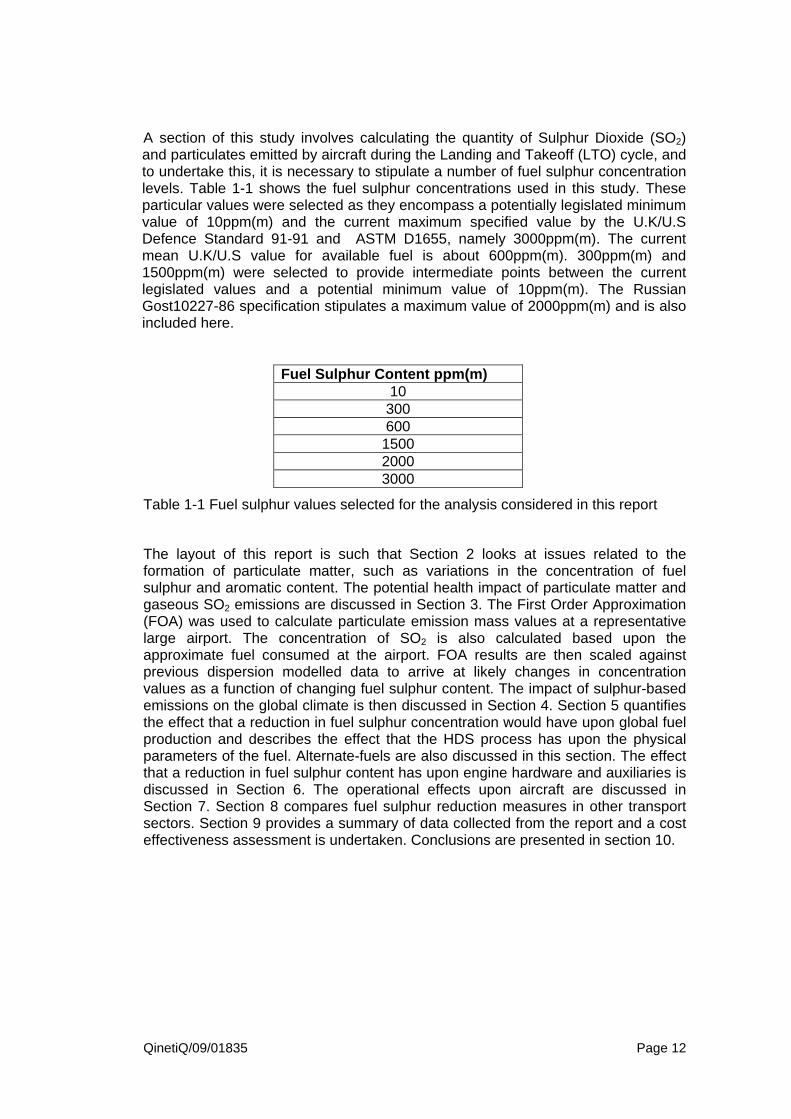
A section of this study involves calculating the quantity of Sulphur Dioxide (SO2) and particulates emitted by aircraft during the Landing and Takeoff (LTO) cycle, and to undertake this, it is necessary to stipulate a number of fuel sulphur concentration levels. Table 1-1 shows the fuel sulphur concentrations used in this study. These particular values were selected as they encompass a potentially legislated minimum value of 10ppm(m) and the current maximum specified value by the U.K/U.S Defence Standard 91-91 and ASTM D1655, namely 3000ppm(m). The current mean U.K/U.S value for available fuel is about 600ppm(m). 300ppm(m) and 1500ppm(m) were selected to provide intermediate points between the current legislated values and a potential minimum value of 10ppm(m). The Russian Gost10227-86 specification stipulates a maximum value of 2000ppm(m) and is also included here.
Fuel Sulphur Content ppm(m) 10
300 600
1500 2000 3000
Table 1-1 Fuel sulphur values selected for the analysis considered in this report
The layout of this report is such that Section 2 looks at issues related to the formation of particulate matter, such as variations in the concentration of fuel sulphur and aromatic content. The potential health impact of particulate matter and gaseous SO2 emissions are discussed in Section 3. The First Order Approximation (FOA) was used to calculate particulate emission mass values at a representative large airport. The concentration of SO2 is also calculated based upon the approximate fuel consumed at the airport. FOA results are then scaled against previous dispersion modelled data to arrive at likely changes in concentration values as a function of changing fuel sulphur content. The impact of sulphur-based emissions on the global climate is then discussed in Section 4. Section 5 quantifies the effect that a reduction in fuel sulphur concentration would have upon global fuel production and describes the effect that the HDS process has upon the physical parameters of the fuel. Alternate-fuels are also discussed in this section. The effect that a reduction in fuel sulphur content has upon engine hardware and auxiliaries is discussed in Section 6. The operational effects upon aircraft are discussed in Section 7. Section 8 compares fuel sulphur reduction measures in other transport sectors. Section 9 provides a summary of data collected from the report and a cost effectiveness assessment is undertaken. Conclusions are presented in section 10.
QinetiQ/09/01835 Page 13
2 Characteristics of fuel sulphur related emissions
2.1 Background
Emissions from aircraft gas turbine engines have an impact both locally and globally. This section of the report describes the formation of sulphur related emission species. Sections 3 and 4 cover their effect on local air quality (LAQ) and global climate.
Whilst most anthropogenic pollution sources impact local land-based environments, aircraft are unique, in that pollutants are emitted directly into both the “local” and the global atmosphere.
Aircraft emit only a very small percentage of total emissions. Putting this into perspective, it is estimated that CO2 emissions from the world aircraft fleet account for around 2% of annual anthropomorphic CO2 globally [1].
Sulphur dioxide SO2, in the presence of reactive radicals and water vapour, undergoes oxidation to sulphur trioxide, SO3 and further oxidation to sulphuric acid (H2SO4) which is of concern to the environment and human health. The mechanism for the conversion of SO2 to H2SO4 is shown by the following equations, where M refers to a third body:
SO2 +OH + M � HOSO2 +M (E1)
HOSO2 +O2 � SO3 +H2O (E2)
SO3 +H2O � H2SO4 (E3)
The formation of SO2 from fuel bound sulphur is a fast reaction (milliseconds) and is completed by the time the reactants exit the combustor. The conversion from SO2 to SO3 is thought to begin within the turbine region of the engine but is dependent upon the engine configuration and operating conditions. Some results obtained from the PARTEMIS1 measurement campaign indicated that conversion begins in the hot end of the engine. Modelling studies indicate a similar result [2]. However, the SO3 molecule is extremely unstable and will react in gas sample lines to form H2SO4. As a consequence, the precise time of conversion is not known with certainty, primarily due to issues related to the measurement technique. SO3 and H2SO4 act as precursors for volatile aerosol formation and are therefore potentially damaging to the environment. The conversion factor ε provides a measure of the conversion of SO2 to SO3 and H2SO4 and is typically defined by equation 4.
][SO
])SOH[]SO([
x
423 += ε (E4)
The precise value of the conversion factor is not known and is likely to change with different engine operating conditions, but currently is thought to range from between about 2 to 5 percent of total sulphur at the engine exit [3]. 1 EC FP5 Research Programme “PARTEMIS - Measurement and prediction of emissions of aerosols and gaseous precursors from gas turbine engines”

QinetiQ/09/01835 Page 14
It is thought that H2SO4 in the gaseous state may follow two paths to particulate formation. The first may occur at the exit of the turbine when the exhaust plume begins to cool and H2SO4 may condense on to existing particulates produced in the combustion process. The hydroscopic nature of the sulphuric acid molecules allows them to grow in the presence of water vapour. In the second path, homogeneous nucleation of H2SO4 with water may form new particulates. Coagulation of these particulates then allows them to increase in size.
2.2 The effect of fuel sulphur concentration on par ticulate size and concentration
The fuel sulphur concentration of aviation fuel has a direct impact upon particulate matter size, size distribution and mass.
A programme of work assessing the effect of varying the fuel sulphur concentration upon particulate physical parameters was undertaken in the QinetiQ/NASA programme [4]. The work was undertaken at operating conditions broadly representative of a simulated cruise and an up-rated cruise condition to mimic both legacy and modern hardware. A number of fuel sulphur concentration values were utilised.
The following conclusions were drawn from the work, based on testing with fuel concentration values of 8, 460 and 2060ppm(m):
• The mean diameter of the particle size distribution increases by about 26-44% as a function of decreasing fuel sulphur concentration between 2060 and 8 ppm(m). Table 2-1 shows the particle size as a function of fuel sulphur content and operating condition. The standard deviation associated with this measurement is of the order 0.5 to 2.
• Particulate number concentration decreases as a function of decreasing fuel sulphur concentration by about 36-75%.
• The mass concentration of particulates increase as a function of decreasing fuel sulphur concentration by about 26-64%. This may be because the particulates produced when the fuel sulphur concentration is high are so small they cannot be measured or it may be a function of the change in chemistry. Moreover, in this instance, the mass is determined from the number concentration based upon the assumption that the particulates are spherical which in many cases they are not. And a density for the particulates has to be assumed, this is however not known with certainty.
• The particulate surface area per unit volume is dependent upon the engine operating conditions. At the cruise condition, surface area increases as a function of decreasing fuel sulphur concentration whilst at the up-rated cruise condition the inverse was found. It is likely that this change is a result of changes to local air fuel ratio within the combustor, whereby localised rich pockets produce particulates of different composition and also physical geometry and density.
The major conclusion drawn from the QinetiQ/NASA programme was that as the fuel sulphur concentration in the fuel is reduced, a smaller number of particulates will be produced and they will be larger in size. The actual mass of particulates will increase. This is an important finding because smaller particulates pose a greater danger to human health than large particulates [5]. It can be seen from table 2-1 that as the fuel sulphur concentration is reduced from 2060ppm(m) to 460ppm(m) there is little change in diameter, mass or number concentration. However a

QinetiQ/09/01835 Page 15
reduction from 460ppm(m) to 8ppm(m) shows a 30% increase in particulate size, a 60% increase in mass and a 50% reduction in the number concentration.
Ignoring sample line loss effects, the errors associated with this measurement technique are about 10%. These particular analysers include condensation particle counters which, although repeatable, have variability between instruments of up to 20%.
Fuel Sulphur Content (ppm)
Operating condition
Mean particle diameter (nm)
Mass (µg/m 3) Number Concentration
(No/cm 3)
8 Cruise 79.06 2.767e4 2.217e7
460 Cruise 56.77 1.844e4 4.475e7
2060 Cruise 54.46 1.902e4 4.312e7
8 Uprated Cruise 78.97 2.429e4 1.932e7
460 Uprated Cruise 58.81 1.125e4 2.697e7
2080 Uprated Cruise 56.07 1.598e4 4.239e7
Table 2-1 FSC against particulate diameter and mass
A previous EU research project, known as PARTEMIS, focussed upon the impact of fuel sulphur concentration levels on the physical parameters of particulate matter [6-8]. In this work, fuel sulphur concentration values of 50, 410 and 1270ppm(m) were used and measurements were made of particle physical parameters such as hydroscopy, size, mass and number concentration. Testing was undertaken using a Rolls-Royce Tay-combustor installed within a pressure casing, upstream of a novel “Hot-End-Simulator”. Operating conditions representative of the actual flying conditions could not be achieved therefore scaled conditions representative of an old-cruise and modern-cruise operating condition were used, chosen to be roughly representative of old and modern aero gas turbine engines.
To show that the data obtained from the HES was representative of modern and legacy hardware, Figure 2-1 shows a plot of the Emission Indices (EI g/kg fuel), for black carbon mass and number concentration for a variety of aircraft engines in ascending order of age on the y-axis. Values obtained from the HES for modern and old cruise conditions have been annotated onto the graph and it can be seen that the values obtained are consistent with genuine engines [9].

QinetiQ/09/01835 Page 16
Figure 2-1 Characteristics of particulates measured from the HES and compared to those of other engines. (SOURCE Petzold and Schumann et al [9] )
Particle mass and number concentration were determined using Scanning Mobility Particle Sizing (SMPS) techniques and Condensation Particle Nucleus Counters (CPC). Figure 2-2 shows a plot of mean particle diameter and also the fraction of particulates between 10 and 300nm diameters, plotted against Low (50ppm(m)), Medium (410ppm(m)) and High (1270ppm(m)) fuel sulphur content for both old and modern cruise conditions. The plot shows the “count median diameter” as measured (filled diamonds), average mass diameter (filled squares) which have been calculated from the size distribution, and the diameter as calculated from the measured mass and number concentration (open diamonds). The fraction of particulates greater than 300nm is represented by “+” whilst particulates less than 10nm is represented by “X”.
It can be seen from the plot that the measured mean diameter varies slightly depending upon the methodology utilised. However, the trends are consistent, and it can be seen that as the fuel sulphur concentration is increased, the mean particle diameter decreases with respect to both modern and old cruise. The plot also shows that particles less than 10nm in diameter account for less than about 10% of the total at both low and medium fuel sulphur concentration values. However, at the high fuel sulphur value, the number of particulates less than 10nm increases to about 90% in both the old and modern cruise condition.

QinetiQ/09/01835 Page 17
Figure 2-2 mean particle diameter and normalised number concentration (Source Petzold et al)
Particulate size number and distribution measurements were made at 3 different locations downstream of a commercial gas turbine engine in work undertaken in the APEX 3 programme [10]. Measurements were made at distances of 1, 10 and 50m downstream of the engine exit. Three fuels with varying degrees of sulphur and aromatic compounds were used in the trial. The objective of the work was to establish how the physical properties of the particulates change as a function of increasing distance in the exhaust plume. A pertinent conclusion from this work was that at a distance of 30m, the EI of the number concentration increased whilst the geometric mean particle size decreased, which is consistent with the above discussed results. This is an interesting result because it may have been expected that the smaller particulates produced by the inclusion of extra sulphur may have agglomerated at this distance, but probably had insufficient residence time.
In a NASA programme of work (AEAP) [11] particulate measurements were made on a Pratt & Whitney F100-200E engine in a test rig. Fuel sulphur concentration values of 20, 115 and 1113ppm(m) were used in the test. It was found that the EI (number concentration) was about the same for the medium and high fuel sulphur values but at the low fuel sulphur concentration, was reduced by a factor of about 3-4. However, this particular result is not clear-cut as there were some variations in the make-up of the fuel. The result does show that particulate emissions can be significantly changed by the constituents in the fuel and the actual trends noted are similar to those shown in previous studies such as PARTEMIS. The standard deviation in the particle diameter was estimated to be 1.5%. Particulate matter mass values were not derived in this work.
Measurements made behind aircraft at altitude were conducted in a series of experiments known as SULFUR 1-7 [9]2. One of the objectives of this work was to study contrail formation and establish whether increases in the fuel sulphur concentration had any impact upon their formation or physical composition. Some aspect of this work are discussed in Section 4, but some conclusions relevant to this section were:-
2 The series of SULFUR experiments were conducted between December 1994 to September 1999

QinetiQ/09/01835 Page 18
• There was a correlation between particle number concentration and fuel sulphur levels and the number of ice particles in young contrails increases with increasing fuel sulphur concentration. The reason for this is that sulphate particulate matter provides a greater number of nuclei for condensation of water
• Notwithstanding potential errors in measurement techniques, colour differences were noted in contrails with two different fuel sulphur levels which again is a function of particulate number concentration
• A decrease in the fuel sulphur concentration from 2000 to 6 ppm(m) resulted in a decrease in particulate number concentration by a factor of 0.77
Significant work has been conducted in the motor car/truck sector on petrol and diesel engines to ascertain the effects of changes in fuel sulphur content on the production of particulate matter. It is however recognised that internal combustion engines operate on different cycles to those of gas turbines. A report compiled by the U.S Coordinating Research Council provides a good technical overview of results obtained from the U.S, Europe and Japan. The report only covers mass based data [12]. The main conclusions from the report were:-
• With respect to light duty diesels and without a catalyst, the fuel sulphur content was reduced from 2000 to 100ppm(m) and the outcome was a 4% reduction in the mass of PM emissions. However, a similar study showed a 13% reduction.
• A study on heavy duty diesel engines showed a reduction in particulate matter of 29% when the fuel sulphur level was reduced from 350 to 3ppm(m). At the same time, there were no changes in the emissions of other non-sulphur products.
Note: These results are contradictory to data shown in Table 2-1. In aircraft gas turbines particulate mass appears to increase as the fuel sulphur content is reduced whilst in this instance the mass decreases. Reasons for this could be related to the measurement methodology or differences in combustion chemistry.
2.3 Relationship between fuel composition and smoke formation
To reduce the sulphur content of aviation fuel a process known as hydrodesulphurisation (HDS) is currently used. This process is detailed in Section 5.2. The HDS process not only reduces the fuel sulphur concentration but also lowers the aromatic content of the fuel, increasing the hydrogen content. This is beneficial with respect to the combustion process and increases the combustion efficiency which results in fewer emitted particulates.
The extent of smoke formation in the combustion process is related to the carbon/hydrogen ratio of the fuel [13-16]. As hydrogen concentration increases, the level of smoke produced deceases. This is illustrated in Figure 2-3 which shows the relationship between smoke number3 and the hydrogen content of fuel at cruise and take-off conditions. It can be seen that the hydrogen content of the fuel increases as the smoke number decreases.
In addition to this, there is the smoke point test which is a specified measurement parameter used in fuel specifications to provide a qualitative indication as to likely smoke production (i.e. in terms of the value being low or high), Figure 2-4 shows a 3 Smoke Number as defined in ICAO regulations [28]

QinetiQ/09/01835 Page 19
plot of smoke point against hydrogen content and it can be seen that the value increases as the hydrogen content increases. This is to be expected because the smoke point test is used to determine the maximum height in millimetres at which kerosene (or other fuel) will burn without smoking4 [17]. The concentration of aromatic compounds in the fuel also has an impact upon the quantity of smoke produced as shown in Figure 2-5.
These effects were demonstrated in work undertaken by Moses [18]. Testing was undertaken on a General-Electric T700 engine and combustor test rig using JP-5 fuel. The results showed that measured particulate mass and number concentration correlated well with the hydrogen and aromatic content of the fuel. It was observed that a reduction in aromatic content increased combustion efficiency and resulted in a reduction in particulate matter mass. From this work, the author estimated that a reduction in aromatic content from 15% to 0% would result in a 25% reduction in particulate mass. However, this would be dependent upon the power condition. Particulate size measurements were made in this work but the results were difficult to decipher and for that reason have not been included here.
0
5
10
15
20
25
30
35
40
45
50
10 11 12 13 14 15 16
Hydrogen %
Sm
oke
Num
ber
Cruise Takeoff
Figure 2-3 Smoke number against the hydrogen content of the fuel (reproduced from Lefebvre[14], relevant to JT8D combustor
4 The smoke point is derived at specific conditions whereas the smoke number is measured at a number of different engine operating conditions therefore the two cannot be directly compared

QinetiQ/09/01835 Page 20
Figure 2-4 Relationship between smoke point and hydrogen content Source Moses et al and Lefebvre et al
0
5
10
15
20
25
30
0 5 10 15 20 25 30 35 40
Total Aromatic Content (wt %)
Sm
oke
Poi
nt (
mm
)
Figure 2-5 Smoke point as a function of aromatic content
2.4 Summary of changes in sulphur related emissions characteristics
Particulate number concentration measurements have been made on combustion test rigs, engine test rigs and engines at altitude. In all cases it has been observed that a reduction in the fuel sulphur concentration results in a reduction in the
0
5
10
15
20
25
30
35
11 11.5 12 12.5 13 13.5 14 14.5 15 Hydrogen Content (wt %)
S.P mm

QinetiQ/09/01835 Page 21
number of particulates emitted. However, the extent of this reduction appears to be a function of the original fuel sulphur concentration. It has also been concluded by several studies that the number of sub-10nm particulates decreases significantly with decreasing fuel sulphur concentration.
With respect to aircraft engines, it is not clear why there is not a reduction in particulate mass with reduced sulphur content. However, tests made in the automotive industry show that the mass of particulate matter is reduced as the fuel sulphur content is reduced.
An additional indirect benefit of reducing the sulphur content by the HDS process is that the quantity of aromatic compounds is reduced whilst the hydrogen concentration is increased. The net result is a reduction in emitted particulate matter. The extent of the reduction in aromatic compounds is proportional to the severity of the HDS process used.
QinetiQ/09/01835 Page 22
3 Health and environmental impacts through changes in local air quality (LAQ)
3.1 Introduction
This section of the report assesses the potential health impact of changes in local air quality arising from changes to the fuel sulphur content as shown in Table 1-1. Within this project, it was not feasible to carry out modelling involving dispersion and local chemistry. To overcome this shortfall, previously published dispersion modelling data from a study pertinent to Heathrow airport has been used [19] to scale the results obtained from a First Order Approximation [FOA] calculation made within this work [20]. The methodology utilised is outlined in the Appendix. The ICAO approved First Order Approximation (FOA) [20] represents the best currently available method for estimating particulate matter emissions (mass) from aircraft and has been used to assess the impact on air quality. Utilising this methodology, it is possible to assess the impact of changes in fuel sulphur levels in the context of a large airport. Information on the sensitivity of health/concentration mortality rates is then assessed to obtain a consensus value which is then applied to the range of fuel sulphur concentration changes to provide an indication of changes in mortality rate.
A further analysis of health effects of changes in gaseous SO2 emissions is made using a similar methodology.
3.2 Particulate Matter (PM) emissions
3.2.1 Health and local environmental impacts of PM emissions
A reduction in all anthropogenic emissions has benefits related to health and environment and as such, the European Union is committed to improving air quality. A document published in 2005: “Thematic Strategy on air pollution” [21] states that “ Air pollution damages human health and the environment. The need to deliver cleaner air has been recognised for several decades with action having been taken at national and EU level and also through participation in international conventions. Despite significant improvements, serious air pollution impacts persist.” And particulate matter is one of the pollutants of prime concern. Information contained within the document suggests that currently in the EU there is a loss in statistical life expectancy of over 8 months due to particulate matter emissions which is equivalent to 3.6 million life years lost annually. These statistics are related to all particulate matter emission sources and not air traffic alone.
Particulate matter emissions are thought to be significantly more detrimental to human health than gaseous pollutants. In Wadud’s report (OMEGA) [22], it is stated that an increase of 10µg/m3 in ozone concentration results in an increase in mortality rate of 0.34%5 whilst an increase in particulate matter concentration of the same magnitude would result in an increase in mortality rate of 11%.
5 Increase in mortality rate per 1000 people

QinetiQ/09/01835 Page 23
Higher sulphur concentration levels in aviation fuel results in a greater number of sub 10nm particulates. Inhalation of particulate matter with a diameter less than 100nm is particularly detrimental to health as they are able to descend beyond the trachea and bronchia regions of the body and are deposited directly into the lung [22] Recent work reported by Petzold [23] and undertaken by OberdÖster [24] with respect to the clearance mechanism used by the body to remove particulate matter suggests that “Approximately 80% of 0.5 – 10µm particles could be retrieved with the macrophages, whereas only approximately 20% of the nanometer-sized particles < 0.08µm could be lavaged by macrophages.” This is an important finding as it shows that finer PM material will reside within the body for longer periods of time.
An extensive treatise which focussed on the effect of particulate matter upon human health has been compiled by Wadud, [22]. In his work, the emphasis was on “Local air quality” and the impact that particulate matter has upon human mortality rates and also the increased incidence of chronic bronchitis and myocardial infarctions. Wadud’s work shows predicted “quantitative” values based upon premature mortality for the general adult population and also upon infants.
The results of Wadud’s study are expressed in units of “concentration-response functions” which are the rate increase of incidence per 10µg/m3 of pollutant. This may be defined as the % increase in mortality due to particulate matter. The results of this study are thought to cover 95 % of aviation’s local environmental impact and are presented in Table 3-1. The table shows that an increase in particulate matter of 10µg/m3 results in an 11% increase in the overall mortality rate for adults (95% limits are 4%-18%) and a 7% rise for infants6 (95% limits of 0%-14%) The large uncertainty is indicative of a study of this nature where the health background of the people involved in the study in terms of socio-economic variables are complex and in many cases unknown and it is likely that the confidence limits themselves are subjective. The results must therefore be treated with caution.
End Point CR-Unit Mean 95% CI
PM Premature mortality % increase in mortality rate per 10µg/m3 11 4-18
PM Infant mortality % increase in mortality rate per 10µg/m3 7 0-14
Ozone premature mortality % increase in mortality rate per 10µg/m3 0.34 0.2-0.48
PM Chronic Bronchitis % increase in mortality rate per 10µg/m3 14 0-35.4
PM Myocardial infarctions % increase in mortality rate per 10µg/m3 27 0-54
Table 3-1 Health impact of PM and O3
Wadud’s work also shows a comparison of mortality rate data which were predicted by several other experts in this field. Table 3-2 shows a small selection of the results. It must however be noted that these data are not directly related to aircraft particulate emissions but all particulate emissions produced by cars, factories, houses and other smoke sources. Excluding data acquired from major roads, the mean percentage increase is about 14%. The units in this table are expressed in terms of relative risk of mortality7.
6 Infant mortality, one year of age or less 7 Relative risk is defined as the ratio of the probability of death in a given circumstance such as exposure to PM material and the probability of death assuming that there were no hazardous material

QinetiQ/09/01835 Page 24
Study Exposure IncrementPercent Increase in Relative
Risk of Mortality (95% CI)Harvard six cities, original 10µg/m3 PM2.5 13 (4.2-23)
Harvard six cities, Re-analysis 10µg/m3 PM2.5 14(5.4-33)
Harvard six cities-extended analysis 10µg/m3 PM2.5 16 (7-26)
Netherlands (Near Road) 10µg/m3 PM2.5 17 (24-78)
Hamilton, Canada (Near Road) 10µg/m3 PM2.5 41 (2-38)
Table 3-2 Health impact, results from other workers
Work undertaken by Pope et al [25] was engaged in quantifying the expected change in life expectancy as a function of PM2.5 concentration in urban areas in the United States. The study was based upon empirical data collected in the early 1980s and the late 1990s from 51 metropolitan areas within the United States and is therefore a very comprehensive study. The data was scrutinised closely and corrected for socio-economic, demographic and proxy variables. The conclusion from their work was that a reduction in PM by 10µg/m3 increased life expectancy by about 0.61±0.2 years.
Levy et al [26](PARTNER) undertook a dispersion modelling study to ascertain the impact of selective aircraft emissions upon mortality rates in the United States. In this work, predicted emission data from three airports was fed into both an AERMOD and CMAQ dispersion model. The AERMOD model provides near-source high resolution data within a 50km range whilst the CMAQ model provides less resolution but includes a more detailed chemistry for a larger range. Three airports were used in the study: T.F.Green Airport (Rhode Island), Chicago O’Hare International airport and Hartfield-Atlanta Airport Georgia. The output criterion for the model was mortality rate based upon the entire population and not the population living close to the boundary of the airport. The mortality rate utilised for this model with respect to particulate matter was a 1% increase in mortality per µg increase in concentration. This conclusion was based upon values discussed above.
Table 3-3 shows the AERMOD predicted deaths per annum for both gaseous and particulate matter. The results show that particulate matter accounts for 100-200 times more deaths than all of the gaseous species combined.
Table 3-4 shows CMAQ predicted values per annum for particulate matter with 12 and 36km resolutions. The CMAQ predicted values are slightly less than those calculated using AERMOD but reasonably similar. The differences are likely to be attributed to the differing operating regimes of the two models.
Table 3-3 Deaths per annum predicted by AERMOD (Source PARTNER)
ORD ATL PVDAERMOD 50 km radius model
Deaths per year from PM 15 7.2 0.65Deaths per year from gaseous pollutants 0.09 0.07 0.006

QinetiQ/09/01835 Page 25
108 * 108 km regionORD ORD ATL ATL PVD PVD
CMAQ 12 km 36 km 12 km 36 km 12 km 36 km % Sulphate 49 52 59 64 41 37 % Nitrate -2 -5 -12 -8 13 21
% EC 15 16 19 16 13 12% OC 21 20 18 12 18 15
% Ammonium 17 17 15 16 15 16% Other 1 0 0 0 0 -1
Deaths per year 12 7.9 4.5 4.2 0.57 0.48
12 and 36 km resolution
Table 3-4 Deaths per annum predicted by CMAQ (Source PARTNER)
The health impact of volatile and non-volatile particulate matter is likely to be different due to the chemical makeup of the respective compounds. Species such as aromatic, polycyclic aromatic, sulphur and other associated compounds which have condensed upon non-volatile components are likely to make them more toxic. However, science has not yet answered this issue [23].
In summary, approximately 80% of 0.5 – 10µm particles could be retrieved with the macrophages, whereas only approximately 20% of the nanometer-sized particles < 0.08µm could be lavaged by macrophages.” This is an important finding as it shows that finer PM material will reside within the body for longer periods of time. Moreover, increases in fuel sulphur content result in a greater number of sub-10nm particulates which based upon the reduction in macrophages would probably have a negative impact upon human health.
Based on Wadud’s [22] data, a mortality rate of 1.1% per 1µg/m3 increase in particulate concentration has been used for the analysis shown in 3.2.4.
3.2.2 Using the FOA to calculate PM emissions at a representative large airport
The First Order Approximation (FOA) is used for estimating total particulate matter from aircraft engines emitted during the Landing and Takeoff (LTO) cycle in the vicinity of airports [18]. The methodology is based upon the correlation between smoke number and mass to estimate the non-volatile particulate mass EI. In addition, the measured EI of total hydrocarbons is used to infer the volatile particulate contribution. Average fuel sulphur concentration values are used to estimate the EI of sulphate particulates. Engine properties required for the calculation, such as smoke number and hydrocarbon EI, are listed in the ICAO Aircraft Engine Emissions Databank [27].
For the purposes of this report, “local air” is defined as the atmosphere below an altitude of 3000 feet. This value is based upon the ICAO Landing and Take-Off cycle (LTO) [28] which is applicable to the certification of new aircraft gas turbine engines having a power output greater than 26.7kN. The LTO cycle consists of four operating modes: take-of, climb-out, approach and idle with the respective time at each of these conditions being 0.7, 2.2, 4.0 and 26 minutes. Main pollutants emitted by aircraft are:
• Carbon Monoxide (CO) • Carbon Dioxide (CO2) • Nitrogen Oxides (NOx) • Total HydroCarbon (THC)

QinetiQ/09/01835 Page 26
• Sulphur Dioxide (SO2) • Particulate Matter
In the course of this report, some reference will be made to the above emissions, but the emphasis of this work is on particulate and gaseous sulphur species.
The First Order Approximation [20] has been used to estimate the mass of non-volatile, volatile-organic and volatile-sulphur particulates emitted by aircraft in units of tonnes per year. Note that the FOA cannot be used to calculate particulate number concentration or size. Several assumptions are made in the FOA calculation, which currently lead to potential large uncertainties with respect to calculated EI values. The CAEP ad-hoc PM group is currently addressing some of these issues. Specifically, the main ones are:
• The organic volatile PM contribution is calculated based upon the relationship between the measured hydrocarbon EI as presented in the ICAO database and the measured EI of a single CFM56-2-C1 engine (APEX 1 measurement campaign) The assumption is made that all modern engines behave in a similar manner
• The conversion rate of SO2 (SIV) to SO3 (S
VI) is not known with certainty and is likely to change with different engine operating conditions
The correlation between smoke number and mass is under question and verification is currently being undertaken via results from EASA, SAMPLE measurement campaign and US APEX studies, there are however issues with respect to some APEX data.
This particular study uses a set of aircraft movements considered to be representative of a large airport in the early part of this decade. It is based upon movements and aircraft types typical of Heathrow Airport. The chosen aircraft-engine configurations and relevant data are shown in Table 3-5.
Engine UIN Test Year Power k/N Aircraft Number of Engines
V2522-A5 31A006 1992 103 Airbus A-319 2V2527-A5 1IA003 1992 111 Airbus A-320 2
GE-90-76B 3GE062 1997 360 Boeing 747 4CFM56-5C4 2CM015 1991 151 Airbus A-340 4CFM56-3-B1 1CM004 1983 89 Boeing 737-300 2RB211-535E4 5RR038 1999 178 Boeing 757 2RB211-524G 1RR010 1992 253 Boeing 747 4
Trent 892 2RR027 1994 411 Boeing 777 2CFM56-3C1 1CM007 1983 105 Boeing 737 2
CF6-80C2BIF 1GE024 1985 254 Boeing 747 4
Table 3-5 Type of aircraft used in the study and relevant data
To calculate the total mass of non-volatile particulates emitted from aircraft engines, it is necessary to utilise the measured Smoke Number (SN) as shown in the ICAO database [27] and a series of generic Air Fuel Ratio (AFR)8 values representative of values applicable to the LTO cycle.
8 Idle, approach, climb-out and take-off AFR are respectively 106, 83, 51 and 45

QinetiQ/09/01835 Page 27
Table 3-6 shows the results obtained for volatile sulphur, non-volatile and volatile particulates in units of tonnes/annum. It can be seen that whilst the quantity of volatile sulphate particulates decrease with decreasing fuel sulphur concentration, the volatile and non volatile component do not. The reason for this is that non volatile particulate mass is dependent only upon the smoke number whilst the volatile-organic fraction is reliant upon the EI of hydrocarbons9.
The volatile sulphate particulate mass has been derived from equation 5. In this instance, and in line with recommendations in the FOA3, the value for the fuel sulphur conversion was assumed to be 2.5%. Table 3-6 shows the results from this analysis and it can be seen that the predicted mass of sulphate particulates increase from a value of 0.25 tonne per annum at a fuel sulphur content of 10ppm to a maximum value of 58.9 tonne at 3000ppm(m).
kgmgMW
MWFSCEI
Sulphur
outFSCPMvols /
))()(()10( 6
=−
ε E5
FSC ppm Sulphate PM,t/year Non-vol PM, t/year Vol, t/year Total tonnes/year10 0.25 32.9 3.5 36.6300 7.4 32.9 3.5 43.7390 11.5 32.9 3.5 47.9600 14.7 32.9 3.5 51.1900 22.1 32.9 3.5 58.51500 36.8 32.9 3.5 73.22000 48.1 32.9 3.5 84.53000 58.9 32.9 3.5 95.3
Table 3-6 Results of FOA3
3.2.3 Simplified assessment of PM mass concentration changes at a representative large airport resulting from changes in FSC
To ascertain the impact that these emission concentration values may have upon mortality rates, it was necessary to calculate emission values in units of µg/m3. There are a number of potential methods which may be used to calculate these values. In the first method, a volume appropriate to an airport can be calculated and the total mass of particulate matter produced assigned homogenously to that volume. However, this type of model takes no-account of climatic conditions and assumes that all of the pollutants remain static and do not dissipate beyond the chosen volume. Therefore the results obtained from such an approach would be very crude. A full dispersion model could be adopted but this is beyond the scope of this report.
The approach adopted was to scale the results derived from the FOA against some results previously obtained for a dispersion model which was run to assess emissions from Heathrow Airport in 2002[19]. See Appendix for details. The data from the FOA calculation was scaled to a fuel sulphur content of 390ppm(m) (this value was selected as the total tonnage of aircraft particulate matter produced in 2002 matches the values calculated using the FOA for this assessment) which is 9 These are some of the assumptions made in the FOA

QinetiQ/09/01835 Page 28
the reason it is included in the results shown in Table 3-7 and is said to be the base-line.
Table 3-7 results show that the range of (dispersed) particulate matter concentrations emitted by aircraft is from 0.16µg/m3 at a fuel sulphur concentration of 10ppm(m) to 0.41µg/m3 at 3000ppm(m). The table also shows the concentration of particulate matter emitted by all other sources such as road transport etc. In this instance, the range is 24.74 to 25.0µg/m3.These Heathrow-based concentration values have been compared to data obtained from a modelling study of Zurich Airport in 2005 [29]. The range of PM concentration in the environs of the airport from this Zurich study was in the range 21 – 29µg/m3, which is broadly in line with the values shown in the Heathrow study, thereby suggesting these background concentrations are not untypical of concentrations to be found at major airports, at least in Europe.
Table 3-7 Change in PM as a function of FSC
This section has addressed PM concentration changes based upon PM emitted during the conventional aircraft LTO cycle. There is however potential for aircraft PM emitted at altitude to affect ground concentrations through atmospheric transport. Impacts from volcanic eruptions, including increases in ground level PM concentration at locations many thousands of kilometres remote from the original eruption would be an example of this effect, albeit an extreme one. There is considerable literature on atmospheric PM transport of such events, although the behaviour of particulates of the size and chemical composition of those emitted from aircraft is less well understood. Quantification of this potential impact from altitude-emitted aircraft PM requires further work. Given the relatively small impact of LTO-based PM, there is potential for the effect of altitude PM emissions from aircraft to be non-trivial compared to the LTO emissions addressed here. Further research and modelling would be useful to begin to address this emerging issue. No further account of this issue is taken in this report.
3.2.4 Assessment of changes in PM-related health impacts at a representative large airport resulting from changes in FSC
Section 3.2.1 provides an overview of the effects that particulate matter may have upon human mortality rates and the potential increase in mortality due to increased PM concentration. Section 3.2.3 provided an estimate of change in PM concentration. An assessment may therefore be made of the impact of aircraft PM in terms of increased mortality.
In order to calculate the mortality rate as a function of increasing particulate matter concentration the assumption has been made that a 1µg/m3 increase in particulate matter results in a 1.1% increase in mortality.
It was found that the overall reduction in aircraft-related particulate matter concentration with respect to a fuel sulphur content of 3000ppm(m) reduced to
FSC ppm Vol-sulphur,t/year Non-vol, t/year Vol, t/year Total tonnes/year Aircraft PM ug/m3 Total PM ug/m3 % change 10 0.25 32.9 3.5 36.6 0.158 24.74 -0.197300 7.37 32.9 3.5 43.7 0.189 24.78 -0.073390 11.50 32.9 3.5 47.9 0.207 24.79 0.000600 14.74 32.9 3.5 51.1 0.221 24.81 0.056900 22.10 32.9 3.5 58.5 0.253 24.84 0.184
1500 36.84 32.9 3.5 73.2 0.316 24.90 0.4412000 48.12 32.9 3.5 84.5 0.365 24.95 0.6383000 58.94 32.9 3.5 95.3 0.412 25.00 0.826

QinetiQ/09/01835 Page 29
10ppm(m) is of the order 0.254µg/m3. Using the evidence presented in Section 3.2 this is equivalent to a reduction in PM-related mortality of 0.28%10. Based upon a typical fuel sulphur content of 600ppm(m), a reduction to 10ppm(m) would result in a reduction of PM-related mortality of 0.07%.
It should be recognised that the mortality rate data is generally applicable to studies conducted in the 1980’s or 1990’s and is likely to be applicable to larger soot particulates. The reason for this is that efficient diesel car technology has only been around for 10 years or so. The result of improvements to the technology is that visible smoke trails are seldom seen, however, the mean particulate size has diminished considerably, resulting in a greater number of ultra fine sub PM2.5 particulates being emitted and potentially inhaled. Detail health impacts will vary significantly from those of larger particulate matter.
3.2.5 Potential monetised impact of sulphur-related aircraft LTO PM emissions
A recent US study [58] suggests that a 90% reduction in the current fuel sulphur levels will give a reduction of around 25% in aircraft related mortality. Applying this value to the aircraft PM contribution, the total aircraft related PM impact on health, monetised, will be around $0.9M per annum, using US-based methods and assumptions. Based upon EU projections up to year 2020 [21], it is estimated that the cost will be of the order €0.13B – €0.43B per annum attributable to aircraft emissions in Europe. European aviation represents around 26% of global aviation [57], extrapolating monetised health impacts to €0.50B – 1.65B per year globally using European assumptions. Both the European estimate and the global extrapolation assume a similar magnitude of benefit between changes in aircraft and general PM. Extensive further research into population, meteorology and PM size/number effects would be required to elaborate on this generalisation. Nevertheless, the US and European extrapolations are of similar magnitude, although uncertainties remain high. Monetisation is covered further in section 9.5.
3.3 Sulphur Dioxide (SO 2) emissions
3.3.1 Health and local environmental impacts of SO2 emissions
The current, major source of sulphur dioxide is from power stations which are generally located outside urban areas. As such, sources of SO2 in the cities are generally declining whilst concentration values in rural areas, whilst not increasing, are greater than those found in cities. Aircraft contribute towards the SO2 levels around the airport and at altitude, which is dissipated over a wide geographical area. The mean concentration of SO2 in European cities is of the order of 500µg/m3 (as of year 2000 (WHO [30])).
Based upon the World Health Organisation report [30], the effect of SO2 upon human health may be summarised as follows:
• People already suffering from lung related ailments such as asthma have a greater sensitivity to SO2 than people with “Normal” health
• SO2 is readily absorbed into the mucous membranes of the mouth and nose and upper respiratory tract. This has a negative impact upon lung function and is amplified when exercising
10 0.412-0.158=0.254µg/m3 *1.1 =0.28% increase in mortality

QinetiQ/09/01835 Page 30
• The effects of SO2 are generally very short: minutes to hours
• The minimum concentration noted to effect asthmatics is 1050 ug/m3
• In the presence of particulate matter and water vapour, gaseous SO2 will mix with water vapour to form sulphuric acid which may be condensed onto smoke particles which upon inhaling may be deposited within the lung
The World Health Organisation examined the results from 14 studies assessing the effects of SO2 on mortality rates and concluded that all of the studies found an association between mortality and ambient SO2 levels. However, it is not clear from the studies whether the increased incidence was only a function of SO2 emissions as other species, such as particulate matter were also present. In the APHEA study [31], SO2 was found to show a statistically insignificant mortality correlation. However, the other studies were generally inconclusive.
Plants, marine life, and limestone building are all detrimentally impacted by SO2 emissions. SO2 is an acidic molecule and when mixed with water reduces the pH. The pH of rainfall is generally slightly acidic from interaction with atmospheric carbon dioxide and is of the order, about 6. pH values less than about 5.5 have a detrimental impact upon aquatic life.
SO2 in the gaseous form is also absorbed by plant life. Long term effects are a reduction in yield, size and an increased susceptibility to disease. Moss and lichens are particularly susceptible as their defence mechanisms are primitive. A publication [32], suggests that SO2 concentration values as low as 9-11 µg/m3 may impact lichen life span whilst most other trees and plants are affected at variable concentrations between about 10µg/m3 to 120µg/m3. Damage to plants may occur by dry deposition of particulates, uptake by the roots and absorption via the leaves. Acid mists with pH values around 3 are particularly damaging to external foliage. The report states that sulphuric acid is more damaging than nitric acid.
3.3.2 SO2 emissions at a representative large airport
Turning to the mass of SO2 emitted from aviation, the conversion rate for fuel sulphur to SO2 is said to be about 100% in gas turbine engines [11]. Therefore knowledge of the fuel sulphur content and the quantity of fuel consumed allows the mass of SO2 to be calculated directly. The aircraft movements shown in Table 3-5 have been used to estimate the total amount of fuel consumed by all aircraft in the LTO cycle at Heathrow airport for the year 2002. The fuel sulphur concentration levels used for this study are shown in Table 1-1 and the estimated quantity of fuel consumed was about 700000 tonnes.
Based upon this fuel consumption and assuming a 100% conversion rate of fuel sulphur to SO2 it was estimated that at a fuel sulphur concentration of 3000ppm(m), about 2000 tonnes of SO2 would be produced. Figure 3-1 shows the results for all of the fuel sulphur levels used in this study and it can be seen that there is a reduction of 386tonne per annum between the mean fuel sulphur concentration value of 600ppm(m) and 10ppm(m).

QinetiQ/09/01835 Page 31
3.3.3 Simplified assessment of SO2 mass concentration changes at a representative large airport resulting from changes in FSC
In order to calculate the likely SO2 concentration in the ambient, an approach similar to that adopted for the determination of the particulate matter was used. However, in this instance it was not possible to scale the results directly to SO2 as the study in question [19] did not include that parameter. However, to achieve what is thought to be a reasonable estimate, the values shown here are based upon predicted NOx levels but were corrected for the different relative atomic mass of sulphur (see Appendix 1 for detail). It is recognised that this type of calculation is first-order, but has been utilised to provide an estimate with respect to the varying concentration of SO2. The results of the modelling study for changes in SO2 concentration in units of µg/m3 are shown in Table 3-5 which shows that the calculated change in concentration varies between about 0.01 and 2.41µg/m3.
FSC ppm Tonnes of SO 2 SO2 ug/m 3
10 7 0.01300 196 0.24600 393 0.48900 589 0.721500 982 1.202000 1310 1.603000 1965 2.41
Table 3-5 Concentration of emitted SO2
3.3.4 Assessment of changes in SO2-related health and environmental impacts at a representative large airport resulting from changes in FSC
The current 600ppm(m) average fuel sulphur content results in a concentration change of 0.48µg/m3. According to a WHO report [30], the minimum concentration necessary to affect asthmatics is 1050µg/m3. It is concluded that reductions in SO2 concentration are highly unlikely to have a measurable health effect. Uncertainty in the assessment is around an order of magnitude, but this does not materially change the conclusion.
0
500
1000
1500
2000
2500
0 200 400 600 800 1000 1200 1400 1600 1800 2000 2200 2400 2600 2800 3000 3200
Fuel Sulphur Content PPM
Ton
nes
of S
O2
per
Ann
um
Figure 3-1Tonnes of SO2 produced per annum at Heathrow
Calculations have been undertaken to establish the concentration of SO2 around an airport and the results are shown in Table 3-5. The maximum calculated value

QinetiQ/09/01835 Page 32
attributable to aircraft was 2.41µg/m3. The minimum value known to effect plant life is 10µg/m3. Excluding other sources of pollution, it is concluded that aircraft related SO2 will have no measurable impact on plant life.
Erosion of limestone will occur in the presence of SO2 and it has been suggested that the minimum safe concentration is about 7µg/m3 [33]. Again it is concluded that there will be no measurable impact on erosion from aircraft-related SO2.
3.4 LAQ effects from emissions at altitude
Most effects of altitude emissions are expressed through assessment of climate change and such effects have been discussed in this section. There is, however the potential for gaseous and particulate emissions to be transported from altitude to ground level to produce additional impacts. Whilst purely gaseous emissions are unlikely to have significant direct effects, two potential PM related effects from emissions at altitude were covered in the LAQ section – namely acid rain and PM transport to ground level.
3.5 Summary of aircraft-related health and local en vironmental impacts
• A survey of available literature has shown that the mortality rate attributable to particle matter is about 1.1% (+100% -30%) per 1µg/m3 increase in particle concentration. 1.1% is the value that has been used in this study. The calculated maximum value predicted by the model used in this work at 3000ppm(m) fuel sulphur was 0.41µg/m3, whilst at 10ppm(m) it was 0.16µg/m3. Therefore a reduction in fuel sulphur content of 2990ppm(m) would result in a decrease in PM-related mortality of about 0.28%. Based upon a typical fuel sulphur content of 600ppm(m), a reduction to 10ppm(m) would result in a reduction of PM-related mortality of 0.07%.
• A recent US study [58] suggests that the global aircraft related PM
impact on health, monetised, will be around $0.9M per annum using US-based methods and assumptions. Based upon EU projections up to year 2020 [21], extrapolated to global level offers a monetised health impacts between €0.50B – 1.65B per year using European assumptions. Both the European estimate and the global extrapolation assume a similar magnitude of benefit between changes in aircraft and general PM. Extensive further research into population, meteorology and PM size/number effects would be required to elaborate on this generalisation.
• Particulate matter is said to be significantly more detrimental to human health than emitted gaseous species in the quantities emitted by current aircraft engines. According to work undertaken by the PARTNER consortium, the factor is about 150:1 [26]. However Wadud [22] suggests a ratio of about 30:1. Health effects of local SO2 emissions from commercial aviation are concluded to be negligible. According to WHO [31] SO2 does not begin to affect asthmatics until a concentration of about 1050 µg/m3 is present. Calculations undertaken in this report suggest SO2 concentration increases of less than 1µg/m3

QinetiQ/09/01835 Page 33
due to aviation-related sulphur emissions. On the basis of this data, direct aircraft SO2 emissions are not assumed to be significantly hazardous.
• Local environmental effects on plant life and on erosion are also concluded to be negligible
• Although assessment of impacts from PM emissions at altitude have
concluded that changes in acid rain impacts will be negligible, there is however potential for altitude emissions of PM to add to the calculated effects from LTO-related PM emissions through atmospheric transport to ground level. Due to the paucity of available data, no quantification has been attempted and further work is required.

QinetiQ/09/01835 Page 34
4 Climate impacts Climate science is not yet unanimous in quantifying the effect of aviation emissions on climate, either in general or specifically for sulphur-based emissions. Three effects have been identified relating to sulphur emissions:
4.1 Sulphate-based particulates
The first is the radiative cooling directly caused by light scattering from sulphate-based particulates. This is a cooling effect and is fairly well understood. Figure 4-1 expresses this effect in terms of radiative forcing (RF) alongside the other climate forcing effects of aviation emissions. Removal of sulphur will result in a net warming from this effect, equivalent to a few percent of aviations total climate impact. For the purposes of this analysis, it is assumed that future fuel sulphur reductions will produce a directly proportional impact reduction, in terms of its future GWP.
It should be noted that aviation is not unique in having a cooling effect from its sulphur emissions. Some industries emit far greater quantities which subsequently enter the upper atmosphere. This has not prevented past policy decisions to reduce sulphur in other power generation and transport fuels.
Figure 4-1 Global radiative forcing (RF) [mW/m2] from aviation estimated for the years 1992 and 2000, based on IPCC (1999) and TRADEOFF results. The whiskers denote the 2/3 confidence intervals of the IPCC (1999) values. The lines with the circles at the end display different estimates for the possible range of RF from aviation induced cirrus clouds. In addition the dashed line with the crosses at the end denotes an estimate of the range for RF from aviation-induced cirrus. The total does not include the contribution from cirrus clouds. Note that there are concerns about RF as a metric for climate change; for example, some RFs (e.g., those from contrails, induced cirrus clouds, and ozone from NOx emissions) are

QinetiQ/09/01835 Page 35
spatially inhomogeneous and seasonally varying, and may not lead to the same temperature change per unit forcing.
Based on past policy decisions to reduce sulphur in other power generation and transport fuels, this global cooling effect is taken to be an unwanted impact in the sense that any perturbation to the global atmosphere is to be avoided. There is an argument that in the event of catastrophic global warming, a cooling effect such as this could be regarded as desirable. For the purposes of this analysis, it is assumed that future fuel sulphur reductions will produce a directly proportional impact reduction, in terms of its future global warming potential (GWP).
4.2 Contrails and cirrus
The second effect is the formation of contrails and aviation-induced cirrus cloud through particulate formation. As illustrated in Figure 4-1, the overall contrail effect is fairly well understood and, in total, is highly likely to be larger that the cooling RF of direct sulphate particles referred to above. In addition to the contrail-effect, there is a potentially greater impact from aviation induced cirrus cloud. Here the level of scientific understanding is poor. The TRADEOFF analysis in Figure 4-1 suggests RF for cirrus cloud at least as large as the contrail effect and possibly larger than the impact of aviation CO2. Sulphates as well as other particulate-forming emissions have a number of complex roles in particulate formation and the subsequent optical properties of any resulting contrails or cirrus cloud. At an ICAO impacts workshop, the formation of particulates were described in the following terms [34]: “Particle emissions from aircraft engines leave the exhaust as a non-volatile component (black carbon soot) and a number of condensable gaseous particle precursor species that contribute to a volatile component later in the plume, or much later through regional processes in the atmosphere. As the exhaust mixes and dilutes with ambient air in the downstream plume, nitrogen oxides, sulphate (sulphuric acid) and organic condensable species undergo gas-to-particle conversion. New particles are formed through nucleation and growth, and the emitted non-volatile particles can become coated with nitrate, sulphate and organic species. The resulting aerosol increases in both mass and number due to the microphysical activity of these condensable species in the mixing aircraft plume”. Specifically on sulphur-based particles in contrails, Schumann [9] concludes that “fuel sulphur contributes to the amount of condensable volatile material in the exhaust plume, influences the size of volatile particles, and activates a larger part of soot particles to affect the number of ice particles formed”.
A photograph taken during the SULFUR series of experiments and shown in Figure 4-2 shows an image of a “young” contrail produced in the plume of an “ATTAS” aircraft. The two engines of the aircraft contained different fuel sulphur concentrations, one was 170ppm(m) and the other 5500ppm(m) [9]. The image clearly shows that the time required for contrail formation is greater with respect to a decreasing fuel sulphur concentration. It was also observed with respect to the higher fuel sulphur concentration engine that contrail formation ceased at an altitude of about 25-50 ft less than the other. However, regardless of the different times for the onset of contrail formation both plumes had a diameter of about 20m after a time span of about 20s. It was reported that the peak particle number densities were 30,000cm3 for particles above 7nm in diameter and 15,000cm3 above 18nm. It was noted that the number of particulates with a diameter of 7nm increased by less than 50% when the fuel sulphur content was increased by a factor of 30. It has been postulated by the authors of the report, that the increase in

QinetiQ/09/01835 Page 36
particulate concentration is a function of the sulphuric acid formed from the conversion of sulphur trioxide which interacts with soot and provides condensation nuclei. It was concluded from the work that the dependence of the fuel sulphur concentration upon the formation of ice particles is still uncertain.
These various contributing factors to contrail and cirrus formation are not well understood. In most cases, contrails will form following passage of an aircraft simply due to the increased water vapour from the exhaust, from the temperature change or even from the pressure perturbation of supersaturated air provided the thermodynamic conditions are right. Using in flight measurements, Schumann [9] found “the effects of fuel sulphur on contrails are smaller than what has been expected before the series of experiments was started and smaller than what was concluded from other experiments. The process of volatile particle formation is not controlled mainly by binary homogeneous nucleation of neutral clusters for which the number of particles would grow more than linear[ly] with the amount of FSC”.
Based on global simulations of cirrus formation via homogeneous freezing, Lohmann and Kaercher [35] concluded that the impact of aircraft-induced sulphate particles on cirrus properties is likely to be negligible.
Whilst changes in sulphur emissions from aircraft may change the optical properties of contrails and cirrus clouds, the extent of these changes is not yet well enough understood to allow quantification. Given the many physical and chemical factors influencing contrail and cirrus formation, it is improbable that a major proportion of any contrails and cirrus impact will be avoided if sulphur were to be reduced or removed from aviation fuel. However, if the climate impact from contrails/cirrus is eventually proven to be large relative to aviation CO2, even these small sulphur effects on contrail/cirrus may have some significance.
Figure 4-2 Effect of FSC on contrail formation (reproduced with kind permission of DLR)

QinetiQ/09/01835 Page 37
4.3 Ozone chemistry
A third climate effect related to fuel sulphur content is the effect of sulphur compounds on ozone chemistry. Quoting from the ICAO PM impacts Workshop in 2008 [34], “…the key reactions that occur on the surfaces of aerosol particles have important effects on the photochemical balance that affects ozone concentrations. The impacts depend on the surface areas available as reaction sites. Changes in PM will shift this balance and change ozone in the atmosphere. For airplanes flying in the stratosphere, the emitted SO2 and PM could lead to increases in the surface area of the sulphate aerosols in the stratosphere. This would lead to a decrease in ozone concentration in the stratosphere. Results from previous studies were summarized in Section 4.3 of the IPCC report. The effect on the tropospheric aerosol is expected to be smaller. Since NOx emission from aircraft is expected to have a larger impact on tropospheric ozone than PM emissions, less effort has been spent in studying this issue.”. For subsonic aviation, which currently flies in the upper troposphere and lower stratosphere, it is concluded that this sulphur effect is small relative to the NOx effect on ozone. Any reduction or removal of sulphur in subsonic aviation fuel could result in a small increase in ozone and hence in aviation radiative forcing. Further atmospheric chemistry modelling and prediction of future flight cruise altitudes is required to confirm this. For supersonic aviation, sulphur removal could result in increased stratospheric ozone and hence in increased radiative forcing. There would also be a slight health benefit in terms of reduced UV exposure. However, currently, there is no supersonic fleet.
For the purposes of this analysis, this potential ozone-related impact is noted as a potential small increase in GWP (or eventually RF) but is not well enough understood to quantify.
4.4 Carbon dioxide and water emissions
In Section 7.3.1, the effect of the hydrodesulphurisation process on energy density is described, concluding that the reduced fuel mass resulting from increased fuel energy density will provide an indicative global commercial fleet fuel saving of around 0.02%. Based on a total fuel used around 200Mt per year [36] this represents 120ktonne pa, with associated CO2 emissions savings of 375ktonne pa. This is, of course, 0.02% of aviation CO2
In Section 7.4 the effect of the hydrodesulphurisation process on the fuel carbon/hydrogen ratio is described. For aviation alone, going from fuel sulphur contents averaging 600ppm(m) to 10ppm(m), results in a decrease in EICO2 from 3.14901 to 3.14894. This is a 0.0022% decrease in EICO2, equating to a 13ktonne annual reduction in CO2 from the 2008 global commercial fleet. A reduction in CO2 emission is clearly a positive effect for aviation. However, the HDS process itself emits CO2. The IPCC report on Aviation and the Global Climate [1] quotes 0.0037 kg of CO2 would be produced in reducing fuel sulphur from 600 ppm(m) to zero per kilogramme of fuel. For the current (2006) annual usage of 200MT of aviation fuel, this equates to 740ktonnes of CO2, clearly far outweighing the potential CO2 benefits. More recent quantitative values are not available and are heavily dependent upon the desulphurisation process used, the amount of sulphur in the feedstock, the CO2-intensity of the energy sources used and the potential use of carbon capture. Potentially, this CO2 “cost” of desulphurisation could be significantly reduced but until this is assured, a potential increase of 0.1% of aircraft CO2 could

QinetiQ/09/01835 Page 38
result from a requirement for complete desulphurisation. Further data from the refining industry is urgently required here.
There is also a small increase in EIH2O resulting from the desulphurisation process. Given the relatively small climate impact of total aviation H2O, this warming effect will be negligible.
4.5 Summary of climate impacts
In summary, noting the large uncertainty in the climate science understanding, reduction/removal of sulphur from aviation fuel is likely to result in:
• An increase in GWP associated with reduced direct impact from sulphate particles and perhaps also from slightly increased ozone in the lower stratosphere – of the order of a few percent of total aviation climate impact
• Potentially, a decrease in GWP up to a similar magnitude from changed contrail and cirrus optical properties. Uncertainty is high and this effect may be close to nil.
• An increase in GWP of up to 0.1% of aviation CO2 from refinery desulphurisation energy production. This will be partially offset by reduced aircraft CO2 emissions due to increased fuel energy density and lower fuel carbon content.
It is considered that there is little to be gained from numerical analysis using this data. Improved scientific understanding and subsequent climate modelling are required to scope the actual direction and magnitude of the climate effect. From the data available here, the most probable climate impact from desulphurisation of fuel is a slight increase in global warming potential.

QinetiQ/09/01835 Page 39
5 The effect that a reduction in specification limits would have upon global fuel production and fuel properties
5.1 Global variations and trends in fuel sulphur co ntent
Although the sulphur content of fuel is reduced from that of crude oil during the refining process, aviation fuel still contains a small but significant amount of sulphur11 . Sulphur in current jet fuel can range from less than 10 ppm(m) up to a specification maximum of 3000ppm(m) with typical levels being around 400-600ppm(m) [37]. Data on the annual mean sulphur levels since 1986 and the distribution of sulphur levels in batches of UK jet fuel for 2008, the latest year for which full data is available, can be seen in Figures 5-1 and 5-2 below. The UK data captures every batch of jet fuel either made in or imported into the UK and is likely to be representative of fuel quality in North West Europe.
Figure 5-1: Batch to batch variation in sulphur content for UK jet fuel supplied in 2008
In 2005, jet fuel annual mean sulphur levels typically varied between 400 and 500 ppm(m). In recent years there has been an increase in the mean. Figure 5-3 below shows that as well as the mean sulphur content rising, the number of batches of fuel with “high” sulphur content i.e. greater than 2000ppm(m) has also started to increase. It may be coincidental but the change begins at around 2005, the time that ULS diesel and gasoline was starting to be introduced.
11 Conventionally produced jet fuel typically contains at least 99.8% hydrocarbon and sulphur compounds with the balance being made up of trace materials including trace organics, nitrogen compounds, oxygen compounds, dissolved water and air.

QinetiQ/09/01835 Page 40
This upward trend in mean sulphur levels may be a result of a number of reasons such as:
• increasing imports of higher sulphur jet fuel
• increasing use of high sulphur crude oils; from sources such as the Middle East and Venezuela, to replace depleted North Sea stocks
• reduced desulphurisation of jet fuel. (As a consequence of the need for reductions in sulphur for gasoline and diesel and lack of refinery capacity to do jet fuel)
Figure 5-2: Variations in the annual mean sulphur content for UK jet fuel supplied between 1986 and 2008

QinetiQ/09/01835 Page 41
Percentage of batches of fuel with sulphur
content greater than or equal to 0.2%
0
1
2
3
4
5
6
1994 1996 1998 2000 2002 2004 2006 2008 2010
Year
Per
cent
age
of fu
el b
atch
es
Figure 5-3 Change in the number of batches with fuel sulphur greater than 0.2% (2000 ppm(m))
The UK data survey is one of the few publicly available sources on jet fuel properties. Other data is available from the Defence Energy Support Center (DESC), part of the US DoD. DESC publish annual data on the fuel quality of what contractors actually supply to DoD. The survey is global. The latest report [38] released in 2008, shows similar, but slightly higher sulphur levels than the UK data as shown in Figures 5-4 and 5-5. These higher levels may be the result of large quantities of fuel being bought in the Middle East which traditionally produces jet fuel with a relatively high sulphur content (and is probably the main source of high sulphur jet fuel in the UK).
0.0
5.0
10.0
15.0
20.0
25.0
30.0
35.0
40.0
45.0
0.00 0.05 0.10 0.15 0.20 0.25 0.30
Total mass %
Per
cent
of t
otal
vol
ume
Figure 5-4: Total sulphur content of fuel purchased by DESC

QinetiQ/09/01835 Page 42
0.03
0.04
0.05
0.06
0.07
0.08
0.09
2000 2001 2002 2003 2004 2005 2006 2007 2008
Year
Tot
al m
ass
%
Figure 5-5: Trend in annual mean sulphur content of fuel purchased by DESC.
In 2006 the Coordinating Research Council (CRC) published a report on the analysis of just under one hundred jet fuel samples drawn from around the world [39]. The programme was an attempt to source as wide a range of jet fuels as possible and investigate their physical and chemical properties. The level of sulphur in the fuel samples was determined by ASTM D2622 and ranged from 0.7 to 2500ppm(m). The average of all samples was 460ppm(m). Ninety-six percent of fuel samples had a sulphur content under 2000ppm(m), 90% had a sulphur content under 1,000ppm(m), and nearly half of the samples had a sulphur content less than 300ppm(m).
The CRC did recently also attempt to investigate whether there were world or regional changes to jet fuel sulphur content as a result of refining changes to accommodate ultra low sulphur diesel and gasoline. Unfortunately the participation by refineries outside the US was low [40]. During the period from September 2005 to August 2006 the survey captured about 17% of European and 20% Pacific region production. Typical monthly sulphur content means were about 250 ppm(m) for Europe and 350 – 400 ppm(m) for the Pacific. The data for Europe certainly should not be taken as being representative of what is consumed in Europe as much of what is used is imported. About 55% of US production was believed to have been captured by the survey over the period September 2005 to February 2008 with the mean typically in the range 600 – 700 ppm(m). This is in fairly good agreement with the DESC studies.
5.1.1 Summary of mean fuel sulphur values
Surveys of jet fuel quality suggest that mean fuel sulphur contents are currently in the region 450 – 800ppm(m). The mean fuel sulphur concentration level in Europe and the U.S appears to be increasing from about the year 2000. Moreover, batches of fuel with a fuel sulphur concentration greater than 2000 ppm(m) is also increasing. In 2000 about 1% of batches had a fuel sulphur concentration greater than 2000 ppm(m), whilst in 2009 the value is about 5.5%.
5.2 How the sulphur reduction would be achieved
Any jet fuel can be converted to an ULS fuel by processing it at high temperature and pressure in the presence of hydrogen and a catalyst. Hydrogen reacts with the

QinetiQ/09/01835 Page 43
sulphur12 in the fuel to form gaseous hydrogen sulphide, which is separated from the fuel. The simple reaction scheme given below as an example shows the reaction of a thiol (mercaptan).
Ethanethiol + Hydrogen → Ethane + Hydrogen sulphide
C2H5SH + H2 → C2H6 + H2S (E6)
In an industrial unit, such as in a refinery, the hydrodesulphurisation13, HDS, reaction takes place in a fixed-bed reactor at elevated temperatures ranging from 300 to 400°C and elevated pressures ranging from 30 to 100kPa, typically in the presence of a catalyst consisting of an alumina base impregnated with cobalt and molybdenum. During the HDS process there can be other changes in fuel properties and composition because the hydrogenation reaction is not limited solely to sulphur containing molecules. This could include a reduction of aromatics, and some other reactive species.
It is unlikely that there is currently sufficient capacity, globally, to hydrodesulphurise the world’s jet fuel so there would need to be a considerable lead in period before ULS jet fuel became mandatory.
Laboratory scale processes can remove sulphur compounds by chemical extraction or adsorption but there are no commercial scale alternatives to HDS currently on the horizon.
Reduction in fuel sulphur could theoretically be achieved by careful refinery selection of crude oils but the global demand for very low sulphur crude oils would probably make this a cost prohibitive means for all but a few refineries.
Synthetic fuels made by the Fischer-Tropsch (F-T) process have close to zero sulphur, being produced from clean carbon monoxide and hydrogen process streams. The South African energy company Sasol has had approval to certify some of its process streams as suitable for blending into conventionally produced jet fuel at up to 50%. Although there is interest from industry in approving other synthetic fuel components very little jet fuel is currently made in this way. There are opportunities in the future for this, but it is not expected that a large fraction of total needs will come from synthetic sources in the foreseeable future. F-T and other alternative jet fuels are considered in greater detail in Section5.5.
The Merox process which is commonly used for treatment of jet fuel process streams works by oxidation of mercaptan sulphur compounds. Sulphur is not removed, just converted to a less reactive form, Therefore this technology is not suitable for producing ultra low sulphur jet fuels.
5.3 Refining capacity
There is currently insufficient hydroprocessing capacity in most refineries to treat all the jet fuel as well as the gasoline and diesel. Any spare capacity was taken up with the demands of gasoline and diesel desulphurisation. Small reductions in sulphur content of jet fuel could be achieved with the use of low sulphur crude oils however these are in limited supply and cost of jet fuel would be almost certain to rise. Large
12 The sulphur in jet fuel usually exists as thiols, sulphides, disulphides or thiophenes. 13 Hydrodesulphurisation is usually known by the refining process terms hydrotreatment or hydroprocessing.

QinetiQ/09/01835 Page 44
reductions in sulphur content could only be achieved through refineries adding more hydroprocessing capacity. The HDS process is energy intensive and removing sulphur in this way leads to increased CO2 emissions from the refinery.
Depending on the complexity of the plant needed (and each refinery will be different) and assuming that a refinery can make a business case for increasing its hydroprocessing capacity, the planning, financing and construction of a new HDS process is expected to take between 2 and 5 years. Getting local permission to build, if granted at all, may add several years to the timescale. No new refineries have been built in Europe or America in the last 30 years despite the large increase in demand for fuels.
Some refineries may choose not to continue making jet fuel because the expense of upgrading their refineries. This may lead to local supply issues.
5.4 Impact of increased hydrodesulphurisation on je t fuel properties
Hydrodesulphurisation of crude oils at the refinery to remove sulphur is also likely to change a number of other fuel properties since the process of removing sulphur also removes or alters other materials in the process streams.
The catalytic process which converts the sulphur in organic molecules into hydrogen sulphide (H2S) will also turn any trace quantities of nitrogen into ammonia (NH3) and oxygen into water (H2O). These sulphur, oxygen and nitrogen containing compounds impart a number of different (but important) properties on the jet fuel containing them. The hydrogenation process can also convert some aromatic type compounds into paraffins. The harder the process is made to run, to reduce the sulphur to lower levels, the more like it is that significant changes will occur in some fuel properties.
To demonstrate this characteristic, an example is provided with respect to changes in fuel density as a function of varying the HDS parameters. The example is provided to highlight the fact that each refinery will produce fuel with different physical properties assuming that they are operating at different conditions. Work undertaken by Knudsen et al [41], shows calculated values for fuel sulphur content and density with relevance to diesel processed using the HDS process. The data of interest from the study are presented in Tables 5-1 and 5-2 which are relevant to HDS treatment at pressures of 32 and 54bar respectively. The initial fuel sulphur concentration at a pressure of 32bar is 12,000ppm(m), whilst at 54bar, the value is 15,000ppm(m), and the final processed fuel sulphur concentration values in both cases are 500, 50 and 10ppm(m).
The tables shows that as the pressure of the process is increased the change in density increases. At a pressure of 32bar the density change varies between 14 – 15kg/m3, whilst at 54bar the variation is 17 – 27kg/m3.
FSC prior to treatment (ppm) 12000 12000 12000Density prior to treatment (kg/m3) 850 850 850
Density after treatment (kg/m3) 835 836 836Pressure(bar) 32 32 32
FSC (ppm) after treatment 500 50 10Density change (kg/m3) 15 14 14
Equivalent density change to 2990 ppm 3 2.8 2.8
Table 5-1 Diesel FSC values as a function of change in density(32 bar) Source Knudsen et al

QinetiQ/09/01835 Page 45
FSC prior to treatment (ppm) 15000 15000 15000Density prior to treatment (kg/m3) 870 870 870
Density after treatment (kg/m3) 853 848 843Pressure(bar) 54 54 54
FSC (ppm) after treatment 500 50 10Density change (kg/m3) 17 22 27
Equivalent density change to 2990 ppm 3.5 4.4 5.4
Table 5-2 Diesel FSC values as a function of change in density (54 bar)(Source Knudsen et al
Defence standard 91-91 states that the density of the aviation fuel should be in the range 775-840 kg/m3 which is a difference of 65 kg/m3. The maximum density change in the above described HDS process is about 27 kg/m3. Therefore it is likely that changes to aviation fuel with respect to deep HDS processes will not impact upon the specification. Other known parameters altered by the HDS process are:
5.4.1 Acidity
Acidity will probably be reduced by the removal of traces of organic acids. Removal of trace acidic species may have a beneficial impact on thermal stability and water reaction.
5.4.2 Aromatics/naphthalenes
Some of the aromatic and naphthalene compounds would be hydrogenated, opening up the ring structures. The level of ring opening would depend on the activity of the hydrodesulphurisation process and the particular aromatics present.
It is possible that the reduction in aromatics may lead to elastomer compatibility issues with any old Buna N type materials.
(The process can be operated in such a way so as not to remove aromatics by careful choice of conditions and catalyst but the operation will always be run in the way that makes most profit for the refinery so each refinery’s product will be slightly different and it will be difficult to forecast the impact on aromatics until the refinery starts to produce reduced sulphur fuel.)
5.4.3 Mercaptan sulphur
These (pungent and corrosive) compounds should be removed completely. It may be possible to remove the requirement from the specification.
5.4.4 Density (and specific energy)
The removal of some aromatic compounds probably will lead to a slight reduction in density. Specific energy will decrease on a volumetric basis but increase on a mass measurement. (see Section 7.2)
5.4.5 Freezing point
The possible increase in branched chain paraffins may lead to a small reduction in the freezing point.

QinetiQ/09/01835 Page 46
5.4.6 Hydrogen content
The hydrogen content of the fuel would increase because of addition during the HDS process.
5.4.7 Smoke point
The increase in hydrogen content would lead to better smoke points and better (more complete) combustion of the fuel and therefore less sooty aircraft emissions. A knock on effect may be some contrail reduction.
5.4.8 Copper corrosion
Very few fuel batches fail because of copper corrosion and the number should be further reduced by the removal of trace levels of acidic species.
5.4.9 Thermal stability
With the reduction in acidity it is likely that typical thermal stability would improve by at least 10-15 °C (at the refinery). Preliminary wo rk carried out by QinetiQ in 2007 looking at sulphur content and correlating with thermal stability supported this generally held opinion [42].
5.4.10 Water separation
The same materials which cause poor thermal stability often cause a deterioration in water separation so it would be expected that water separation would improve, certainly for fuels at the refinery. (Further down the distribution system any improvement may be somewhat reduced by contact with other petroleum products).
5.4.11 Lubricity
The process which removes sulphur also removes the types of molecules which give jet fuels their lubricating ability. Continuous use of lubricity improving additives will almost certainly be needed for civil aircraft or aircraft fuel system modification may be necessary to enable long term running on poor lubricity fuels. The UK specification for Jet A-1, Defence Standard 91-91, has a lubricity requirement based on the level of hydrodesulphurisation and the BOCLE test14. To achieve ULS levels it is likely that the specification would require most fuels to have the BOCLE test and that lubricity improving additives would be required to meet the specification. Eight additives are currently approved but their use would incur unquantified but small additional procurement and handling costs for users.
5.4.12 Conductivity
The conductivity of jet fuel before the addition of Static Dissipator Additive is close to, but not zero. HDS is likely to reduce conductivity even further. Fuel handling procedures may need to be reviewed to take account of the reduced conductivity and the increased risk of static electricity discharge during fuel movements.
14 The BOCLE test, abbreviated from “Ball on cylinder lubricity evaluator”, is controlled by the ASTM D5001 test procedure

QinetiQ/09/01835 Page 47
5.4.13 Antioxidants
Sulphur compounds often act as antioxidants, preventing the formation of peroxides. Antioxidants are already mandatory in hydroprocessed jet fuels certified to Defence Standard 91-91 but not ASTM D1655. However, the current treatment rates may need to be adjusted if all the fuel components have had harsh hydrotreatment.
5.4.14 Summary of the impact of reducing fuel sulphur content on specification properties.
Since jet fuels have a very wide range of compositions and undergo different refining treatments it is not possible to predict at exactly which point in sulphur reduction a fuel properties will undergo significant change. Lubricity is likely to be the first property affected and fuel treatment with additives will probably be needed once the specification maximum for sulphur is in the region of 100 ppm(m). It can be stated that the severity of any property change will be greatest at lowest sulphur levels and that the lower the sulphur limit, the more properties will be affected.
Properties “made worse”
Properties “improved”
Density Acidity
Aromatics & naphthalenes (for effect on aged fuel system elastomers)
Aromatics & naphthalenes (for combustion properties)
Specific energy (on a volume basis) Mercaptan sulphur
Lubricity Freezing point
Conductivity (if additives are not used)
Hydrogen content (though not a specification property)
Smoke point
Copper corrosion
Thermal stability
Water separation
Table 5-3 Impact of the HDS process on specific properties
Importantly it must be remembered that although jet fuel quality is controlled on a day to day basis by the set of tests called up in “Table 1” of Defence Standard 91-91 and ASTM D1655 there are a large number of “assumed specification properties” which are not tested for on each batch. Historical evidence and experience has shown that fuels meeting the requirements of “Table 1” also meet these “assumed properties”.
Moving away from the fuel properties that are currently well understood may necessitate a re-evaluation of whether a new fuel (in this case ultra low sulphur jet fuel) meets the requirements of these assumed properties.
In the recent past, when examining the suitability for approval of synthetic and semi-synthetic jet fuels, the following “assumed” properties have also been investigated:

QinetiQ/09/01835 Page 48
• Correlation between results achieved using referee and technically equivalent methods;
• Compatibility with elastomeric materials; • Lubricity, including response to Lubricity Improving Additive; • Electrical properties (dielectric constant, conductivity and response to
Static Dissipator Additive); • Additive miscibility and compatibility; • Compatibility and miscibility with other fuels; • Combustion properties including impact on starting and relight
performance and emissions; • Bulk physical properties including bulk modulus, specific heat, thermal
conductivity, low temperature/freezing point, viscosity, volatility characteristics, density/temperature characteristics and true vapour pressure;
• Behaviour under test rig and/or whole engine conditions; • Storage stability; • Thermal stability.
Testing may also be required to demonstrate satisfactory operational performance. The scope of such testing will need to be defined by agreement between the appropriate certifying authorities, aircraft and engine manufacturers.
5.4.15 Summary of impact of HDS process
There is currently insufficient hydroprocessing capacity in most refineries to treat all the jet fuel as well as the gasoline and diesel. Any spare capacity was taken up with the demands of gasoline and diesel desulphurisation. Therefore to make significant reduction in sulphur concentration will take some time.
The HDS process varies for each refinery and is dependent upon the feedstock, as such, it is not possible to predict global fuel constituents or changes to physical parameters.
It has been shown in this section that the HDS process has an impact upon several physical parameters. These parameters have been tabulated to show positive and negative effects.
5.5 Alternative fuels
This section describes in more detail the alternative fuel types that could possibly be incorporated in jet fuel in the future. In considering the introduction of increasing amounts of non-conventional fuels, however, it should be noted that conventional petroleum-derived fuel is likely to be ‘held back’ preferentially for aviation, with the less well understood alternative fuels typically likely to be applied to marine or ground transportation.
Currently the only fuel from non-conventional sources permitted in the jet fuel specification is a synthetic fuel made via the Fischer-Tropsch synthesis. Annex D of Defence Standard 91-91, Issue 6, Amendment 1, states that fuels containing hydrocarbons synthesised from non-petroleum sources may be incorporated within the specification provided they can be shown to be compliant with an appropriate set of test requirements. In this way, synthetic fuels are able to obtain ‘specific

QinetiQ/09/01835 Page 49
approval’. This is seen as an interim solution pending the development of a generic approval process that will collectively cover all fuels derived in this manner.
5.5.1 Synthetic fuel from the Fischer Tropsch process
The only two synthetic fuels that are listed in the current jet fuel specification as having the required specific approval are SASOL fully synthetic fuel and SASOL semi-synthetic blending fuel. Both fuels are produced from coal using the Fischer-Tropsch (F-T) process, and are often referred to as coal to liquid (CTL) fuels. In this process, the coal is used to produce synthesis gas, or ‘syngas’, a mixture of gaseous carbon monoxide (CO) and hydrogen (H2). These gases react in the presence of appropriate catalysts to produce long-chained hydrocarbons typical of those found in crude oil.
The synthetic fuels currently permitted in the jet fuel specifications have been developed by the South African energy company SASOL, which has provided a wealth of test data to demonstrate the suitability of these fuels for use as jet fuel. Plans are in place to extend the jet fuel specifications to allow for generic Fischer-Tropsch fuel.
Fuels produced by the Fischer-Tropsch process contain the same types of hydrocarbon molecules as those contained within conventional jet fuel. There are no species present in jet fuels made by the F-T process, just a redistribution of the relative quantities of aromatic and paraffin types15. The absence of undesirable components such as naphthalenes and sulphur can, however, result in a product with significant advantages over standard fuel. The term ‘designer fuel’ is occasionally used to describe this type of fuel, because of the potential for improved properties, which can include:
• Lower freezing point;
• No sulphur;
• Improved thermal stability: up to 50°C improvement on conventional fuel;
• Excellent combustion properties.
The use of hydrogen and carbon monoxide as the reactants means that a wide range of carbon-containing energy sources could act as the raw material in the F-T process. The term used to describe the process depends upon the feedstock used, so that the terms gas to liquid (GTL) and biomass to liquid (BTL) may also be used. An additional term, ‘XTL’ is used to describe a generic feedstock from which CO and H2 could be derived.
The physical properties of the material make it very valuable as a blending component for diesel fuel, worth a significant financial premium over its use in jet fuel for the producer. Current conventional jet fuel production is about 250 million tonnes per annum and the F-T jet fuel about 1 million Tonnes. No data are available for future F-T jet fuel production because of commercial sensitivity. The likelihood of significant quantities of fuels from the F-T process being incorporated into jet fuel are small at present without some other financial inducement.
15 CRC Project No. AV-2-04a. Comparative evaluation of semi-synthetic jet fuels - Final report. Prepared for Coordinating Research Council, Inc. by Clifford A. Moses September 2008.

QinetiQ/09/01835 Page 50
5.5.2 Synthetic fuel from other processes
As described in the previous section, coal can be used as a precursor to the main reactants of the Fischer-Tropsch process, carbon monoxide and hydrogen (syngas). Other processes are also being developed to produce jet fuel directly from coal, without this syngas intermediate. The US has seen considerable activity in this area, because the high levels of coal available as a raw material.
Developments are behind those of F-T, but pilot plants based on hydrotreating of coal have shown that Jet A-1 fuel can be produced very close to the specification requirements. If ongoing work is successful, the resulting fuel is likely to have a higher density and better thermal stability than conventional jet fuel.
Fuels from coal liquefaction show high promise for use as a blend component or even pure jet fuel, but as for F-T fuels, they will need to demonstrate compliance with the existing jet fuel specification. They are not permitted by the terms of the current jet fuel specifications. It is unlikely that meaningful quantities will find their way into the jet fuel pool in the next 10-15 years.
5.5.3 Fatty acid methyl esters
Fatty acid methyl esters (FAME) derived from animal fats or oily crops such as sunflowers are commonly used in ground transportation fuels because they can offer performance benefits, are easy to handle and are considered to offer the potential for a reduction of carbon dioxide emissions over the full life cycle of the fuel. However, they are currently unsuitable for use in jet fuel, even as a blend, because of the considerably higher freezing point of fuel. Even as a blend of ~2% FAME in kerosene, the freezing point of the combined fuel can fail to meet the current specification limit. FAME also has a lower thermal stability than conventional jet fuel, and is known to adversely affect water separation in the fuel. Indeed, the presence of FAME in diesel has caused major concern within the aviation fuel industry because of the use of shared pipelines to transport both diesel and jet fuel. This results in the contamination of jet fuel with FAME, albeit at very low levels. Without significant changes to the way in which fuel is handled at the airport and onboard aircraft it is highly unlikely that FAME will ever see any use as jet fuel.
5.5.4 Hydrogenated vegetable oil
A ‘non-conventional’ fuel that has potential to act as a blending component of jet fuel is hydrogenated vegetable oil (HVO). While HVO is derived from similar types of biomass feedstocks as fatty acid methyl esters, the result is much more compatible with conventional fuel because the products are hydrocarbons such as those typically found in conventional jet fuel now. As the final product has no oxygen content, there are not the energy density problems associated with other bio-derived fuels. The nature of the process is also such that the final product has no sulphur and no aromatics.
The Finnish company Neste Oil already produce HVO commercially for diesel applications, using a proprietary process known as NExBTL. It is not currently used commercially to produce jet fuel, but fuels of this type could readily be applied as a blend component. Similarly to synthetic fuel, the process is catalytic and so there is some degree of control over the final product.
Almost all the HVO produced is required for the ground transportation market to enable fuel suppliers to meet regulations requiring minimum levels of renewable

QinetiQ/09/01835 Page 51
components in gasoline and diesel. It is unlikely that there will be any penetration into the jet fuel pool for HVO in the next 10 years even if the specifications are changed to permit its use because there is currently little economic reason to do so.
5.5.5 Alcohols
Ethanol and methanol
The use of ethanol as a blending component with gasoline in land transport fuels has been successfully adopted on a large scale, especially in countries such as Brazil where plentiful ethanol feedstocks are available. It is highly unlikely that either ethanol, or the similar alcohol, methanol, will ever be used as a blending component in aviation fuel, however, for the following reasons:
The energy content of ethanol is less than two thirds that of conventional jet fuel. This would result in significant weight and volume (hence drag) penalties;
The flash point of both fuels is significantly below that required by the jet fuel specification; ethanol has a flash point of 13°C, w ell below the current Defence Standard 91-91 lower limit of 38°C;
Ethanol is highly polar and so does not mix readily with jet fuel across the operational temperature range of jet fuels (-45 °C to +55 °C). As a result, it would require a significant quantity of surfactants to be added to the fuel as an additive. Butanol
More recently, the possibility of using butanol, C4H9OH, has been suggested. This alcohol has a higher molar mass, which makes it more compatible with conventional jet fuel than the lower molar mass alcohols ethanol and methanol.
The energy penalty of alcohols arises because of the presence of oxygen in the fuel, which provides no energy benefit. In butanol, this oxygen represents a lower percentage of the total mass and so this penalty is less than for ethanol. The specific energy of butanol is 33mJ/kg, which although still less than the current minimum requirement of 42.8mJ/kg is close enough for blended stocks to be considered. Similarly, the increased molar mass makes the volatility of butanol much closer to hydrocarbon fuels, so that the flash point of butanol, 35°C, is much closer to the minimum acceptable level. Butanol can be derived from relatively low-grade biomass and its development as a jet fuel is under consideration by Virgin Fuels and others.
Even if a technical justification for allowing butanol into jet fuel could be made commercial production is very limited16 in comparison with the volumes required. It is unlikely that butanol will be used in aviation in meaningful quantities in the foreseeable future.
5.5.6 Alternative Fuel Summary
Total global commercial aviation fuel production is of the order of 200 million Tonnes per annum. Current production of synthetic fuels (including gasoline, jet fuel and diesel) is approximately 10 million Tonnes per annum of which much less than 1 million Tonnes ends up in aviation turbine fuel. Although there could be small quantities of very low sulphur alternative jet fuels or blending components for jet 16 Somewhere in the range 1-3 million tonnes per annum depending on which information source is used. This is approximately 1% of the jet fuel requirement.

QinetiQ/09/01835 Page 52
fuels introduced in the next 10 years it is unlikely that their introduction will have a significant impact on the average levels of sulphur in jet fuel.

QinetiQ/09/01835 Page 53
6 The effect of low sulphur fuel on aircraft engine and fuel systems
6.1 Lubricity
Most traditionally produced jet fuel contains low levels of polar sulphur, nitrogen and oxygen containing compounds which, because they preferentially absorb on metal surfaces, impart a certain degree of lubricating quality to the fuel. Hydrodesulphurisation processes used for removing sulphur from jet fuel can cause a reduction in lubricity because not only is the sulphur removed but also the other polar material. The lubricity of a jet fuel cannot be predicted from its physical and broad chemical properties but has to be measured by use of a somewhat empirical test such as the BOCLE17 test which is called up in Defence Standard 91-91. It should be noted that aromatics also contribute to the fuel’s lubricating properties. Fuels with similar sulphur and aromatics content can have very different lubricating qualities depending upon the exact species present.
ULS jet fuels typically have very poor lubricity. If the lubricity of a jet fuel is found to be less than desired then lubricity improving additives can be added to the fuel. A number of permitted formulations are already listed in Defence Standard 91-91 and other jet fuel specifications. (Their use is mandatory in all military jet fuels). The additives contain fatty acids and are used at typically 10-20ppm. The aircraft most at risk from poor lubricity fuels are the older ones introduced into service before the specification for fuel pump endurance on low lubricity fuels was tightened in 1995. Traditionally additive use has been avoided in civil jet fuels because of the cost of the additive, the logistics of additive injection and water separation issues. (Some additives are known to have a detrimental effect on water coalescer performance).
6.2 Elastomer compatibility
Material compatibility in fuel systems is a concern whenever fuel composition changes. It is known that alternating exposure to severely hydrogenated fuel and typical jet fuel leads to a hardening of elastomers (gaskets, seals, fillers etc) caused by the change in the aromatic content of the fuel. There is potential for ULS jet fuel to degrade certain types of elastomers over time. Previous experience indicates that problems are likely to be from the use of older technology nitrile rubber such as Buna N. These seals absorb aromatics in the fuel and swell; however, ultra low sulphur fuels will probably contain lower levels of aromatics and could cause shrinkage and cracking. This issue can be avoided with the use of fluoroelastomers, such as Viton although there may still be issues with some sealants. Therefore the problem may be smaller with aviation than it was with certain road vehicles on the change to ULSD.
6.3 Peroxide formation
Hydroprocessing jet fuel components to remove sulphur will also remove molecules which act as antioxidants from the fuel. This may allow the formation, in the fuel, of
17 ASTM D5001, Ball-on-cylinder lubricity evaluator

QinetiQ/09/01835 Page 54
peroxides and hydroperoxides. These species attack elastomers in aircraft fuel systems resulting in leaks or failed fuel control units. Currently the formation of peroxides is controlled in fuel certified to Defence Standard 91-91 (and other military fuels18) by the mandatory use of phenolic antioxidants in hydroprocessed components. (In ASTM D1655 the use of antioxidants is optional rather than mandatory).Treatment levels may need to be re-assessed to ensure fuel system integrity if ULS jet fuels become commonplace. Alternatively, elastomers which are more resistant may need to be used.
6.4 Thermal stability
Fuel is used as a coolant for many of the fuel, hydraulic and lubricating system components as well as the combustion system injectors. The tendency is for increasing thermal load requirements as engine temperatures get hotter to enable an increase in efficiency and/or power. Some compounds containing sulphur and nitrogen, such as sulphides, indoles and pyrroles, cause a reduction in thermal stability so hydroprocessing to remove sulphur (and fortuitously other trace species which promote thermal instability) would lead to an improvement in thermal stability and therefore maintenance saving because of reduced engine deposits.
If thermal stability does rise then equipment manufacturers could design their engines to operate on the better quality fuel giving the opportunity to run for longer between maintenance or better fuel economy. However, any improvement at the refinery may not be seen by the time the fuel gets to the skin of the aircraft because of the potential for contamination with trace quantities of unstable material (e.g. FAME) in the distribution system – the benefit needs to be proven.
6.5 Effect of fuel sulphur upon combustion hardware
Sulphidation is a type of corrosion found within gas turbine combustors and is generally associated with the use of high sulphur content fuels, typically 1% or greater (also known as green rot). It is therefore not directly applicable to aviation combustion systems due to the reduced sulphur content of the fuel and is generally related to naval applications where higher sulphur fuels are more common. However, there may be a set of circumstances where it is of relevance with respect to aviation combustors. If for example a fuel injector were to become partially blocked, neat fuel could conceivably be sprayed against the metal wall of the combustor. In this type of scenario, ideal conditions for the onset of sulphidation would be present.
Any level of sulphur in fuel has the potential to initiate corrosion in nimonic alloys which are used in combustor liners. For corrosion to occur it would be necessary for liquid fuel to impinge upon the hot-metal surface of the combustor liner. With modern air-blast fuel injection systems this is not likely to occur as fuel droplets are atomised into nanometer sized droplets and are instantly combusted. However, there are potential scenarios where the fuel galleries at the exit of the fuel injector may become partially blocked with carbon and this then offers the potential for an uneven fuel pattern and the possibility that neat fuel may impinge upon hot metal surfaces. If this occurs and remains undetected for a period of time there is a
18 Antioxidants are not required (although they are permitted) in hydroprocessed fuel certified to the US specification ASTM D1655.
QinetiQ/09/01835 Page 55
possibility that the metal will be weakened and the integrity of the combustor could be compromised. Any reduction in the sulphur content of the fuel would be beneficial in this regard as the smaller the amount present then the less likely the chance of corrosion.
Modern airspray fuel injectors associated with aircraft gas turbines include seals which are used to augment fuel staging and also valves to shut the injector when the engine is not in use thus preventing coking of the internal surfaces. “Goodrich” who manufacture aviation fuel injectors were contacted to solicit there views. They stated that changes to the aromatic content of the fuel may affect the seals in the injection system particularly at low temperatures [43].
6.6 Summary of the effects upon engine and fuel sy stems
ULS jet fuels typically have very poor lubricity, however, improving additives can be added to the fuel.
Alternating exposure to severely hydrogenated fuel and typical jet fuel leads to a hardening of elastomers (gaskets, seals, fillers etc) caused by the change in the aromatic content of the fuel. These problems may be overcome by replacing old seals etc with for example viton.
Detrimental peroxides may form in the HDS process as antioxidants are removed from the fuel. The fuel can however be treated or, alternatively, elastomers which are more resistant may need to be used.
Thermal stability of the fuel is likely to be increased.
A reduction in fuel sulphur is likely to enhance the life of the combustor and associated hardware.

QinetiQ/09/01835 Page 56
7 The operational effects of changing fuel sulphur content
7.1 Introduction
As previously discussed in Section 5.4, the HDS process alters the physical and chemical properties of the fuel. Changes to parameters such as density and specific energy may impact upon the operation of the aircraft as volume changes may affect the range. Subsequent changes to the carbon-hydrogen ratio of the fuel also alter the quantity of CO2 and H2O emitted. Increasing the hydrogen content of the fuel results in enhanced combustion efficiency which may also have an impact with respect to NOx formation. This section discusses these issues and to an extent quantifies them where feasible. However, it must be recognised that it is difficult to provide definitive quantification due to the variability of both the HDS process and the composition of the feedstock.
Refineries in different parts of the world have their own unique operating regimes which have been derived based upon the local composition of the feedstock. Regions with high sulphur content may use a 3-stage, high-pressure-HDS process whilst other localities with low sulphur levels may utilise a single-stage, low-pressure-HDS process or perhaps none at all. The net result is that different batches of low sulphur fuel may have significant variability in, for example, their aromatic content. This has a subsequent impact upon combustion efficiency and particulate formation.
7.2 Operational Effects
7.2.1 Fuel Savings from density and energy changes in the HDS process
Equation 6 represents a typical reaction in the HDS process and shows a single sulphur atom being exchanged for a hydrogen atom and subsequently being expelled as hydrogen sulphide gas. R denotes any alkyl group.
R1.S.R2 + 2H2 � R1.H + R2.H + H2S (E7)
This reaction results in the density of the fuel being decreased because the relative mass of a mole of hydrogen atoms is 1g whilst that of sulphur is 32g. However, the specific energy of the fuel increases due to the energy associated with the addition of the hydrogen atom.
To determine the likely change to energy and density the following calculations have been undertaken based upon the assumption that one sulphur atom is exchanged for one hydrogen atom.
To determine the energy difference associated with the change in fuel sulphur concentration, equation 7 has been used [44]. The relationship between the mass of hydrogen, density and sulphur content is based upon well established empirical studies and provides a good approximation.

QinetiQ/09/01835 Page 57
energy = 37.2889+0.556173wH-0.326wS-0.0023003p (E8)
where wH is the mass fraction of hydrogen
wS is the mass fraction of sulphur
p density
The density of the fuel has been calculated using equation 8:
Density = f * (%H) + g (E9)
Where f =-0.04311 kg/l and g = 1.398 kg/l
The constants used in equation 8 were derived from empirical data found in the 2007 PQIS database [45] and were validated from work undertaken in a CAEP study looking at the impact of reduced fuel sulphur content [46]. The equation itself is based upon the relationship between hydrogen content and fuel density.
The baseline composition of the fuel used for this analysis is shown in Table 7-1.
Carbon % mass 85.89Hydrogen % mass 13.82Sulphur % mass 0.06
Density kg/m3 800.94Specific Energy mJ/kg 43.13
Table 7-1 Composition of baseline fuel
Figure 7-1 shows a plot of the calculated density and specific energy against fuel sulphur concentration in the range 10 to 3000ppm(m) and Table 7-2 shows the actual values. The plot shows that as the fuel sulphur concentration is reduced the density decreases and the energy increases. Table 7-2 shows that the changes over the range 2990ppm(m) for density and specific energy are 2.14 kg/m3 and 0.13 mJ/kg respectively. The table also includes values for the change in hydrogen concentration.
Figure 7-1 also shows the change in energy density. Reduction of sulphur from 3000ppm(m) to 10ppm(m) implies an energy density increase from 43.03 to 43.16 mJ/kg i.e. an increase of 0.3%. This offers a fuel saving due simply to the aircraft having to carry 0.3% less fuel mass to obtain the same energy output. Ignoring secondary “snowball”19 effects”, simple calculations for old and modern medium size commercial aircraft using the PIANO aircraft performance tool, [47] offer fuel consumption savings of 0.01% on short flights to around 0.2% on long range flights. Actual fuel savings would be around one fifth of this as actual fuel sulphur content is around one fifth of the specification limit (600ppm(m) cf 3000ppm(m)) and the 19 The “snowball effect” applies to aircraft design where an initial saving in weight, for example, reduces the amount of fuel required. This then allows smaller fuel tanks and smaller wings, which in turn allows further weight savings and even smaller tanks and wings. Analogous to a benefits increasing like a snowball getting bigger as it rolls downhill.
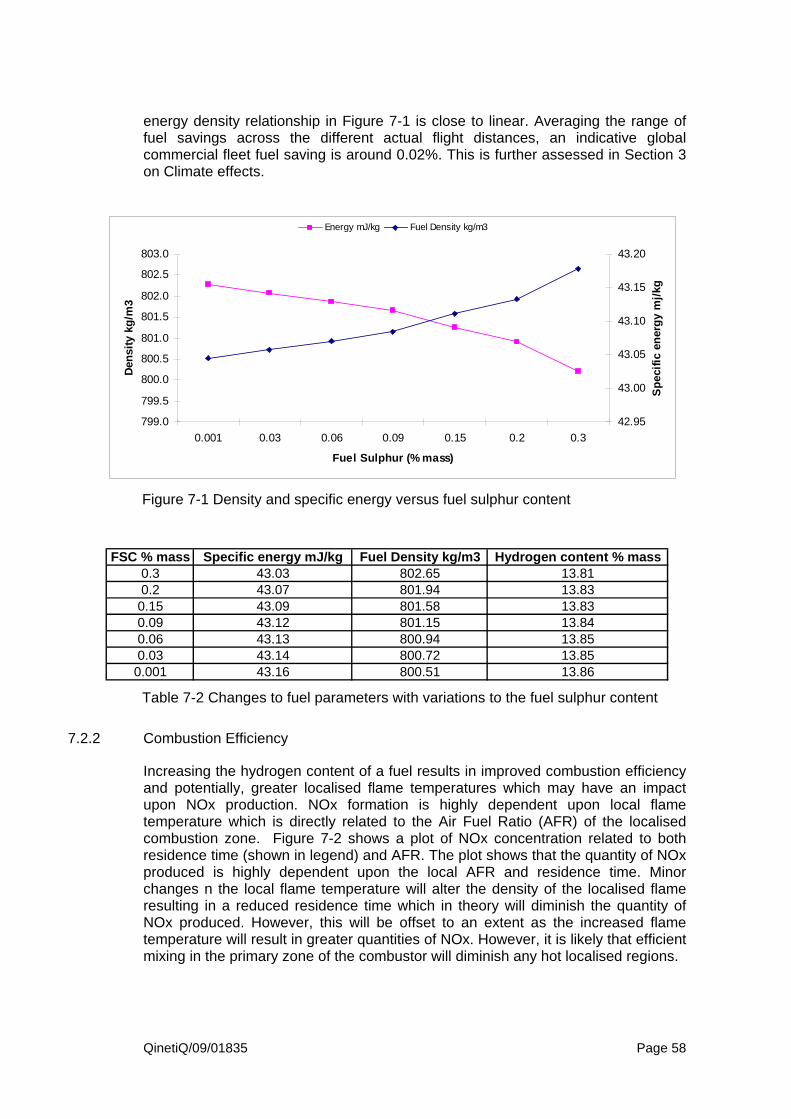
QinetiQ/09/01835 Page 58
energy density relationship in Figure 7-1 is close to linear. Averaging the range of fuel savings across the different actual flight distances, an indicative global commercial fleet fuel saving is around 0.02%. This is further assessed in Section 3 on Climate effects.
42.95
43.00
43.05
43.10
43.15
43.20
0.30.20.150.090.060.030.001
Fuel Sulphur (% mass)
Spe
cific
ene
rgy
mj/k
g
799.0
799.5
800.0
800.5
801.0
801.5
802.0
802.5
803.0
Den
sity
kg/
m3
Energy mJ/kg Fuel Density kg/m3
Figure 7-1 Density and specific energy versus fuel sulphur content
FSC % mass Specific energy mJ/kg Fuel Density kg/m3 Hydrogen content % mass0.3 43.03 802.65 13.810.2 43.07 801.94 13.83
0.15 43.09 801.58 13.830.09 43.12 801.15 13.840.06 43.13 800.94 13.850.03 43.14 800.72 13.85
0.001 43.16 800.51 13.86
Table 7-2 Changes to fuel parameters with variations to the fuel sulphur content
7.2.2 Combustion Efficiency
Increasing the hydrogen content of a fuel results in improved combustion efficiency and potentially, greater localised flame temperatures which may have an impact upon NOx production. NOx formation is highly dependent upon local flame temperature which is directly related to the Air Fuel Ratio (AFR) of the localised combustion zone. Figure 7-2 shows a plot of NOx concentration related to both residence time (shown in legend) and AFR. The plot shows that the quantity of NOx produced is highly dependent upon the local AFR and residence time. Minor changes n the local flame temperature will alter the density of the localised flame resulting in a reduced residence time which in theory will diminish the quantity of NOx produced. However, this will be offset to an extent as the increased flame temperature will result in greater quantities of NOx. However, it is likely that efficient mixing in the primary zone of the combustor will diminish any hot localised regions.
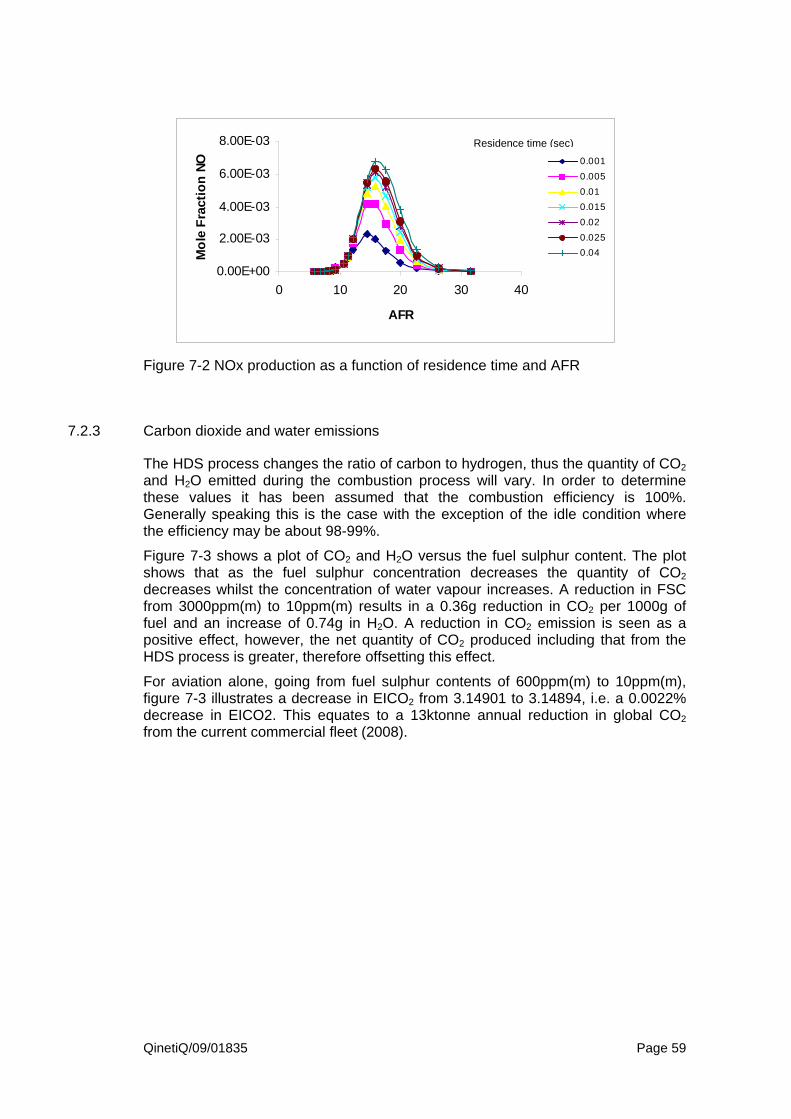
QinetiQ/09/01835 Page 59
0.00E+00
2.00E-03
4.00E-03
6.00E-03
8.00E-03
0 10 20 30 40
AFR
Mol
e F
ract
ion
NO 0.001
0.005
0.01
0.015
0.02
0.025
0.04
Figure 7-2 NOx production as a function of residence time and AFR
7.2.3 Carbon dioxide and water emissions
The HDS process changes the ratio of carbon to hydrogen, thus the quantity of CO2 and H2O emitted during the combustion process will vary. In order to determine these values it has been assumed that the combustion efficiency is 100%. Generally speaking this is the case with the exception of the idle condition where the efficiency may be about 98-99%.
Figure 7-3 shows a plot of CO2 and H2O versus the fuel sulphur content. The plot shows that as the fuel sulphur concentration decreases the quantity of CO2 decreases whilst the concentration of water vapour increases. A reduction in FSC from 3000ppm(m) to 10ppm(m) results in a 0.36g reduction in CO2 per 1000g of fuel and an increase of 0.74g in H2O. A reduction in CO2 emission is seen as a positive effect, however, the net quantity of CO2 produced including that from the HDS process is greater, therefore offsetting this effect.
For aviation alone, going from fuel sulphur contents of 600ppm(m) to 10ppm(m), figure 7-3 illustrates a decrease in EICO2 from 3.14901 to 3.14894, i.e. a 0.0022% decrease in EICO2. This equates to a 13ktonne annual reduction in global CO2 from the current commercial fleet (2008).
Residence time (sec)

QinetiQ/09/01835 Page 60
1.2424
1.2426
1.2428
1.2430
1.2432
1.2434
1.2436
1.2438
0.30.20.150.090.060.030.001
Fuel Sulphur (% mass)
H2O
EI
3.14870
3.14880
3.14890
3.14900
3.14910
3.14920
3.14930
3.14940C
O2
EI
H2O CO2
Figure 7-3 EI CO2 and H2O as a function of FSC
7.3 Other operational effects
7.3.1 Winter diesel
During particularly cold weather diesel fuel used to be diluted with low levels of aviation turbine fuel to permit low temperature operation20. This is no longer possible with typical jet fuel because the sulphur content of the jet fuel would put the diesel fuel out of specification. Lowering the sulphur content of jet fuel would allow a return to this practice. Assuming that the fuel sulphur concentration of aviation fuel were to be reduced this would be a practical consideration and would be beneficial.
7.3.2 Pipeline operation
Jet fuel now causes problems for pipeline operators, in that they must use extra steps to ensure segregation between “high sulphur” jet fuel and low sulphur ground transportation fuels. Operators used to cut the more safety critical jet fuel into other products to avoid contamination of the jet fuel. They can no longer do this because of the relative sulphur levels. Very low levels of jet fuel in ULSD could put the diesel fuel off specification. A move to ultra low sulphur Jet A-1 would reduce this problem and enable pipelines to operate more efficiently.
7.4 Summary of operational effects from changes in FSC
The HDS process alters the density and heat capacity of the fuel. As the fuel sulphur concentration is decreased the density decreases and the energy increases. Calculations have shown that a reduction in the mass of the fuel for an
20 While in western Europe winter grade diesel typically ceases to flow around -15 to -25 °C jet fuel is still pumpable down to at least -50 °C.

QinetiQ/09/01835 Page 61
increased heat capacity amounts to estimated fuel saving of around 0.02% or 120ktonne per annum when averaged across the different actual flight distances.
Due to potential improvements in combustion efficiency, hence greater local temperatures, there is a possibility that NOx emissions may increase.
As the fuel sulphur content is reduced emissions of CO2 will be reduced and emissions of H2O will increase.
Assuming that the fuel sulphur concentration of aviation fuel were to be reduced in line with values used for other low-sulphur fuel, it would be feasible to use common pipe-lines which would be beneficial. However, this is currently not feasible due to large sulphur content of aviation fuel which would potentially contaminate other fuel.

QinetiQ/09/01835 Page 62
8 Comparison with fuel sulphur reduction in other transport sectors
8.1 Introduction
Where specification levels for sulphur have been reduced for environmental reasons, such as in Europe with EN228 and EN590, current sulphur levels are close to the specification maximum. This is very different from aviation fuel where the sulphur content is not currently a constraint on production and as a result the levels are very variable.
8.2 Changes to global road transport fuel specifica tions
8.2.1 Europe
Discussions to reduce the sulphur levels in ground transportation fuels began during the early 1990s following the decision to remove lead from gasoline. The changes to the gasoline and diesel specifications (EN228 and EN590 respectively) started during the late 1990s and continued until early this year. The progression can be seen in the table below. 1997 2000 2005 2009 Diesel Sulphur, ppm (max) 2000 350 50 10 Gasoline Sulphur, ppm (max) 500 150 50 10
Table 8-1: EU Gasoline & diesel regulations – summary of changes from 1997 - 2009
8.2.2 Rest of the world - Gasoline
Gasoline sulphur levels have now fallen to less than 100ppm(m) sulphur in North America but most of the rest of the world still has sulphur limits between 250 and 2500ppm(m) as can be seen in the figure below [48]. The general trend is towards lower sulphur content. Most countries have plans to reduce the level to the range 50-150 by 2015.

QinetiQ/09/01835 Page 63
Figure 8-1: Global gasoline fuel specification sulphur limits in gasoline.
8.2.3 Rest of the world - Diesel
North America has reduced its sulphur content to similar levels to those of Europe. Most countries in Asia have plans to reduce the sulphur content of their diesel down to between 50 and 300ppm(m) maximum during the period 2010-2012 [49]. Some large conurbations within the region have plans to reduce the sulphur levels to less than 50ppm(m). The figure below shows the distribution of sulphur levels in road diesel across the globe in 2008.

QinetiQ/09/01835 Page 64
Figure 8-2: Global diesel fuel specification sulphur limits [50]
8.3 Marine fuels
The sulphur limits of marine fuels are generally much higher than those for road and air transport. Maximum global fuel sulphur limits used for marine fuels is governed by MARPOL21 regulations. MARPOL has been signed up to by almost every nation with an ocean shoreline. MARPOL Annex VI imposes a number of restrictions on fuel quality:
• Imposes a global cap on marine fuel sulphur level of 4.5% m/m
• Provides for SOx Emission Control Areas (SECA) where fuel sulphur levels are not to exceed 1.5 % m/m, or the use of exhaust gas treatment for SOx emission control is required. (Within Europe the Baltic Sea was designated a SECA in May 2006 and the North Sea in November 2007.)
MARPOL Annex VI requirements for the next 12 years see a significant reduction in sulphur content for marine fuel. These are expressed graphically in the figure below [50].
21 Marpol is one of the most important international marine environmental conventions. It was designed to minimize pollution of the seas, including dumping, oil and exhaust pollution. Its stated object is: to preserve the marine environment through the complete elimination of pollution by oil and other harmful substances and the minimization of accidental discharge of such substances.

QinetiQ/09/01835 Page 65
Figure 8-3: Proposed reductions in sulphur content for marine fuels
Most marine fuels comply with standards set by International Organization for Standardization (ISO). ISO 8217:2005 lays out the requirements for different grades of distillate and residual fuels. Much more marine fuel is residual than distillate. Sulphur limits are set to align with MARPOL regulations.
ISO 8217 sulphur limits for the different grades22 are given in the tables below:
22 DMX is a special light distillate intended mainly for use in emergency engines. DMA, also called marine gas oil, MGO, is a general purpose marine distillate that must be free from traces of residual fuel. DMX and DMA fuels are primarily used in Category 1 marine engines (< 5 litres per cylinder). DMB, marine diesel oil, MDO, is allowed to have traces of residual fuel, which can be high in sulphur. This contamination with residual fuel usually occurs in the distribution process, when using the same supply means (e.g., pipelines, supply vessels) that are used for residual fuel. DMB is produced when fuels such as DMA are brought on board the vessel in this manner. DMB is typically used for Category 2 (5-30 litres per cylinder) and Category 3 (≥ 30 litres per cylinder) engines. DMC is a grade that may contain residual fuel, and is often a residual fuel blend. It is similar to No. 4-D, and can be used in Category 2 and Category 3 marine diesel engines. Residual (non-distillate) fuels are designated by the prefix RM (e.g., RMA, RMB, etc.). These fuels are also identified by their nominal viscosity (e.g., RMA10, RMG35, etc.).
DMX DMA DMB DMCSulphur content % (m/m) 1.0 1.5 2.0 2.0
Marine Distillate Fuels
0.00%
0.50%
1.00%
1.50%
2.00%
2.50%
3.00%
3.50%
4.00%
4.50%
5.00%
2008 2010 2012 2014 2016 2018 2020 2022 2024
Year
Sul
phur
Per
cent
age
by W
eigh
t
SECA (ECA)
Global

QinetiQ/09/01835 Page 66
Table 8-2: Sulphur requirements for fuels certified to ISO 8217
8.3.1 The EU [51] sets lower limits for marine fuels than is required by MARPOL. Current regulatory limits are summarised as:
• Sulphur limit of 0.1% m/m for MGO used by all vessels between EU ports
• Sulphur limit of 1.5% m/m for bunker fuel23 used by passenger vehicles travelling to, from and between EU ports
• Sulphur limit of 1.5% m/m for bunker fuel used by all vessels in the Baltic and North Sea SECAs
• Sulphur limit of 1.5% m/m for marine diesel oils supplied in EU ports
Adopted future regulatory changes are:
• 01/01/2010: Sulphur limit of 0.1% m/m for bunker fuel for all vessels at berth and inland waterways
• 01/01/2010: Sulphur limit of 0.1% m/m for all MGO sold in EU ports
8.3.2 In addition, for North America the most stringent requirements are set by the California Air Resources Board. For auxiliary diesel or diesel-electric engines within 24 nautical miles of California, SOx emissions are required not to exceed those achieved by operating on a sulphur limit of 5000ppm(m) for marine gas oil or marine diesel oil. In 2010 this will reduce to a sulphur limit of 1000ppm(m) for marine gas oil. In Canada, Environment Canada has also set the following requirements:
• From June 2007 a sulphur limit of 500ppm(m) on marine diesel produced in or imported into Canada and since October 2007 a sulphur limit of 500ppm(m) on marine diesel sold in Canada.
• From June 2012 a sulphur limit of 15ppm(m) on marine diesel produced in or imported into Canada shall apply.
8.3.3 Currently most marine fuels are largely derived from refinery distillation residue streams. The MARPOL changes to fuel requirements will probably require ships currently using fuel oil to switch to gas oil, a distillate product already in tight supply within the EU. Ships are major users of fuel oil produced from EU refineries, which represents about 15-20% of refinery output. Although there are some options to treat and upgrade residual fuel oil, most of which require substantial investment, without this market there would be little economic use for fuel oil. A world where all marine fuels are gas oil based rather than fuel oil based would be radically different to the current refining environment. Other middle distillate products such as
23 Bunker fuel is the fuel which powers the ship rather than fuel which is carried as a cargo by the ship.
RMA RMB RMD RME RMF RMG RMH RMK RMH RMK30 30 80 180 180 380 380 380 700 700
Sulphur content % (m/m) 3.5 3.5 4 4.5 4.5 4.5 4.5 4.5 4.5 4.5
Marine Residual Fuels

QinetiQ/09/01835 Page 67
automotive diesel and aviation turbine fuel would come under tremendous supply pressures.
8.4 Motivation for the reduction in road transport FSC
The motivation behind the removal of lead from gasoline followed by the reduction in sulphur from sulphur content of gasoline and diesel fuels was primarily to improve local air quality. The virtual removal of sulphur should improve the efficiency and prolong the life of exhaust catalysts.
Ultra low sulphur gasoline is "enabling technology" in that it optimises the efficiency of new direct injection petrol engines that improve fuel economy and reduce emissions of carbon monoxide, unburnt hydrocarbons and NOx combined with suitable exhaust catalysts.
ULSD will enable the new generation of diesel vehicles to meet the same strict emission standards as gasoline-powered vehicles. The new engines will utilise an emissions-reducing device called a particulate filter. The process uses a filter which traps the tiny particles of soot in the exhaust fumes. The filter has a sensor that measures back pressure, or the force required to push the exhaust gases out of the engine and through to the tailpipe. As the soot particles in the particulate filter accumulate, the back pressure in the exhaust system increases. When the pressure builds to a certain point, the sensor tells the engine management computer to inject more fuel into the engine. This causes heat to build up in the front of the filter, which burns up the accumulated soot particles. The entire cycle occurs within a few minutes and is undetectable by the vehicle's driver. However, it should be borne in mind that the increased processing at refineries to make sulphur-free fuels also uses more energy and these increases in CO2 emissions may offset to some extent the gains made in these new vehicles. Data produced for the regulatory impact assessment of European Directive 2003/17/EC relating to the quality of petrol and diesel fuels forecasts that the increase in UK emissions is predicted to be 0.525 Mt CO2 per annum, assuming all petrol and diesel supplied is sulphur-free. However it is not clear from the document whether the reduction is from the pre 2005 fuel sulphur levels or post 2005.

QinetiQ/09/01835 Page 68
9 Route to jet fuel specification change - costs, benefits, barriers and opportunities
9.1 Introduction
In this section, analysis from earlier sections is distilled to provide a policymakers’ assessment of the relative costs and benefits of aviation sulphur reduction through fuel specification changes. In a study such as this, the scope for research limited. As a consequence there are gaps in the available information which make precise, comprehensive quantification impossible. Instead, quantification has been carried out where possible and a scenario approach taken to provide insight into possible futures and possible policy costs and benefits.
Having outlined costs and benefits, this section then moves on to examine other barriers and opportunities which will need to be addressed if a fuel sulphur reduction policy is to be enacted.
9.2 Estimates of the cost of sulphur reduction in j et fuel
In the course of this project, the authors met with aviation fuel/refining specialists from three of the major multinational oil companies. Although these meetings were fruitful in terms of helpful advice and opinion, none were able to provide any cost estimates. Specifically, no figures are available from individual oil companies for the anticipated additional cost of producing ultra low sulphur jet fuels because of commercial sensitivity. However, an indication of the costs can be gained by considering the corresponding cost increases when diesel fuels made the transition to ultra low sulphur.
In Europe a report by CONCAWE [52] reported that the cost to EU refineries would increase by between 1.8 and 2 billion Euros for the reduction to 10ppm(m)24, roughly equally split for gasoline and diesel. They forecast the additional cost to be equivalent to approximately 6.2 Euros/tonne or 0.74 eurocents/litre. This was of the same order of magnitude as the EPA work described below, although at the bottom of their range.
In the US, the cost of producing ULSD from then-standard diesel fuel was estimated as an additional 5.4 cents per US gallon (approximately 1.1 eurocent/litre25) to produce and distribute over the period from 2006 to 2010. About 80% of this cost was estimated to be refinery desulphurisation with most of the rest being for distribution and a little for the use of lubricity improving additive [53]. EPA estimated that, after 2010 when all on-road diesel fuel had to meet the 15ppm(m) standard, there would be an overall additional 4.7 US cents per gallon (approximately 0.95 eurocent/litre) to produce and distribute. At the start of the US fuel sulphur reduction process in 2001 EIA [55] estimated a range of 5.1 to 7.2 cents per gallon (approximately 1-1.4 eurocent/litre) of additional cost to produce and distribute ULS diesel fuel between 2007 and 2015. In 2006 the EPA [54]
24 Starting from base levels of 350 ppm(m) sulphur for diesel and 150 ppm(m) for gasoline 25 Using the exchange rate of $1.30 to 1 Euro and 1 US gallon equating to 3.8 litres.

QinetiQ/09/01835 Page 69
reconfirmed that “(ULS) diesel fuel cost an additional 4 to 5 US cents per gallon to produce and distribute.”.
The data from the reductions in sulphur for gasoline and diesel should be applicable to understanding the cost implications of similar moves for jet fuel. The temperature range for the distillation of jet fuel is lower than that for diesel so the HDS process should be slightly easier and therefore potentially marginally cheaper. So a rough guide to the cost of reducing sulphur levels to about 10ppm26 for jet fuel should be about 1-1.5 eurocent/litre. For sulphur levels between current production and 10ppm(m) the cost will be variable depending on individual circumstances because refineries have a range of options to meet any specification requirements.
The costs discussed above are relevant to diesel fuel and it is not possible to emphatically state the costs applicable to aviation fuel. Were this to be the case, desulphurisation of the 200Mtonnes per year of commercial aviation fuel would cost around €250M-€375M per annum. A summary of the qualitative impact of stepwise sulphur reduction on fuel production, properties and specification is given below for 2000, 1500, 1000, 600, 300, 100 and 10 ppm(m) maximum fuel sulphur levels. 2000 ppm(m) sulphur limit
• Minimal impact on fuel production technology. • Minimal impact on refinery operation. • Very few refineries not able to supply. • Market can accommodate change. • No measurable change to quality of the global jet fuel pool.
1500 ppm(m)
• Minimal impact on fuel production technology. • Minimal impact on refinery operation. • Very few refineries not able to supply. There may be a very few local supply
issues. • Market will accommodate change. • No measurable change to quality of the global jet fuel pool.
1000 ppm(m) sulphur limit
• No radical impact on fuel production technology. • No impact on 80% of (current) global jet fuel pool. • 20% of the pool will require additional hydrotreating or use of other crude
oils. • Market will accommodate change. • Some reduction in lubricity predicted but not enough to require widespread
use of additives or changes to other elements of the specification. • Little impact on other fuel quality parameters.
600 ppm(m) sulphur limit
• No radical impact on fuel production technology. • Impact on approximately 50% of (current) global jet fuel pool. • There may be local supply issues.
26 Starting from a base of around 600 ppm(m)

QinetiQ/09/01835 Page 70
• Some reduction in lubricity predicted but not enough to require widespread use of additives or changes to other elements of the specification.
• Little impact on other fuel quality parameters. 300 ppm(m) sulphur limit
• Impact on approximately 75% of (current) global jet fuel pool. • There may be local supply issues. • Some reduction in lubricity predicted. • Little impact on other fuel quality parameters.
100 ppm(m) sulphur limit
• Fuel will need to have less sulphur than almost all jet fuel produced today. • More than 90 % of (current) global jet fuel pool affected. • Lead time required for planning and installing additional hydrotreating.
capacity which will need to be dramatically increased. • Small and inflexible refineries may choose not to produce jet fuel. • Changing overall chemistry would require a re-examination of specification
properties and controls. • If hydrocracking techniques used there may be an impact on aromatics
content. • Impact on lubricity may require the need to use additive in most fuels if
hardware solutions are not implemented. • Some improvement in thermal stability. • Reduced fuel conductivity. • Possible improved water separation.
10 ppm(m) sulphur limit Similar issues but much more extreme than 100 ppm(m)
• Large costs to industry and long lead times required for implementation • Small or inflexible refineries may choose not to produce jet fuel • Could see more hydrocracking • May facilitate more use of GTL fuels and jet fuels from non-conventional
sources such as hydrogenated vegetable oils • Complete change to quality of global jet fuel pool. Generally the same
molecules as current fuel but in very different proportions. There will be a need to look carefully at full range of performance and specification parameters
• Significantly poorer fuel lubricity. Additives will be required. • Much improved thermal stability which may enable new engine technologies • Lower (better) freezing point if hydrocracking or GTL technologies used • Reduction in aromatics content resulting in improved combustion but may
cause fuel system elastomer issues These impacts on fuel production, properties and specification allow a judgement to be made on the relative cost of various reductions in the fuel sulphur content limit. This is developed further in Section 9.5.

QinetiQ/09/01835 Page 71
9.3 Environmental benefits
9.3.1 Health and local environmental effects
In Section 3.2.4 it was concluded that:
• based upon a typical fuel sulphur content of 600ppm(m), a reduction to 10ppm(m) would result in a reduction of PM-related mortality of 0.07%
• health effects of local SO2 emissions from commercial aviation are concluded to be negligible
• local environmental effects on plant life and on erosion are also concluded to be negligible
• assessment of impacts from PM emissions at altitude have concluded that changes in acid rain impacts will be negligible, although there is however potential for altitude emissions of PM to add to the calculated effects from LTO-related PM emissions.
It was also concluded that the relationship of the principal benefit – reduced PM emissions – would be, for the purposes of this analysis, approximately linear to the reduction in sulphur mass in the fuel combusted. This will allow comparison of the relative benefit of reduced maximum fuel sulphur limits, once the effect of the regulatory change on average fuel sulphur content has been established (Section 9.4). A caveat to this is the apparent change in particle size distribution at low sulphur contents which, for gas turbines, may give increased benefits at low sulphur contents (Section 2).
9.3.2 Global climate effects
In Section 4.5 it was concluded that sulphur reduction to ultra-low levels could increase global warning potential. However, there was considerable uncertainty over magnitude and direction of the actual impact and until further scientific knowledge becomes available, no further quantification of impact is feasible.
9.4 Assessment of reductions in the FSC limit
In this section, an assessment is made of the relative benefits of reductions in the maximum fuel sulphur content in aviation fuel. Using data on existing sulphur content distribution in recently analysed fuels, the potential reduction in total sulphur mass is assessed for each of the maximum fuel sulphur contents in Table 1.1. These percentage reductions are then used as indications of the relative impact reduction in terms of health.
9.4.1 Assessment of reduction in total fuel sulphur mass for various maximum FSCs
As discussed in Section 5.1, only limited data is available on the global distribution of fuel sulphur content within aviation fuel delivered to customers. The data in Figures 5.1 and 5.4 provide a distribution of fuel sulphur content in delivered fuel, primarily to UK and US. Taking the US data as an example, Figure 9-1 below shows the juxtaposition of the Table 1.1 limits against the 2008 US fuel supply analysis.

QinetiQ/09/01835 Page 72
0 .9
10 .35
29 .48
35 .92
14 .08
6 .29
2 .520 .47
0
5
10
15
20
25
30
35
40
50 125 500 1000 1500 2000 2500 2825
Ave rage FSC for Band
% o
f tot
al v
olum
e
2000150060030010
Figure 9-1 2008 US Analysed Fuel Sulphur Content Against Potential Specification FSC Limits
To assess the actual total sulphur mass reduction from any one of these limits, assumptions have been made on how fuel batches which do not meet a reduced specification limit for sulphur are dealt with. In one case, if manufacturers know the FSC for any given batch then, where the fuel meets the reduced sulphur limit, nothing is done and the fuel could be delivered to the customer. If the fuel is above the limit, the batch could be further treated to reduce the sulphur to, say, 20% below the reduced limit to give a margin to avoid need for further re-treatment. Alternatively the non-conforming fuel could be diverted from the aviation fuel supply chain and replaced with a batch which does conform. In the absence of further data, this replacement batch is assumed again to be 20% below the reduced limit. These processes are represented visually for the 2000ppm(m) case by the coloured arrow in Figure 9-1. It should be noted that results are not highly sensitive to this 20% margin assumption as much of the reduction comes from firstly meeting the revised limit itself. Applying this methodology to the US and UK figures in Figures 5.1 and 5.4 provides the revisions in total sulphur mass shown in Table 9-1. The table shows the percentage of sulphur mass in the aviation fuel combusted for the range of maximum fuel sulphur contents under consideration. This is expressed as a percentage of the sulphur mass in the current fuel supply at the 3000ppm(m) limit. Overall fuel quantity is unchanged.
Maximum FSC 3000 2000 1500 600 300 10 Sulphur Mass
(US 2008 data) 100% 95% 87% 44% 25% 1%
Sulphur Mass (UK 2007 data)
100% 92% 87% 58% 35% 1%
Table 9-1 Example Relative Fuel Sulphur Mass for Various Maximum FSC Limits (expressed as a percentage of current fuel sulphur mass)

QinetiQ/09/01835 Page 73
The percentage improvements in Table 9-1 are similar between the two data sources, differing significantly only for the 300 and 600ppm(m) limits. This reflects the different shape of the distributions and possibly the limits of interpretation of the data. It should be recognised that globally and regionally, the percentage improvements are likely to vary according to the source of the feedstock and its sulphur content, to the refineries used to produce the fuel and to the amount of sulphur treatment employed in those refineries. In a region where only high FSC feedstock is used, for example, a limit reduction to 2000 may result in a reduction of 30% in fuel sulphur27. This compared with the 5-8% reduction in the Table above. Given this global variation, the figures in Table 9-1 should be regarded as indicative only. They will vary from year to year and from region to region. Nevertheless, the fuel samples analysed are taken from supplies representing 40% of global commercial aviation in 2007. The application of the indicative sulphur reductions to each of the various LAQ and climate related impacts described in Sections 3 and 4 is potentially complex. The chemical, physical, environmental and health processes involved are not in themselves linear. However, if it is assumed that the impacts reduction resulting from any given aviation sulphur reduction is only a small contributor to the overall impact, then the changes will tend toward linear. For the quantified related impacts, where in most cases aviation sulphur is only a small component of the total sulphur-related concentration, this assumption can be used. Ideally more detailed study would be required, particularly at low sulphur contents, where health impacts may be further improved as test evidence suggests that for gas turbine combustion, the relative quantity of more harmful sub-10nm PM is reduced. Until further scientific understanding is available and pending further study, the percentages shown in Table 9-2 have been derived from the batch analysis earlier in this section to provide an indication of potential impact reduction from stepwise reductions in the maximum aviation kerosene maximum fuel sulphur content.
Maximum FSC 3000 2000 1500 600 300 10
Indicative Global
Averaged Impact
Reduction
0% 5-10% 10-15% 40-60% 60-80%% 99%
Table 9-2 Indicative Average Percentage Impact reductions form Reductions in maximum Fuel Sulphur Content
These ranges are presented in graphical form in Figure 9-2 below, with an example range shown for 600ppm(m) maximum allowable sulphur:
27 Assumed average 2500ppm(m) FSC supply reduced to 80% of 2000ppm(m) (ie 1600ppm(m))

QinetiQ/09/01835 Page 74
0
10
20
30
40
50
60
70
80
90
100
0 500 1000 1500 2000 2500 3000
Fuel Sulphur Content - Max Limit
% Im
pact
Red
uctio
n
Figure 9-2 Range of potential LAQ impact reduction for various reductions in maximum allowable aviation kerosene fuel sulphur content
9.4.2 Future trends in sulphur-related emissions from commercial aviation
Current commercial aviation fuel use is estimated at around 200Mt per year [56]. Average fuel sulphur content is around 600ppm(m) giving a mass of sulphur combusted around 12000 tonnes per year. This section uses three scenarios to provide a range of trends for future commercial aviation sulphur-related emissions and the potential effect that reduced fuel sulphur content limits might have on those scenarios. Aviation growth ICAO CAEP have provided estimates of future commercial aviation fuel use to the GIACC [56]. Adjusting these estimates as described in the reference paper to account for all commercial aviation usage28, under a business-as-usual (BAU) case, these provide a range of projections for commercial aviation fuel use. Annual consumption grows from the current 200Mt to around an extrapolated value of 900Mt in 2050. These values are based on a continued aviation demand growth around 4 to 5% per annum, typical of the past 40 years in commercial aviation. Higher and lower demand growths are also covered by ICAO CAEP forecasts. Values for these would be expected to be around 20% higher or lower respectively than the fuel use quoted above. These estimates are shown in Figure 9-3.
28 The GIACC paper notes that the bottom-up estimate omits a number of non-scheduled and other flights. The paper provides an estimate for this adjustment.

QinetiQ/09/01835 Page 75
930
738
0
100
200
300
400
500
600
700
800
900
1000
2005
2007
2009
2011
2013
2015
2017
2019
2021
2023
2025
2027
2029
2031
2033
2035
2037
2039
2041
2043
2045
2047
2049
2051
Mt A
viat
ion
Fue
l
"BAU" Baseline
High Demand + Baseline Tech/Ops
Low Demand + Baseline Tech/Ops
Figure 9-3 CAEP FESG 2006 “Central-BAU”, “High” and “Low” Forecasts for Commercial Aviation Fuel Use
The 3 projections in Figure 9-3 assume typical rates of fuel efficiency and operational efficiency improvement as a consequence of improved technology being introduced into the aviation system. Lower fuel use projections which relate to the best foreseeable evolutionary technology improvements are shown in Figure 9-4, noting that no highly revolutionary concepts are yet foreseen for commercial aviation in this period.
Central (BAU) Demand
(BAU)
Low Demand
High Demand

QinetiQ/09/01835 Page 76
930
842
658
0
100
200
300
400
500
600
700
800
900
1000
2005
2007
2009
2011
2013
2015
2017
2019
2021
2023
2025
2027
2029
2031
2033
2035
2037
2039
2041
2043
2045
2047
2049
2051
Mt A
viat
ion
Fue
l
"BAU" Baseline
Advanced Tech & Ops
High Adv Tech & Ops
Figure 9-4 CAEP FESG 2006 “Central”, Forecast for Commercial Aviation Fuel Use with “BAU”, Advanced and Highly Advanced Technology and Operational Improvements
For the purposes of the subsequent analysis below, the “BAU Baseline” case has been used to assess future sulphur emissions based on a number of fuel-sulphur related scenarios. However, from the analysis presented in this section, it should be noted that there are further scenarios based on either low demand or improved technology which individually could reduce aviation fuel use by 20-25% below the BAU baseline. In combination, a reduction of around 30% is feasible. There is also the potential for higher demand growth than the “BAU Baseline” case, although this is difficult to foresee under current political conditions regarding climate change. Sulphur emissions growth For this scenario-based projection, it is assumed that sulphur based-emissions will be proportional to the sulphur mass in the fuel combusted. All values are quoted against the 2006 value (12000 tonnes S) set at 100%. Potential sulphur emissions growth is set against three scenarios, all using the BAU baseline growth in aviation fuel usage:
• A Current fuel sulphur levels • B Increased use of high sulphur feedstock • C Increased use of alternative (bio) fuel feedstock
For the purposes of establishing a “baseline” for these scenarios, no change in the fuel specification sulphur limits is assumed.
Advanced Technology and Operational
Efficiency
Highly Advanced Technology and
Operational Efficiency

QinetiQ/09/01835 Page 77
Scenario A: Current Fuel Sulphur Levels – Future Baseline
With the current spread of fuel sulphur content continuing unchanged, sulphur emissions under the “BAU” scenario would increase in simple proportion with fuel use as shown in Table 9-3:
Year FSC
(ppm)
Scenario A Baseline Sulphur Emissions
(2006=100% 2006 600 100% 2016 600 146% 2026 600 208% 2036 600 295% 2050 600 465%
Table 9-3 Commercial Aviation Fuel Sulphur Emissions under the “BAU” Scenario. (100% = 12000tonnes during 2006)
Scenario B: Increased Use of High Sulphur Feedstock – Future Baseline
In this scenario, it is assumed that use of high sulphur feedstock, typified by tar sands/shale, becomes economic and that it is refined to meet the fuel sulphur standard with a margin of 20% (eg for a 3000ppm(m) standard, fsc would be 2400 on average for these fuels. A number of scenario assumptions are feasible, but for this illustration, 30% of feedstock is assumed to move from current average (600ppm(m)) to 2400ppm(m) sulphur content by 2036, that level remaining constant to 2050. Under this scenario, sulphur emissions would increase as shown in Table 9-4:
Year FSC
(ppm)
Scenario A Baseline Sulphur Emissions
(2006=100%) 2006 600 100%
2016 10% 2400 90% 600 190%
2026 20% 2400 80% 600 333%
2036 30% 2400 70% 600 561%
2050 30% 2400 70% 600 883%
Table 9-4 Commercial Aviation Fuel Sulphur Emissions under an “Increased High Sulphur Feedstock” Scenario. (100% = 12000tonnes during 2006)
Scenario C: Increased Use of Alternative (Bio) Fuel Feedstock – Future
Baseline In this scenario, introduction of alternative fuel feedstock is foreseen. Manufactured from bio or synthetic constituents, this feedstock is assumed to have close to zero sulphur content. Again, a number of scenario assumptions are feasible, but for this illustration, 30% of feedstock is assumed to move from current average (600ppm)

QinetiQ/09/01835 Page 78
to zero sulphur content by 2036, that level remaining constant to 2050. Under this scenario, sulphur emissions would increase as shown in Table 9-5:
Year FSC
(ppm)
Scenario A Baseline Sulphur Emissions
(2006=100%) 2006 600 100%
2016 10% 0 90% 600 131%
2026 20% 0 80% 600 167%
2036 30% 0 70% 600 207%
2050 30% 0 70% 600 325%
Table 9-5: Commercial Aviation Fuel Sulphur Emissions under an “Increased Alternative Fuel Scenario (100% = 12000tonnes during 2006)
9.4.3 Impact of reduced sulphur limits on the three sulphur scenarios
In Table 9-1, the impact of reduced sulphur limits in global aviation kerosene specifications was assessed relative to batches of 2007/8 US and UK fuel as shown in Table 9-1. For the purposes of the above three illustrative scenarios A, B and C, the average of the US/UK percentage FSC figures in Table 9-1 is combined with the baseline future sulphur emissions for each scenario (Table 9-6 to Table 9-8) to produce matrices of future sulphur emissions with respect to compliance against various FSC levels. Each of the three following tables shows the mass of aviation fuel sulphur emissions for a given future year compared to the current (2006) fuel sulphur emission.
Maximum FSC (ppm)
3000 2000 1500 600 300 10
2006 100% 2016 146% 136% 127% 74% 44% 1% 2026 208% 195% 181% 106% 62% 2% 2036 295% 276% 257% 151% 89% 3% 2050 465% 435% 404% 237% 139% 5%
Table 9-6 Scenario A – Future Commercial Aviation Sulphur Relative Emission Mass against Various Maximum FSC Levels (Current Feedstock Sulphur Content Distribution. 100% = 12000tonnes during 2006)

QinetiQ/09/01835 Page 79
Maximum FSC (ppm)
3000 2000 1500 600 300 10
2006 100% 2016 190% 162% 143% 79% 45% 2% 2026 333% 267% 228% 118% 67% 2% 2036 561% 430% 357% 176% 97% 3% 2050 883% 676% 562% 277% 153% 5%
Table 9-7 Scenario B – Future Commercial Aviation Sulphur Relative Emission Mass against Various Maximum FSC Levels (Increased High Sulphur Content Feedstock. 100% = 12000tonnes during 2006
Maximum FSC (ppm)
3000 2000 1500 600 300 10
2006 100% 2016 131% 123% 114% 67% 39% 1% 2026 167% 156% 145% 85% 50% 2% 2036 207% 193% 180% 105% 62% 2% 2050 325% 304% 283% 166% 98% 3%
Table 9-8 Scenario C – Future Commercial Aviation Sulphur Relative Emission Mass against Various Maximum FSC Levels (Increased Ultra Low Sulphur Content Feedstock. 100% = 12000tonnes during 2006
The data in the tables above is illustrative, in the sense that a number of assumptions have been made on the percentage of high/low sulphur feedstock, on the behaviour of the industry in processing various feedstock types and on the global nature of any given specification change. In addition, the high/low demand and technology scenarios introduced at the beginning of this section introduce a wider range of potential uncertainty over the actual magnitude of future aviation fuel burn and hence sulphur emissions. Notwithstanding these caveats, the three scenario tables provide a clear picture of the potential increase in commercial aviation sulphur emissions and the level of reduction in allowable maximum sulphur level needed to maintain current emission levels. In order to stabilise the current level of global aviation sulphur emissions under all three scenarios, the FSC limit would need to be reduced along the following timelines:
2016: between 600 and 1500ppm(m) 2026: between 300 and 600 ppm(m) at some point between 2036 and 2050: below 300ppm( m)

QinetiQ/09/01835 Page 80
9.5 Comparing costs and benefits of reduction in ma ximum allowable fuel sulphur content
Returning to consideration of current aviation, the health benefits of almost total sulphur removal have been quantified as far as practicable for LAQ-related PM effects, with uncertainty over unquantified additional impacts from altitude-related PM and from climate change. For almost total sulphur removal, LAQ-related PM impacts were estimated as a reduction in PM-related premature deaths of 0.07%. Various preferences for further evaluation of impacts are used in Europe and the reader is left to select an appropriate evaluation criteria. If monetisation is the chosen route, then (as summarised in section 3.2.5) based on E.U data [21] it has been estimated that there are 3.6 million life years lost per annum due to PM at an estimated cost of between €189B – €609B per annum for future year 2020. Based upon increased mortality due to LTO-cycle sulphur based PM aircraft emissions of 0.07% this equates to a cost between €0.13B – €0.43B per annum attributable to aircraft emissions in Europe. European aviation represents around 26% of global aviation [57], extrapolating monetised health impacts to €0.50B – €1.65B per year globally using European assumptions based upon the 0.07% reduction in mortality discussed above. Moreover, a reduction in mortality due to LTO-cycle sulphur based PM aircraft emissions which would lead to a general EU wide benefits of a similar magnitude. Both the European estimate and the global extrapolation assume a similar magnitude of benefit between changes in aircraft and general PM. Extensive further research into population, meteorology and PM size/number effects would be required to elaborate on this assumption.
A recent study [58] uses US modelling and atmospheric assumptions to calculate equivalent monetised values using US-based assumptions. Here, a 90% reduction in the current sulphur levels is computed to give a reduction of around 25% in aircraft related mortality (mean reduction of 58 premature deaths per year from a mean total of 210 in the continental USA - 90% confidence levels 130 to 340 total premature deaths). Again using US-based assumptions, total premature mortality was valued at $1.4B (Year 2000US$), implying a benefit of $0.35B from (90%) sulphur removal. Since US domestic and international aviation represents around 40% of total global commercial aviation, a global extrapolation suggests a global monetised benefit from (90%) sulphur removal could be around $0.9B (year 2000US$) – assuming global application of US national assumptions. This is in line with the European-based data in the preceding paragraph.
Set against the additional refining costs of the order of €250-375M per year and the relatively soluble technical issues with transportation and use of low sulphur fuel, there would appear to be an emerging cost-benefit case for sulphur removal. However there remain uncertainties over refining-related costs and over the actual extent of the benefits. In addition, if the potential climate change is monetised on a comparable basis, it is suspected that the case would be less clear. It is noteworthy that desulphurisation in other industries was not prevented by such climate consideration, despite similar direct-sulphur effects from a proportion of their sulphur emissions at ground level. The section above considered close to total sulphur removal. Options exist for a less dramatic approach by partial sulphur removal. Benefits relative to total sulphur removal were shown in Figure 9-2 whilst qualitative assessment of refining and related costs were summarised in Section 9.2 above. Bringing these together, Figure 9-5 illustrates the relative benefits and costs for the range of maximum allowance sulphur from 10ppm(m) to 3000ppm(m).
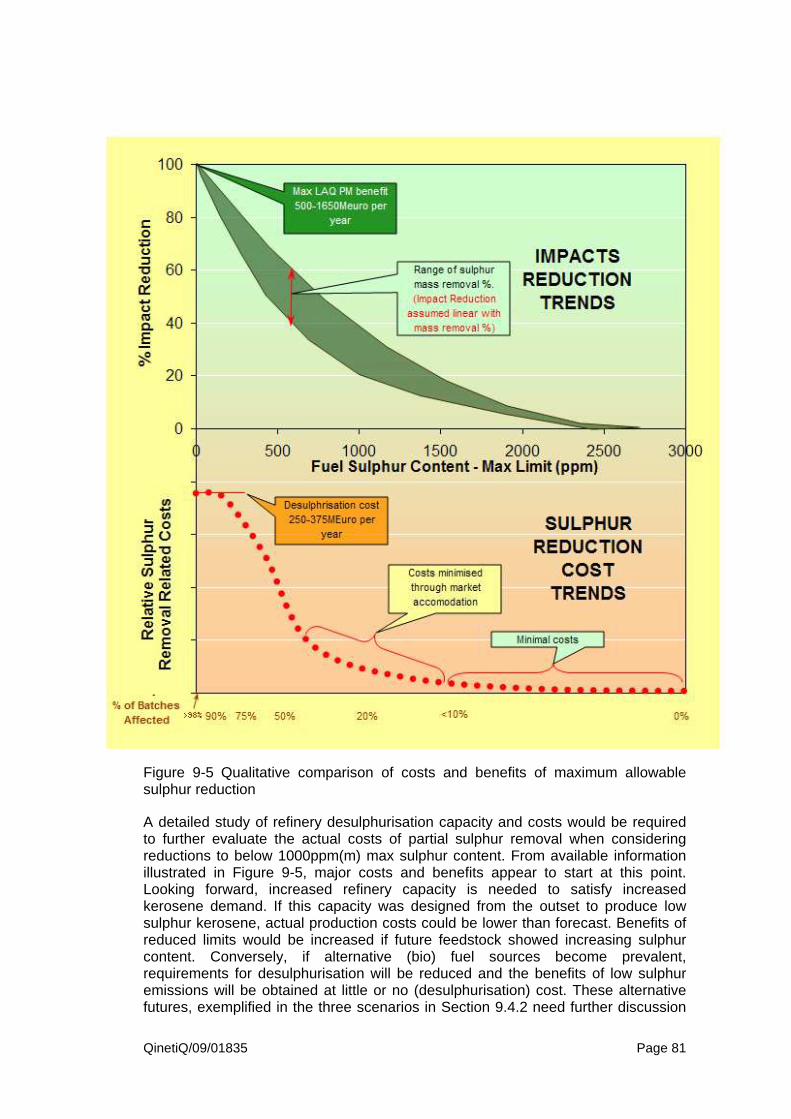
QinetiQ/09/01835 Page 81
Figure 9-5 Qualitative comparison of costs and benefits of maximum allowable sulphur reduction
A detailed study of refinery desulphurisation capacity and costs would be required to further evaluate the actual costs of partial sulphur removal when considering reductions to below 1000ppm(m) max sulphur content. From available information illustrated in Figure 9-5, major costs and benefits appear to start at this point. Looking forward, increased refinery capacity is needed to satisfy increased kerosene demand. If this capacity was designed from the outset to produce low sulphur kerosene, actual production costs could be lower than forecast. Benefits of reduced limits would be increased if future feedstock showed increasing sulphur content. Conversely, if alternative (bio) fuel sources become prevalent, requirements for desulphurisation will be reduced and the benefits of low sulphur emissions will be obtained at little or no (desulphurisation) cost. These alternative futures, exemplified in the three scenarios in Section 9.4.2 need further discussion

QinetiQ/09/01835 Page 82
with the supply industry to determine a strategy to meet environmental, business and economic needs. A number of these issues are discussed in the following section.
9.6 Barriers and opportunities
9.6.1 Aviation fuel specification sulphur limits
Most of the world’s jet fuel is produced to specifications which limit the maximum sulphur to 3000ppm(m). Details are given in the table below:
Specification Country Limit (ppm) Defence Standard 91-91 UK1 3000
ASTM D1655 US2 3000 QAV-1 Brazil 3000
Can/CGSB-3.24 Canada 3000 GB 6537-2006 China 2000
GOST 10227 (TS-1 fuel) Russia 2000 GOST R 52050 (equivalent of Jet A-1) Russia 2500
1 UK specification, for historical reasons, covers Europe & most of Africa, Asia (outside China and Russia) and Australia/New Zealand. 2 US specification is also used as basis for some South American countries.
Table 9-9: Major jet fuel specs and their sulphur limits
It can be seen that the maximum permitted sulphur levels are much higher than those for road fuels, but generally less than those for shipping, as shown in section 8.2.1 for automotive and 8.4 for marine. It should be remembered that although the specification maximum may be 3000ppm(m) most jet fuel is produced in the range 400 – 800ppm(m). There are no known plans for the introduction of lower sulphur limits for any of the major specifications.
Any change in the UK specification would need to be coordinated with the US because there is nothing currently available to prevent producers ceasing to certify to the Defence Standard and using ASTM D1655 instead. Commercial practice at present is for refineries to produce fuel to the most stringent requirements of both ASTM D1655 and Defence Standard 91-91 to enable easy movement of product29. If one specification becomes much more stringent than the other in some respect, such as sulphur content, the likelihood is that companies will cease to use that specification which could cause confusion and disruption to supplies.
The commercial sensitivities of investment decisions have prevented any detailed estimate of the impact of reducing jet fuel sulphur on fuel availability with oil companies.
29 The Aviation Fuel Quality Requirements for Jointly Operated Systems (AFQRJOS) is a combination of the most stringent requirements of the UK and US specifications. Commonly known as the ‘Check List’, this list is designed for the major oil companies to ensure interoperability across most regions. It follows that the maximum sulphur level permitted by this list is also 0.3% m/m (3000 ppm)

QinetiQ/09/01835 Page 83
9.6.2 Regulation
A compelling technical justification needs to be made and found to be persuasive at the major jet fuel specification committee meetings. As a minimum these bodies should include UK MoD’s Aviation Fuels Committee, ASTM (US’s civil jet fuel specification setting body) and within NATO. For preference the change would also need to be acceptable in Russia and China. Within ASTM and UK’s Aviation Fuels Committee specification setting bodies the following groups of stakeholders would need to be consulted:
• Fuel producers;
• Civil and military operators/users;
• Engine, fuel system and airframe manufacturers;
• Pipeline operators and fuel distributors;
• MoD (and their partner Nations in NATO);
• Regulators such as national aviation authorities.
The key players in the Western specifications’ approval process would be the original equipment manufacturers (OEMs), of which the following are by far the most important:
• Rolls-Royce (for aero-engines)
• General Electric (for aero-engines)
• Pratt & Whitney (for aero-engines)
• Boeing (for airframes)
• Airbus (for airframes)
• Honeywell (for small gas turbines and auxiliary power units (APUs))
The key stages in specification reduction for sulphur would be as follows: • Formal request from EASA or FAA, for example, to specification
authorities including verifiable supporting technical data on cost and benefits, including expected changes to jet fuel properties;
• Review of the data by industry bodies. (Defence Standard 91-91 and ASTM D1655 would probably agree to look jointly at the data and would probably refer the definition of any further requirements to the Coordinating Research Council, supported by the OEMs);
• Where necessary, define and perform any test programme to determine the effect of the low sulphur fuels on materials, engine operability, fuel handing systems and safety. Any test programme should be based on a confirmation of “no harm”. As such it would probably focus on lubricity and materials compatibility issues;
• Approval for the change by key OEMs;
• Balloting for acceptance in key specifications.
An overview of the process is shown in Figure 9-6

QinetiQ/09/01835 Page 84
Fail
Pass
Yes
Yes
Yes
Acceptance in principle
Develop case for change in
specification
Present case to ExCo
Reject: not compelling
Present case to AFC
Unconditional acceptance
Implementation
Reject: not compelling
Fuel property tests, e.g. lubricity, material compatibility
Fit-for-purpose tests required?
Conditional acceptance
Component tests (e.g. fuel system/pumps)
Component tests required?
Engine tests Engine tests required?
Anomalies
Anomalies
Anomalies
Anomalies not resolvable
Reject
Engine manufacturers’
approval
AFC ballot
Figure 9-6: Process for changing UK jet fuel specification.
Timescales
Using the changes which automotive fuel specifications have gone through as a guideline 10 years is probably the quickest that changes could be made to refineries to go from current levels of 3000ppm maximum to 10ppm(m) maximum. Intermediate reductions in the limit could be achieved in a shorter timescale.
The specification changes would probably need to be made in a series of steps at several year intervals. The sulphur levels at each step would need to be carefully chosen to allow refineries to continue to supply.

QinetiQ/09/01835 Page 85
10 Conclusions A reduction in fuel sulphur content could be achieved by the HDS process. Producers were approached to determine likely costs specific to aviation fuel. No firm data were obtained due to issues of confidentiality. Indicative costs were therefore estimated based upon desulphurisation of diesel fuel. These were of the order of €0.01 – €0.015/l. On this basis, it has been calculated that desulphurisation of the 200Mtonnes per year commercial aviation fuel would increase fuel costs to commercial aviation by around €250-€375M per annum.
Based upon current fuel supply data, it has been estimated that a reduction from the current 3000ppm(m) maximum fuel sulphur concentration to interim values of 2000ppm(m), 1500ppm(m), 600ppm(m), 300ppm(m) and 10ppm(m) would respectively require about 5%,15%, 50%, 75% and 99% of the total fuel supply to be treated. As shown in Table 10-1, costs to achieve these partial reductions are relatively modest down to 1000ppm(m) using various market accommodation measures. Beyond this, costs rise more steeply toward the €250-€375M pa total for full desulphurisation.
Fuel sulphur content
(ppm(m))
% fuel sulphur
reduction
Relative cost
3000 0% 0%2000 5-10% 1-5%1500 10-15% 5-10%600 40-60% 20-30%300 60-80% 70-90%10 99% 100%
Table 10-1 Relative costs based upon diesel fuel assigned to a reduction in fuel sulphur concentration applicable to kerosene
Aircraft movements are predicted to grow by 4 to 5% per annum and an assessment has been undertaken to determine possible commercial aviation sulphur emissions to year 2050, based upon three high/medium/low feedstock sulphur scenarios. In order to stabilise the current level of global aviation sulphur emissions under all three scenarios, the FSC limit would need to be reduced along the following timelines:
2016: between 600 and 1500ppm(m)
2026: between 300 and 600ppm(m)
at some point between 2036 and 2050: below 300ppm(m)
A reduction in fuel sulphur content will provide benefits in terms of health and environment. It is estimated that a reduction in average fuel sulphur content from the current 600ppm(m) to 10ppm(m) results in a 0.07% decrease in LTO-cycle PM–based mortality, possibly representing about 25% of aircraft-emission related premature mortality. At low sulphur contents (<500ppm(m)), health impacts may be
QinetiQ/09/01835 Page 86
further improved as gas turbine combustion test evidence suggests that the relative quantity of more harmful sub-10nm PM is significantly reduced. Other health and environmental benefits from LTO-based emissions are assessed to be small relative to the PM impact reduction.
Lack of scientific understanding over climate change mechanisms makes it difficult to predict the overall climate impact of reduced sulphur with any certainty. A slight increase in global warming potential is probable due to the reduced direct cooling effect from sulphate particulates. No further quantification has been attempted.
An emerging issue of ground-level PM impacts of sulphur-related emissions at altitude has been raised. Further research is required to quantify this effect. If significant quantities of aircraft PM are transported to ground level in harmful form, this could add significantly to the benefit of sulphur removal.
An outline cost-benefit analysis has been undertaken using the LTO-cycle PM-related benefits. European data suggests this 0.07% reduction in global aviation PM-related mortality can be monetised at a value between €0.5B and €1.65B per year. A US methodology suggests a global mean of $0.9B (year 2000). Cruise PM could increase these values. Monetisation of the potential climate warming (or cooling) has the potential to significantly effect these monetised benefit values.
In order to achieve a specification change, four major steps have been identified:
• Formal request to industry bodies
• Review of case by industry bodies
• Where necessary, define and undertake test programme to ensure engine compliance and safety
• Ballot
It is estimated that to achieve a reduction in fuel sulphur content from the current 3000ppm(m) down to 10 ppm(m) will take about 10 years. Intermediate reductions in the limit could be achieved in a shorter timescale.
Qinetiq/09/01835
11 References / Bibliography
[1] “Aviation and the global atmosphere,” Intergovernmental Panel on Climate Change. Edited by J.E.Penner, D.H.Lister, D.J.Griggs, D.J.Dokken, M.McFarland. 1999
[2] A.R.Clague, C.W.Wilson, M.Pourkashanian, L.Ma. “Chemical kinetic modelling of the evolution of gaseous aerosol precursors within a gas turbine engine,” Proceedings of ASME Turbo Expo, 14,17 June, Vienna, Austria. GT2004-53704
[3] Communication with John Kinsey U.S EPA to the SAE E31/CAEP ad-hoc PM group
[4] P.D.Whitfield, D.E.Hagen, J.C.Wormhoudt, R.C.Miake-Lye, K.D.Brundish, A.R.Clague, M.N.Miller, I.Waltz, S.Lakachko, ChiKinY. “QinetiQ/NASA Collaborative Programme, Final Report,” QinetiQ/FST/CAT/WP010256 31/3/2002
[5] http://www.epa.gov/ttn/oarpg/naaqsfin/pmhealth.html [6] A.Petzold, C.Stein, S.Nyeki, M.Gysel, E.Weingartner, U.Baltensperger,
H.Giebl, R.Hitzenberger, A.Dopelheuer, S.Vrchoticky, H.Pauxbaum, M.Johnson, C.D.Hurley, R.Marsh, C.W.Wilson. “Properties of jet engine combustion particles during the PartEmis experiment: Microphysics and Chemistry.” Geophysical research letters, Vol 30, NO.13, 11719
[7] A.Petzold, M.Fiebig, L.Fritzsche, C.Stein, U.Schumann, C.W.Wilson, C.D.Hurley, F.Arnold, E.Katragkou, U.Baltensperger, M.Gysel, S.Nyeki, R.Hitzenberger, H.Giebl, K.J.Hughes, R.Kurtenbach, P.Wiesen, P.Madden, H.Puxbam, S.Vrchoticky, C.Wahl. “Particle emissions from aircraft engines-a survey of the European project PartEmis,” Meteorologische Zeitschrift, Vol 14, NO.4 465-476 (August 2005)
[8] C.W.Wilson, A.Petzold, S.Nyeki, U.Schumann, R.Zellner. “Measurements and prediction of emissions of aerosols and gaseous precursors from gas turbine engines (PartEmis) an overview,” Aerospace Science and Technology October 2003
[9] U.Schumann, F.Arnold, R.Busen, J.Curtis, B Karcher, A.Kiendler, A.Petzold, H.Schlager, F.Schroder, K-Heinz Wohlfrom. “Influence of fuel sulfur on the composition of aircraft exhaust plumes: The experiments SULFUR 1-7,” Institut fur Physik der Atmosphare Report No. 52
[10] P.Lobo, D.E.Hagen, P.D.Whitefield, D.J.Alofs. “Physical Characterization of aerosol emissions from a commercial gas turbine engine,” Journal of propulsion and power Vol.23, No. 5, September-October 2007
[11] C.C.Wey, C.Wey, D.J.Dicki, K.H.Loos, D.E.Noss, D.E.Hagen, P.D.Whitfield, M.B.Trueblood, M.E.Wilson, D.Olson, J.O.Ballenthin, T.M.Miller, A.A. Viggiano, J.Wormhoudt, T.Berkoff, R.C.Miake-lye “ Engine Gaseous, Aerosol Precursor and Particulate at Simulated Flight Conditions,” NASA/TM-1998-208509 ARL-TR-1804 October 1998
[12] A.M.Hochhauser, “Review of prior studies of fuel effects on vehicle emissions,” VRV Report No. E-84 August, 2008
[13] A.Clague. “The effect of fuel composition of the the level of avaition gas turbine emissions,” QinetiQ internal Report, QinetiQ/05/01733. 31/10/2005
[14] A.H.Lefebvre. “Gas Turbine combustion,”Published 1983 by Taylor & Francis [15] W.Naegeli, C.A.Moses. “Effect of fuel molecular structure on soot formation in
gas turbine engines,”ASME paper 80-GT-62, 1980

Qinetiq/09/01835
[16] J.S.Chin, A.H.Lefebvre. “Influence of fuel chemical properties on soot emissions from gas turbine combustors,” Combus.Sci and Tech, Vol 73, pp 479-486, 1980
[17] Methods for analysis and testing. 42nd Annual edition 1983, IP Standards for Petroleum and its products Part 1, IP 57/55
[18] C.A Moses “Fuel property effects on T700 exhaust particulates,” Interim report TFLRF No. 373, Tardec No. D.A.A.E-07-99-C-Lo53
[19] http://www.dft.gov.uk/consultations/archive/2008/heathrowconsultation/ [20] ICAO Committee on Avaition Environmental Protection, working group 3 –
Emissions Technical 4th meeting 20-24th May Montreal Canada. CAEP8-WG3-WP08 (FOA3.0 Guidance Manual)
[21] EC Communication 2005_0446 - Thematic Strategy on air pollution [22] Z.Wadud, OMEGA Project “ A Systermatic review of literature on the valuation
of local environmental externalities of avaiation,” January 2009 [23] A.Petzold, “Aircraft particulate matter study,” EASA/2007/NP/09 [24] G.OberdÖrster, E.OberdÖrster, J.OberdÖrster, Nanotoxicology: “An emerging
discipline evolving from studies of ultrafine particles,”Environ.Health Perspect, 1113, 823-839, 2005
[25] C.A.Pope, D.W.Dockery, M Ezzati. “Fine particle air pollution and life expectancy in the United States,” The New England Journal of Medicine. Volume 360: 376-386 January 22, 2009
[26] PARTNER: “High-Purity compunds associated with aircraft emissions related air pollutants,” Prepared by J.I.Levy, H.H.Hsu, S.Melly. PARTNER Code-2008-008 October 2008
[27] http://www.caa.co.uk/default.aspx?catid=702 [28] ICAO Annex 16 "International standards and recommended practices,
Environmental protection", Volume II "Aircraft engine emissions", 2nd ed. (1993) plus amendments: Amendment 3, 20 March 1997; and, Amendment 4, 4 November 1999
[29] Zurich Airport air quality and operational impacts, MMU Colloquium, April 12, 2007, www.cate.mmu.ac.uk
[30] World Health Organisation. “Air Quality Guidelines Sulfur dioxide,” Chapter 7.4, 2nd edition. WHO regional office for Europe, Copenhagen, Denmark, 2000
[31] K.Katsouyanni, G.Touloumi, C.Spix, J.Schwartz, F.Balducci, S.Medina, G.Rossi, B.Wojtyniak, J.Sunyer, L.Bacharova, J.P.Schouten, A.Ponka, H.R.Anderson. “Short term effects of ambient sulphur dioxide and particulate matter on mortality in 12 European cities: results from time series data from the APHEA project,” www.bmj.com/cgi/content/full/314/7095/1658
[32] Effects of sulphur dioxide on vegetation: critical levels, chapter 10, Office for Europe, Copenhagen, Denmark, 2000, quality guidelines 2nd edition http://www.euro.who.int/air/activities/20050223_4
[33] Sulfur dioxide: Environmental effects, fate and behavour, Alberto Environment. Prepared by WBK & Associates, March 2003. Publication number T/758 ISBN: 0-7785-3215-1

QinetiQ/09/01835 Page 89
[34] “Final report of the ICAO Committee on Aviation & Environmental Protection (CAEP) Workshop on “Assessing current scientific knowledge, uncertainty and gaps quantifying climate change, Noise and air quality aviation impacts,” Montreal Canada, Oct 29-Nov 2, 2007
[35] Kaercher, B., and U. Lohmann (2003), A parameterization of cirrus cloud formation: Heterogeneous freezing, J. Geophys. Res., 108(D14), 4402, doi:10.1029/2002JD003220
[36] GIACC/4-IP1 GLOBAL AVIATION CO2 EMISSIONS PROJECTIONS TO 2050, available at http://www.icao.int/env/meetings/2009/GIACC_4/GIACC_4.html
[37] G.Rickard. “The quality of avaition fuel availible in the United Kingdom annual survey 2008.” QinetiQ/09/01120, Dec 2009
[38] http://www.desc.dla.mil/DCM/DCMPage.asp?pageid=99 [39] CRC Report No. 647, World Fuel sampling Program, June 2006, Coordinating
Research Council, Inc. 3650 Mansell Road, Suite 140, Alpharetta Ga 300022 [40] CRC Report No. AV-1-04, Survey of sulphur levels in commercial jet fuel
prepared by William F.Taylor, Febuary 2009 [41] www.kfpm.edu.sa/catsyp/symp12th/data/ht-2.pda [42] QINETIQ/S&DU/T&P/E&M/LR0700769, G K Rickard, March 2007 [43] Communication with Goodrich Aviation [44] Petrolem products-Estimation of net specific energy of aviation turbine fuels
using hydrogen content data. IP 355/01, ISO 15911:2000, BS 2000-255:2001 [45] http://www.desc.dla.mil/DCM/DCMPage.asp?pageid=99, 2007 report [46] ICAO Committee on Aviation Environmental Protection (CAEP) Steering group
meeting, Zurich, 26 to 30 November 2007. CAEP-SG/20071-WP/22, 21/11/2007, Revised
[47] www.lissys.demon.com [48] http://www.ifqc.org/NM_Top5.aspx [49] http://www.unep.org/pcfv/PDF/SulphurMatrix-AsiaPacific-Feb09.pdf [50] www.socp.us/index.php?option=com_docman&task=doc_download&gid=150 [51] Directive 1999/32/EC, Directive 2005/33/EC [52] The impact of reducing sulphur to 10 ppm maximum in European automotive
fuels an-update: report8/05 published in August 2005 [53] U.S. Environmental Protection Agency, Regulatory impact analysis: Heavy –
Duty Engine and vechicle standards and Highways Diesal Fuel Sulphur Control Requirements, Washington DC. U.S. Environmental Protection Agency, EPA420-R-00-026 December 2000a http:// www.epa.gov/otag/highway-diesal/regs/2007-heavy-duty-highway.htm
[54] U.S. EPA, 2006, U.S. Environmental Protection Agency, Introduction of Cleaner-Burning Diesel Fuel Enables Advanced Pollution Control for Cars, Trucks and Buses, Washington, D.C.: U.S. Environmental Protection Agency, Office of Transportation and Air Quality, EPA420-F-06-064, October 2006. http://www.epa.gov/otaq/highway-diesel/regs/420f06064.htm
[55] [EIA 2001] Energy information administartion, The transion to Ultra-low-sulfur diesel fuel: Effects on prices and supply, Washington, D.C, U.S Government Printing office SR/01AF/2001-01, May 2001
[56] http://www.icao.int/env/meetings/2009/GIACC_4/GIACC_4.html [57] CAEP Environmental Goals Analysis (to be published) [58] Eliza Brunelle-Yeung, “The impacts of aviation emissions on human health
through changes in air quality and UV irradiance,” Massachusetts Institute of Technology May 2009

QinetiQ/09/01835 Page 90
12 Appendix
To clarify: modelled data from a report “Air Quality Studies for Heathrow” (Section 3.1):
Base Case, Segregated Mode, Mixed Mode and Third Runway Scenarios modelled using ADMS-Airport model. Final report Prepared for Department for Transport 15 November has been utilised to arrive at some concentration values for SO2 and PM. The calculation was done for PM as follows: Note: this data was acquired from above report
47.4 t/year = total aircraft PM
concentration = 0.207 ug/m3
First order approx was used to derive a FSC equivalent to this mass = 390 ppm
As a function of fuel sulphur content QinetiQ calculated the mass of PM using the FOA for all fuel sulphur values used in the study. These data were scaled against those shown above to arrive at concentration values. Note error thought to be about +- 20%
A similar methodology was utilised to derive the concentration values for SO2:
The model does not include SO2 but NOx was modelled and this data was used
Data acquired from above report was:
Mass of NOx = 3746 t/y whilst the concentration was 7.058 ug/m3
Therefore given different masses of SO2 there concentration values could be calculated based upon these 2 values. However, 1 ug/m3 of SO2 =0.35 ppb whilst 1 ug/m3 of NOx = 0.532 ppb. Therefore to convert the concentration to SO2, the calculated concentration values were multiplied by 0.35/0.532.