
DRAFT: February 25, 2009
34
1 The Effects of Advertising Content on Voter Evaluations and Choice Michael M. Franz Bowdoin College Travis Ridout Washington State University DRAFT: February 25, 2009 Traditionally, scholars categorize political ads on the basis of tone when seeking to explain how the characteristics of advertising influence their effectiveness. There is no consensus, however, that negative ads consistently work. We argue that tone should not be the only content code of interest. We measure ad content in the 2004 elections along three dimensions: a positive/negative/contrast dimension; a fear/anger/enthusiasm dimension; and an issue/trait dimension, producing 11 measures of ad content. Using data from a panel study conducted during the 2004 elections, we estimate persuasion effects of exposure to all 11 on voters’ choice for president and Senate in 2004. The findings suggest some important inferences. First, ad exposure has strong persuasive effects, but ones not uniform across the presidential and Senate contexts. Ads featuring policy positions have much stronger effects at the presidential level, while trait messages and positive ads are more influential at the Senate level.
Transcript of DRAFT: February 25, 2009
1
The Effects of Advertising Content on Voter Evaluations and Choice
Michael M. Franz
Bowdoin College
Travis Ridout
Washington State University
DRAFT: February 25, 2009
Traditionally, scholars categorize political ads on the basis of tone when seeking to explain how
the characteristics of advertising influence their effectiveness. There is no consensus, however,
that negative ads consistently work. We argue that tone should not be the only content code of
interest. We measure ad content in the 2004 elections along three dimensions: a
positive/negative/contrast dimension; a fear/anger/enthusiasm dimension; and an issue/trait
dimension, producing 11 measures of ad content. Using data from a panel study conducted
during the 2004 elections, we estimate persuasion effects of exposure to all 11 on voters’ choice
for president and Senate in 2004. The findings suggest some important inferences. First, ad
exposure has strong persuasive effects, but ones not uniform across the presidential and Senate
contexts. Ads featuring policy positions have much stronger effects at the presidential level,
while trait messages and positive ads are more influential at the Senate level.
2
There is a rich scholarship on the question of how political advertising influences
American elections—whether it be voter attitudes, voter knowledge of the candidates, or voter
behavior (such as turning out to vote or favoring a particular candidate). When examining how
the content of adverting affects these outcomes, scholars almost invariably turn to one specific
aspect of this advertising: its tone. A wealth of studies has examined the specific impact of
negative advertising on a variety of behavioral outcomes, including persuasion, but findings are
often conflicting. Summarizing the existing body of work on ad tone and persuasion, Lau,
Sigleman, and Rovner (2007) write: “there is an overriding lack of evidence that negative
campaigning itself works as it is supposed to” (1183). This is true, they find, when looking at
the impact of negativity on voters’ evaluations of candidates or on reported vote choice.1
This paper is motivated by this apparent lack of consensus. What explains why
negativity as an advertising strategy rarely seems to boost vote totals or influence evaluations of
the attacking candidate? This is made particularly puzzling given that negativity in politics is
ever-present. Even in the most recent presidential election, candidates Obama and McCain
offered voters an abundance of negativity. According to the Wisconsin Advertising Project, 44.5
percent of Barack Obama’s 435,000 general election airings focused solely on John McCain;
58.5 percent of John McCain’s 337,000 spots were devoted to attacking Barack Obama.
Our approach is to assess whether the simple negative/positive distinction masks the
persuasive effects of other types of campaign ads. For example, a negative ad is often defined
merely as an ad mentioning one’s opponent. Thus, the specific content of these opponent
mentions (and their effects) often goes unexplored. Brooks and Geer (2007) note this challenge:
“when studying effects of campaign tone, we need to incorporate a more nuanced view of
campaign negativity than is typically assumed by scholars” (p.3). They do this in their study of

3
political engagement by considering the “(in)civility” of campaign discourse (see also Sigelman
and Park 2007; Fridkin and Kenney 2008).
Other scholars make further distinctions. Geer (2006), for example, codes negative
appeals in presidential ads for whether they are issue-focused or trait-focused (see also Fridkin
and Kenney 2004). Jamieson, Waldman and Sherr (2000) add a third category to our common
discussions of tone, the contrast ad (see also Pinkelton 1997). Others consider whether ads are
mud-slinging (Kahn and Kenney 1999, 2004) or fair (Lawton and Freedman 2001), and Brader
(2006) examines the emotional appeals embedded in ads, such as whether spots make appeals to
enthusiasm, fear, and anger (see also Brader and Corrigan 2007).
These studies highlight the starting point of our analysis. Whether an ad is positive or
negative is not the only content classification worth coding because tone is not the only
characteristic that might influence the persuasiveness of an ad. To that end, we measure ad
content in the 2004 elections along three dimensions: a positive/negative/contrast dimension; a
fear/anger/enthusiasm dimension; and an issue/trait dimension. These produce, in total, 11
measures of content. We then estimate persuasion effects of exposure to all 11 on voters’
presidential and Senate vote choice in 2004.
We should clear at the outset. Our goal in this paper is largely methodological; to best
capture persuasive effects, we think it important for researchers to measure ad content on
multiple dimensions. Geer’s recent book (2006) demonstrates the added value of diverse
measurement. He has very clear hypotheses, for example, about when presidential candidates
should use negative and positive messages of varying sorts (i.e., ads appealing to issues, values,
or candidate traits). We believe this paper is a contribution to the spirit of that research, in that a
4
diversity of measures is also important for assessing which types of ads influence choices at the
ballot box.
This paper also contributes methodologically to the literature on advertising and
persuasion. Our approach represents a change from the more common experimental research
design. In their recent meta-analytic assessment, Lau, Sigelman, and Rovner (2007) identified
36 published and non-published investigations of ad content and vote choice, 23 of which use the
experimental method.2 While experiments afford the researcher significant control over
respondents’ exposure to varying appeals in ads, the research can say little about how these
effects translate into the real world.3 In contrast, our approach leverages a national panel sample
of voters in 2004 with real world tracking data on almost 2 million ad airings that year.
This approach has the added advantage of improving on some existing survey work. For
example, Fridkin and Kenney (2004) study the effect of different types of campaign ads on voter
evaluations of candidates in three Senate cycles, but they rely on a sample of ads in each race
(four randomly selected ads in each race, producing a candidate-level measure of negativity) and
assess mud-slinging from campaign manager assessments. Their work is important because of
its attention to multiple measures of ad content, but we advance the analysis as well—especially
with our measures of ad exposure.4 Our design is not perfect, of course, but we do employ panel
survey data, which mitigates problems of endogeneity, along with the best available data on ad
content and frequency of airings.
Ad Content and Persuasion
Scholars have identified many possibilities for how advertising tone, and specifically
negativity, might influence vote choice, but two are central to such discussions. The first is what
we label an intended effects model, in which negative advertising should lower the evaluations

5
of the attacked candidate, leading to greater support for the sponsor of the advertising. Scholars
focus on two dependent variables in this regard—evaluations of the sponsoring and attacked
candidate, and intended or reported vote choice. The reasoning for this expectation is straight-
forward: voters use the negative stimuli in such ads to consider the possible dangers in electing
the attacked candidate. A second possible effect of negative advertising is a backlash effect.
That is, viewers of negative advertising might lower their evaluations of the sponsoring
candidates if they disapprove of such an attack strategy. Plenty of poll data, for example,
suggests that voters think campaigns are too negative (Geer 2006, p.1-2). Surprisingly, as we
noted earlier, the bulk of scholarship on negative political advertising fails in demonstrating a
consistent intended impact, and while there is evidence in the literature that a backlash is not
infrequent, the evidence also suggests that backlashes are idiosyncratic.
Both expectations point to one possible inference, however: negativity is a risky
advertising strategy, but should produce more observed persuasive effects (intended or backlash)
than exposure to positive ads. This is because positive ads do little to highlight the risks in
certain electoral choices, and are less memorable (see Brians and Wattenberg 1996; Kahn and
Kenney 2000); moreover, existing scholarship tells us that risks are more often considered in
decision-making than rewards (Kahneman and Tversky 1984; Lau 1982, 1985). On the other
hand, we are reminded of another point raised by Lau et al (2007, p.1183): “The conclusion that
negative campaigning is no more effective than positive campaigning holds even though negative
campaigns appear to be somewhat more memorable and to generate somewhat greater campaign-
relevant knowledge” (emphasis in original). Ultimately, despite the conflict over the place of
positive ads in the larger story, almost no one predicts such ads to induce a backlash.
6
One possible reason for the observed inconsistent effects of negative advertising may be
how negative advertising is conceptualized and measured. For example, ads containing both
positive and negative messages—what are commonly referred to as contrast or comparative
ads—might contain valued discussions of risks, but not stray too far from voters’ expectations of
positive information (Pinkelton 1997). We often hear campaign consultants, for example, resist
categorizing their candidates’ ads as negative if they contain a comparison of positions or traits.
On that score, contrast ads are predicted to more frequently have an intended impact, but few
would deny (because of the presence of an attack message) that backlashes are certainly still
possible.
In addition, when negative messages contain a discussion of policy positions over
candidate traits, we might expect less potential for backlash—an expectation that follows from
the assumption that viewers see disagreements over policy as part of legitimate political
discourse. Fridkin and Kenney (2004), for example, found intended effects in the 1988-1992
U.S. Senate elections, but only with negative messages deemed to be “legitimate”—those
discussing issues considered relevant to a campaign (see also Fridkin and Kenney 2008). When
negative messages focus solely on traits, however, we might expect the greatest chance for
backlash; these ads are the ones most commonly identified as mud-slinging (Fridkin and Kenney
2004; Kahn and Kenney 1999, 2004) or uncivil (Brooks and Geer 2007).5
The discussion thus far has focused on the types of ads most or least likely to induce
intended or backlash effects; this is arguably the driving question in the available research.
Often left unconsidered is the effect of issue and trait discussion, irrespective of tone. Policy ads
of all tones, for example, might convey information that voters can use to make reasoned issue-
based decisions about the consequences of certain electoral choices, more so than a discussion of
7
candidate traits. We highlight this distinction because it points specifically to a key dynamic that
extends beyond the intended vs. backlash debate—that is, the role of cognition or affect in
advertising persuasion. For example, if policy ads seem to have more influence than trait ads,
one might assume that voters are persuaded by the informational content over the affective
appeals predominant in trait messages. The reverse would be true if trait ads seem more
effective than policy ads.
To that end, scholars have recently begun to focus also on the specific, discrete emotions
(e.g., anger, compassion, pride) elicited by advertising (Brader 2006; Brader and Corrigan 2007;
see also Marcus, Neuman, and MacKuen 2000), thereby priming an affect transfer model. For
example, in one conception ads that elicit anger, fear or anxiety transfer those negative emotions
to the targeted candidate, resulting in lower voter evaluations of that candidate and a lower
likelihood of voting for that candidate. Likewise, emotions such as hope and enthusiasm are
transferred to the ad sponsor, leading to higher voter evaluations of the candidate and a greater
likelihood of voting for that sponsor.6
All told, there is an abundance of existing theoretical models on which to draw
expectations. Some focus on ads that are expected to induce greater support for the sponsor (i.e.,
positive ads, contrast ads, policy ads, and policy attacks), and some debate the types of ads most
likely to induce backlash (negative ads and trait attacks). Some focus on the cognitive effects of
ads (i.e., policy ads and policy attacks) and some on the transfer of affect (trait ads, trait attacks,
and emotional appeals). One advantage of measuring ad content in multiple ways is the ability
to pit the cognitive and affective models against each other, to determine which explains ad
persuasion better (or more often); it also allows for a test of whether certain types of spots lead
more often to backlash or intended effects.
8
There is one final comparison that the literature has remained relatively silent on—the
effects of ads in presidential races vs. lower ticket races. Geer (2006), for example, discusses the
influence of policy information in presidential races. He writes, “In presidential campaigns, we
should expect issues to be the subject of attacks more than personal traits….We should,
therefore, expect traits to play a bigger role in attacks in state and local elections” (p.58,
emphasis in original). He expects this largely because presidential candidates (and by this he
means the major party nominees) have a long track record of public service that makes trait
attacks less useful for the opposition. The same is not necessarily true for less experienced
candidates lower down the ticket. His results tend to fall in line with such an expectation (p. 63).
Although his book does not test for persuasive effects, two expectations follow from his
empirical discussion: first, policy-based attacks should have more persuasive impact at the
presidential level than at the Senate level. The reasoning behind this is that presidential
candidates are less susceptible to personal attacks because of their long history in politics.
Presumably, then, trait ads and positive appeals matter more at the Senate level (or lower down
the ticket). Second, if the above is true, presidential candidates, by employing the types of
appeals most likely (and most often predicted) to work, should experience few backlash effects.
Senate candidates, by employing the types of appeals most susceptible to backlash, should be
more prone to suffer such consequences.
Data and Measurement
To investigate the relationship between the advertising content and vote choice, we
examined the 2004 presidential races and 30 U.S. Senate races from that year. Our source of
public opinion data was a three-wave panel survey sponsored by the Center for the Study of
Politics at the University of Wisconsin-Madison and the Center for the Study of Elections and
9
Democracy (CSED) at Brigham Young University. The 2004 BYU panel study, with waves in
June, September and November, sampled from the U.S. voting age population, over-sampling
potential voters in battleground Senate and presidential states.7
To measure the advertising environment, we employed ad tracking data obtained from
the Wisconsin Advertising Project.8 These data report the date, sponsor and location (media
market) of each ad airing in the top 100 markets, and coders at the Project assessed the tone and
policy focus of the ads. More specifically, coders were asked first whether the ad was positive
(mentioning only the sponsoring candidate), negative (mentioning only the opposed candidate),
or contrast (mentioning both candidates). Then, they were asked to assess whether the ad
focused only on policy issues, only on the personal traits of the candidates (i.e., honor, integrity,
work ethic), or a mixture of policy and traits.
We supplemented the project’s coding with coding of our own about the emotions
elicited from each ad. Two coders were asked to report whether each ad was intended to produce
each of three emotions: anger, fear, and enthusiasm. These were the three principal emotions
that Brader (2006) found most frequently in political ads in the 2000 campaign. Coders were
asked specifically, “Was the sponsor of this ad attempting to elicit [insert emotion]?’’ The
objective of this question was not to tap the emotional response of the viewer, but to allow the
viewer to independently judge the ad maker’s goal in designing the message. Coders could
respond by indicating the ad contained “no appeal” to the emotion, “some appeal,” or a “strong
appeal.” We collapsed “some” and “strong” into one category, indicating all ads that contained
some element of each of the five emotions.9
Using these data, we merged the frequency of different ad types by media market onto
the panel survey noted above. Following the lead of previous scholars, we calculated a relative
10
measure of exposure that takes account of both market-level advertising patterns and individual-
level television viewing habits (Freedman, Franz, and Goldstein 2004; Freedman and Goldstein
1999; Martin 2004; Stevens 2008). More specifically, because the advertising tracking data
record the television programs during which all political ads aired (top shows included the local
news, Jeopardy, Wheel of Fortune, morning news shows, and afternoon talk shows) and because
the survey asked respondents how often they watched such programs, we were able to multiply
the frequency with which viewers watched each program type by the number of ads aired in the
respondent’s media market during each program type.10
A few additional points are necessary for clarification. First, we included in our
calculations only those ads aired between respondents’ September pre-election and November
post-election interviews.11 Second, all exposure measures include interest group, party,
candidate, and candidate/party coordinated advertisements. Thus, when discussing exposure to
Democratic ads in the presidential race, we are referring to all Kerry ads, Democratic Party ads,
and pro-Kerry interest group ads (e.g., MoveOn.org). Finally, because our primary interest is in
the effects of ads of varying types, we created separate measures of exposure for each ad type of
interest. There were 11 classifications in total: negative ads, positive ads, and contrast ads; ads
with fear appeals, anger appeals, and enthusiasm appeals; ads that focus on policy alone, traits
alone, and a mixture of policy and traits; and finally, policy ads that contain an attack, and trait
ads that contain an attack.
Following the advice of Stevens (2008) we took the natural log of each measure before
entering it into our statistical models. This was to account for the diminishing returns of ad
exposure. That is to say, increasing a viewer’s exposure from 100 to 200 ads for a candidate is
11
likely to have more of an impact on his or her vote choice than increasing that viewer’s exposure
from 2000 to 2100 ads.
Dependent Variables and Model Specification
In order to evaluate the various competing theories, we estimated the impact of ad
content on reported vote choice. Vote choice is measured as a simple dichotomous variable
(vote for Bush or Kerry, or vote for the Democratic or Republican U.S. Senate candidate).12 We
estimated separate presidential and Senate vote models for each of the 11 ad classifications.
More specifically, each model contains four exposure measures: Democratic and Republican
exposure to the ad type of interest, and Democratic and Republican exposure to all remaining
ads. We find this approach more reliable than estimating a single vote choice model with all
relevant exposure measures. As we will discuss, ad categories overlap, and the inclusion of
many correlated exposure measures would put considerable stress on the statistical model.
Although ad exposure is the central variable of concern, all of our models also contained
several other important control variables, including respondent demographics (educational
attainment, age, gender, race, income, marital status, and region of residence) and respondent
attitudes (party identification and presidential approval). In addition to these controls, we
included in the presidential models the total number of Kerry visits and the total number of Bush
visits to the respondent’s media market.13 We added these measures to account for the
possibility that the personal appearances of the candidates—and the media coverage that such
visits engender—may have had an independent effect on vote choice. This possibility is
particularly important because campaign schedulers and media buyers are likely to target the
same states and media markets. Finally, in the Senate vote-choice models, we included dummy
12
variables indicating whether the candidate was an incumbent Republican or Democrat. (See the
Appendix for details of the coding of all of the variables included in our models.)
There are some special statistical considerations in estimating our models of vote choice.
One concern is endogeneity in the relationship between how many ads a candidate runs and that
candidate’s vote share. More to the point, airing additional advertisements should increase a
candidate’s share of the vote, but candidates generally air the most advertisements in races (or
for presidential candidates, states) in which they face stiff competition. This concern in the
search for advertising effects is similar to the problem confronting those seeking to estimate the
effects of congressional spending (e.g., Green and Krasno 1988; Green and Krasno 1990;
Jacobson 1990). To account for this endogeneity, we take advantage of the panel nature of the
survey data, which allows us to estimate models that include lagged dependent variables. This
means that the effect of advertising on a person’s vote in the final wave of the panel is
conditioned on that person’s vote intention in the earlier wave of the panel. By controlling for
the dependent variable measured at an earlier time, we alleviate the endogeneity between support
for a candidate in an area and the amount of advertising that is aired.
Finally, we estimated all presidential models using robust standard errors. For all Senate
models, we clustered on state since there are different candidates with different characteristics in
each state, and thus observations within each state are not completely independent.
Analyses
Our primary goal in this research is to compare a traditional tone-based account of
advertising’s effects with accounts using different content classifications. What does this
approach, in total, demonstrate about the persuasive effects of ads?
13
The first thing to establish is that negative ads are distinct from those that feature fear or
anger, and that positive ads are distinct from those that feature enthusiasm appeals. Furthermore,
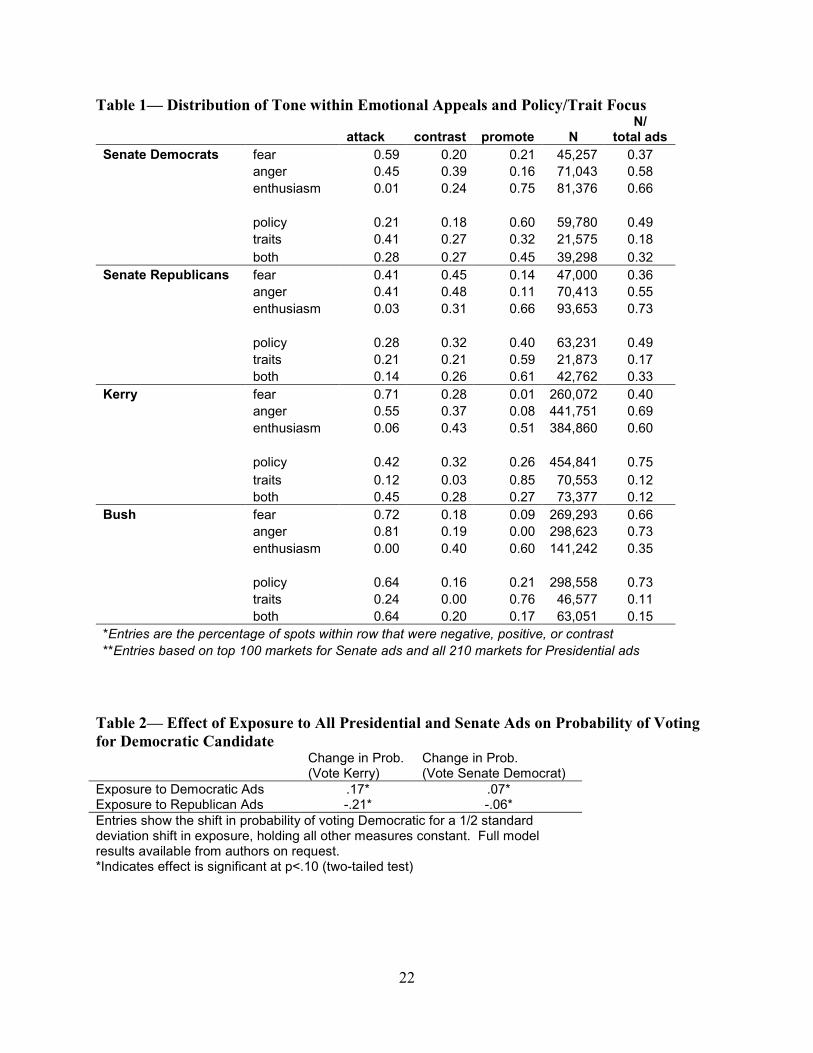
policy and trait ads can be positive, negative, or contrasting. Table 1 speaks to this by showing a
cross-tabulation of ad tone for the nearly 2 million Senate and presidential ads aired in 2004.
The numbers are split into four sub-groups—Senate Democrats and Republicans, Bush, and
Kerry—and the entries represent the percentage of emotional and policy/trait ads that were
classified as positive, negative, or contrast.
[Table 1 here]
Although there is a strong relationship between emotion and tone, there are distinct
differences as well. Take fear appeals, for instance. For Bush and Kerry, over 70 percent of
their fear spots were negative, but the trend was not nearly as strong for Senate candidates.
Fifty-nine percent of Senate Democrats’ fear ads were negative and only 41 percent of Senate
Republicans’ fear ads were. In addition, a substantial percentage of fear spots were contrasting
or promoting. For example, 20 percent of Senate Democrats’ fear ads were contrast, and 21
percent were positive. Forty-five percent of Senate Republicans’ fear ads were contrast, and 14
percent were positive.
The presence of positive fear ads might seem strange, but an example would serve to
clarify. In 2004, Democratic Senate candidate Betty Castor of Florida aired a positive ad titled,
“Terrorism.” The ad featured Castor addressing the audience directly:
Every candidate talks about terrorism, but I've dealt with it first hand. As a
university president I took action to remove a suspected terrorist from our
campus. And I saw how the failure to share information among agencies threatens
the safety of our community. In the Senate I'll use my experience to demand

14
better intelligence and to strengthen local law enforcement. I'm Betty Castor and I
approved this message because to me fighting terrorism isn't just policy; it's
personal.
The ad never mentions her opponent (making it a positive ad), but Castor also appeals directly to
citizen fears over terrorists and preparedness.
As for anger, in all cases but pro-Bush ads, ads containing anger appeals were less likely
to be coded negative and more likely to be coded as contrast than ads containing fear appeals.
More specifically, although 81 percent of Bush’s anger ads were focused solely on attacking
Kerry, only 55 percent of Kerry’s anger ads were negative, attacking Bush. In the Senate case,
45 percent of anger appeals from Democrats were negative, and 39 percent were contrast; and a
larger proportion of Republican anger appeals were contrast (48 percent) than were negative (41
percent).
There are also interesting patterns in the policy/tone cross-tabulations. Consider, for
example, the differences in the use of policy attacks between the presidential and Senate cases.
Senate Democrats and Republicans went on the attack with 21 and 28 percent of their policy ads,
respectively. Kerry, however, used negative ads for 42 percent of his policy spots, and Bush
used attacks on Kerry for 64 percent of his policy ads. At the same time, Bush was twice as
likely as Kerry to use trait ads for attacks (24 percent to Kerry’s 12 percent). Notably, Senate
Democrats went negative in 41 percent of their trait ads, as opposed to Republicans who went
negative in only 21 percent of their trait messages.
Consider also the last column in Table 1, specifically for the policy/trait rows. These
numbers confirm a key expectation of Geer (2006): that presidential candidates focus more on
policy issues (pp. 58-63). 75 percent of Kerry’s spots were focused solely on policy messages,

15
and 73 percent of Bush’s were. At the same time, only 12 percent of Kerry’s ads were solely
about traits, as were 11 percent of Bush’s ads. Geer’s analysis of ads between 1960 and 2000
concludes, “it seems hard to argue that personal attacks were excessive in presidential elections”
(p.68). This is similarly true, from Table 1, for the 2004 election.
These numbers are in contrast, however, to Senate Democrats and Republicans, who
devoted only 49 percent of their airings to policy issues alone, and a majority of airings to ads
with some or a complete focus on traits. This is not a surprise given the assumption that
presidential candidates are well-known and have already endured (from earlier in their careers)
attacks on their character, values, or preparedness (Geer 2006). But Senate candidates and
candidates lower down the ticket may be more susceptible to such questions.
Given that the discrete emotional appeals and policy/trait distinctions do not perfectly
coincide with normal conceptions of tone (positive, negative or contrast), we might expect that
the effects of ad tone on voter persuasion might be different than the effects of emotional appeals
or policy/trait discussions.14 We perform one preliminary analysis, however, before examining
the influence of specific ad content. Table 2 shows the result of two models predicting Senate
and presidential vote choice, where exposure to all Democratic and Republican ads is included as
a predictor. The results in the table show the predicted change in voting Democratic based on a
1/2 standard deviation shift in Democratic or Republican exposure, holding all variables in the
model at their mean values. The results demonstrate that ads in total are quite persuasive, and
more so in the presidential model. This is important, especially in the context of any backlash
effects we find in the subsequent analysis. In general, ads boost support for the sponsor, and this
complete information environment tends to overcome any punishment that voters levy against
candidates who see a lot of a particular type of ad.
16
[Table 2 here]
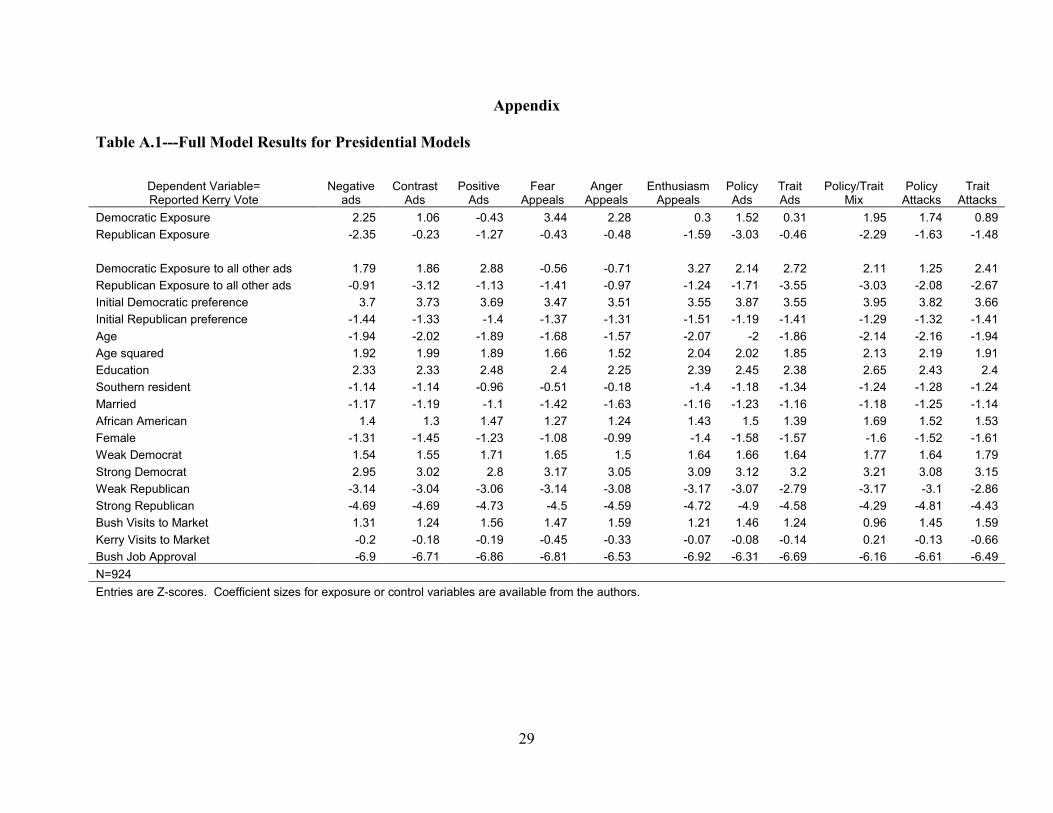
Of course, our larger goal is to look for effects by ad content. Table 3 speaks to this,
showing predicted effects of exposure on vote choice of 11 different types of Kerry and Bush ad
content. We have ordered the effects for each candidate from strongest to weakest, and the
entries represent the change in probability of voting for Kerry given a ½ standard deviation shift
in exposure, holding all other measures at their mean values. The full model results for all 11
models are reported in the Appendix.15
[Table 3 here]
Of the 22 estimated coefficients, 21 were associated with increased support for the
sponsor, and nine were statistically significant. The diversity in measurement tells a compelling
story about which types of ads benefited each presidential candidate. Consider Kerry first.
Kerry received the biggest boost from his attacks on Bush, both cognitive and affective. His
anger and fear appeals were strongly influential, raising the average respondent’s probability of a
Kerry vote by 15 and 18 percentage points, respectively. His policy attacks were also
significant, moving the Kerry vote probability by 14 points. The broader category of negative
ads changes the probability of voting for Kerry, all else being equal, by 12 points.
Notably, Kerry was unsuccessful with his contrast ads, and with trait ads, trait attacks,
enthusiasm appeals, and positive ads. These results tell an important, and intuitive, story about
John Kerry. That is, Kerry was most successful when pointing out the weaknesses of the Bush
administration, and when working to raise issue and affective doubts about the previous four
years. Voters seemed less interested in hearing only about Kerry’s vision, or his discussion of
character and/or values. All told, voters responded to Kerry when he conveyed retrospective
appeals about the downsides of the incumbent administration.
17
There are similarities and differences when turning to the effects of Bush’s ads. For
example, like Kerry, Bush was very successful with his negative ads, policy ads, and policy
attacks; and he was less successful with his positive ads and trait messages. To that end, voters
seemed most responsive to his criticisms of John Kerry, particularly his attacks on Kerry’s policy
proposals. The only clear affective story that emerges, however, was voters’ response to Bush’s
enthusiasm appeals. (See Table A.1; the Z-score on this exposure effect was 1.59, just below
statistical significance for a two-tailed test.) The probability of voting for Kerry was 13 points
lower among those voters seeing a high volume of Bush’s enthusiasm ads.
One interesting story emerges from the findings on Bush advertising. Pro-Bush fear and
anger appeals were far less likely to move voter choices than other types of ads. This conflicts
perhaps with the conventional wisdom of the 2004 campaign. That is, that Bush used images of
September 11th to scare voters, and that the Swift Boat Veterans successfully inspired fear and
anger over a possible Kerry presidency. The direction of the fear and anger appeals is as
expected, but there is a lot less statistical confidence in the effect of those ads than Bush’s policy
ads and policy attacks.
All told, we find little evidence in these results of any backlash effects against the
presidential candidates. And we also find that the candidates’ policy ads and policy attacks were
particularly successful. It is also important to note that neither a cognitive nor affective story
dominates. Both are present amid the significant findings.
If there is little evidence of backlash effects in our analysis of presidential vote choice,
and convincing evidence of the benefits of attack advertising and policy messages, is the same
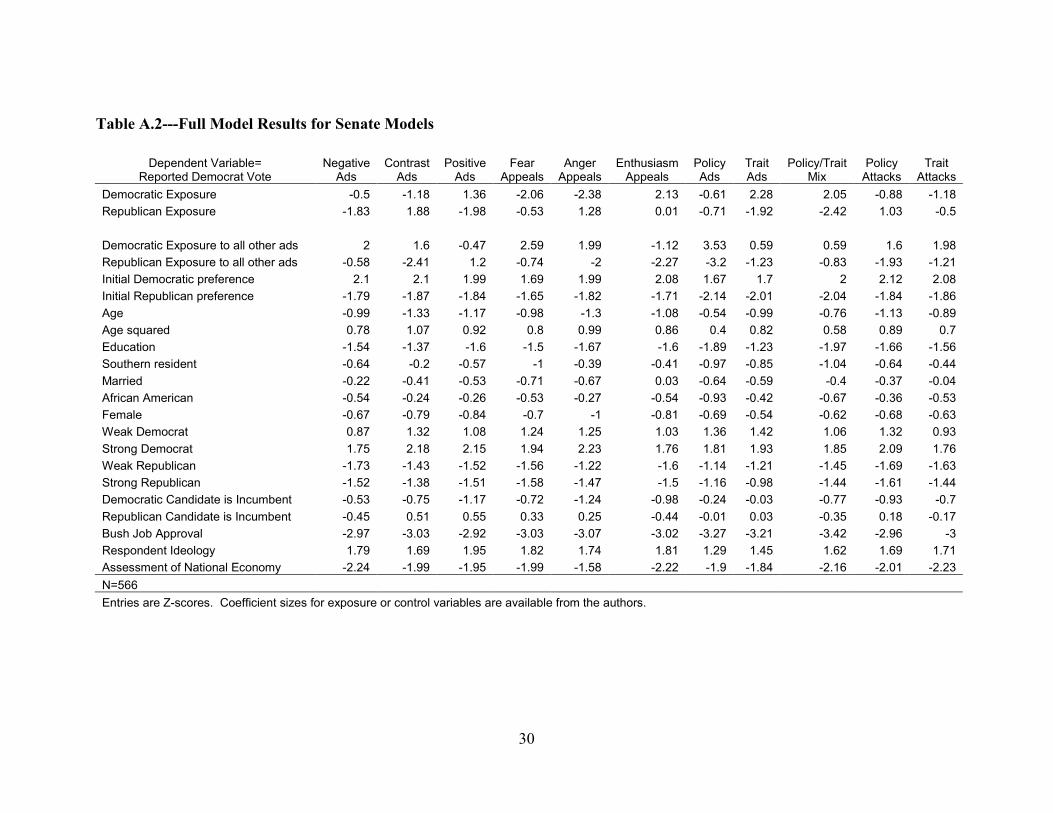
true in the Senate models? The answer is no. The results in the Senate case suggest significant
evidence of both intended effects and backlash, and much less influence of policy messages. We
18
show the results of 11 model specifications in Table 4. The set-up is the same as in the
presidential discussion, where we rank order the predicted impacts. (Full model results are
presented in Table A.2).16
[Table 4 here]
For Senate Democrats, exposure to Democratic enthusiasm ads results in increased
support for the Democratic Senate candidates, moving the predicted probability by 12 points.
Democrats also benefited from positive ads, trait messages, and ads featuring a trait/policy mix.
In short, Democrats did the best when their ads stayed hopeful and affirmative. Policy ads,
policy attacks, and negative ads had no significant measurable impact, and exposure to
Democratic fear and anger appeals actually reduced support—5 points for both types of
emotional appeals.
One should keep in the mind, however, the initial pattern of results in Table 2, which
showed that the total advertising environment for Democrats and Republicans moved voters
toward their respective camps. This implies that that the intended impacts of Democrats’
positive messages overwhelmed the backlash effects of their fear and anger appeals, all else
being equal. But it also implies that Democrats would have likely done even better by avoiding
negatively-valenced emotional messages.
There is a similar pattern of intended and backlash effects for Republican candidates. For
the GOP, increased exposure to positive ads, trait ads, and ads with a policy/trait mix were
successful at moving voter support. This similarity with Democrats suggests that Senate
candidates in 2004 did far better with positive than negative appeals. There is no evidence in
either case that issue-focused messages (policy ads and policy attacks) were successful. This is
something that follows directly from Geer’s discussion of when policy and trait messages are
19
most useful to different candidates. Because, as we demonstrated in Table 1, Senate candidates
deploy a particularly high percentage of trait messages, it comes as no surprise that those ads
seem to dominate the persuasive effects.
Notably, Republicans did benefit from negative ads, a finding not present for Senate
Democrats. On the other hand, Republican contrast ads induced a backlash, as did anger appeals
(although we have less confidence in the impact of the latter). So, like their partisan rivals,
Senate Republicans were not immune to punishment from the voters.
All told, the Senate results stand in stark contrast to the presidential-level results. An
attack strategy worked for Kerry and Bush, but often weakened support for Senate Republicans
and Democrats. A cognitive and affective story was present for both Kerry and Bush, but an
affective model seemed more dominant for Senate candidates.
In many ways, these contextual differences are reasonable. Kerry and Bush aired spots
that were heavily focused on policy positions, and tended to use trait messages in positive spots.
By implication, this also means that the fear and anger appeals offered to voters by both
candidates were particularly issue-focused. We do not show the emotion by policy cross-
tabulations in Table 1, but consider this: of the over 500,000 airings by Bush and Kerry that
featured a fear appeal, 82 percent were issue-focused, containing no discussions of candidate
traits. Of the over 700,000 anger appeals, 83 percent were issue-focused.
In contrast, Senate candidates relied more heavily on messages featuring traits, and
devoted a lot less attention to policy attacks. This created some vulnerability for their fear and
anger messages. More to the point, only 59 percent of Senate fear appeals were policy-focused,
as was only 50 percent of anger appeals. By devoting disproportionately more attention in their
20
emotional appeals to discussions of traits and personal attributes, it seems reasonable that voters
would more often reject the message (and messenger).
Discussion
We began this research asking whether a traditional categorization of positive and
negative ads masks how other political advertisements influence vote choice. This follows
directly from some existing work in this area (Kahn and Kenney 1999, 2004; Fridkin and
Kenney 2004, 2008; Brader 2006). We argued that scholars should consider tone, along with
specific emotional appeals and the policy/trait focus of ads. The findings seem to back up the
importance of varied measurement. For example, negative ads were successful for Kerry, Bush,
and Senate Republicans, but not for Senate Democrats. Fear and anger were successful for
Kerry, but not for Bush—and worked against Senate candidates. Policy attacks worked in the
presidential models but not the Senate models. By focusing on only one ad measurement, we
might miss the diversity of findings.
In contrast, using multiple measures of ad content we learn a bit more about when tended
to work for each set of candidates. For example, for Kerry, we learn that his specific attacks on
Bush and on policies were more influential than his discussions of values and character. It was
the measurement on all three dimensions that pointed to affective and cognitive success.
Similarly, in the Senate case, we learn that positive ads generally, but enthusiasm and/or trait
discussions specifically, were effective. An affect transfer account seemed more prevalent here
than a cognitive one. We offer these results, then, as a methodological call for diverse
measurement.
The search continues, however, for a consistent pattern of results—a general rule of sorts
that can answer a simple, but elusive question: what types of ads work best for candidates?
21
Indeed, there may be no definitive answer. This seems an important point to make, however
unsatisfying. For example, Kerry saw no gains in his appeals to enthusiasm, but might we
expect something different for Barack Obama, whose campaign narrative seemed tied intimately
to such appeals? At the end of the day, different ads might work for different candidates, and
those effects might not generalize very well. As such, the conflicting findings in the literature
(as noted by Lau et al) suggest that effectiveness is highly contingent. Some of that contingency
might be modeled (i.e., incumbency and competitiveness might moderate the effectiveness of
certain ads—a task for researchers with data in multiple election cycles), but some of it might be
largely unknown and immeasurable. (Consider, for example, the moderating effects of ad
quality. How one defines a quality ad is a sticky proposition. Ads might be high quality if they
work, but that seems hardly helpful to the empirical question of causation.)
We do locate some important findings, however, that might inspire future research: for
example, when are affective and cognitive messages more likely to persuade? Is cognition more
important in the presidential race than lower ticket races? Is a transfer of affect more likely for
voters in lower ticket races, when, as Geer notes, traits and candidate characteristics might
dominant the discussion more frequently than in the presidential case? Are backlash effects
more prevalent when voters know less about candidates, as with Senate races over the
presidential race? Or when candidates rely more on trait attacks? These are all inferences one
might make from the results shown in this paper. Indeed, we may never answer the question,
“do negative ads work,” but future researchers should not be daunted. We have much yet to
learn, and many more questions to ask.
22
Table 1— Distribution of Tone within Emotional Appeals and Policy/Trait Focus
attack contrast promote N N/
total ads
Senate Democrats fear 0.59 0.20 0.21 45,257 0.37
anger 0.45 0.39 0.16 71,043 0.58
enthusiasm 0.01 0.24 0.75 81,376 0.66
policy 0.21 0.18 0.60 59,780 0.49
traits 0.41 0.27 0.32 21,575 0.18
both 0.28 0.27 0.45 39,298 0.32
Senate Republicans fear 0.41 0.45 0.14 47,000 0.36
anger 0.41 0.48 0.11 70,413 0.55
enthusiasm 0.03 0.31 0.66 93,653 0.73
policy 0.28 0.32 0.40 63,231 0.49
traits 0.21 0.21 0.59 21,873 0.17
both 0.14 0.26 0.61 42,762 0.33
Kerry fear 0.71 0.28 0.01 260,072 0.40
anger 0.55 0.37 0.08 441,751 0.69
enthusiasm 0.06 0.43 0.51 384,860 0.60
policy 0.42 0.32 0.26 454,841 0.75
traits 0.12 0.03 0.85 70,553 0.12
both 0.45 0.28 0.27 73,377 0.12
Bush fear 0.72 0.18 0.09 269,293 0.66
anger 0.81 0.19 0.00 298,623 0.73
enthusiasm 0.00 0.40 0.60 141,242 0.35
policy 0.64 0.16 0.21 298,558 0.73
traits 0.24 0.00 0.76 46,577 0.11
both 0.64 0.20 0.17 63,051 0.15
*Entries are the percentage of spots within row that were negative, positive, or contrast
**Entries based on top 100 markets for Senate ads and all 210 markets for Presidential ads
Table 2— Effect of Exposure to All Presidential and Senate Ads on Probability of Voting
for Democratic Candidate Change in Prob.
(Vote Kerry) Change in Prob. (Vote Senate Democrat)
Exposure to Democratic Ads .17* .07* Exposure to Republican Ads -.21* -.06*
Entries show the shift in probability of voting Democratic for a 1/2 standard deviation shift in exposure, holding all other measures constant. Full model results available from authors on request. *Indicates effect is significant at p<.10 (two-tailed test)

23
Table 3— Effect of Exposure to Presidential Ads on Probability of Voting for Kerry Exposure Effects of Kerry ads
(Ranked in order of predicted effects) Exposure Effects of Bush ads (Ranked in order of predicted effects)
fear appeals 0.18* negative ads -0.22*
anger appeals 0.15* policy ads -0.21*
policy attacks 0.14* policy attacks -0.13*
policy/trait mix 0.14* enthusiasm appeals -0.13
policy ads 0.14 policy/trait mix -0.11*
negative ads 0.12* positive ads -0.09
contrast ads 0.09 trait attacks -0.07
trait attacks 0.04 anger appeals -0.05
trait ads 0.02 fear appeals -0.04
enthusiasm appeals 0.02 trait ads -0.02
positive ads -0.04 contrast ads -0.01
Entries show the shift in probability of voting Democratic for a 1/2 standard deviation shift in exposure, holding all other measures constant. See Appendix for full model results.
*Indicates effect is significant at p<.10 (two-tailed test)
Table 4— Effect of Exposure to Senate Ads on Probability of Voting for Democratic
Candidate Exposure Effects of Democratic ads
(Ranked in order of predicted effects) Exposure Effects of Republican ads (Ranked in order of predicted effects)
enthusiasm appeals 0.12* positive ads -0.13*
positive ads 0.08 trait ads -0.07*
trait ads 0.07* policy/trait mix -0.07*
policy/trait mix 0.06* negative ads -0.05*
policy ads -0.01 policy ads -0.03
negative ads -0.02 fear appeals -0.03
policy attacks -0.04 trait attacks -0.01
contrast ads -0.05 enthusiasm appeals 0.00
trait attacks -0.05 policy attacks 0.04
fear appeals -0.05* anger appeals 0.07
anger appeals -0.05* contrast ads 0.09*
Entries show the shift in probability of voting Democratic for a 1/2 standard deviation shift in exposure, holding all other measures constant. See Appendix for full model results.
*Indicates effect is significant at p<.10 (two-tailed test)

24
Variable Coding
2004 BYU-UW Study
Presidential Vote Intent (Wave 2)—“If the election for President were held today, would you
vote for” 0=Bush, 1=Kerry, other=missing
Presidential Vote (Wave 3)—“In the November general election for president, who did you
vote for?” 0=Bush, 1=Kerry, other=missing
Senate Vote Intent (Wave 2)—“If the election for Senate were held today, would you vote for”
0=Republican candidate, 1=Democratic candidate, other=missing
Senate Vote (Wave 3)—“In the election for U.S. Senate, who did you vote for?” 0=Republican
candidate, 1=Democratic candidate, other=missing
Bush job approval (Wave 3) – “How would you rate the overall job President George W. Bush
is doing as president: Excellent, pretty good, only fair, or poor?” 1-4 scale with 4 indicating
“excellent.”
Educational attainment (Wave 1 only)– “What is the highest level of education you
completed?” 1=Elementary school only; 2=Some high school, did not finish; 3=Completed high
school; 4=Some college, didn’t finish; 5=two-year college degree/A.A./A.S; 6=four-year college
degree/B.A./B.S; 7=Some graduate work; 8=Completed Masters or Professional degree;
9=Advanced graduate work or P.H.D.
Age (Wave 1)—in years
South—1=the respondent lives in the south (Alabama, Arkansas, Florida, Georgia, Louisiana,
Mississippi, North Carolina, South Carolina, Tennessee, Texas, Virginia, Kentucky, Maryland,
Oklahoma, West Virginia), non-South respondent=0
Married (Wave 1 only)—“Are you currently married, widowed, divorced, separated or never
been married?” 1=married, 0=all other responses
Race (Wave 1 only)—“Would you describe yourself as white, black, Asian, Hispanic, American
Indian, other?” 1=black, 0=all else
Female (Wave 1 question)—1=female, 0=male
Party (Wave 3 branching questions used to create five dummy variables) – strong Democrat,
weak Democrat, Independents (includes party leaners and pure independents), weak
Republicans, and strong Republicans
Ideology (Wave 2 only) — “Do you consider yourself generally liberal, moderate or
conservative?”

25
-1=conservative; 0=moderate; 1=liberal
Sociotropic Economic Evaluation — “Would you say that over the past year the nation’s
economy has gotten worse, gotten better, stayed about the same?” 1=gotten worse; 2=stayed
about the same; 3=gotten better
26
References
Brader, Ted. (2006). Campaigning For Hearts and Minds: How Emotional Appeals in Political
Ads Work. Chicago: University of Chicago Press.
Brader, Ted and Bryce Corrigan. (2007). “How the Emotional Tenor of Ad Campaigns Affects
Political Participation.” Working Paper.
Brians, Craig Leonard, and Martin P. Wattenberg. (1996). “Campaign Issue Knowledge and
Salience: Comparing Reception from TV Commercials, TV News and Newspapers.”
American Journal of Political Science 40(1): 172–93.
Brooks, Deborah Jordan and John G. Geer. (2007). “Beyond Negativity: The Effects of
Incivility on the Electorate. American Journal of Political Science 51(1): 1–16.
Clinton, Joshua and Andrew Owen. (2006). “An Experimental Investigation of Advertising
Persuasiveness: Is Impact in the Eye of the Beholder?” Working Paper.
Franz, Michael and Travis Ridout. (2007). “Does Political Advertising Persuade?” Political
Behavior 29(4): 465-491.
Freedman, Paul and Ken Goldstein. (1999). “Measuring Media Exposure and the Effects of
Negative Campaign Ads.” American Journal of Political Science 43(4): 1189-
1208.
Freedman, Paul, Michael Franz and Kenneth Goldstein. (2004). “Campaign Advertising and
Democratic Citizenship.” American Journal of Political Science 48(4): 723-741
Fridkin, Kim L. and Patrick J. Kenney. (2004). “Do Negative Messages Work? The Impact of
Negativity on Citizens’ Evaluations of Candidates.” American Politics Research 32(5):
570-605.
Fridkin, Kim L. and Patrick J. Kenney. (2008). “The Dimensions of Negative Messages,”
American Politics Research 36(5): 694-723.
Geer, John G. 2006. In Defense of Negativity: Attack Ads in Presidential Campaigns. Chicago:
University of Chicago Press
Green, Donald P., and Jonathan S. Krasno. (1988) “Salvation for the Spendthrift Incumbent:
Reestimating the Effects of Campaign Spending in House Elections.” American Journal
of Political Science 32: 884–907.
Green, Donald Philip and Jonathan S. Krasno. (1990). “Rebuttal to Jacobson's ‘New Evidence
for Old Arguments’.” American Journal of Political Science 34: 363-372.
27
Huber, Gregory and Kevin Arceneaux. (2007). “Identifying the Persuasive Effects of Presidential
Advertising.” American Journal of Political Science 51(4): 957-977.
Huddy, Leonie, Feldman, Stanley and Erin Cassese. (2007). “On the Distinct Political Effects of
Anxiety and Anger.“ In Ann Crigler, Michael MacKuen, George E. Marcus, and W.
Russell Neuman. The Political Dynamics of Feeling and Thinking. University of Chicago
Press.
Jacobson, Gary C. (1990). “The Effects of Campaign Spending in House Elections: New
Evidence for Old Arguments.” American Journal of Political Science 34: 334-362.
Jamieson, Kathleen Hall, Paul Waldman, and Susan Sherr. (2000). “Eliminate the Negative?
Categories of Analysis for Political Advertisements.” In James A. Thurber, Candice J.
Nelson and David A. Dulio (eds.), Crowded Airwaves: Political Advertising in Elections.
Washington DC: Brookings.
Johnston, Richard, Michael G. Hagen and Kathleen Hall Jamieson. (2004). The 2000
Presidential Election and the Foundations of Party Politics. Cambridge: Cambridge
University Press.
Kahn, Kim Fridkin and Patrick J. Kenney. (1999). “Do Negative Campaigns Mobilize or
Suppress Turnout? Clarifying the Relationship between Negativity and Participation.”
American Political Science Review 93(4): 877-890.
Kahn, Kim Fridkin and Patrick Kenney. (2004). No Holds Barred: Negativity in U.S. Senate
Campaigns. Upper Saddle River, N.J.: Pearson.
Kahn, Kim Fridkin and Patrick Kenney. (2000). “Negative Advertising and an Informed
Electorate: How Negative Campaigning Enhances Learning During Senate Elections,” In
James A. Thurber, Candice J. Nelson and David A. Dulio (eds.), Crowded Airwaves:
Political Advertising in Elections. Washington DC: Brookings.
Kahneman, D., & Tversky, A. (1984). “Choices, Values, and Frames,” American Psychologist,
39: 341-350.
Lau, Richard. (1982). “Negativity in Person Perception,” Political Behavior 4: 353-377.
Lau, Richard. (1985). “Two Explanations for Negativity Effects in Political Behavior,” American
Journal of Political Science 29:119-138.
Lau, Richard, Lee Sigelman, and Ivy Brown Rovner. (2007). “The Effects of Negative
Political Advertisements: A Meta-Analytic Reassessment.” Journal of Politics 69(4):
1176-1209.

28
Lawton, L. Dale and Paul Freedman. (2001). “Beyond negativity: Advertising Effects in the
2000 Virginia Senate race.” Paper prepared for delivery at the annual meeting of the
Midwest Political Science Association.
Marcus, George E., W. Russell Neuman, and Michael MacKuen. (2000). Affective Intelligence
and Political Judgment. Chicago: University of Chicago Press.
Martin, Paul S. (2004). “Inside the Black Box of Negative Campaign Effects: Three Reasons
Why Negative Campaigns Mobilize.” Political Psychology 25(4): 545-62.
Pinkleton, Bruce. (1997). “The Effects of Negative Comparative Political Advertising on
Candidate Evaluations and Advertising Evaluations: An Exploration.” Journal of
Advertising 26(1): 19-29.
Ridout, Travis N., Dhavan V. Shah, Michael M. Franz and Kenneth M. Goldstein. (2004).
“Evaluating Measures of Campaign Advertising Exposure on Political Learning.”
Political Behavior 26(3): 201-225.
Shaw, Daron R. (1999). “The Effect Of TV Ads And Candidate Appearances On Statewide
Presidential Votes, 1988-96.” American Political Science Review 93(2): 345-61.
Shaw, Daron R. (2006). The Race to 270: The Electoral College and the Campaign Strategies of
2000 and 2004. Chicago: University of Chicago Press.
Sigelman, Lee and David Park 2007. “Incivility in Presidential Campaigns, 1952-2000,”
Working Paper.
Stevens, Dan. 2008. “Measuring Exposure to Political Advertising in Surveys.” Political
Behavior.
Datasets
The 2004 Election Panel Study, BYU Center for the Study of Elections and Democracy
and UW-Madison Wisconsin Advertising Project. Electronic resources from the EPS Web site
(http://csp.polisci.wisc.edu/BYU_UW/). Madison, WI: University of Wisconsin, Wisconsin
Advertising Project [producer and distributor], 2004, Waves 2 and 3.
Goldstein, Kenneth and Joel Rivlin. 2006. "Political Advertising in 2004." Combined File
[dataset]. Final release. Madison, WI: The Department of Political Science at The University of
Wisconsin-Madison.
29
Appendix
Table A.1---Full Model Results for Presidential Models
Dependent Variable= Reported Kerry Vote
Negative ads
Contrast Ads
Positive Ads
Fear Appeals
Anger Appeals
Enthusiasm Appeals
Policy Ads
Trait Ads
Policy/Trait Mix
Policy Attacks
Trait Attacks
Democratic Exposure 2.25 1.06 -0.43 3.44 2.28 0.3 1.52 0.31 1.95 1.74 0.89
Republican Exposure -2.35 -0.23 -1.27 -0.43 -0.48 -1.59 -3.03 -0.46 -2.29 -1.63 -1.48
Democratic Exposure to all other ads 1.79 1.86 2.88 -0.56 -0.71 3.27 2.14 2.72 2.11 1.25 2.41
Republican Exposure to all other ads -0.91 -3.12 -1.13 -1.41 -0.97 -1.24 -1.71 -3.55 -3.03 -2.08 -2.67
Initial Democratic preference 3.7 3.73 3.69 3.47 3.51 3.55 3.87 3.55 3.95 3.82 3.66
Initial Republican preference -1.44 -1.33 -1.4 -1.37 -1.31 -1.51 -1.19 -1.41 -1.29 -1.32 -1.41
Age -1.94 -2.02 -1.89 -1.68 -1.57 -2.07 -2 -1.86 -2.14 -2.16 -1.94
Age squared 1.92 1.99 1.89 1.66 1.52 2.04 2.02 1.85 2.13 2.19 1.91
Education 2.33 2.33 2.48 2.4 2.25 2.39 2.45 2.38 2.65 2.43 2.4
Southern resident -1.14 -1.14 -0.96 -0.51 -0.18 -1.4 -1.18 -1.34 -1.24 -1.28 -1.24
Married -1.17 -1.19 -1.1 -1.42 -1.63 -1.16 -1.23 -1.16 -1.18 -1.25 -1.14
African American 1.4 1.3 1.47 1.27 1.24 1.43 1.5 1.39 1.69 1.52 1.53
Female -1.31 -1.45 -1.23 -1.08 -0.99 -1.4 -1.58 -1.57 -1.6 -1.52 -1.61
Weak Democrat 1.54 1.55 1.71 1.65 1.5 1.64 1.66 1.64 1.77 1.64 1.79
Strong Democrat 2.95 3.02 2.8 3.17 3.05 3.09 3.12 3.2 3.21 3.08 3.15
Weak Republican -3.14 -3.04 -3.06 -3.14 -3.08 -3.17 -3.07 -2.79 -3.17 -3.1 -2.86
Strong Republican -4.69 -4.69 -4.73 -4.5 -4.59 -4.72 -4.9 -4.58 -4.29 -4.81 -4.43
Bush Visits to Market 1.31 1.24 1.56 1.47 1.59 1.21 1.46 1.24 0.96 1.45 1.59
Kerry Visits to Market -0.2 -0.18 -0.19 -0.45 -0.33 -0.07 -0.08 -0.14 0.21 -0.13 -0.66
Bush Job Approval -6.9 -6.71 -6.86 -6.81 -6.53 -6.92 -6.31 -6.69 -6.16 -6.61 -6.49
N=924
Entries are Z-scores. Coefficient sizes for exposure or control variables are available from the authors.
30
Table A.2---Full Model Results for Senate Models
Dependent Variable= Reported Democrat Vote
Negative Ads
Contrast Ads
Positive Ads
Fear Appeals
Anger Appeals
Enthusiasm Appeals
Policy Ads
Trait Ads
Policy/Trait Mix
Policy Attacks
Trait Attacks
Democratic Exposure -0.5 -1.18 1.36 -2.06 -2.38 2.13 -0.61 2.28 2.05 -0.88 -1.18
Republican Exposure -1.83 1.88 -1.98 -0.53 1.28 0.01 -0.71 -1.92 -2.42 1.03 -0.5
Democratic Exposure to all other ads 2 1.6 -0.47 2.59 1.99 -1.12 3.53 0.59 0.59 1.6 1.98
Republican Exposure to all other ads -0.58 -2.41 1.2 -0.74 -2 -2.27 -3.2 -1.23 -0.83 -1.93 -1.21
Initial Democratic preference 2.1 2.1 1.99 1.69 1.99 2.08 1.67 1.7 2 2.12 2.08
Initial Republican preference -1.79 -1.87 -1.84 -1.65 -1.82 -1.71 -2.14 -2.01 -2.04 -1.84 -1.86
Age -0.99 -1.33 -1.17 -0.98 -1.3 -1.08 -0.54 -0.99 -0.76 -1.13 -0.89
Age squared 0.78 1.07 0.92 0.8 0.99 0.86 0.4 0.82 0.58 0.89 0.7
Education -1.54 -1.37 -1.6 -1.5 -1.67 -1.6 -1.89 -1.23 -1.97 -1.66 -1.56
Southern resident -0.64 -0.2 -0.57 -1 -0.39 -0.41 -0.97 -0.85 -1.04 -0.64 -0.44
Married -0.22 -0.41 -0.53 -0.71 -0.67 0.03 -0.64 -0.59 -0.4 -0.37 -0.04
African American -0.54 -0.24 -0.26 -0.53 -0.27 -0.54 -0.93 -0.42 -0.67 -0.36 -0.53
Female -0.67 -0.79 -0.84 -0.7 -1 -0.81 -0.69 -0.54 -0.62 -0.68 -0.63
Weak Democrat 0.87 1.32 1.08 1.24 1.25 1.03 1.36 1.42 1.06 1.32 0.93
Strong Democrat 1.75 2.18 2.15 1.94 2.23 1.76 1.81 1.93 1.85 2.09 1.76
Weak Republican -1.73 -1.43 -1.52 -1.56 -1.22 -1.6 -1.14 -1.21 -1.45 -1.69 -1.63
Strong Republican -1.52 -1.38 -1.51 -1.58 -1.47 -1.5 -1.16 -0.98 -1.44 -1.61 -1.44
Democratic Candidate is Incumbent -0.53 -0.75 -1.17 -0.72 -1.24 -0.98 -0.24 -0.03 -0.77 -0.93 -0.7
Republican Candidate is Incumbent -0.45 0.51 0.55 0.33 0.25 -0.44 -0.01 0.03 -0.35 0.18 -0.17
Bush Job Approval -2.97 -3.03 -2.92 -3.03 -3.07 -3.02 -3.27 -3.21 -3.42 -2.96 -3
Respondent Ideology 1.79 1.69 1.95 1.82 1.74 1.81 1.29 1.45 1.62 1.69 1.71
Assessment of National Economy -2.24 -1.99 -1.95 -1.99 -1.58 -2.22 -1.9 -1.84 -2.16 -2.01 -2.23
N=566
Entries are Z-scores. Coefficient sizes for exposure or control variables are available from the authors.
31
Endnotes
1 There is a growing consensus, however, that campaign advertising, in total, can influence voter
choices, even only at the margins (Huber and Arceneaux 2007; Franz and Ridout 2007; Shaw
1999, 2006; Johnston, Jamieson, and Hagen 2004).
2 Of the remaining 13 studies, only 5 have been published. And of the 13, none operationalize
advertising exposure in the manner we use here. They also list 47 unique studies of tone and
candidate evaluations, 38 of which used an experimental design.
3 It should be noted that scholars of political advertising have recently implemented some
survey-based experiments that do increase external validity (Fridkin and Kenney 2008, Brooks
and Geer 2007; Clinton and Owen 2006), but such a methodology does not account for
respondents’ real-world exposure. That is, experimental participants are usually shown one or a
handful of ads. Our design allows for measures of exposure as experienced by respondents in
the course of a campaign.
4 Notably, they invite future work in this area, recommending that additional research consider
ad effects in presidential elections, future Senate elections, and for Democratic and Republican
ad differences. We do all three in this paper. More recently, in their 2008 paper, which uses an
experiment embedded in a national survey, they call for additional work on ad content “in the
midst of actual campaigns” (2008, p.713). We take that advice as well.
5 Brooks and Geer (2007) are clear that trait attacks can be civil. 6 There have, however, been some tweaks to this affect transfer model (Brader 2006). The first
objection is that all emotions—even if they are of the same valence—do not necessarily have the
same effects on political thinking and behavior. For instance, some research has posited that
while anxiety (motivated by fear appeals) leads to avoidance behaviors and heightened vigilance,
32
this is not the case for anger, which is associated with less thorough cognitive processing
(Huddy, et al. 2007)—a finding that would expect fewer persuasion effects from ads featuring
anger appeals. A second problem with the affect transfer explanation is that, increasingly,
empirical research has failed to support it. For instance, Brader’s experimental research (2006)
found that exposure to enthusiasm cues embedded in political ads reduced affect toward the ad’s
sponsor (pp.112-114).
7 Survey details are available at http://csp.polisci.wisc.edu/BYU_UW.
8 Data are available at http://www.polisci.wisc.edu/tvadvertising.
9 This coding structure follows the one Brader (2006) outlines (pp.148-152). To assess inter-
coder reliability on emotions, we had 10 additional coders assess up to 80 random ads on each of
the five emotions. In general, inter-coder reliability was quite high. For fear and anger, Pearson
correlations on the three-category coding ranged between a low of 0.55 to a high of 0.82. For
enthusiasm, correlations were even higher, ranging between 0.65 and 0.81. In general, these
correlations are lower than inter-coder assessments of policy focus and tone (see Franz et al
2007, Appendix B). Indeed, tone is largely an objective question, one that has the virtue of
minimizing measurement error. As such, any additional content coding of ads must consider the
trade-off between objective and more subjective categories. This problem is not new to the study
of advertising effects, however, and every study that assesses ad content effects must wrestle
with measurement error of this sort.
10 We match each respondent’s reported county of residence with the media market that covers
that county. See the Appendix in Freedman, Franz, and Goldstein (2004) for a discussion of how
to estimate exposure. See Ridout et al (2004) for an assessment of the validity and reliability of
this approach to measuring ad exposure
33
11 As mentioned, the panel survey also contained an initial June interview. We estimated all
models on the June-to-September panel, conditioning on reported vote choice in June. For the
presidential models, the results are largely consistent with the September-November analysis,
although exposure to certain types of ads have more limited variability in the earlier time frame
(i.e., there were a lot less fear and anger ads during the summer). For the Senate models, there
were lots of instances were no significant advertising had aired by the September interview.
Because of these complications, we only report the post-election models.
12 We also considered the influence of exposure on measures of candidate evaluations (i.e.,
favorability scores). The results show that to the extent that ads move vote choice, they have a
similar effect on candidate favorability scores. Because the inclusion of these additional model
triples the statistical evidence (all models for vote choice plus the same models for Republican
and Democratic favorability), we leave them out. They are available from the authors on
request, however.
13 The 2004 candidate travel data are reported by Eric M. Appleman of George Washington
University at https://www.gwu.edu/~action/2004/ (accessed on June 7, 2005). Appleman uses
public schedules provided by the campaigns supplemented by press accounts to record in which
city or cities Bush and Kerry made public appearances on each day. We matched each city with
its media market to calculate the total number of visits by each candidate to each media market.
We do not count totals visits to a media market in which a candidate attended only a fundraiser
because fundraisers generally attract a relatively small number of attendees and are not well
reported on by the local news media.
14 One might ask about estimating exposure to every cell in Table 1 (i.e., fear attacks; fear
contrasts; anger positives, etc). We avoid cutting the ads too finely in this regard, most

34
importantly because we have data from only one election year, and some cells have too few ad
airings. We do investigate policy and trait attacks, however, measured as the combined negative
and contrast ads within the policy and trait categories.
15 Note, also, that we list the Z-scores from these models in Table A.1 in the Appendix, along
with the exposure effects for all ads not containing the specific tone, emotion, or focus.
16 We split the analysis here by Democratic and Republican candidates, and we control for
incumbency; but one might ask specifically about the impact of incumbent and challenger-
sponsored ads. (Fridkin and Kenney 2004 do this in their analysis.) We re-ran all of the models
with this distinction, but found a similar pattern as what we present below. In other words,
incumbent ads and challenger ads are persuasive on many of the same exposure measures.


![Draft version February 3, 2012 arXiv:1202.0546v1 [astro-ph.CO] 2 … · 2012. 2. 3. · DRAFT VERSION FEBRUARY 3, 2012 ... Draft version February 3, 2012 ABSTRACT We use South Pole](https://static.fdocuments.us/doc/165x107/609eb13c597d24087025b7df/draft-version-february-3-2012-arxiv12020546v1-astro-phco-2-2012-2-3-draft.jpg)
