3.3.1. What is a Data Flow Diagram? Why are they used? How to draw them.
21
Data Flow Diagrams 3.3.1
-
Upload
jovan-pruiett -
Category
Documents
-
view
214 -
download
1
Transcript of 3.3.1. What is a Data Flow Diagram? Why are they used? How to draw them.

Data Flow Diagrams
3.3.1

This presentation covers
• What is a Data Flow Diagram?
• Why are they used?
• How to draw them.

Definition
“A data flow diagram is used for the visualization of data processing. It illustrates the processes, data stores, external entities, data flows in a business or other system and the relationships between these things.”
- Wikipedia
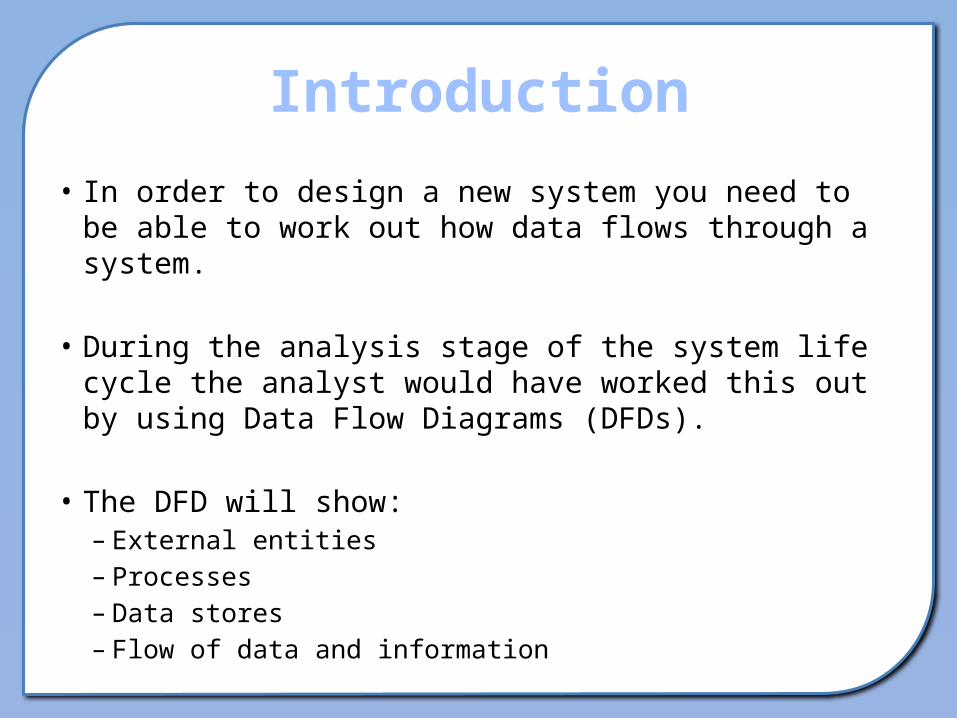
Introduction
• In order to design a new system you need to be able to work out how data flows through a system.
• During the analysis stage of the system life cycle the analyst would have worked this out by using Data Flow Diagrams (DFDs).
• The DFD will show:– External entities– Processes– Data stores– Flow of data and information

Understanding the symbolsExternal Entity:Anything that interacts with the system.Could be people, organisations or other systems.Generally, external entities input or receive data.
Process:This is an activity that takes place inside the system.It uses inputs to produces outputs.
Data Store:This is where data is stored (database, spreadsheet, paper form, filing cabinet etc).
Data flows:Show the direction that data flows through a system.
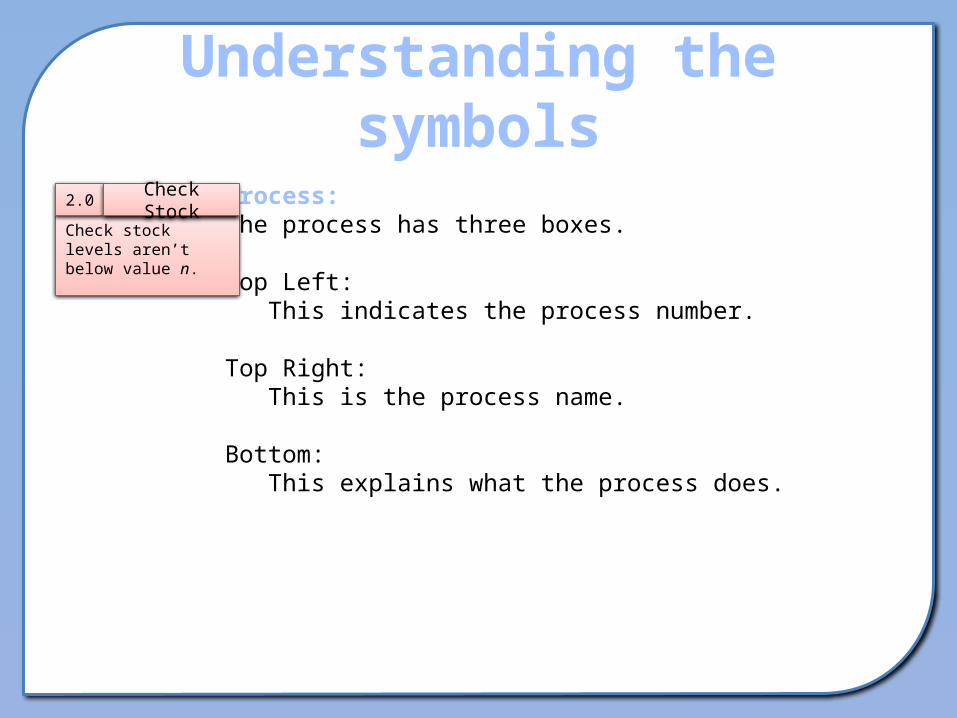
Understanding the symbols
Process:The process has three boxes.
Top Left: This indicates the process number.
Top Right: This is the process name.
Bottom: This explains what the process does.
Check stock levels aren’t below value n.
2.0 Check Stock

Understanding the symbols
Data Store:The process has two boxes
Left: This indicates the type of data store.
D: Computerised data store (database etc) M: Manual data store (paper, filing cabinet etc)
Right: This is the name of the data store.
Repeating Data Store:If a data store is repeated then this is indicated by removing the identifier from the repeated symbol and placing an additional vertical line into the symbol.
D2 Stock
M2 Invoices
Stock

Understanding the symbols
Entity:This box contains the name of the entity.
Repeating Entity:If the entity repeats
for example, a customer inputs data into the system and the same customer retrieves an output from the system.
then a diagonal line is drawn to represent this.
Customer
Customer

Data Flow Levels
• A DFD can been drawn to different levels of complexity.
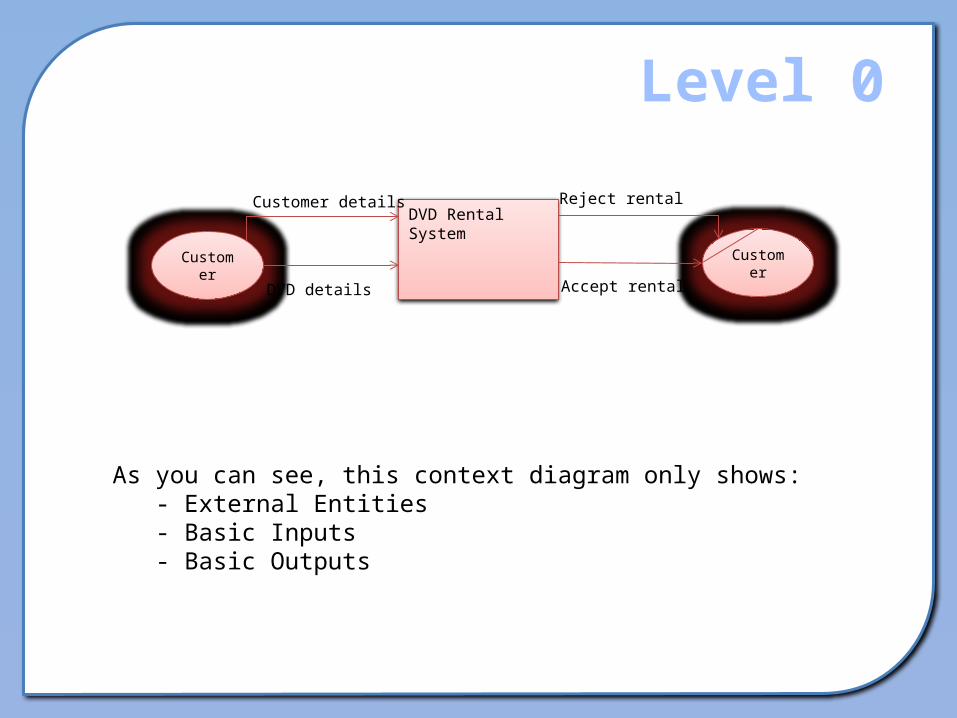
• At a basic level, (aka Context Level or Level 0), the diagram only gives a summary of the system.
• It will only show the external entities, the inputs and the outputs.
• It DOES NOT show the processes involved.

Level 0
Customer
DVD Rental SystemCustomer details
DVD details
Customer
Reject rental
Accept rental

Level 0
Customer
DVD Rental SystemCustomer details
DVD details
Customer
Reject rental
Accept rental
As you can see, this context diagram only shows: - External Entities - Basic Inputs - Basic Outputs

Level 0
Customer
DVD Rental SystemCustomer details
DVD details
Customer
Reject rental
Accept rental
As you can see, this context diagram only shows: - External Entities - Basic Inputs - Basic Outputs
Level 0
Customer
DVD Rental SystemCustomer details
DVD details
Customer
Reject rental
Accept rental
As you can see, this context diagram only shows: - External Entities - Basic Inputs - Basic Outputs

Level 1Customer
Receive details into the system.
1.0 ReceiveCustomer details
DVD details

Level 1Customer
Receive details into the system.
1.0 Receive
Check membership. < 3 DVDs rented? Banned?
2.0 Valid
Customer details
DVD details
Detail
D1 Membership

Level 1Customer
Receive details into the system.
1.0 Receive
Check membership. < 3 DVDs rented? Banned?
2.0 Valid
Add loan details to rental database.
3.0 Update
Customer details
DVD details
Detail
Detail
D1 Membership
D2 Rentals

Level 1Customer
Receive details into the system.
1.0 Receive
Check membership. < 3 DVDs rented? Banned?
2.0 Valid
Add loan details to rental database.
3.0 Update
Update status of borrowed DVD.
4.0 Update DVD
Customer details
DVD details
Customer
Detail
Detail
Detail
D1 Membership
D3 DVD
D2 Rentals
This diagram shows more detail compared to a context diagram.
You can see the processes and the data stores.

Database Design• Look closely at the previous DFD.
• Notice how where there is a data store you could relate this to a table in a database.
• Notice how where there is a process you need to have a query.
• Notice how where there is data flow you need to have an input into a system.
• Notice how where there is data flow out of a system there is need for a report.
• A DFD can help design a database if done correctly.
Extending the DFD further
• If you look closely, you can notice that some sections can be broken down further.
• Section 2 can be broken down to show the processes of checking if the person is a member, and doesn’t already have 3 DVDs on loan and isn’t blocked on the system.
• This would be known as a Level 2 DFD.

Explain...
• Draw and label the four symbols you’d expect to find in a DFD diagram.
• Why is it sometimes more suitable to draw a diagram than explain a system in words?
• Explain how a DFD could help a database designer.

Now you try!
• Create a Level 0 and Level 1 DFD which looks at what happens when you buy a pair of trainers from a shoe shop.
• The scenario...– You have gone into a shoe shop and found a pair of really
wicked trainers that you like. You have asked the shop assistant if they have your size. The shop assistant checks on her PDA to see if your size is available. Success! They have your size and you purchase the trainers. The system automatically updates the stock database. You walk away safe in the knowledge that your new trainers will allow you to run and jump faster than everyone else now!


![Data Flow Diagram - Psau · PDF fileRESTAURANT MANAGER Food Ordering System 0 ... Draw a diagram 0 DFD Step 3: Draw the lower-level ... uses of external entities in a data flow diagram.[1]](https://static.fdocuments.us/doc/165x107/5a9e3bc77f8b9a21488d91ee/data-flow-diagram-psau-manager-food-ordering-system-0-draw-a-diagram-0-dfd.jpg)