
3.1 Vensim Tutorial 1 - Shodorshodor.org/talks/cbbe/2010NCAT/day1-s1/Vensim Tutorial 1.pdf ·...
19
3.1 System Dynamics Tool: Vensim PLE Tutorial 1 Introduction to Computational Science: Modeling and Simulation for the Sciences Angela B. Shiflet and George W. Shiflet Wofford College © 2006 by Princeton University Press Introduction We can use the software Vensim® PLE from Ventana Systems, Inc. (http://www.vensim.com/) to model dynamic systems. Dynamic systems are usually very complex, having many components with involved relationships. For example, we can use Vensim to model the competition among different species for limited resources or the chemical reactions of enzyme kinetics. To understand the material of this tutorial sufficiently, we recommend that you do everything that is requested. While working through the tutorial, answer Quick Review Questions in a separate document. In the first tutorial on Vensim PLE, we consider an example on unconstrained growth. In this example, the rate of change of the population is equal to 10% of the number of individuals in the population, and the initial population is 100 individuals. Thus, we have the following differential equation, or equation involving a derivative: dP dt = 0.1 P , P 0 = 100 Start running the software, perhaps by double-clicking the Vensim PLE icon ( ). Then, select New from the File menu. A Model Settings popup menu appears (see Figure 3.1.10). Usually, when starting a new model, we change some of the values in this window. However, until we have had time to consider some of Vensim's features, accept the default settings by clicking OK. A window appears as in Figure 3.1.1. In this window, we can construct a diagram model with equations.
Transcript of 3.1 Vensim Tutorial 1 - Shodorshodor.org/talks/cbbe/2010NCAT/day1-s1/Vensim Tutorial 1.pdf ·...
3.1 System Dynamics Tool:
Vensim PLE Tutorial 1
Introduction to Computational Science:
Modeling and Simulation for the Sciences
Angela B. Shiflet and George W. Shiflet
Wofford College
© 2006 by Princeton University Press
Introduction
We can use the software Vensim® PLE from Ventana Systems, Inc.
(http://www.vensim.com/) to model dynamic systems. Dynamic systems are usually
very complex, having many components with involved relationships. For example, we
can use Vensim to model the competition among different species for limited resources or
the chemical reactions of enzyme kinetics.
To understand the material of this tutorial sufficiently, we recommend that you do
everything that is requested. While working through the tutorial, answer Quick Review
Questions in a separate document.
In the first tutorial on Vensim PLE, we consider an example on unconstrained
growth. In this example, the rate of change of the population is equal to 10% of the
number of individuals in the population, and the initial population is 100 individuals.
Thus, we have the following differential equation, or equation involving a derivative:
!
dP
dt= 0.1P, P
0=100
Start running the software, perhaps by double-clicking the Vensim PLE icon ( ).
Then, select New from the File menu. A Model Settings popup menu appears (see
Figure 3.1.10). Usually, when starting a new model, we change some of the values in
this window. However, until we have had time to consider some of Vensim's features,
accept the default settings by clicking OK. A window appears as in Figure 3.1.1. In this
window, we can construct a diagram model with equations.

Vensim PLE Tutorial 1 2
Figure 3.1.1 Vensim PLE window
The title bar, which is at the top of Figure 3.1.1, contains the text "Vensim-
Unnamed Var-FINAL TIME." The main toolbar is beneath the title bar and contains
typical icons for Open Model, Save, Print, Cut, Copy, and Paste, among others. The most
important icons for building a model, the sketch tools, appear towards the left, below the
main tool bar, and immediately above the large, currently blank Build (Sketch) Window.
Table 3.1.1 lists the sketch tools, and the following sections describe the meanings of
these building blocks.
Table 3.1.1 Basic building blocks of Vensim
Building Block Icon Meaning
Box Variable
or Stock noun, something that accumulates
Rate or Flow
verb, activity that changes magnitude of stock
Variable or
Converter converts, stores equation or constant, does not accumulate
Arrow or
Connector
transmits inputs and information
Box Variable or Stock
In Vensim PLE terminology, a box variable or stock is a noun and represents something
that accumulates. Some examples of stocks are population, radioactivity, enzyme
concentration, self-esteem, and money. At any instant, the magnitudes of the stocks give
us a snapshot of the system.

Vensim PLE Tutorial 1 3
Quick Review Question 1 In Vensim, click on the rectangular stock icon. Without
holding down the mouse button, move the cursor towards the top-middle of the
window. What is the shape of the cursor?
Click in the Build Window to insert a stock object. Without clicking again, type the
name of the stock, population. The contents of the window should be similar to Figure
3.1.2. To change the name later, click once on the stock with the box variable icon and
type the new name and press RETURN or ENTER.
Figure 3.1.2 Contents of window after insertion of stock called population
Quick Review Question 2 Select the hand tool ( ) on the left of the sketch toolbar and
then click on the stock's name, population, and attempt to drag the name around the
screen. Describe what happens.
Under the File menu, select Save (or ctrl-s on a PC or command-s on a Macintosh)
or click the Save icon on the main toolbar to save your work to a disk. Use a meaningful
name for the file, such as "Vensim for Tutorial 1." Save your work frequently. Thus, if
there is a power interruption, you will not lose much of your work. Also, sometimes if
you make a mistake, it is easier to close the file without saving and open the recently
saved version.
Rate or Flow
While a stock is a noun in the language of Vensim, a rate or flow is a verb. A rate is an
activity that changes magnitude of stock. Some examples of such activities are births in a
population, decay of radioactivity, formation of an enzyme, improvement of self-esteem,
or growth of money. The rate (flow) icon represents a directed pipe with a valve.

Vensim PLE Tutorial 1 4
Click on the flow icon. Click a couple of inches to the left of the stock; and then
without dragging, click the stock so that a rectangular with a cursor appears. Type its
name, growth, in the rectangle and press RETURN or ENTER. The diagram should
appear similar to Figure 3.1.3 with the flow beginning in a cloud, the ether, which in this
example is a source.
Figure 3.1.3 Diagram after addition of growth rate (flow)
Quick Review Question 3 Drag the population stock around the right of the screen.
What happens to the diagram?
If moving the population stock does not result in the flow arrow moving, too, but
reveals another cloud, you need to delete the flow and create another that attaches to the
stock.
We can change the direction of flow from being only into population to being into
and out of this reservoir so that population can increase or decrease. Thus, we are
changing the flow from a uniflow having one direction to a biflow going in two
directions. To change the direction, we first select the hand tool. Then, on the small
circle to the left of the valve for growth, right click with a Windows computer or ctrl-
click with a Macintosh computer. Should we wish to allow values to flow in both
directions through the arrow, we click the top left checkbox for Arrowhead and then OK
in the popup menu (Figure 3.1.4). In this case, the flow would appear as in Figure 3.1.5
with arrowheads at both ends representing the possibilities of addition to and removal
from the population.

Vensim PLE Tutorial 1 5
Figure 3.1.4 Popup menu for the arrow
Figure 3.1.5 Biflow for growth
If you changed the flow to be a biflow, restore the arrow to be uniflow as in Figure
3.1.3 by right clicking (Windows) or ctrl-clicking (Macintosh) and unchecking
Arrowhead in the arrow popup menu (Figure 3.1.4).
Save your work.
Variable—Auxiliary/Constant or Converter
We can use an auxiliary/constant variable or converter to modify an activity. A
variable can store an equation or a constant. For example, with the population model a
variable might store the constant growth rate, say 10% = 0.1.
As an example for radioactive decay, radioactive substance bismuth-210 decays to
radioactive substance polonium-210. With A representing the amount of bismuth-210
and B the amount of polonium-210, the ratio B/A is significant in the model of decay. A
converter can store this ratio.
Select the Variable—Auxiliary/Constant icon, which has "VAR" and a pencil but
no box. Click below and to the left of the flow name, growth. Name the converter
growth rate. Blanks are permissible. The diagram should appear similar to Figure 3.1.6.

Vensim PLE Tutorial 1 6
Figure 3.1.6 Diagram after insertion of converter growth rate
Arrow or Connector
An arrow or connector transmits an input or an output. For example, in a population
model, a connector can transmit the growth rate value from the growth rate
auxiliary/constant variable (converter) to the growth flow.
In a radioactive decay model, connectors from the bismuth-210 (A) stock and from
the polonium-210 (B) stock to a converter for the ratio of B over A transmit the respective
amounts of radioactivity for use by the converter.
In the population model, both the growth rate and the current population affect the
current growth. For example, if the growth rate is higher, so is the growth. Moreover, a
larger population exhibits a greater change in population. We indicate these relationships
by connecting the growth rate converter (variable) and the population stock (box
variable) to the flow growth. After selecting the connector icon, click growth rate and
then growth. The resulting diagram is as in Figure 3.1.7a. Without selecting another
tool, we can use the same tool again. Connect population to growth as in Figure 3.1.7b
by clicking population, clicking below and between population and growth to create an
arch, and then growth. Small circles indicate anchors that we can drag to create arches.
Save your work.
Figure 3.1.7 Connectors drawn to growth flow
a b

Vensim PLE Tutorial 1 7
Quick Review Question 4 For the connector from the stock to the flow, select the hand
tool and then click on the small circle on the arrow and drag it around. What
happens to the arrow?
Quick Review Question 5 What happens to the arrow as you drag box variable
population around the screen?
Delete
To remove a component from the diagram, we use the delete tool ( ) or Cut from the
File menu. Using the delete key does not completely eliminate the item from the model.
Select the delete icon, which is the second-to-the-last icon on the right in the sketch
toolbar.
Quick Review Question 6 With the delete tool, click on population to remove the
variable. What is eliminated?
When we remove an item with delete tool, the process eliminates the item and all
connected connectors and flows. Restore the model to its previous form by closing the
current document without saving and reopening the document. If a component is
missing, recreate the model to appear as in Figure 3.1.7b.
Equations and Initial Values
We are now ready to enter equations and initial values. To begin defining an initial
population, click on the equation tool ( ), which is next-to-the last icon on the right of
the sketch tools toolbar. The three items that can have values or equations (population,
growth, and growth rate) turn black. Click the population variable, and view a popup
menu as in Figure 3.1.8. For an initial population of 100 bacteria, type 100 at the
location of the cursor in the Initial Value text box. Click the Check Syntax button at the
bottom left of the panel. In the Errors: box immediately above the button, Vensim
responds Equation OK.

Vensim PLE Tutorial 1 8
Figure 3.1.8 Popup menu after clicking the equation icon and population
The dropdown menu for Units: lists several alternatives, including Dmnl for
dimensionless, which we should use when a value has no units. Because the appropriate
unit for population is not in the list, we type bacteria after Units:.
The boxes and text of the equation panel (Figure 3.1.8) indicate that population is
the integral (INTEG) of growth and the initial value of population is 100 bacteria.
Hence, Vensim is saying the following, where time (t) goes from a to b:
!
P = growth dta
b
"
We do not need to understand integration to use Vensim. As we discuss in detail in
Module 3.2 on "Unconstrained Growth," in computer simulation terms, the statement is
equivalent to the following:
(new population) = (old population) + (change in population)
= (old population) + growth * dt
= (old population) + (growth over 1 unit) * (length of time step)
To complete input for population, click OK on the bottom left of the panel.
Quick Review Question 7 To establish the growth rate as 10% = 0.1, first, click the
variable (converter) with the equation tool. What precedes the text box containing
the cursor?
Type 0.1 in the text box. In the Units: text box, type 1/Hour, and click OK. Notice
that after entering a growth rate and an initial population, the diagram elements no longer
appear black.

Vensim PLE Tutorial 1 9
We often employ replacement of blanks with underscores in the text to avoid
confusion with component names. Thus, growth rate is equivalent to growth_rate in this
tutorial and the text.
Unlike growth_rate, the flow growth is not a constant; but the growth in the
population changes with time as the population changes. For our example, at any instant,
the rate of change in the population, or growth, is 10% (growth_rate) of the current
population (population). In calculus terminology, the instantaneous rate of change of
population is the derivative of population with respect to time t, so that we have the
following formula:
!
d(population)
dt= growth _ rate " population
= 0.1 " population
Clicking on growth, we see a popup menu as in Figure 3.1.9.
Figure 3.1.9 Popup menu for growth
Quick Review Question 8 The submenu Choose Initial Variable… of the Popup menu
for growth (Figure 3.1.9) lists the items that have connectors to growth, namely
population and growth_rate. We include these variables in the formula for growth.
For our example, this instantaneous rate of change of population is
(0.1)(population) bacteria per hour. Using * for multiplication and clicking on the
appropriate variables in Choose Initial Variable…, enter the formula for growth.
What is the resulting formula? For the units, type bacteria/Hour. Click OK.

Vensim PLE Tutorial 1 10
We can verify that our units are consistent from the Model menu by selecting Units
Check. Unfortunately, Vensim indicates that we have one error. The Units Checking
popup menu displays the following analysis: Error in units for the following equation: population = INTEG( growth , 100) population --> bacteria growth --> bacteria/Hour Analysis of units error: Right hand and left hand units do not match population Has units: bacteria INTEG( growth , 100) Has units: Month*bacteria/Hour
An inconsistency (in boldface here) in the time units between Hour and Month
exists. The problem arises from the fact that Vensim uses a default unit of Month for
time. To override the default, from the Model menu we select Settings.... In the resulting
Model Settings popup menu (Figure 3.1.10), we change the Units for Time to be Hours.
This change should correct the inconsistent units, so click OK.
Figure 3.1.10 Model Settings popup menu

Vensim PLE Tutorial 1 11
Quick Review Question 9 After making the change of units, perform a units check from
the Model menu. Give the displayed message.
For this example, let us also change the length of the simulation and the time
between steps of the simulation. Once more, select Settings... from the Model menu. In
the Model Settings popup menu (Figure 3.1.10), leave the INITIAL TIME as 0 Hours,
but change the FINAL TIME to be 12 Hours so that the simulation does not run as long.
Also, in the dropdown menu for TIME STEP, select 0.125. Thus, calculations for the
simulation will be every 0.125 Hours instead of every hour. Usually, a smaller TIME
STEP generates more accurate results but causes the simulation to take longer. Click OK.
Clicking the document icon (Doc) to the left side of the Build Window reveals the
formulas, which Equation Set 1 displays. We established values for the FINAL TIME
(12), INITIAL TIME (0), TIME STEP (0.125), and units for time (Hour) in Model
Settings popup menu. Using the equation tool, we set a value for growth_rate (0.1), its
unit (1/Hour), an initial value for population (100), its unit (bacteria), and the equation
for growth (growth_rate * population).
Save your work and continue saving frequently.
Equation Set 1 Formulas
(1) FINAL TIME = 12 Units: Hour The final time for the simulation. (2) growth= growth rate*population Units: bacteria/Hour (3) growth rate= 0.1 Units: 1/Hour (4) INITIAL TIME = 0 Units: Hour The initial time for the simulation. (5) population= INTEG ( growth, 100) Units: bacteria (6) SAVEPER = TIME STEP Units: Hour [0,?] The frequency with which output is stored.

Vensim PLE Tutorial 1 12
(7) TIME STEP = 0.125 Units: Hour [0,?] The time step for the simulation.
Comments
Documenting our work is extremely important. We want other people to be able to
understand the model as quickly as possible. Moreover, we can very easily forget what
we intended just a few days or hours ago. We may have several very similar versions of
the same model that we need to distinguish one from another. We do not want to waste
our own or someone else's time by having to dig deeply into the different levels and
equations to understand the model.
Quick Review Question 10 To enter a comment, click the comment icon ( ),
which is the fourth icon from the right on the sketch toolbar, to get a text box.
What is the shape of the resulting cursor?
Click towards the top middle of the Build Window to insert the text box. Type
"Unconstrained Growth Population Model," your name, the date, and an explanation that
the model is for growth of a population with no limiting factors. Press RETURN,
ENTER, or OK. Drag on the small circle, called a handle, at the right bottom corner to
resize the text box.
Quick Review Question 11 What occurs when you click the text box with the
comment icon?
Run Simulation
To generate a simulation dataset that we can display and graph, we click the Run a
Simulation icon ( ), which appears as a running man immediately to the right of the
text box containing Current. A display of the times appears as the simulation progresses.
When complete, the name of the resulting dataset is Current, the name in the text box.
We can change the simulation setup, such as the TIME STEP or length of the simulation,
and generate another dataset using a different name.

Vensim PLE Tutorial 1 13
Quick Review Question 12 How many time units does the simulation run?
Quick Review Question 13 Click on the Run a Simulation icon again. Give the
message that appears. Click Yes to run the simulation again and overwrite the
dataset.
Graphs
The Graph icon ( ) appears as a picture of two small graphs to the middle, left of the
Build Window. After clicking this icon, a graph popup window of population versus
Time appears immediately (see Figure 3.1.11). Adjust the placement of the graph by
dragging on its title bar. Drag on an edge to change the size of the graph popup window.
Figure 3.1.11 Graph of population versus Time
Quick Review Question 14 About how many time units does it take for the initial
population to double?
Quick Review Question 15 Click outside of the graph popup window. What
happens?
To redisplay output, such as a graph or table that no longer appears because we
clicked outside its window, click the Output Windows - show/circulate icon ( ), which
is the second icon from the right on the main (top) toolbar. We can close an output
window so that show/circulate does not reactivate the display by clicking the horizontal
bar on the top left of the window or clicking the X on the top right of the window.
Frequently, we want more control over a graphical display, such as designating a
title or having more than one plot appear on the same graph. To do so, click on the
Vensim PLE Tutorial 1 14
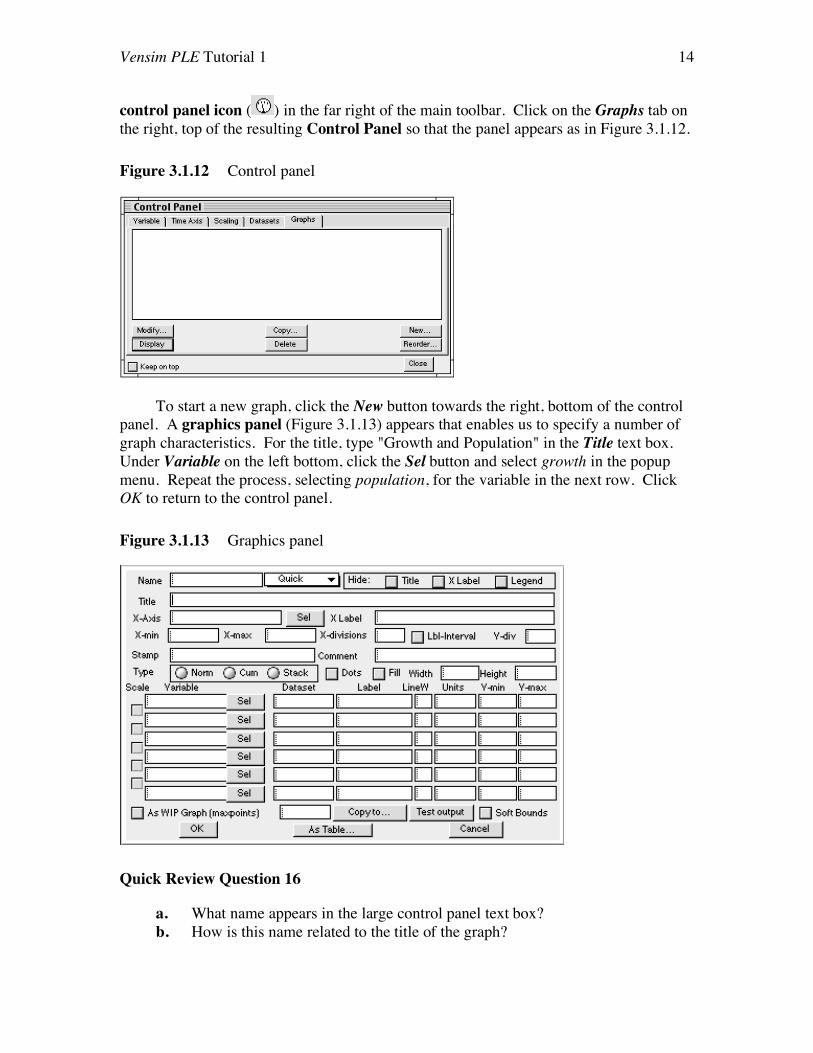
control panel icon ( ) in the far right of the main toolbar. Click on the Graphs tab on
the right, top of the resulting Control Panel so that the panel appears as in Figure 3.1.12.
Figure 3.1.12 Control panel
To start a new graph, click the New button towards the right, bottom of the control
panel. A graphics panel (Figure 3.1.13) appears that enables us to specify a number of
graph characteristics. For the title, type "Growth and Population" in the Title text box.
Under Variable on the left bottom, click the Sel button and select growth in the popup
menu. Repeat the process, selecting population, for the variable in the next row. Click
OK to return to the control panel.
Figure 3.1.13 Graphics panel
Quick Review Question 16
a. What name appears in the large control panel text box?
b. How is this name related to the title of the graph?

Vensim PLE Tutorial 1 15
To view the graph, which appears in Figure 3.1.14, click the Display button on the
left bottom of the control panel. Because the graphs of growth and population have the
same shape and the scales are different, the two graphs appear on top of each other. To
show the graphs on the same scale, return to the control panel and click Modify. In the
resulting graphics panel, click on the Scale checkbox between and to the left of the
variables growth and population. So that your name appears on the graph, place your
name in parentheses at the end of the title. Click OK and then Display in the control
panel.
Figure 3.1.14 Graph of growth and population using different scales
Quick Review Question 17 Describe the differences in the current graph, which
employs the same scale for both variables, and the graph of Figure 3.1.14.
By default, Vensim uses different colors to distinguish between the graphs. To print
with a black-and-white printer, we have several alternatives available through Options...
on the Options menu (Figure 3.1.15). To have Vensim number each plot, click Show
Line Markers on Graph Lines checkbox at the top left. Other useful options in the
Color for Display, Print & Clipboard section in the middle of the panel are
Monochrome for black-and-white graphs and Only solid lines for solid lines instead of
dotted and dashed ones.

Vensim PLE Tutorial 1 16
Figure 3.1.15 Options panel
Quick Review Question 18 By making one change at a time in the options panel
and then redisplaying the graph from the control panel, describe the change(s)
caused by clicking each of the following:
a. Show Line Markers on Graph Lines
b. Monochrome
c. Only solid lines
To preserve this graph regardless of what other changes we make, click the lock
icon at the top left of the graph window (see Figure 3.1.14). Click the next icon, and
print the graph. The Export window contents icon copies the table to the clipboard for
pasting into another application, such as a word processing document. To toggle between
a larger and smaller graphical display, click the triangle(s) towards the right top of the
window.
Tables
We start generating a table in the same way we did graphs by clicking on the control
panel icon on the right of the main toolbar. From the control panel, we can develop a
new table or modify an existing one. For this example, select the graph's title,
Growth_and_Population, and click Copy. The resulting panel has a copy of the
information to create a graph of growth and population. Click the As Table... button in
the middle bottom of the control panel to see the table panel, Figure 3.1.16. In the Table
Name text box on the top left, change the name of the table from
Growth_and_Population_0 to Growth_and_Population_Table. Click the Running down
check box in the Time section on the right so that the time values appear in a column
down the page. Click OK. The resulting table appears as in Table 3.1.2.

Vensim PLE Tutorial 1 17
Figure 3.1.16 Table panel
Table 3.1.2 Table of growth and population
Quick Review Question 19 Give the last row of the table.
Quick Review Question 20 In the control panel after selecting Modify for
Growth_and_Population_Table, make the following changes: Have Time go from
5 to 10; have the Cell Width of the First column be 20 and of the Rest be 14; and in
the Table Content window drag to have growth appear after population. Describe
the first and last two lines of simulated data in the resulting table.
Print the table.

Vensim PLE Tutorial 1 18
Input/Output Tools
We can change initial values and constants in the model by selecting the equation tool
and then clicking the desired variable. For a visual display, click the Input Output
Object icon ( ) to the right of the sketch tools. Click in the model work area to place
the object. Immediately, the Input Output Object Settings panel appears (see Figure
3.1.17). Click Constant and select growth rate. Have values range from 0 to 0.2. After
clicking OK, we see a slider bar for growth rate. The SET icon ( ) to the left of the
dataset name activates the slider bar.
Figure 3.1.17 Input Output Object Settings panel
Quick Review Question 21 After clicking SET, Give the appearance of each of the
following:
a. The slider bar
b. growth_rate
Type or drag to obtain 0.09 as an alternative value for growth_rate. Change the
name of the dataset to Current09. Click the Run a Simulation icon to the right of the
dataset name to run a simulation with the new value for growth_rate. Click the Run a
Simulation icon again. To end the setup without running a simulation and return
growth_rate to its default value, click the STOP icon ( ) to the left of the dataset name.
Print the model diagram and the equations viewed by clicking Doc on the left. You
have already printed a graph and table. Save and Quit Vensim.
Reference
Kirkwood, Craig W., updated by Jennifer Cihla Vender, Vensim® PLE Quick Reference
and Tutorial,Ventana Systems, Inc., 2002. Available from:
http://www.public.asu.edu/~kirkwood/sysdyn/VenPLE.pdf
Vensim 5 Modeling Guide, Ventana Systems, Inc., 2003. Available from:
http://www.vensim.com/

Vensim PLE Tutorial 1 19
Vensim 5 Reference Manual, Ventana Systems, Inc., 2003. Available from:
http://www.vensim.com/
Vensim® Ventana® Simulation Environment, User's Guide Version 5, Ventana Systems,
Inc., 2002. Available from: http://www.vensim.com/


![CBBE [Compatibility Mode]](https://static.fdocuments.us/doc/165x107/577d2c801a28ab4e1eac657c/cbbe-compatibility-mode.jpg)