3.0 Regional Growth Forecasts - Nashville Area MPO€¦ · 3.0 Regional Growth Forecasts 3.1...
7
NASHVILLE AREA MPO 2035 REGIONAL TRANSPORTATION PLAN ADOPTED DECEMBER 15, 2010 27 3.0 Regional Growth Forecasts 3.1 Population & Employment Trends The greater Nashville area is poised to grow by leaps and bounds over the next 25 years. Across the 10 county Middle Tennessee region, the MPO forecasts nearly one million more people to live in the area by the year 2035. Where those people live, work, and play, along with their socio economic characteristics, will significantly influence the need for investments into our region's transportation infrastructure. As we think about future investments in transportation, it is important to realize that by the 2035, our region will be as large as the Denver region is today. Figure 9. Middle Tennessee Population Growth Trends and Forecast, 1965 to 2035 500,000 1,000,000 1,500,000 2,000,000 2,500,000 3,000,000 1965 750,000 2000 1,450,000 2008 1,700,000 2035 2,600,000 Denver Region (2.5 million) Austin Region, Charlotte Region (1.7 million) Portland (OR) Region (2.2 million) Seattle Region (3.3 million) 10-County CRT Region Other regions (MSA) 500,000 1,000,000 1,500,000 2,000,000 2,500,000 3,000,000 1965 750,000 1965 750,000 2000 1,450,000 2000 1,450,000 2008 1,700,000 2008 1,700,000 2035 2,600,000 2035 2,600,000 Denver Region (2.5 million) Austin Region, Charlotte Region (1.7 million) Portland (OR) Region (2.2 million) Seattle Region (3.3 million) Denver Region (2.5 million) Denver Region (2.5 million) Austin Region, Charlotte Region (1.7 million) Austin Region, Charlotte Region (1.7 million) Portland (OR) Region (2.2 million) Portland (OR) Region (2.2 million) Seattle Region (3.3 million) Seattle Region (3.3 million) 10-County CRT Region Other regions (MSA) Source: U.S. Census Bureau, Woods & Poole Economics. Much of the projected growth for Middle Tennessee is expected to occur within the seven counties that are included, at least in part, in the planning area of the Nashville Area MPO. As shown in the following tables, from 2006 a year following the adoption of the MPO’s last regional transportation plan to the year 2035, the seven county area is expected to see a 56 percent increase in population and jobs. Davidson County is expected to remain the most populous county of the region and the center of the region’s job market, adding another 138,470 people and 196,429 jobs by the year 2035. Williamson County is expected to see the largest rate of growth, as well as the largest net increase in population (228,976 people), more than doubling its population from 2006 through 2035, from 159,094 people to 387,970– a 144 percent increase.
Transcript of 3.0 Regional Growth Forecasts - Nashville Area MPO€¦ · 3.0 Regional Growth Forecasts 3.1...

NASHVILLE AREA MPO 2035 REGIONAL TRANSPORTATION PLAN ADOPTED DECEMBER 15, 2010 27
3.0 Regional Growth Forecasts
3.1 Population & Employment Trends The greater Nashville area is poised to grow by leaps and bounds over the next 25 years. Across the 10 countyMiddle Tennessee region, the MPO forecasts nearly one million more people to live in the area by the year 2035.Where those people live, work, and play, along with their socio economic characteristics, will significantlyinfluence the need for investments into our region's transportation infrastructure. As we think about futureinvestments in transportation, it is important to realize that by the 2035, our region will be as large as theDenver region is today.
Figure 9. Middle Tennessee Population Growth Trends and Forecast, 1965 to 2035
500,000
1,000,000
1,500,000
2,000,000
2,500,000
3,000,000
1965750,000
20001,450,000
20081,700,000
20352,600,000
Denver Region (2.5 million)
Austin Region, Charlotte Region (1.7 million)
Portland (OR) Region (2.2 million)
Seattle Region (3.3 million)
10-County CRT Region
Other regions (MSA)
500,000
1,000,000
1,500,000
2,000,000
2,500,000
3,000,000
1965750,000
1965750,000
20001,450,000
20001,450,000
20081,700,000
20081,700,000
20352,600,000
20352,600,000
Denver Region (2.5 million)
Austin Region, Charlotte Region (1.7 million)
Portland (OR) Region (2.2 million)
Seattle Region (3.3 million)
Denver Region (2.5 million)Denver Region (2.5 million)
Austin Region, Charlotte Region (1.7 million)Austin Region, Charlotte Region (1.7 million)
Portland (OR) Region (2.2 million)Portland (OR) Region (2.2 million)
Seattle Region (3.3 million)Seattle Region (3.3 million)
10-County CRT Region
Other regions (MSA)
Source: U.S. Census Bureau, Woods & Poole Economics.
Much of the projected growth for Middle Tennessee is expected to occur within the seven counties that areincluded, at least in part, in the planning area of the Nashville Area MPO. As shown in the following tables, from2006 a year following the adoption of the MPO’s last regional transportation plan to the year 2035, theseven county area is expected to see a 56 percent increase in population and jobs.
Davidson County is expected to remain the most populous county of the region and the center of the region’sjob market, adding another 138,470 people and 196,429 jobs by the year 2035. Williamson County is expectedto see the largest rate of growth, as well as the largest net increase in population (228,976 people), more thandoubling its population from 2006 through 2035, from 159,094 people to 387,970– a 144 percent increase.

NASHVILLE AREA MPO 2035 REGIONAL TRANSPORTATION PLAN ADOPTED DECEMBER 15, 2010 28
Table 2. Population & Jobs Forecast for MPO Counties
YEAR MPO DAVIDSON MAURY ROBERTSON RUTHERFORD SUMNER WILLIAMSON WILSON
2006 1,394,928 613,856 77,550 61,708 230,980 148,534 159,094 103,206
2015 1,637,000 654,879 89,371 73,949 288,734 172,232 229,052 128,783
2025 1,904,300 702,871 101,595 87,563 349,083 197,500 308,328 157,360
2035 2,174,914 752,326 114,005 101,324 409,986 223,124 387,970 186,179
2006 983,074 559,435 44,773 29,573 131,831 57,236 108,904 51,322
2015 1,128,118 618,891 50,722 34,251 155,284 64,282 143,628 61,060
2025 1,316,029 687,059 58,019 40,223 187,195 73,129 196,539 73,865
2035 1,536,746 755,684 65,964 47,049 226,453 83,053 269,755 88,788
People
Jobs
Source: U.S. Census Bureau, Woods & Poole Economics
Over the next quarter century, the demographic makeup of the region is expected to change significantly fromthat of today, particularly with respect to race, ethnicity, and age. By the year 2035, 15 percent of residents inthe area will be 65 years or older, compared with about 11 percent today. Nationally, by the year 2025, expertsexpect just over one quarter of all households will have children living at home – compared with about half ofhouseholds back in the 1950s. The region’s population also will be more racially and ethnically diverse.According to MPO forecasts provided by Woods and Poole Economics, by the year 2035, the percentage of thepopulation within the region of Hispanic ethnicity will grow to 19 percent from about 6 percent in 2010.
Table 3. Change in Key Demographic Indicators, 1990-2035 Demographic 1990 2000 2010 2035Total Population 982,486 1,226,954 1,506,645 2,174,914Median Age 33 35 36 35Non White, Non Hispanic 17% 19% 20% 20%Hispanic 1% 3% 7% 20%65 Years of Age or Older 11% 10% 11% 15%
Source: U.S. Census Bureau, Woods & Poole Economics
Since the mid 1980s, the counties surrounding Davidson County have been experiencing rapid population andeconomic growth, resulting in a diversification of economies and the development of a regional economy.Mirroring trends at the national level, the Nashville region will see continued job losses ( 14%) in theManufacturing and Industrial sectors while Nashville’s strength in the Medical and Services (+78%) sectors willdrive future growth. Transportation, Communication and Public Utilities will also experience noteworthy growth.
NASHVILLE AREA MPO 2035 REGIONAL TRANSPORTATION PLAN ADOPTED DECEMBER 15, 2010 29
Table 4. Regional Employment by Industry/ Sector, 2008-2035
2008 2035 Change2008 2035Category Detailed Category Jobs % of Jobs Jobs % of Jobs
Totals 1,013,430 100% 1,536,746 100% 52%
Industrial
Farm and Agricultural Services 13,386 1.32% 14,217 0.93% 6%Mining 928 0.09% 912 0.06% 2%Construction Employment 65,045 6.42% 92,297 6.01% 42%Manufacturing Employment 83,309 8.22% 71,806 4.67% 14%Trans, Comm, & Public Utilities 40,604 4.01% 68,429 4.45% 69%Wholesale Trade 43,167 4.26% 49,819 3.24% 15%
Retail Retail Trade 185,871 18.34% 278,331 18.11% 50%
OfficeFinance, Insurance, & Real Estate 88,668 8.75% 120,327 7.83% 36%Services 391,338 38.62% 697,292 45.37% 78%Government 101,114 9.98% 143,316 9.33% 42%
Source: U.S. Department of Labor, Woods and Poole Economic
Table 5. Percentage of Jobs by Employment Category and County, 2008-2035 Year Category Davidson Maury Robertson Rutherford Sumner Williamson Wilson
2008Industrial 19% 33% 44% 36% 34% 17% 35%Retail 19% 16% 15% 16% 17% 20% 18%Office 62% 52% 41% 48% 49% 63% 47%
2035Industrial 15% 26% 37% 31% 31% 11% 28%Retail 17% 15% 13% 20% 16% 21% 21%Office 68% 59% 50% 49% 53% 68% 51%
Source: U.S. Department of Labor, Woods and Poole Economic
3.2 Land Development Forecasts As indicated by the MPO’s projection for a 56 percent increase in population between now and 2035, theNashville area is anticipated to grow as a region well into the future. Determining where those people will live,work, and play is instrumental in determining where and how transportation infrastructure should be improvedor expanded to accommodate that growth. While predicting the future is no easy task, the MPO employs astate of the art geographic information system (GIS) modeling tool to assist in the effort.
The MPO’s regional land use model, built using CommunityViz, is the tool used to predict future demographicpotential of each parcel of land throughout the region. This model allocates future households and employmentthroughout the region based on the land use policies and the each parcel of land’s ability to attract new growth.
The basic premise of the land use model is the concept of supply and demand. The supply is simply the region'sability to accommodate new development. In other words, it's the regions "development capacity". Supply isusually determined by land use policies and/or subdivision regulations and provides specific guidelines thatdevelopers should follow when looking at a prospective piece of property. Demand is the region's predictedgrowth based on the region's economic outlook. This value can, (and does), change on a regular basis so it'simportant to monitor this and revise the demand when appropriate.

NASHVILLE AREA MPO 2035 REGIONAL TRANSPORTATION PLAN ADOPTED DECEMBER 15, 2010 30
Step 1: Identify Land Available for Future Development The first step in predicating a future land development pattern is to identify those areas that can physicallyaccommodate future growth. This analysis includes the identification of parcels of land throughout the regionthat are either already developed, or have some characteristic or factor that prevents or precludes futuregrowth from occurring. Natural barriers such as bodies of water or steep slopes, or land protected by publicpolicy or regulation (e.g., parks, conservation areas, etc.) are taken off the table and not considered available forfuture development. The result of this analysis produces a map of vacant Greenfield parcels that have thecapacity to support some amount of future growth.
Figure 10. Land Availability Analysis
Step 2: Identify the Development Capacity of that Land Exactly how much opportunity a parcel has to support future growth is determined by several factors. Thesecond step in the land use modeling process measures each parcel’s development capacity through an in depthanalysis of its land area, topographic features, and the implications of the overlying land developmentregulations and local land use policies.
Capacity is calculated for each parcel for a three dimensional area called a building envelope. The buildingenvelope exists on the portions of the parcel that can physically support development and is further defined byland development regulations (e.g., parking requirements, allowable density or floor area ratios, buildingheights, setbacks, etc.). The local land use policy dictates what type of capacity is being calculated (e.g.,residential, commercial, mixed use, etc).
Because of the regional scale of the MPO’s land use model, it is not practical to analyze the specific landdevelopment regulations that apply to every single parcel throughout the area. Instead, the MPO assigns eachparcel into one of eight character area types (e.g., general urban, suburban, rural, town center, etc.) whichprovide generalized assumptions about the land development regulations that would apply to a set of parcelsthat are part of a relatively homogeneous area. The following figure presents the generalized land use policiesand land development regulations (or growth policy) that are used by the land use model.

NASHVILLE AREA MPO 2035 REGIONAL TRANSPORTATION PLAN ADOPTED DECEMBER 15, 2010 31
Figure 11. Land Use and Capacity Analysis
Step 3: Assess the Attractiveness of that Land to Future Development Up to this point, no effort has been made to account for the real world influences that determine to what extentthe real estate market will invest or not in future development. The third step in the land use modeling processinvolves developing a measure of suitability, or level of attractiveness, for each parcel to develop at some pointin the future. In taking this step, the MPO relied heavily on the input from real estate developers from acrossthe region to identify the attributes that must exist in order to make a property a worthwhile investment. Usingthat local expertise, the MPO assign a suitability score to each parcel based on its proximity to a long list ofassets or liabilities that make it more or less attractive for development.
Figure 12. Land Suitability Analysis

NASHVILLE AREA MPO 2035 REGIONAL TRANSPORTATION PLAN ADOPTED DECEMBER 15, 2010 32
Step 4: Allocate New Growth to Suitable LandThe last step in the land use modeling process is the allocation of future growth to vacant parcels. In this finalstep, the model first looks to allocate future growth to the more suitable parcels, but not to exceed any oneparcel’s available capacity for growth. Once a parcel has reached its full potential – as defined by its ownphysical features as well as local policy and regulation – the model removes the parcel from furtherconsideration.
The following figure presents the results of the 2035 land use model, compared with the observed landdevelopment pattern of 1965 and 2008.
Figure 13. Land Development Trends and Forecast, 1965 to 2035
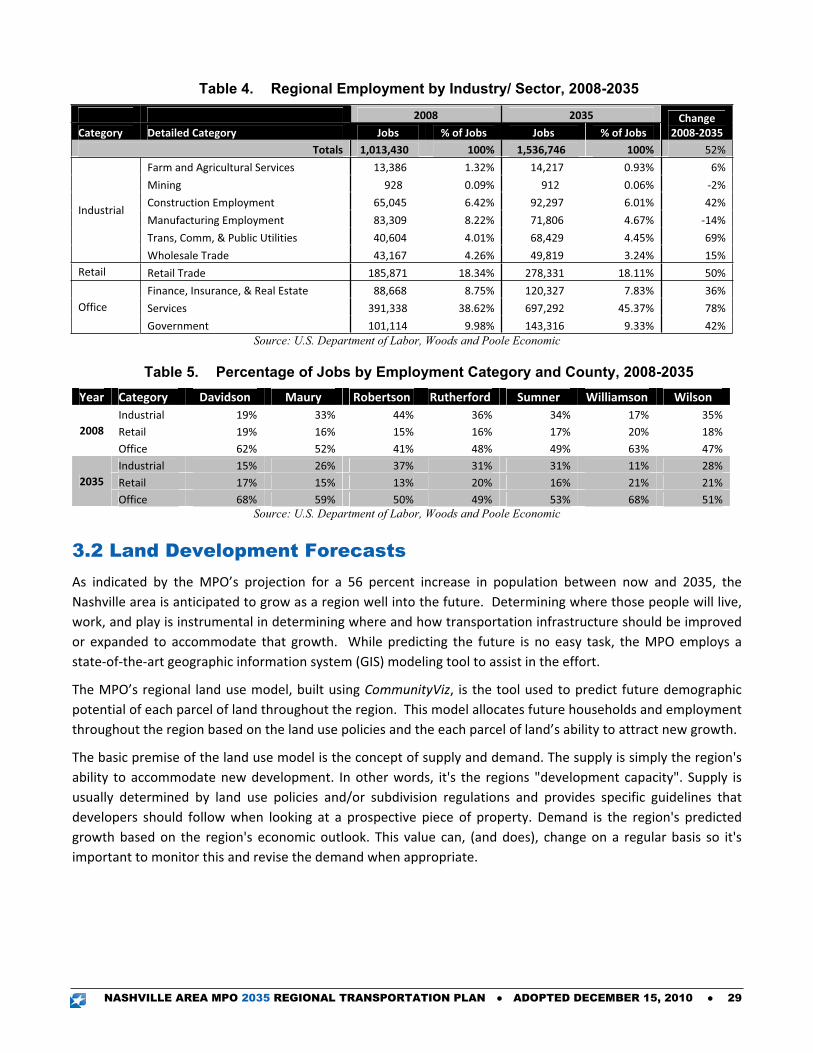
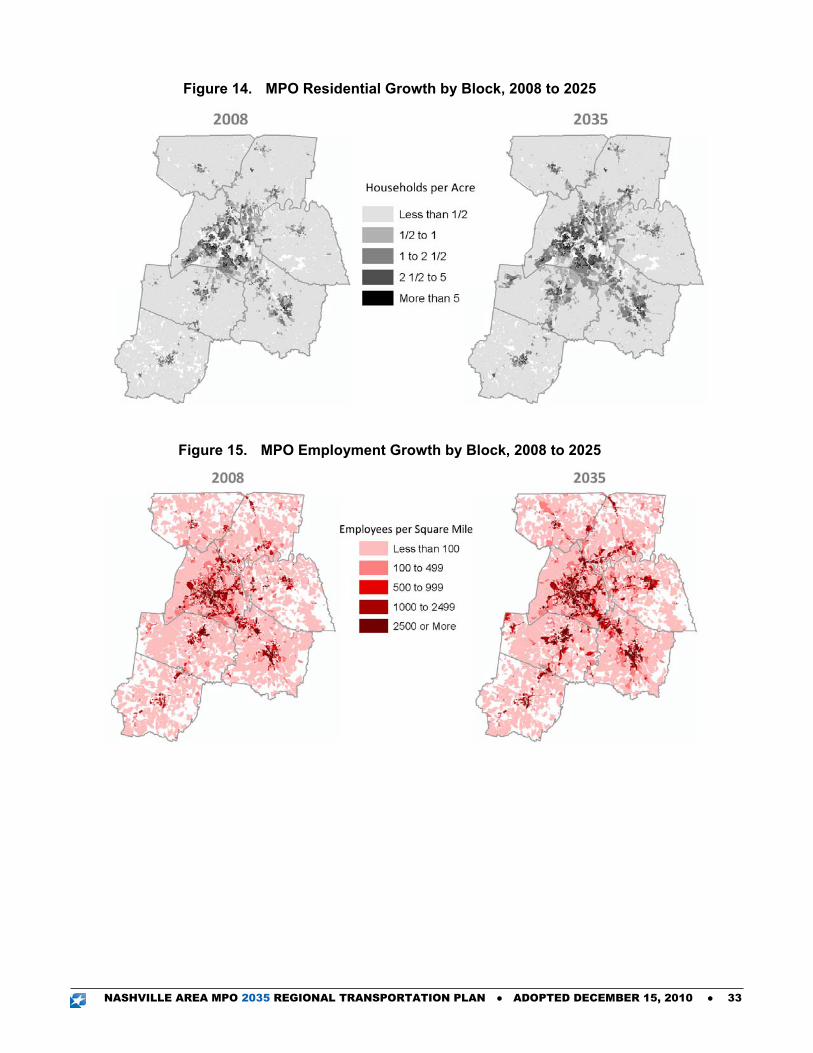
Distribution of People and Jobs With the land use modeling task complete, the MPO is able to complete its forecasts of future growth byidentifying where people will live in work in the future. The results of such analysis become the basis forpredicting future traffic congestion using the MPO's regional travel demand model.
The following figures present the resulting forecast for the distribution of people and jobs throughout the MPOarea, with a comparison made to the observed pattern of 2008.
NASHVILLE AREA MPO 2035 REGIONAL TRANSPORTATION PLAN ADOPTED DECEMBER 15, 2010 33
Figure 14. MPO Residential Growth by Block, 2008 to 2025
Figure 15. MPO Employment Growth by Block, 2008 to 2025


![Nashville Union and American. (Nashville, TN) 1861-04-13 [p ].](https://static.fdocuments.us/doc/165x107/624dc8cfb8ac3c699a0c6dbb/nashville-union-and-american-nashville-tn-1861-04-13-p-.jpg)