
3-D structured SnO2-polypyrrole nanotubes applied in Na ...
10
University of Wollongong University of Wollongong Research Online Research Online Australian Institute for Innovative Materials - Papers Australian Institute for Innovative Materials 2016 3-D structured SnO2-polypyrrole nanotubes applied in Na-ion batteries 3-D structured SnO2-polypyrrole nanotubes applied in Na-ion batteries Boyang Ruan University of Wollongong, [email protected] Haipeng Guo University of Wollongong, [email protected] Qiannan Liu University of Wollongong, [email protected] Dongqi Shi University of Wollongong, [email protected] Shulei Chou University of Wollongong, [email protected] See next page for additional authors Follow this and additional works at: https://ro.uow.edu.au/aiimpapers Part of the Engineering Commons, and the Physical Sciences and Mathematics Commons Recommended Citation Recommended Citation Ruan, Boyang; Guo, Haipeng; Liu, Qiannan; Shi, Dongqi; Chou, Shulei; Liu, Hua-Kun; Chen, Guohua; and Wang, Jiazhao, "3-D structured SnO2-polypyrrole nanotubes applied in Na-ion batteries" (2016). Australian Institute for Innovative Materials - Papers. 2269. https://ro.uow.edu.au/aiimpapers/2269 Research Online is the open access institutional repository for the University of Wollongong. For further information contact the UOW Library: [email protected]
Transcript of 3-D structured SnO2-polypyrrole nanotubes applied in Na ...

University of Wollongong University of Wollongong
Research Online Research Online
Australian Institute for Innovative Materials - Papers Australian Institute for Innovative Materials
2016
3-D structured SnO2-polypyrrole nanotubes applied in Na-ion batteries 3-D structured SnO2-polypyrrole nanotubes applied in Na-ion batteries
Boyang Ruan University of Wollongong, [email protected]
Haipeng Guo University of Wollongong, [email protected]
Qiannan Liu University of Wollongong, [email protected]
Dongqi Shi University of Wollongong, [email protected]
Shulei Chou University of Wollongong, [email protected]
See next page for additional authors
Follow this and additional works at: https://ro.uow.edu.au/aiimpapers
Part of the Engineering Commons, and the Physical Sciences and Mathematics Commons
Recommended Citation Recommended Citation Ruan, Boyang; Guo, Haipeng; Liu, Qiannan; Shi, Dongqi; Chou, Shulei; Liu, Hua-Kun; Chen, Guohua; and Wang, Jiazhao, "3-D structured SnO2-polypyrrole nanotubes applied in Na-ion batteries" (2016). Australian Institute for Innovative Materials - Papers. 2269. https://ro.uow.edu.au/aiimpapers/2269
Research Online is the open access institutional repository for the University of Wollongong. For further information contact the UOW Library: [email protected]

3-D structured SnO2-polypyrrole nanotubes applied in Na-ion batteries 3-D structured SnO2-polypyrrole nanotubes applied in Na-ion batteries
Abstract Abstract SnO2-coated polypyrrole (PPy) with a three-dimensional (3-D) structured nanotube network has been prepared via a facile hydrothermal method and tested as an anode material for Na-ion batteries. The crystalline SnO2 nanoparticles (less than 25 nm in size) are distributed uniformly on the surfaces of the PPy tubes. When it is used as an anode material for sodium-ion batteries (SIBs), the composite electrode can deliver a good reversible capacity of nearly 288 mA h g-1 when discharging at 100 mA g-1, with more than 69.1% capacity retention and stable coulombic efficiency of 99.6% after 150 cycles. The good electrochemical performance compared to the 151 mA h g-1 achieved by bare SnO2, which was fabricated by the same method in the absence of PPy, could be mainly attributed to the good dispersion of SnO2 on the 3-D matrix of PPy tubes, which facilitates the diffusion of Na+ ions and buffers the large volumetric changes during charge/discharge. Our results suggest that such SnO2/carbonaceous composites would be good anode candidates for SIBs.
Disciplines Disciplines Engineering | Physical Sciences and Mathematics
Publication Details Publication Details Ruan, B., Guo, H., Liu, Q., Shi, D., Chou, S., Liu, H., Chen, G. & Wang, J. (2016). 3-D structured SnO2-polypyrrole nanotubes applied in Na-ion batteries. RSC Advances: an international journal to further the chemical sciences, 6 (105), 103124-103131.
Authors Authors Boyang Ruan, Haipeng Guo, Qiannan Liu, Dongqi Shi, Shulei Chou, Hua-Kun Liu, Guohua Chen, and Jiazhao Wang
This journal article is available at Research Online: https://ro.uow.edu.au/aiimpapers/2269

Journal Name
ARTICLE
This journal is © The Royal Society of Chemistry 20xx J. Name., 2013, 00, 1-3 | 1
Please do not adjust margins
Please do not adjust margins
a. Institute for Superconducting and Electronic Materials(ISEM), AIIM Facility, Innovation Campus, University of Wollongong, Squires Way, North Wollongong, NSW 2500, Australia. E-mail: [email protected] (JZW)
Tel: +61 2 4298 1478; Fax: +61 2 4221 5731 b. Department of Chemical and Biomolecular Engineering, The Hong Kong University of Science and Technology, Clearwater Bay, Hong Kong, China
Received 00th January 20xx,
Accepted 00th January 20xx
DOI: 10.1039/x0xx00000x
www.rsc.org/
3-D structured SnO2-Polypyrrole Nanotubes
Applied in Na-ion Batteries
Boyang Ruan,
a Haipeng Guo,
a Qiannan Liu,
a Dongqi Shi,
a Shulei Chou,
a Huakun Liu,
a Guohua Chen
b and Jiazhao Wang*
a
SnO2-coated polypyrrole (PPy) with a three-dimensional (3-D) structured nanotube network has been prepared via a facile
hydrothermal method and tested as anode material for Na-ion batteries. The crystalline SnO2 nanoparticles (less than 25
nm in size) are distributed uniformly on the surfaces of the PPy tubes. When it is used as an anode material for sodium-ion
batteries (SIBs), the composite electrode can deliver a good reversible capacity of nearly 288 mAh g-1 when discharging at
100 mA g-1, with more than 69.1% capacity retention and stable coulombic efficiency of 99.6% after 150 cycles. The good
electrochemical performance compared to the 151 mAh g-1 achieved by bare SnO2 , which was fabricated by the same
method in the absence of PPy, could be mainly attributed to the good dispersion of SnO2 on the 3-D matrix of PPy tubes,
which facilitates the diffusion of Na+ ions and buffers the large volumetric changes during charge/discharge. Our results
suggest that such SnO2/carbonaceous composites would be good anode candidates for SIBs.
Introduction
Lithium-ion batteries (LIBs) have been receiving tremendous
attention as promising energy-storage and transformation
devices, and they are widely applied in portable electronic
devices, electric vehicles, hybrid electrical vehicles, etc. Now,
they are becoming indispensable energy storage devices for
application in the energy conversion of intermittent energy
sources, such as in solar cell arrays and wind power stations.
Considering these factors along with the limited reserves and
non-uniform distribution of lithium resources, the big
challenges for long-run and large-scale applications of lithium-
ion batteries related their availability and cost are becoming
more and more prominent. Based on the above issues, it is an
urgent necessity to develop new types of batteries. Over the
past several years, sodium-ion batteries (SIBs), which are
becoming known as future alternatives to lithium ion batteries,
have been attracting great attention,1, 2
mainly in view of the
abundance of sodium resources and their obvious cost-
effective advantages.3-9
As is well known, it is still a big
challenge to develop suitable anode materials for Na-ion
batteries because of the larger ionic radius of Na+ compared to
that of Li+, which causes greater volume changes during cycling
and lower gravimetric and volumetric energy densities. These
innate characteristics are directly limiting the feasibility of
insertion materials for SIBs, including some cathode and anode
materials. To bypass these deficiencies, many carbon-based
materials have been extensively investigated, such as hard
carbons, which can achieve reversible capacities from 200 to
290 mAh g-1
for more than 180 and 100 cycles, respectively.10,
11 Reduced graphene oxide, could achieve a reversible capacity
of 174.3 mAh g-1
over 250 cycles.12
N-doped carbon composite,
which showed a reversible capacity of 155.2 mAh g-1
after 260
cycles,13
retained a reversible capacity of 243 mAh g
-1 after
100 cycles,14
and achieved a specific capacity of 175 mAh g-1
after 2000 cycles etc.15
Some non-carbonaceous materials such
as metal oxide materials also have been studied for SIBs.
16-20
Among these materials, SnO2-based materials have attracted
more interest because SnO2 can deliver high specific capacities
by acting as an alloying material to store Na. It has been
demonstrated that SnO2 can be an attractive anode for SIBs,
with a capacity of 667 mA h g-1
, based on the following
reactions: 4SnO2 + 16Na+ + 16e
- 4Sn+8Na2O (1)
4Sn + 15Na+
+ 16e-
Na15Sn420
(2). Similarly, the main
disadvantages of SnO2 are the expansion and shrinkage of the
active material particles during Na insertion/extraction,
leading to particle pulverization/ exfoliation and rapidly
ARTICLE Journal Name
2 | J. Name., 2012, 00, 1-3 This journal is © The Royal Society of Chemistry 20xx
Please do not adjust margins
Please do not adjust margins
decreasing capacity in these materials.5, 20
On the other hand,
studies have shown that the diffusion speed of Na+ is 30 times
slower than that of Li+ in SnO2 particles.
21 Much research has
been carried out to solve this problem, such as by decreasing
the particle size of the active material to the nanoscale 22
and
loading some materials as buffer layers.20, 23-29
In recent years,
with the persistent efforts focused on exploring new anode
materials for sodium storage, some three-dimensional (3-D)
structured composites have been recognised to have sodium
storage capability. There are many reports of SnO2
nanoparticles loaded onto graphene,25
anchored on reduced
graphene oxide frameworks30
and confined in mesoporous
carbon.31
Polypyrrole (PPy), in particular consisting of tubes with a 3-D
structure, as a kind of conducting polymer, not only acts as an
electrically conducting agent, which is beneficial for reducing
resistance and enhancing the rate capability of the cell, but
also as a matrix or binder, which can provide efficient
transport pathways for electrons and mitigate the
pulverization of the electrode brought about by the huge
volume expansion during the charging/discharging process.
This unique hierarchical structure not only provides good
structural robustness and short ion/electron diffusion
pathways, but also promotes the diffusion of the electrolyte
into the inner spaces of the material, as well as providing
sufficient open channels for fast Na+
migration.There are many
reports on using PPy as a matrix to synthesize SnO2 based
composites 32-36
for anode materials. Recently, Du and Wang
reported the synthesis of SnO2@polypyrrole nanotubes with
microwave-assisted method.37
The
pyrolyzed composite
displayed very excellent capability for Li-storage as the PPy NTs
can accommodate large volume change of the electrode
material during Li+ insertion/extraction, which prevented SnO2
nanoparticles from pulverizing and electrical isolating during
cycling. Combining PPy tubes with SnO2 nanoparticles to
fabricate SnO2-based anode material in SIBs has not been
explored, however. In term of the above advantages, we also
adopted PPy as the substrate material and anchored the active
SnO2 nanoparticles on its’ surface.
Herein, we report the in situ hydrothermal synthesis of SnO2-
PPy nanotubes with a 3-D structure. In the composites, SnO2
nanoparticles are homogeneously distributed on the surfaces
of the PPy nanotubes. This unique hierarchical structure not
only provides good structural robustness and short
ion/electron diffusion pathways, but also has benefits for
electrolyte penetration and Na+ transport. The obtained 3-D
structured SnO2-PPy nanotube network showed a good
reversible capacity of nearly 288 mA h g-1
when discharging at
100 mA g-1
, with more than 69.1 % capacity retention and
stable Coulombic efficiency of 99.6 % over 150 cycles. Good
rate capability is observed, based on current rate variation
during cycling from 50 mA g-1
to 1 A g-1
.
Experimental Section
Synthesis of PPy tubes
The PPy tubes were synthesized according to a previous report 38
with some modifications. The process of synthesis was as follows: 1.95 g of FeCl3 was added to 150 mL a solution containing 98 mg methyl orange (MO) in deionized water under constant stirring. A flocculent precipitate appeared immediately. Then, 0.484 g (0.5 ml) of pyrrole monomer was added into the mixture and the mixture was continuously stirred for 24 hours at room temperature. After that, the thus-formed PPy precipitate was washed several times with deionized water/ ethanol, until the filtrate was colourless and neutral. Finally, the precipitate was dried under vacuum at 60 °C for 24 h.
Preparation of the SnO2@PPy nanocomposites
In a typical procedure, 0.035 g hexamethylenetetramine
(HMTA) and 0.02 g urea were dissolved in 30 ml ethanol, and
then 0.1 g PPy was dispersed into the foregoing solution by
ultrasonic treatment for 0.5 h. 0.1g of SnCl2.2H2O was added
to the preceding mixture and stirred in for 30 minutes.
Subsequently, the resulting blend was transferred into a
Teflon-lined autoclave and heated up to 120 °C for 10 h. When
the precipitates were cooled down to room temperature
naturally, then washed it with distilled water and ethanol for
several times. Drying the precipitates in a vacuum oven
overnight at 60 °C, the final product (denoted as SnO2-PPy-1)
was obtained. SnO2-PPy-2 was obtained by adjusting the
weight of SnCl2.2H2O to 0.15 g. For comparison, pure SnO2
nanoparticles were prepared with the same conditions without
the addition of PPy.
Materials Characterization
The powder X-ray diffraction (XRD; GBC MMA diffractometer) equipped with Cu Kα radiation at a scan rate of 2° min
-1 was
used to identify the structures of the as-prepared SnO2-PPy composites and the precursors. The weight ratio between SnO2 and PPy was determined by thermogravimetric analysis (TGA) using a Mettler Toledo TGA/DSC1 between 40 °C and 800 °C at a heating rate of 5 °C min-1 in air. The valence state of Sn was evaluated by X-ray photoelectron spectroscopy (XPS) using a SPECS PHOIBOS 100 Analyzer equipped with a high-vacuum chamber with base pressure below 10
-8 mbar, with
the X-ray excitation generated by Al Kα radiation at the high voltage of 12 kV and power of 120 W. The data were analyzed with the Casa XPS 2.3.15 software package. All the spectra were calibrated by C1s = 284.6 eV. Field emission scanning electron microscopy (FESEM; JEOL JSM-7500FA) and high resolution transmission electron microscopy (HRTEM; JEOL JSM-2010) were used to investigate the morphology of the samples.
Electrochemical Measurements

Journal Name ARTICLE
This journal is © The Royal Society of Chemistry 20xx J. Name., 2013, 00, 1-3 | 3
Please do not adjust margins
Please do not adjust margins
The electrochemical performance testing was carried out via 2032-type coin cells. The working electrode was prepared by preparing a slurry in the mass ratio of 80 wt % active material, 10 wt % Super-P (carbon black) and 10 wt % carboxymethyl cellulose (CMC) binder, and coating it on copper foil substrate. Then the electrode film was dried in a vacuum oven at 80 °C overnight. An electrolyte with 1.0 mol L
-1 NaClO4 in an
ethylene carbonate (EC) – diethyl carbonate (DEC) solution (1:1 v/v), with 5 wt % addition of fluoroethylene carbonate (FEC), was used in this work. All the cells were assembled in a glove box filled with argon gas and measured at room temperature. Galvanostatic charge–discharge testing was carried out on a Land Test System with a cut-off voltage range from 0.01 to 1.5 V (vs. Na/Na
+) at different current densities.
The capacities are calculated based on the weight of the composites. Cyclic voltammetry and electrochemical impedance measurements were conducted using a Biologic VMP-3 electrochemical workstation from 0.005 V to 2.5 V (vs. Na/Na
+) at a scan rate of 0.1 mV s
-1.
Results and Discussion
The XRD patterns of the PPy, SnO2 particles, and the SnO2-PPy-
1 and SnO2-PPy-2 composites are displayed in Fig. 1a. The PPy
spectrum reveals a clear broad peak at about 23.8°
corresponding to its’ amorphous nature, which is due to the
scattering from PPy chains at the interplanar spacing.39-41
The
XRD pattern of the SnO2 nanoparticles was characterized by
several peaks which could be ascribed to the tetragonal SnO2
structure (cassiterite, PDF no. 01-0625) without any impurity.
These large peaks clearly demonstrated the formation of small
SnO2 particles with a nanocrystalline nature. From the XRD
patterns of the obtained SnO2-PPy-1 and SnO2-PPy-2
composites, we find very similar broad peaks that could also
be indexed to the tetragonal SnO2 structure (cassiterite, PDF
no. 01-0625). No other characteristic peaks can be seen,
suggesting that the SnO2 nanoparticles have covered the
surfaces of the PPy.
For quantifying the amount of PPy in the SnO2-PPy composites,
thermogravimetric analysis (TGA) measurements were carried
out in air. The TGA curves of pure PPy and its composites are
shown in Fig. 1b. It can also be seen that both pure PPy and its
composites show weight loss in the temperature range of 250–
650 C, which is in accordance with the oxidation of PPy,
although the temperatures at which weight loss ends in the
three samples have some differences. For pure PPy and SnO2-
PPy-1, there was no difference. SnO2-PPy-2 required a higher
temperature to oxidize PPy compared to pure PPy. This
phenomenon could be the result of the greater amount of
SnO2 loaded onto the PPy, which delayed the PPy oxidation
process. After the initial oxidation of PPy, no further weight
change was observed in the composites. Therefore, the weight
change due to the oxidation of PPy can be directly converted
into the amount of PPy in the SnO2-PPy composites. Using this
approach, we calculated that the amounts of PPy in the SnO2-
PPy-1 and SnO2-PPy-2 composites were 61.4 wt% and, 38.4
wt%, respectively.
The Fourier transform infrared (FTIR) spectra of bare SnO2,
PPy, SnO2-PPy-1, and SnO2-PPy-2 are shown in Fig. 1c. In the
spectrum for SnO2, a strong vibration around 609 cm−1
is
observed in the low wave number range, which is indexed to
the antisymmetric Sn–O–Sn mode of tin oxide. In the spectrum
for PPy, the band centered at 1560 cm−1
corresponds to typical
C=C in plane vibration, while the characteristic bands at 1300
and 1205 cm−1
are connected with C–C and C–H ring
stretching, respectively. The sharp peak at 1052 cm−1
is
ascribed to C–H in-plane vibrations. The band at 929 cm−1
can
be attributed to N–H in-plane vibrations.42
In the spectra of
Figure 1 XRD patterns (a), TGA curves (b) and FTIR spectra (c)
of PPy, bare SnO2 and SnO2-PPy composite.
ARTICLE Journal Name
4 | J. Name., 2012, 00, 1-3 This journal is © The Royal Society of Chemistry 20xx
Please do not adjust margins
Please do not adjust margins
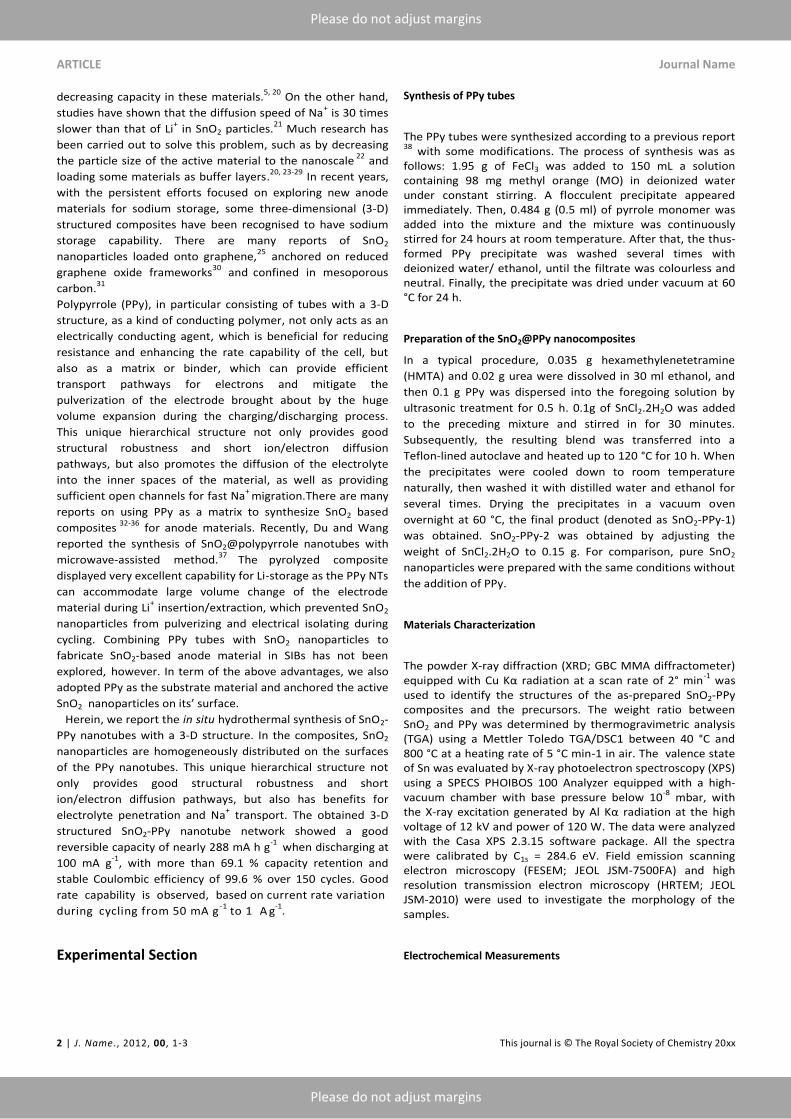
Figure 2 XPS spectra: survey spectrum (a) for SnO2-PPy-2 ( PPy
38.4%) composite, and high resolution spectra of Sn3d (b) for
bare SnO2 and SnO2-PPy-2 composite, and C1s (c) for PPy and
SnO2-PPy-2 (PPy 38.4%) composite.
SnO2-PPy-1 and SnO2-PPy-2, all the characteristic bonds for
both SnO2 and PPy can be clearly observed. Therefore, the
FTIR results confirm the presence of both PPy and SnO2 in the
SnO2-PPy nanocomposites.
To investigate the interaction between the PPy, SnO2 and
SnO2-PPy-2, X-ray photoelectron spectroscopy (XPS) was used
to detect the chemical states of elements. Peaks for C, Sn, and
O in SnO2-PPy-2 were founded in the XPS survey spectrum, as
shown in Fig. 2a. The Sn 3d XPS spectra of SnO2 and SnO2-PPy-2
were collected to investigate the changes in the chemical state
of tin before and after the hydrothermal reaction. In Fig. 2b,
for both materials, there are two peaks, and the binding
energy interval between them is 8 eV, which is consistent with
the energy splitting of Sn or SnO2.43
For bare SnO2, the peaks
found at 497.7 eV and 505.7 eV correspond to the 3d5/2 and
3d3/2 curves of Sn (IV) in SnOx.44, 45
When SnO2 is coated with
PPy, Sn3d peaks are shifted towards lower binding energies,
i.e., 486.9 eV and 494.9 eV. These differences in the peak
locations are obviously induced by the presence of PPy, which
is conductive, while the bare SnO2 nanoparticles behave as an
insulator in term of the XPS results.31
In the C1s spectra for bare
SnO2 and SnO2-PPy-2, there is no obvious peak change, which
means the absence of C-Sn bonds. This result indicates that no
chemical reaction occurred during the preparation and that
the composit structure is held together by van der Waals
forces.
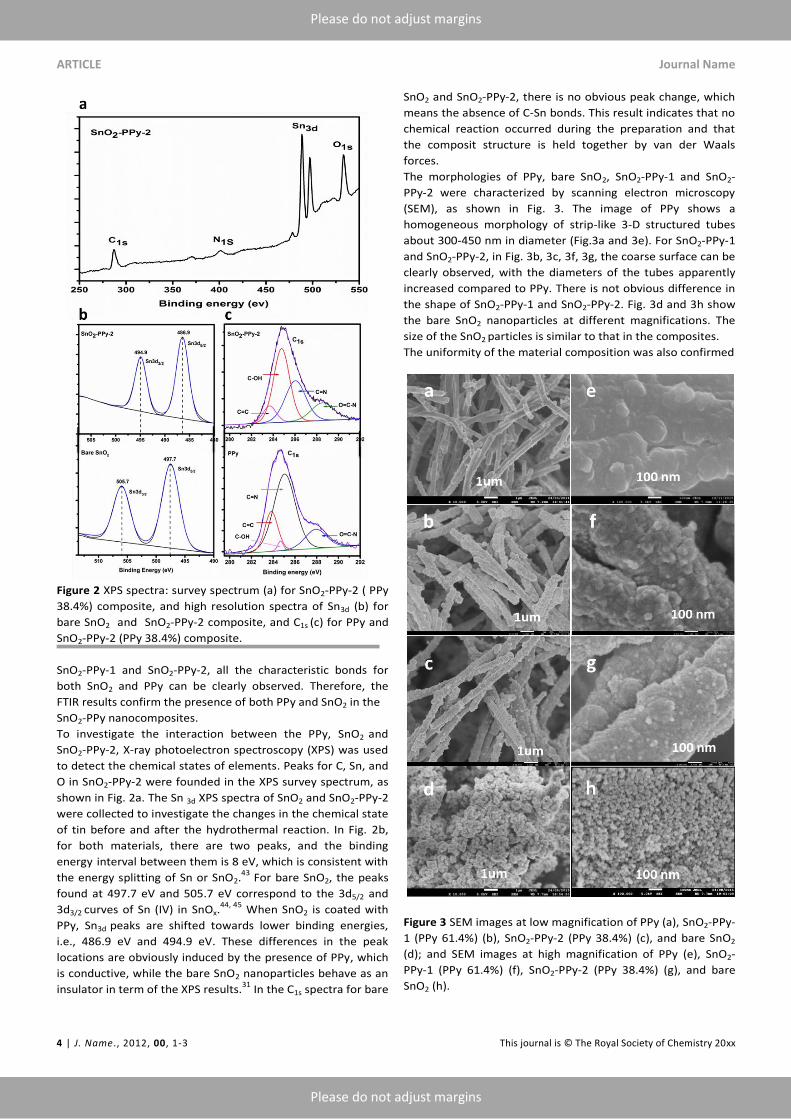
The morphologies of PPy, bare SnO2, SnO2-PPy-1 and SnO2-
PPy-2 were characterized by scanning electron microscopy
(SEM), as shown in Fig. 3. The image of PPy shows a
homogeneous morphology of strip-like 3-D structured tubes
about 300-450 nm in diameter (Fig.3a and 3e). For SnO2-PPy-1
and SnO2-PPy-2, in Fig. 3b, 3c, 3f, 3g, the coarse surface can be
clearly observed, with the diameters of the tubes apparently
increased compared to PPy. There is not obvious difference in
the shape of SnO2-PPy-1 and SnO2-PPy-2. Fig. 3d and 3h show
the bare SnO2 nanoparticles at different magnifications. The
size of the SnO2 particles is similar to that in the composites.
The uniformity of the material composition was also confirmed
Figure 3 SEM images at low magnification of PPy (a), SnO2-PPy-
1 (PPy 61.4%) (b), SnO2-PPy-2 (PPy 38.4%) (c), and bare SnO2
(d); and SEM images at high magnification of PPy (e), SnO2-
PPy-1 (PPy 61.4%) (f), SnO2-PPy-2 (PPy 38.4%) (g), and bare
SnO2 (h).
Journal Name ARTICLE
This journal is © The Royal Society of Chemistry 20xx J. Name., 2013, 00, 1-3 | 5
Please do not adjust margins
Please do not adjust margins
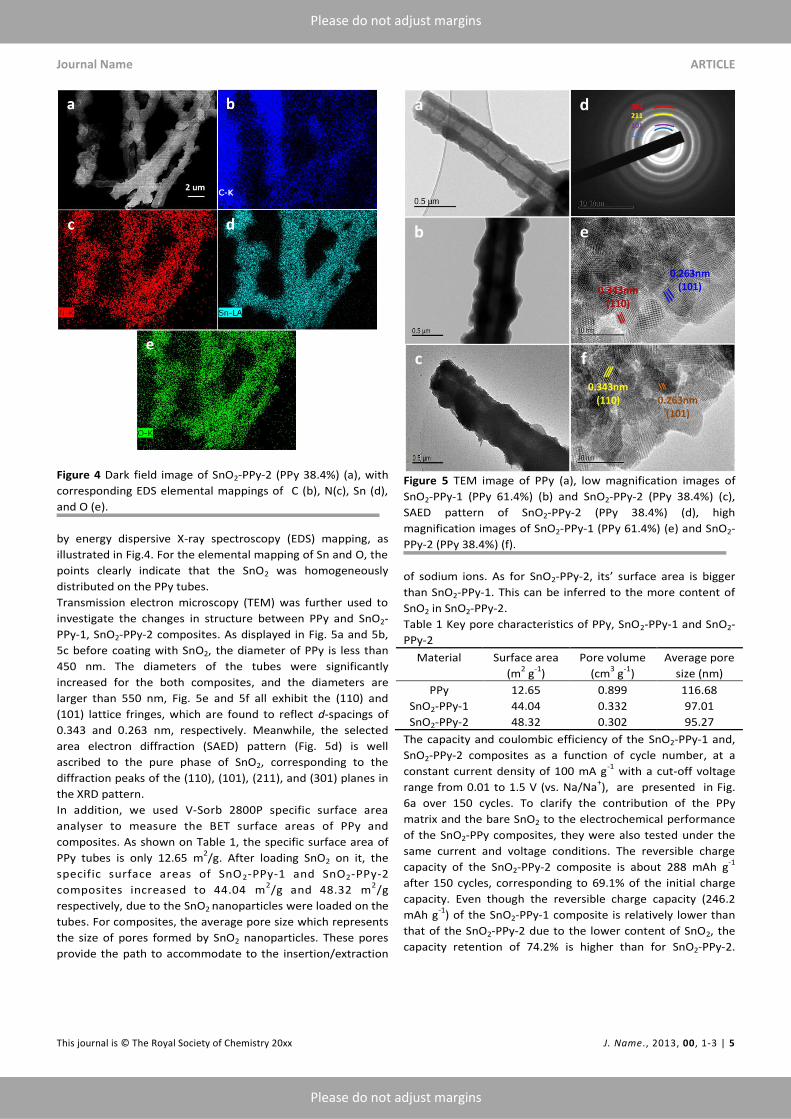
Figure 4 Dark field image of SnO2-PPy-2 (PPy 38.4%) (a), with
corresponding EDS elemental mappings of C (b), N(c), Sn (d),
and O (e).
by energy dispersive X-ray spectroscopy (EDS) mapping, as
illustrated in Fig.4. For the elemental mapping of Sn and O, the
points clearly indicate that the SnO2 was homogeneously
distributed on the PPy tubes.
Transmission electron microscopy (TEM) was further used to
investigate the changes in structure between PPy and SnO2-
PPy-1, SnO2-PPy-2 composites. As displayed in Fig. 5a and 5b,
5c before coating with SnO2, the diameter of PPy is less than
450 nm. The diameters of the tubes were significantly
increased for the both composites, and the diameters are
larger than 550 nm, Fig. 5e and 5f all exhibit the (110) and
(101) lattice fringes, which are found to reflect d-spacings of
0.343 and 0.263 nm, respectively. Meanwhile, the selected
area electron diffraction (SAED) pattern (Fig. 5d) is well
ascribed to the pure phase of SnO2, corresponding to the
diffraction peaks of the (110), (101), (211), and (301) planes in
the XRD pattern.
In addition, we used V-Sorb 2800P specific surface area
analyser to measure the BET surface areas of PPy and
composites. As shown on Table 1, the specific surface area of
PPy tubes is only 12.65 m2/g. After loading SnO2 on it, the
specific surface areas of SnO2-PPy-1 and SnO2-PPy-2
composites increased to 44.04 m2/g and 48.32 m
2/g
respectively, due to the SnO2 nanoparticles were loaded on the
tubes. For composites, the average pore size which represents
the size of pores formed by SnO2 nanoparticles. These pores
provide the path to accommodate to the insertion/extraction
Figure 5 TEM image of PPy (a), low magnification images of
SnO2-PPy-1 (PPy 61.4%) (b) and SnO2-PPy-2 (PPy 38.4%) (c),
SAED pattern of SnO2-PPy-2 (PPy 38.4%) (d), high
magnification images of SnO2-PPy-1 (PPy 61.4%) (e) and SnO2-
PPy-2 (PPy 38.4%) (f).
of sodium ions. As for SnO2-PPy-2, its’ surface area is bigger
than SnO2-PPy-1. This can be inferred to the more content of
SnO2 in SnO2-PPy-2.
Table 1 Key pore characteristics of PPy, SnO2-PPy-1 and SnO2-
PPy-2
Material
Surface area
(m2 g
-1)
Pore volume
(cm3 g
-1)
Average pore
size (nm)
PPy 12.65 0.899 116.68
SnO2-PPy-1 44.04 0.332 97.01
SnO2-PPy-2 48.32 0.302 95.27
The capacity and coulombic efficiency of the SnO2-PPy-1 and,
SnO2-PPy-2 composites as a function of cycle number, at a
constant current density of 100 mA g-1
with a cut-off voltage
range from 0.01 to 1.5 V (vs. Na/Na+), are presented in Fig.
6a over 150 cycles. To clarify the contribution of the PPy
matrix and the bare SnO2 to the electrochemical performance
of the SnO2-PPy composites, they were also tested under the
same current and voltage conditions. The reversible charge
capacity of the SnO2-PPy-2 composite is about 288 mAh g-1
after 150 cycles, corresponding to 69.1% of the initial charge
capacity. Even though the reversible charge capacity (246.2
mAh g-1
) of the SnO2-PPy-1 composite is relatively lower than
that of the SnO2-PPy-2 due to the lower content of SnO2, the
capacity retention of 74.2% is higher than for SnO2-PPy-2.

ARTICLE Journal Name
6 | J. Name., 2012, 00, 1-3 This journal is © The Royal Society of Chemistry 20xx
Please do not adjust margins
Please do not adjust margins
Figure 6 Cycling performances (a) of SnO2-PPy-1 (PPy 61.4%),
SnO2-PPy-2 (PPy 38.4%), bare PPy, and SnO2. Rate capability
(b) of SnO2-PPy-1 (PPy 61.4%), SnO2-PPy-2 (PPy 38.4%) and
bare SnO2. Charge-discharge profiles for the first 3 cycles of
SnO2-PPy-2 (PPy 38.4%) (c) and bare SnO2 (d). Cyclic
voltammetry curves for the first 4 cycles of SnO2-PPy-2 (PPy
38.4%) (e). Nyquist plots and equivalent circuit model (inset) of
SnO2-PPy-2 (PPy 38.4%) and bare SnO2 (f) for the fresh
electrodes and after 100 cycles.
This indicates that a smaller amount of SnO2 nanoparticles can
decrease the agglomeration of bare SnO2. The reversible
charge capacity is much lower than that of SnO2-PPy-2,
however, and the capacity fading is apparent. The contribution
of PPy to the capacity of the SnO2-PPy composites can be
neglected.
The coulombic efficiency for both SnO2-PPy-1 and SnO2-PPy-2
is near 100%, beginning from the second cycle, indicating that
electrons/Na ions are no longer trapped in secondary parasitic
reactions that can be introduced by further electrolyte
degradation. The stable electrochemical performance of the
SnO2-PPy composite and the enhanced capacity benefit from
the synergetic effects generated by SnO2 particles on the PPy
framework.31
This promotes greater conductivity of the SnO2
particles in the case of SnO2-PPy than in the case of nano-SnO2,
as suggested by the XPS results (Fig. 2b).
In addition, the charge/discharge rate capability of the SnO2,
SnO2-PPy-1 and SnO2-PPy-2 composites were investigated at
increasing current rates by progressively increasing the current
rate from 50 mA g-1
up to 1 A g-1
and finally returning it to 100
mA g-1
, in order to test the robustness of the samples. Fig.6b
shows the cycling performances of the samples under these
different current rate conditions. In the case of SnO2-PPy-2,
the reversible charge capacity of the composite decreases
from 428.7 (50 mA g-1
), to 400.2 (0.1A g-1
), 354.2 (0.2 A g-1
),
290.1 (0.4 A g-1
), 260.2 (0.8 A g-1
), and 160.3 mAh g-1
(1 A g-1
),
respectively, and the composite was found to successfully
return to 398.9 mAh g-1
(recovering 99.7 % of its initial
capacity) after 60 cycles when the current density was
returned to 0.1 A g-1
. The rate capability of SnO2-PPy-1 shows
lower reversible charge capacity compared to SnO2-PPy-2.
This result is in line with their cycling performances. As for the
bare SnO2, we can find this trend that with the increasing of
current density, the capacity degraded more severely
compared to both composites. Fig. 6c and 6d show the
discharge–charge voltage profiles of the initial three cycles for
SnO2-PPy-2 and bare SnO2. The 1st
cycle discharge and 2nd
cycle
charge capacities of SnO2-PPy-2 composite electrode are
1040.6 and 416.6 mAh g-1
, respectively, giving an initial
coulombic efficiency of 40%. This is due to the formation of an
irreversible solid electrolyte interphase (SEI) layer on the
electrode surface and irreversible Na insertion into the active
materials. The initial discharge–charge voltage profiles for bare
SnO2 display the 1st
cycle discharge capacity of 1217.3 mAh g-
1and the 2
nd cycle charge capacity of 300.2 mAh g
-1, giving a
much lower initial coulombic efficiency of 24.7 %.
The electrochemical reactions of the SnO2-PPy-2
nanocomposite were studied by cyclic voltammetry (CV). As
shown in Fig. 6e, there is an irreversible transformation of
SnO2 into Sn in the initial discharge process. Weak and
irreversible shoulder peaks are seen at 1.4 and 0.6 V in the first
negative scan. These peaks are attributed to some irreversible
decomposition of the electrolyte, which forms a (SEI) film on
the surface of the SnO2-PPy-2 composite, and to irreversible
reactions between Na+ and the active materials. Two reductive
peaks are observed at 0.28 and 0.02 V in the following cycles
with different intensities, which are in accordance with the
transformation of Sn into NaxSn alloys. In conformity with the
Na–Sn binary alloy phase diagrams and previous reports, 20, 46
α-NaSn, Na9Sn4, Na3Sn, and Na15Sn4 are the main stable
phases. It can be inferred that the reductive peak located at
0.28 V is related to the formation of a two-phase alloy of α-
NaSn and Na9Sn4. Another reductive peak positioned at
around 0.02 V is considered to be due to the formation of
single phase Na3Sn and Na15Sn4. In the reverse positive scan,
two oxidative peaks are obviously observed at approximately
0.28 V and 0.5 V, which indicates that the phase transitions
during the de-alloying process had become clear. A hump that
appeared at 0.28 V can be mainly assigned to the de-alloying
reactions of Na3Sn, and Na15Sn4. The peak at 0.5 V is due to the
Na9Sn4 de-alloying reactions.47
To verify the effects of PPy towards improving the cyclability of
SnO2-PPy-2 electrode, which had better electronic conductivity
compared to the bare SnO2 electrode. Electrochemical
impedance spectroscopy (EIS) measurement was carried out.
The Nyquist plots and the fitting model using an equivalent
circuit are depicted in Fig. 6(f), with the equivalent circuit as
Journal Name ARTICLE
This journal is © The Royal Society of Chemistry 20xx J. Name., 2013, 00, 1-3 | 7
Please do not adjust margins
Please do not adjust margins
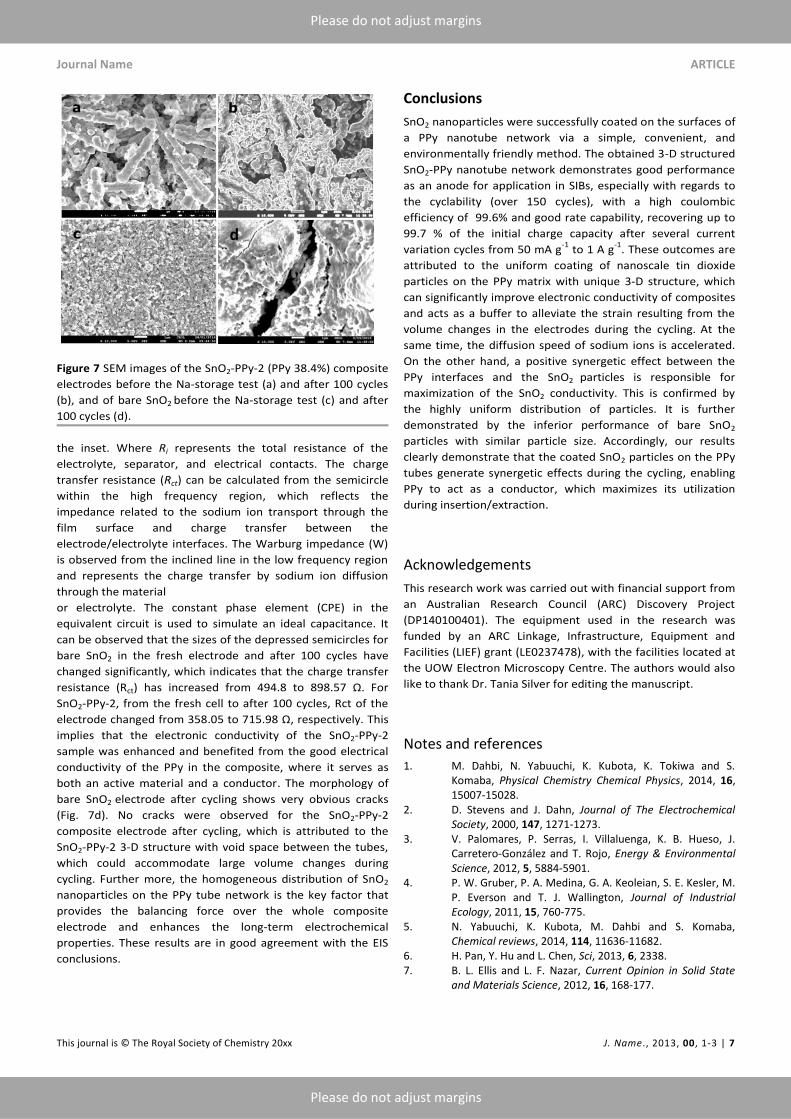
Figure 7 SEM images of the SnO2-PPy-2 (PPy 38.4%) composite
electrodes before the Na-storage test (a) and after 100 cycles
(b), and of bare SnO2 before the Na-storage test (c) and after
100 cycles (d).
the inset. Where Ri represents the total resistance of the
electrolyte, separator, and electrical contacts. The charge
transfer resistance (Rct) can be calculated from the semicircle
within the high frequency region, which reflects the
impedance related to the sodium ion transport through the
film surface and charge transfer between the
electrode/electrolyte interfaces. The Warburg impedance (W)
is observed from the inclined line in the low frequency region
and represents the charge transfer by sodium ion diffusion
through the material
or electrolyte. The constant phase element (CPE) in the
equivalent circuit is used to simulate an ideal capacitance. It
can be observed that the sizes of the depressed semicircles for
bare SnO2 in the fresh electrode and after 100 cycles have
changed significantly, which indicates that the charge transfer
resistance (Rct) has increased from 494.8 to 898.57 Ω. For
SnO2-PPy-2, from the fresh cell to after 100 cycles, Rct of the
electrode changed from 358.05 to 715.98 Ω, respectively. This
implies that the electronic conductivity of the SnO2-PPy-2
sample was enhanced and benefited from the good electrical
conductivity of the PPy in the composite, where it serves as
both an active material and a conductor. The morphology of
bare SnO2 electrode after cycling shows very obvious cracks
(Fig. 7d). No cracks were observed for the SnO2-PPy-2
composite electrode after cycling, which is attributed to the
SnO2-PPy-2 3-D structure with void space between the tubes,
which could accommodate large volume changes during
cycling. Further more, the homogeneous distribution of SnO2
nanoparticles on the PPy tube network is the key factor that
provides the balancing force over the whole composite
electrode and enhances the long-term electrochemical
properties. These results are in good agreement with the EIS
conclusions.
Conclusions
SnO2 nanoparticles were successfully coated on the surfaces of
a PPy nanotube network via a simple, convenient, and
environmentally friendly method. The obtained 3-D structured
SnO2-PPy nanotube network demonstrates good performance
as an anode for application in SIBs, especially with regards to
the cyclability (over 150 cycles), with a high coulombic
efficiency of 99.6% and good rate capability, recovering up to
99.7 % of the initial charge capacity after several current
variation cycles from 50 mA g-1
to 1 A g-1
. These outcomes are
attributed to the uniform coating of nanoscale tin dioxide
particles on the PPy matrix with unique 3-D structure, which
can significantly improve electronic conductivity of composites
and acts as a buffer to alleviate the strain resulting from the
volume changes in the electrodes during the cycling. At the
same time, the diffusion speed of sodium ions is accelerated.
On the other hand, a positive synergetic effect between the
PPy interfaces and the SnO2 particles is responsible for
maximization of the SnO2 conductivity. This is confirmed by
the highly uniform distribution of particles. It is further
demonstrated by the inferior performance of bare SnO2
particles with similar particle size. Accordingly, our results
clearly demonstrate that the coated SnO2 particles on the PPy
tubes generate synergetic effects during the cycling, enabling
PPy to act as a conductor, which maximizes its utilization
during insertion/extraction.
Acknowledgements
This research work was carried out with financial support from
an Australian Research Council (ARC) Discovery Project
(DP140100401). The equipment used in the research was
funded by an ARC Linkage, Infrastructure, Equipment and
Facilities (LIEF) grant (LE0237478), with the facilities located at
the UOW Electron Microscopy Centre. The authors would also
like to thank Dr. Tania Silver for editing the manuscript.
Notes and references
1. M. Dahbi, N. Yabuuchi, K. Kubota, K. Tokiwa and S. Komaba, Physical Chemistry Chemical Physics, 2014, 16, 15007-15028.
2. D. Stevens and J. Dahn, Journal of The Electrochemical Society, 2000, 147, 1271-1273.
3. V. Palomares, P. Serras, I. Villaluenga, K. B. Hueso, J. Carretero-González and T. Rojo, Energy & Environmental Science, 2012, 5, 5884-5901.
4. P. W. Gruber, P. A. Medina, G. A. Keoleian, S. E. Kesler, M. P. Everson and T. J. Wallington, Journal of Industrial Ecology, 2011, 15, 760-775.
5. N. Yabuuchi, K. Kubota, M. Dahbi and S. Komaba, Chemical reviews, 2014, 114, 11636-11682.
6. H. Pan, Y. Hu and L. Chen, Sci, 2013, 6, 2338. 7. B. L. Ellis and L. F. Nazar, Current Opinion in Solid State
and Materials Science, 2012, 16, 168-177.
ARTICLE Journal Name
8 | J. Name., 2012, 00, 1-3 This journal is © The Royal Society of Chemistry 20xx
Please do not adjust margins
Please do not adjust margins
8. V. Palomares, M. Casas-Cabanas, E. Castillo-Martínez, M. H. Han and T. Rojo, Energy & Environmental Science, 2013, 6, 2312-2337.
9. S. Y. Hong, Y. Kim, Y. Park, A. Choi, N.-S. Choi and K. T. Lee, Energy & Environmental Science, 2013, 6, 2067-2081.
10. A. Ponrouch, E. Marchante, M. Courty, J.-M. Tarascon and M. R. Palacin, Energy & Environmental Science, 2012, 5, 8572-8583.
11. Y.-M. Li, S.-Y. Xu, X.-Y. Wu, J.-Z. Yu, Y.-S. Wang, Y.-S. Hu, H. Li, L.-Q. Chen and X.-J. Huang, M, J. Mater. Chem. A, 2015, 3, 71-77.
12. Y.-X. Wang, S.-L. Chou, H.-K. Liu and S.-X. Dou, Carbon, 2013, 57, 202-208.
13. H. g. Wang, Z. Wu, F. l. Meng, D. l. Ma, X. l. Huang, L. m. Wang and X. b. Zhang, ChemSusChem, 2013, 6, 56-60.
14. L. Fu, K. Tang, K. Song, P. A. van Aken, Y. Yu and J. Maier, Nanoscale, 2014, 6, 1384-1389.
15. J. M. Fan, J. J. Chen, Q. Zhang, B. B. Chen, J. Zang, M. S. Zheng and Q. F. Dong, ChemSusChem, 2015, 8, 1856-1861.
16. P. Senguttuvan, G. Rousse, V. Seznec, J.-M. Tarascon and M. R. Palacin, Chemistry of Materials, 2011, 23, 4109-4111.
17. R. Alcántara, M. Jaraba, P. Lavela and J. Tirado, Chemistry of Materials, 2002, 14, 2847-2848.
18. Q. Sun, Q.-Q. Ren, H. Li and Z.-W. Fu, Electrochemistry Communications, 2011, 13, 1462-1464.
19. H. Xiong, M. D. Slater, M. Balasubramanian, C. S. Johnson and T. Rajh, The journal of physical chemistry letters, 2011, 2, 2560-2565.
20. L. Xiao, Y. Cao, J. Xiao, W. Wang, L. Kovarik, Z. Nie and J. Liu, Chemical Communications, 2012, 48, 3321-3323.
21. M. Gu, A. Kushima, Y. Shao, J.-G. Zhang, J. Liu, N. D. Browning, J. Li and C. Wang, Nano letters, 2013, 13, 5203-5211.
22. D. Su, C. Wang, H. Ahn and G. Wang, Physical Chemistry Chemical Physics, 2013, 15, 12543-12550.
23. X. Meng, Y. Zhong, Y. Sun, M. N. Banis, R. Li and X. Sun, Carbon, 2011, 49, 1133-1144.
24. Y. Wang, D. Su, C. Wang and G. Wang, Electrochemistry Communications, 2013, 29, 8-11.
25. D. Su, H.-J. Ahn and G. Wang, Chemical Communications, 2013, 49, 3131-3133.
26. Y. Zhang, J. Xie, S. Zhang, P. Zhu, G. Cao and X. Zhao, Electrochimica Acta, 2015, 151, 8-15.
27. R. S. Kalubarme, J.-Y. Lee and C.-J. Park, ACS applied materials & interfaces, 2015, 7, 17226-17237.
28. M. Dirican, Y. Lu, Y. Ge, O. Yildiz and X. Zhang, ACS Applied Materials & Interfaces, 2015, 7, 18387-18396.
29. L. Pei, Q. Jin, Z. Zhu, Q. Zhao, J. Liang and J. Chen, Nano Research, 2015, 8, 184-192.
30. Y.-X. Wang, Y.-G. Lim, M.-S. Park, S. Chou, J. H. Kim, H. Liu, S.-X. Dou and Y.-J. Kim, M, J. Mater. Chem. A, 2014, 2, 529-534.
31. A. Jahel, C. M. Ghimbeu, A. Darwiche, L. Vidal, S. Hajjar-Garreau, C. Vix-Guterl and L. Monconduit, Journal of Materials Chemistry A, 2015, 3, 11960-11969.
32. L. Yuan, J. Wang, S. Y. Chew, J. Chen, Z. Guo, L. Zhao, K. Konstantinov and H. Liu, Journal of power sources, 2007, 174, 1183-1187.
33. L. Cui, J. Shen, F. Cheng, Z. Tao and J. Chen, Journal of Power Sources, 2011, 196, 2195-2201.
34. S.-L. Chou, X.-W. Gao, J.-Z. Wang, D. Wexler, Z.-X. Wang, L.-Q. Chen and H.-K. Liu, Dalton transactions, 2011, 40, 12801-12807.
35. X. Gao, W. Luo, C. Zhong, D. Wexler, S.-L. Chou, H.-K. Liu, Z. Shi, G. Chen, K. Ozawa and J.-Z. Wang, Scientific reports, 2014, 4.6095.
36. Y. Zhao, J. Li, N. Wang, C. Wu, G. Dong and L. Guan, The Journal of Physical Chemistry C, 2012, 116, 18612-18617.
37. Du, X.; Yang, T.; Lin, J.; Feng, T.; Zhu, J.; Lu, L.; Xu, Y.; Wang, J., Microwave-assisted synthesis of SnO2@ polypyrrole nanotubes and their pyrolyzed composite as anode for lithium-ion batteries. ACS applied materials & interfaces 2016, 8,15598-15606.
38. X. Yang, Z. Zhu, T. Dai and Y. Lu, Macromolecular rapid communications, 2005, 26, 1736-1740.
39. MA. C., SG. P., PR. G., RN. M., S. S. and VB. P., Soft Nanoscience Letters, 2011, 1,6-10 .
40. S. Sakthivel and A. Boopathi, Journal of Chemistry and Chemical Science, 2014, 4, 144-149.
41. J. Ouyang and Y. Li, Polymer, 1997, 38, 3997-3999. 42. G. Cho, B. M. Fung, D. T. Glatzhofer, J.-S. Lee and Y.-G.
Shul, Langmuir, 2001, 17, 456-461. 43. M.-S. Park, Y.-M. Kang, J.-H. Kim, G.-X. Wang, S.-X. Dou
and H.-K. Liu, Carbon, 2008, 46, 35-40. 44. M. P. Seah and D. Briggs, Practical Surface Analysis: Auger
and X-ray Photoelectron Spectroscopy, John Wiley & Sons, 1990.
45. C. D. Wagner and G. Muilenberg, Handbook of X-ray photoelectron spectroscopy, Perkin-Elmer, 1979.
46. Y. Liu, Y. Xu, Y. Zhu, J. N. Culver, C. A. Lundgren, K. Xu and C. Wang, ACS nano, 2013, 7, 3627-3634.
47. J. Qian, Y. Chen, L. Wu, Y. Cao, X. Ai and H. Yang, Chemical Communications, 2012, 48, 7070-7072.