2nd Quarter Results - 出前館
19
March 26, 2021 2 nd Quarter Results
Transcript of 2nd Quarter Results - 出前館
March 26, 2021
2nd Quarter Results

Business Highlights

2Q Highlights3
Merchants
Active Users
YoY 182%
Sharing Delivery
YoY 279%
40.3BJPY
GMV
YoY 178%
Household Coverage
39%
59K
5.82M
Merchant
Delivery
User

2Q'20 3Q'20 4Q'20 1Q'21 2Q'212Q'20 3Q'20 4Q'20 1Q'21 2Q'210
2
4
6
8
1 0
1 2
1 4
1 6
0
1 0, 00 0
2 0, 00 0
3 0, 00 0
4 0, 00 0
5 0, 00 0
2Q'20 3Q'20 4Q'20 1Q'21 2Q'21
GMV / Orders Merchants Active Users
+1.11M
14.8MGMVOrders
40.3B
59K
YoY279%216%166%125%115%
YoY178%158%148%150%109%
YoY182%152%131%128%113%
30.730.829.7
22.7
45
33
2421
11.511.1
10.7
8.2 4.71
3.923.70
3.20
5.82M
Merchants and Active Users are as of quarter end
All key KPIs making significant YoY growth4
GMV(Gross Merchandise Value)︓order value (incl. tax) + delivery fee (incl. tax)Active Users︓ Users who placed more than one order within the last twelve months (unique users)

5
Ranked 3rd most favorite TV commercial1
Brand recognition increased 27.6pt2
57.2%
69.6%
75.7%
79.9%
84.8%
JUL SEP NOV JAN MAR
TV commercials & campaigns boosted brand awareness
Brand recognition uplift
1. Source: CM Soken ConsultingAmong 2,661 TV ads aired on five flagship stations in Tokyo during the period of Dec.20,2020 to Jan.19, 2021. Survey based on 3,000 people living in Kanto region.
2. Based on a smartphone survey using ”LINE Research Platform” conducted during Mar.3~6, 2021 by Demae-can. Survey based on 2,500 male/female between 15 to 69 y/o.

2Q'20 3Q'20 4Q'20 1Q'21 2Q'21
6
Sharing Delivery GMV accelerating 6x
2Q'20 3Q'20 4Q'20 1Q'21 2Q'212Q'20 3Q'20 4Q'20 1Q'21 2Q'21
6×
Sharing Delivery GMV Sharing Delivery Merchants # of Delivery Staff
approx.
7.5×approx.
10×approx.

2021
2022
2023
7
‘Delivery as part of Everyday Life’
Expansion of Coverage
Improve Brand Value/Recognition
New User Acquisition
Expand Delivery Area/
MerchantNew System Development
Aug. 2021 Target: 160BJPYProgress︓43%
Aug. 2021 Target: 75KProgress︓62%1 Aug. 2021 Target: 36%
Merchants
59K 39%
Household Coverage
PriorityInitiatives
GMV71BJPY
Progress of Mid-term Plan : 1st half review and 2nd half plan
A B C D
1. 26K merchants acquired out of 42K targeted by the end of 2Qʼ21

8
Cloud Kitchen
Demae-can‘s Key Initiative
Merchants can join Demaecan without a
brick-and-mortar restaurant ー providing support to start delivery business

9
Initiatives toward Social Responsibility
Job Creation
Temporarily employing staff of restaurants
impacted by Covid-19

10
Traffic Safety
Initiatives toward Social Responsibility
• Promoted traffic safety together with
Metropolitan Police Department
• Created a bicycle traffic safety awareness
video in cooperation with Osaka Prefecture South Police Station and a talent agency
11
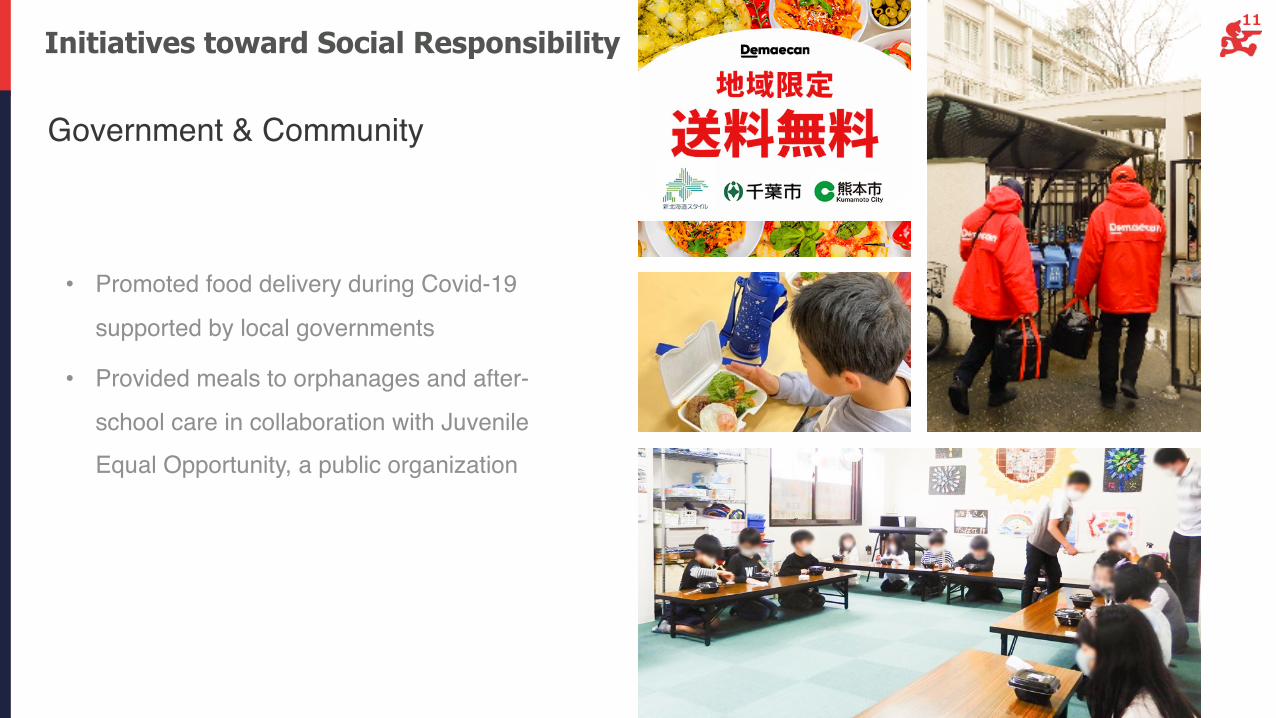
Initiatives toward Social Responsibility
Government & Community
• Promoted food delivery during Covid-19
supported by local governments
• Provided meals to orphanages and after-
school care in collaboration with Juvenile Equal Opportunity, a public organization

Financial Highlights

13
Revenue model1
Demae-can Business Model
Cost model
1. As of March 2021 2. Includes delivery fee paid by user in the case of Marketplace
Part-time staffPaid by hour
Labor
Outsource Paid per delivery
Cost of Sales
Delivery Staff
High quality delivery
Fee type Marketplace Sharing Delivery
Merchant
Demae-can Service Fee 10% of merchant sales2
Delivery Commission - 25% of
merchant sales
Payment Service (Other) A few % of order value
User Delivery Commission Delivery fee
(Delivery by merchant) (Delivery by Demae-can)

14
Revenue
323 761 1,022
1,670
Delivery Commission
3,066 1,081
1,756
1,928
2,007
Demae-can Service
Fee
2,680
606
476
532
550
Other489
2,011
2,994
3,483
4,228
6,235
2Q'20 3Q'20 4Q'20 1Q'21 2Q'21
万件
YoY (117M) JPY(YoY 81%)Decline of commerce business revenue from subsidiary
Other
YoY +1,598M JPY (YoY 248%)Increase in orders dues to the expansion of merchants and users
YoY +2,742M JPY(YoY 948%)Increase in the number of sharing delivery orders
Demae-can Service Fee
Delivery Commission
YoY 310%
(Million JPY)

15
Cost of Sales / SG&A
601 776 956 1,702
Cost of Sales3,500
672 1,167
1,448
1,868
Labor2,434
1,140 1,042
1,258
2,647
Marketing 3,636
375
627
834
1,203
SG&A Other1,858
2,790 3,613
4,497
7,422
11,429
2Q'20 3Q'20 4Q'20 1Q'21 2Q'21
万件
YoY +1,483M JPY(YoY 495%)Increase in outsourcing fee (merchant acquisition)
YoY +2,495M JPY(YoY 319%)Increase in campaign and promotion cost
YoY +1,761M(YoY 362%)Increase in part-time delivery staff
SG&A Other
Marketing
Labor
YoY +2,898M(YoY 582%)Increase in outsourcing fee (delivery staff)
Cost of Sales
(Million JPY)

Appendix
17
(Million JPY)August 2020 August 2021 August 2021 2Q
1Q 2Q 3Q 4Q 1Q 2Q YoY QoQ
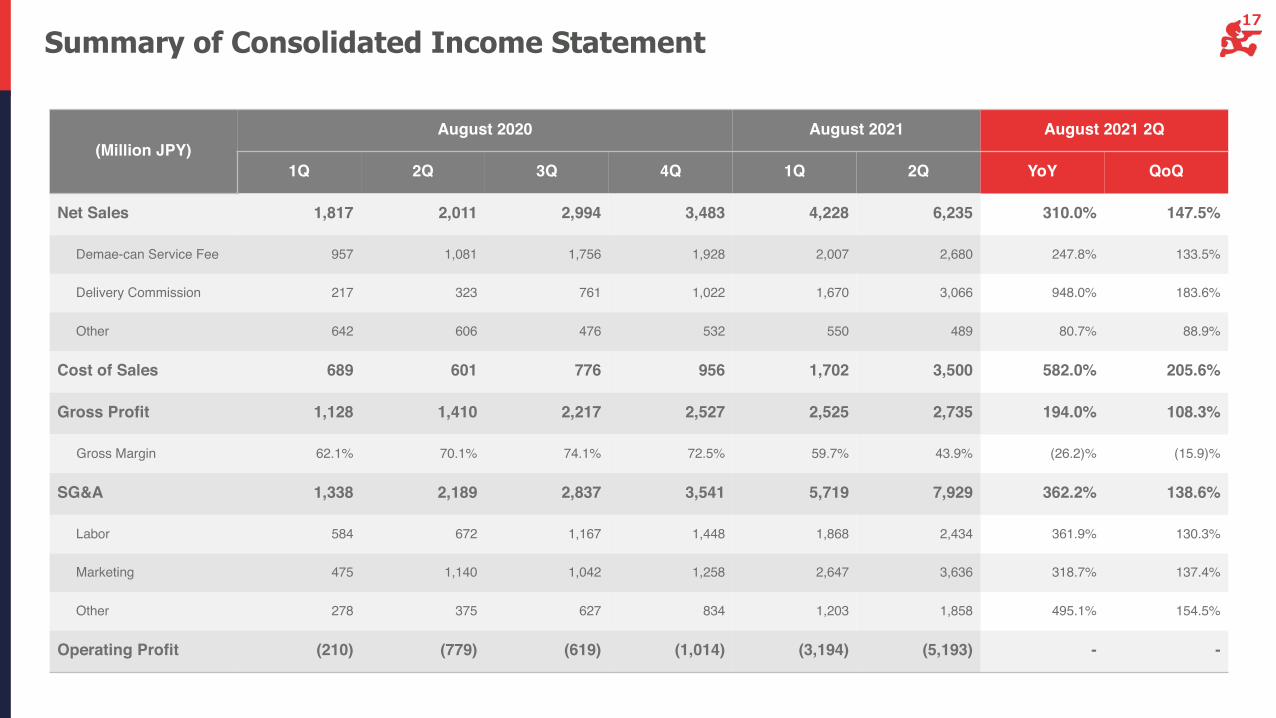
Net Sales 1,817 2,011 2,994 3,483 4,228 6,235 310.0% 147.5%
Demae-can Service Fee 957 1,081 1,756 1,928 2,007 2,680 247.8% 133.5%
Delivery Commission 217 323 761 1,022 1,670 3,066 948.0% 183.6%
Other 642 606 476 532 550 489 80.7% 88.9%
Cost of Sales 689 601 776 956 1,702 3,500 582.0% 205.6%
Gross Profit 1,128 1,410 2,217 2,527 2,525 2,735 194.0% 108.3%
Gross Margin 62.1% 70.1% 74.1% 72.5% 59.7% 43.9% (26.2)% (15.9)%
SG&A 1,338 2,189 2,837 3,541 5,719 7,929 362.2% 138.6%
Labor 584 672 1,167 1,448 1,868 2,434 361.9% 130.3%
Marketing 475 1,140 1,042 1,258 2,647 3,636 318.7% 137.4%
Other 278 375 627 834 1,203 1,858 495.1% 154.5%
Operating Profit (210) (779) (619) (1,014) (3,194) (5,193) - -
Summary of Consolidated Income Statement

18
Demae-can Service Fee • Demae-can platform fee
Delivery Commission • Sharing delivery fee
Other• Payment service fee• Commerce business revenue from
subsidiary
Cost of Sales• Outsourcing fee (delivery staff)• System operating costs, etc.• Payment service fee
Labor • Part-time fee (delivery staff)• Employee, stock option
Marketing • Advertisement cost• Promotion cost
SG&A• Outsourcing fee (merchant acquisition)• Lease and supplies• Commissions• Rent and others
Breakdown of each category
Cost of Sales/SG&ARevenue

Thank you