$2,964,597,232 Government National Mortgage ... - Ginnie Mae
109
Offering Circular Supplement (To Base Offering Circular dated March 1, 2020) $2,964,597,232 Government National Mortgage Association GINNIE MAE ® Guaranteed REMIC Pass-Through Securities and MX Securities Ginnie Mae REMIC Trust 2020-061 The Securities The Trust will issue the Classes of Securities listed on the front cover of this offering circular supplement. The Ginnie Mae Guaranty Ginnie Mae will guarantee the timely payment of principal and interest on the securities. The Ginnie Mae Guar- anty is backed by the full faith and credit of the United States of America. The Trust and its Assets The Trust will own (1) Ginnie Mae Certificates and (2) certain previously issued certificates. The securities may not be suit- able investments for you. You should consider carefully the risks of investing in them. See “Risk Factors” beginning on page S-17 which highlights some of these risks. The Sponsor and the Co-Sponsor will offer the securities from time to time in negotiated transactions at varying prices. We expect the clos- ing date to be May 29, 2020. You should read the Base Offering Circular as well as this Supplement. The securities are exempt from registration under the Securities Act of 1933 and are “exempted secu- rities” under the Securities Exchange Act of 1934. Wells Fargo Securities Class of REMIC Securities Original Principal Balance(2) Interest Rate Principal Type(3) Interest Type(3) CUSIP Number Final Distribution Date(4) Security Group 1 JE ................................ JI ................................ $ 20,000,000 3,600,000 2.05% 2.50 PT NTL(PT) FIX FIX/IO 38382EA80 38382EA98 May 2050 May 2050 Security Group 2 IJ ................................ 91,965,792 3.50 NTL(SC/PT) FIX/IO 38382EB22 February 2048 Security Group 3 AB ............................... AC ............................... AZ ............................... 33,732,000 5,489,000 7,550,221 3.00 3.00 3.00 PAC/AD PAC/AD SUP FIX FIX FIX/Z 38382EB30 38382EB48 38382EB55 May 2048 May 2050 May 2050 Security Group 4 GT(1) ............................. 87,710,917 5.00 PT FIX 38382EB63 May 2050 Security Group 5 DI ............................... DL ............................... 9,252,787 22,617,924 5.50 1.25 NTL(SC/PT) SC/PT FIX/IO FIX 38382EB71 38382EB89 February 2049 February 2049 Security Group 6 NA(1) ............................ NB(1) ............................. NC(1) ............................. ND(1) ............................ NE(1) ............................. NF(1) ............................. NG(1) ............................ NH(1) ............................ NI(1) ............................. NJ(1) ............................. NK(1) ............................ NL(1) ............................. TB(1) ............................. TC(1) ............................. TD(1) ............................. TE(1) ............................. TG(1) ............................. TH(1) ............................. TI(1) ............................. TJ(1) ............................. TK(1) ............................. TL(1) ............................. 16,150,012 9,507,253 19,225,270 41,762,689 20,291,016 21,902,917 18,236,020 5,413,517 41,347,619 11,523,914 9,823,184 16,535,798 9,507,253 19,225,270 41,762,689 20,291,016 18,236,020 5,413,517 41,347,619 11,523,914 9,823,184 16,535,798 (5) (5) (5) (5) (5) (5) (5) (5) (5) (5) (5) (5) (5) (5) (5) (5) (5) (5) (5) (5) (5) (5) NTL(SC/PT) NTL(SC/PT) NTL(SC/PT) NTL(SC/PT) NTL(SC/PT) NTL(SC/PT) NTL(SC/PT) NTL(SC/PT) NTL(SC/PT) NTL(SC/PT) NTL(SC/PT) NTL(SC/PT) NTL(SC/PT) NTL(SC/PT) NTL(SC/PT) NTL(SC/PT) NTL(SC/PT) NTL(SC/PT) NTL(SC/PT) NTL(SC/PT) NTL(SC/PT) NTL(SC/PT) INV/IO INV/IO INV/IO INV/IO INV/IO INV/IO INV/IO INV/IO INV/IO INV/IO INV/IO INV/IO INV/IO INV/IO INV/IO INV/IO INV/IO INV/IO INV/IO INV/IO INV/IO INV/IO 38382EB97 38382EC21 38382EC39 38382EC47 38382EC54 38382EC62 38382EC70 38382EC88 38382EC96 38382ED20 38382ED38 38382ED46 38382ED53 38382ED61 38382ED79 38382ED87 38382ED95 38382EE29 38382EE37 38382EE45 38382EE52 38382EE60 January 2044 January 2046 April 2040 May 2040 May 2040 June 2040 July 2043 May 2040 April 2041 May 2041 April 2041 December 2039 January 2046 April 2040 May 2040 May 2040 July 2043 May 2040 April 2041 May 2041 April 2041 December 2039 Security Group 7 KA ............................... KC ............................... KI ............................... KY ............................... KZ ............................... UA ............................... ZK ............................... 33,000,000 6,500,000 812,500 488,198 4,007,222 3,800,000 37,310 4.00 3.50 4.00 4.00 4.00 4.00 4.00 PAC/AD PAC/AD NTL(PAC/AD) PAC/AD SUP PAC/AD PAC/AD FIX FIX FIX/IO FIX FIX/Z FIX FIX/Z 38382EE78 38382EE86 38382EE94 38382EF28 38382EF36 38382EF44 38382EF51 May 2050 May 2050 May 2050 May 2050 May 2050 October 2048 May 2050 Security Group 8 HT(1) ............................. 117,425,131 3.00 SC/PT FIX 38382EF69 January 2048 Security Group 9 AP ............................... IA ............................... ZA ............................... 57,106,000 23,794,166 11,529,585 1.75 3.00 3.00 PAC/AD NTL(PAC/AD) SUP FIX FIX/IO FIX/Z 38382EF77 38382EF85 38382EF93 May 2050 May 2050 May 2050 Security Group 10 CA ............................... CD ............................... CI ................................ CS ............................... CW .............................. IC ................................ 15,000,000 10,746,000 9,920,625 9,573,873 591,000 13,466,577 0.75 1.25 4.00 2.50 2.50 4.00 PAC PAC NTL(PAC) SUP PAC NTL(PT) FIX FIX FIX/IO FIX FIX FIX/IO 38382EG68 38382EG76 38382EG84 38382EG92 38382EH26 38382EH34 March 2050 March 2050 March 2050 May 2050 May 2050 May 2050 Security Group 11 D(1) .............................. 21,377,250 5.00 PT FIX 38382EH42 May 2050 Security Group 12 BP(1) ............................. 20,331,700 4.50 PT FIX 38382EH59 May 2050 Security Group 13 N(1) .............................. NM(1) ............................ NP(1) ............................. NQ(1) ............................ TN(1) ............................. TP(1) ............................. TQ(1) ............................. 3,818,824 9,508,968 57,348,779 22,144,656 3,818,824 57,348,779 22,144,656 (5) (5) (5) (5) (5) (5) (5) NTL(SC/PT) NTL(SC/PT) NTL(SC/PT) NTL(SC/PT) NTL(SC/PT) NTL(SC/PT) NTL(SC/PT) INV/IO INV/IO INV/IO INV/IO INV/IO INV/IO INV/IO 38382EH67 38382EH75 38382EH83 38382EH91 38382EJ24 38382EJ32 38382EJ40 August 2040 August 2040 July 2043 July 2043 August 2040 July 2043 July 2043 (Cover continued on next page) Tribal Capital Markets The date of this Offering Circular Supplement is May 22, 2020.
Transcript of $2,964,597,232 Government National Mortgage ... - Ginnie Mae

Offering Circular Supplement (To Base Offering Circular dated March 1, 2020)
$2,964,597,232 Government National Mortgage Association
GINNIE MAE®
Guaranteed REMIC Pass-Through Securities and MX Securities
Ginnie Mae REMIC Trust 2020-061
The Securities
The Trust will issue the Classes of Securities listed on the front cover of this offering circular supplement.
The Ginnie Mae Guaranty
Ginnie Mae will guarantee the timely payment of principal and interest on the securities. The Ginnie Mae Guar-anty is backed by the full faith and credit of the United States of America.
The Trust and its Assets
The Trust will own (1) Ginnie Mae Certificates and (2) certain previously issued certificates.
The securities may not be suit-able investments for you. You should consider carefully the risks of investing in them.
See “Risk Factors” beginning on page S-17 which highlights some of these risks.
The Sponsor and the Co-Sponsor will offer the securities from time to time in negotiated transactions at varying prices. We expect the clos-ing date to be May 29, 2020.
You should read the Base Offering Circular as well as this Supplement.
The securities are exempt from registration under the Securities Act of 1933 and are “exempted secu-rities” under the Securities Exchange Act of 1934.
Wells Fargo Securities
Class of REMIC Securities
Original Principal
Balance(2) Interest
Rate Principal Type(3)
Interest Type(3)
CUSIP Number
Final Distribution
Date(4)
Security Group 1 JE . . . . . . . . . . . . . . . . . . . . . . . . . . . . . . . . JI . . . . . . . . . . . . . . . . . . . . . . . . . . . . . . . .
$ 20,000,000 3,600,000
2.05% 2.50
PT NTL(PT)
FIX FIX/IO
38382EA80 38382EA98
May 2050 May 2050
Security Group 2 IJ . . . . . . . . . . . . . . . . . . . . . . . . . . . . . . . . 91,965,792 3.50 NTL(SC/PT) FIX/IO 38382EB22 February 2048
Security Group 3 AB . . . . . . . . . . . . . . . . . . . . . . . . . . . . . . . AC . . . . . . . . . . . . . . . . . . . . . . . . . . . . . . . AZ . . . . . . . . . . . . . . . . . . . . . . . . . . . . . . .
33,732,000 5,489,000 7,550,221
3.00 3.00 3.00
PAC/AD PAC/AD
SUP
FIX FIX
FIX/Z
38382EB30 38382EB48 38382EB55
May 2048 May 2050 May 2050
Security Group 4 GT(1) . . . . . . . . . . . . . . . . . . . . . . . . . . . . . 87,710,917 5.00 PT FIX 38382EB63 May 2050
Security Group 5 DI . . . . . . . . . . . . . . . . . . . . . . . . . . . . . . . DL . . . . . . . . . . . . . . . . . . . . . . . . . . . . . . .
9,252,787 22,617,924
5.50 1.25
NTL(SC/PT) SC/PT
FIX/IO FIX
38382EB71 38382EB89
February 2049 February 2049
Security Group 6 NA(1) . . . . . . . . . . . . . . . . . . . . . . . . . . . . NB(1) . . . . . . . . . . . . . . . . . . . . . . . . . . . . . NC(1) . . . . . . . . . . . . . . . . . . . . . . . . . . . . . ND(1) . . . . . . . . . . . . . . . . . . . . . . . . . . . . NE(1) . . . . . . . . . . . . . . . . . . . . . . . . . . . . . NF(1) . . . . . . . . . . . . . . . . . . . . . . . . . . . . . NG(1) . . . . . . . . . . . . . . . . . . . . . . . . . . . . NH(1) . . . . . . . . . . . . . . . . . . . . . . . . . . . . NI(1) . . . . . . . . . . . . . . . . . . . . . . . . . . . . . NJ(1) . . . . . . . . . . . . . . . . . . . . . . . . . . . . . NK(1) . . . . . . . . . . . . . . . . . . . . . . . . . . . . NL(1) . . . . . . . . . . . . . . . . . . . . . . . . . . . . . TB(1) . . . . . . . . . . . . . . . . . . . . . . . . . . . . . TC(1) . . . . . . . . . . . . . . . . . . . . . . . . . . . . . TD(1) . . . . . . . . . . . . . . . . . . . . . . . . . . . . . TE(1) . . . . . . . . . . . . . . . . . . . . . . . . . . . . . TG(1) . . . . . . . . . . . . . . . . . . . . . . . . . . . . . TH(1) . . . . . . . . . . . . . . . . . . . . . . . . . . . . . TI(1) . . . . . . . . . . . . . . . . . . . . . . . . . . . . . TJ(1) . . . . . . . . . . . . . . . . . . . . . . . . . . . . . TK(1) . . . . . . . . . . . . . . . . . . . . . . . . . . . . . TL(1) . . . . . . . . . . . . . . . . . . . . . . . . . . . . .
16,150,012 9,507,253
19,225,270 41,762,689 20,291,016 21,902,917 18,236,020 5,413,517
41,347,619 11,523,914 9,823,184
16,535,798 9,507,253
19,225,270 41,762,689 20,291,016 18,236,020 5,413,517
41,347,619 11,523,914 9,823,184
16,535,798
(5) (5) (5) (5) (5) (5) (5) (5) (5) (5) (5) (5) (5) (5) (5) (5) (5) (5) (5) (5) (5) (5)
NTL(SC/PT) NTL(SC/PT) NTL(SC/PT) NTL(SC/PT) NTL(SC/PT) NTL(SC/PT) NTL(SC/PT) NTL(SC/PT) NTL(SC/PT) NTL(SC/PT) NTL(SC/PT) NTL(SC/PT) NTL(SC/PT) NTL(SC/PT) NTL(SC/PT) NTL(SC/PT) NTL(SC/PT) NTL(SC/PT) NTL(SC/PT) NTL(SC/PT) NTL(SC/PT) NTL(SC/PT)
INV/IO INV/IO INV/IO INV/IO INV/IO INV/IO INV/IO INV/IO INV/IO INV/IO INV/IO INV/IO INV/IO INV/IO INV/IO INV/IO INV/IO INV/IO INV/IO INV/IO INV/IO INV/IO
38382EB97 38382EC21 38382EC39 38382EC47 38382EC54 38382EC62 38382EC70 38382EC88 38382EC96 38382ED20 38382ED38 38382ED46 38382ED53 38382ED61 38382ED79 38382ED87 38382ED95 38382EE29 38382EE37 38382EE45 38382EE52 38382EE60
January 2044 January 2046 April 2040 May 2040 May 2040 June 2040 July 2043 May 2040 April 2041 May 2041 April 2041
December 2039 January 2046 April 2040 May 2040 May 2040 July 2043 May 2040 April 2041 May 2041 April 2041
December 2039
Security Group 7 KA . . . . . . . . . . . . . . . . . . . . . . . . . . . . . . . KC . . . . . . . . . . . . . . . . . . . . . . . . . . . . . . . KI . . . . . . . . . . . . . . . . . . . . . . . . . . . . . . . KY . . . . . . . . . . . . . . . . . . . . . . . . . . . . . . . KZ . . . . . . . . . . . . . . . . . . . . . . . . . . . . . . . UA . . . . . . . . . . . . . . . . . . . . . . . . . . . . . . . ZK . . . . . . . . . . . . . . . . . . . . . . . . . . . . . . .
33,000,000 6,500,000
812,500 488,198
4,007,222 3,800,000
37,310
4.00 3.50 4.00 4.00 4.00 4.00 4.00
PAC/AD PAC/AD
NTL(PAC/AD) PAC/AD
SUP PAC/AD PAC/AD
FIX FIX
FIX/IO FIX
FIX/Z FIX
FIX/Z
38382EE78 38382EE86 38382EE94 38382EF28 38382EF36 38382EF44 38382EF51
May 2050 May 2050 May 2050 May 2050 May 2050
October 2048 May 2050
Security Group 8 HT(1) . . . . . . . . . . . . . . . . . . . . . . . . . . . . . 117,425,131 3.00 SC/PT FIX 38382EF69 January 2048
Security Group 9 AP . . . . . . . . . . . . . . . . . . . . . . . . . . . . . . . IA . . . . . . . . . . . . . . . . . . . . . . . . . . . . . . . ZA . . . . . . . . . . . . . . . . . . . . . . . . . . . . . . .
57,106,000 23,794,166 11,529,585
1.75 3.00 3.00
PAC/AD NTL(PAC/AD)
SUP
FIX FIX/IO FIX/Z
38382EF77 38382EF85 38382EF93
May 2050 May 2050 May 2050
Security Group 10 CA . . . . . . . . . . . . . . . . . . . . . . . . . . . . . . . CD . . . . . . . . . . . . . . . . . . . . . . . . . . . . . . . CI . . . . . . . . . . . . . . . . . . . . . . . . . . . . . . . . CS . . . . . . . . . . . . . . . . . . . . . . . . . . . . . . . CW . . . . . . . . . . . . . . . . . . . . . . . . . . . . . . IC . . . . . . . . . . . . . . . . . . . . . . . . . . . . . . . .
15,000,000 10,746,000 9,920,625 9,573,873
591,000 13,466,577
0.75 1.25 4.00 2.50 2.50 4.00
PAC PAC
NTL(PAC) SUP PAC
NTL(PT)
FIX FIX
FIX/IO FIX FIX
FIX/IO
38382EG68 38382EG76 38382EG84 38382EG92 38382EH26 38382EH34
March 2050 March 2050 March 2050 May 2050 May 2050 May 2050
Security Group 11 D(1) . . . . . . . . . . . . . . . . . . . . . . . . . . . . . . 21,377,250 5.00 PT FIX 38382EH42 May 2050
Security Group 12 BP(1) . . . . . . . . . . . . . . . . . . . . . . . . . . . . . 20,331,700 4.50 PT FIX 38382EH59 May 2050
Security Group 13 N(1) . . . . . . . . . . . . . . . . . . . . . . . . . . . . . . NM(1) . . . . . . . . . . . . . . . . . . . . . . . . . . . . NP(1) . . . . . . . . . . . . . . . . . . . . . . . . . . . . . NQ(1) . . . . . . . . . . . . . . . . . . . . . . . . . . . . TN(1) . . . . . . . . . . . . . . . . . . . . . . . . . . . . . TP(1) . . . . . . . . . . . . . . . . . . . . . . . . . . . . . TQ(1) . . . . . . . . . . . . . . . . . . . . . . . . . . . . .
3,818,824 9,508,968
57,348,779 22,144,656 3,818,824
57,348,779 22,144,656
(5) (5) (5) (5) (5) (5) (5)
NTL(SC/PT) NTL(SC/PT) NTL(SC/PT) NTL(SC/PT) NTL(SC/PT) NTL(SC/PT) NTL(SC/PT)
INV/IO INV/IO INV/IO INV/IO INV/IO INV/IO INV/IO
38382EH67 38382EH75 38382EH83 38382EH91 38382EJ24 38382EJ32 38382EJ40
August 2040 August 2040
July 2043 July 2043
August 2040 July 2043 July 2043
(Cover continued on next page)
Tribal Capital Markets The date of this Offering Circular Supplement is May 22, 2020.
Class of REMIC Securities
Original Principal
Balance(2) Interest
Rate Principal Type(3)
Interest Type(3)
CUSIP Number
Final Distribution
Date(4)
Security Group 14 NS(1) . . . . . . . . . . . . . . . . . . . . . . . . . . . . NT(1) . . . . . . . . . . . . . . . . . . . . . . . . . . . . NU(1) . . . . . . . . . . . . . . . . . . . . . . . . . . . . T(1) . . . . . . . . . . . . . . . . . . . . . . . . . . . . . TU(1) . . . . . . . . . . . . . . . . . . . . . . . . . . . .
$ 17,112,566 14,186,469 12,463,818 14,186,469 12,463,818
(5) (5) (5) (5) (5)
NTL(SC/PT) NTL(SC/PT) NTL(SC/PT) NTL(SC/PT) NTL(SC/PT)
INV/IO INV/IO INV/IO INV/IO INV/IO
38382EJ57 38382EJ65 38382EJ73 38382EJ81 38382EJ99
June 2044 March 2044
November 2045 March 2044
November 2045
Security Group 15 SU . . . . . . . . . . . . . . . . . . . . . . . . . . . . . . 54,183,602 (5) NTL(SC/PT) INV/IO 38382EK22 July 2045
Security Group 16 CN(1) . . . . . . . . . . . . . . . . . . . . . . . . . . . . CT(1) . . . . . . . . . . . . . . . . . . . . . . . . . . . . NV(1) . . . . . . . . . . . . . . . . . . . . . . . . . . . . NW(1) . . . . . . . . . . . . . . . . . . . . . . . . . . . NX(1) . . . . . . . . . . . . . . . . . . . . . . . . . . . . NY(1) . . . . . . . . . . . . . . . . . . . . . . . . . . . . TV(1) . . . . . . . . . . . . . . . . . . . . . . . . . . . . TX(1) . . . . . . . . . . . . . . . . . . . . . . . . . . . . TY(1) . . . . . . . . . . . . . . . . . . . . . . . . . . . .
20,623,163 20,623,163
199,482,873 385,385,353 56,133,267
257,577,610 199,482,873 56,133,267
257,577,610
(5) (5) (5) (5) (5) (5) (5) (5) (5)
NTL(SC/PT) NTL(SC/PT) NTL(SC/PT) NTL(SC/PT) NTL(SC/PT) NTL(SC/PT) NTL(SC/PT) NTL(SC/PT) NTL(SC/PT)
INV/IO INV/IO INV/IO INV/IO INV/IO INV/IO INV/IO INV/IO INV/IO
38382EK30 38382EK48 38382EK55 38382EK63 38382EK71 38382EK89 38382EK97 38382EL21 38382EL39
April 2048 April 2048
August 2049 April 2049
October 2048 October 2048 August 2049 October 2048 October 2048
Security Group 17 FH(1) . . . . . . . . . . . . . . . . . . . . . . . . . . . . H . . . . . . . . . . . . . . . . . . . . . . . . . . . . . . . HK . . . . . . . . . . . . . . . . . . . . . . . . . . . . . . SH(1) . . . . . . . . . . . . . . . . . . . . . . . . . . . .
50,485,118 17,636,904
100,000,000 50,485,118
(5) 2.00% 2.25 (5)
PT PT PT
NTL(PT)
FLT FIX FIX
INV/IO
38382EL47 38382EL54 38382EL62 38382EL70
May 2050 May 2050 May 2050 May 2050
Security Group 18 AD(1) . . . . . . . . . . . . . . . . . . . . . . . . . . . . AE(1) . . . . . . . . . . . . . . . . . . . . . . . . . . . . AF(1) . . . . . . . . . . . . . . . . . . . . . . . . . . . . AG(1) . . . . . . . . . . . . . . . . . . . . . . . . . . . . AH(1) . . . . . . . . . . . . . . . . . . . . . . . . . . . . AI(1) . . . . . . . . . . . . . . . . . . . . . . . . . . . . AQ(1) . . . . . . . . . . . . . . . . . . . . . . . . . . . . AT(1) . . . . . . . . . . . . . . . . . . . . . . . . . . . . AU(1) . . . . . . . . . . . . . . . . . . . . . . . . . . . . AV(1) . . . . . . . . . . . . . . . . . . . . . . . . . . . . AW(1) . . . . . . . . . . . . . . . . . . . . . . . . . . . BQ(1) . . . . . . . . . . . . . . . . . . . . . . . . . . . . BT(1) . . . . . . . . . . . . . . . . . . . . . . . . . . . . BU(1) . . . . . . . . . . . . . . . . . . . . . . . . . . . . BV(1) . . . . . . . . . . . . . . . . . . . . . . . . . . . . BW(1) . . . . . . . . . . . . . . . . . . . . . . . . . . . FI(1) . . . . . . . . . . . . . . . . . . . . . . . . . . . . . IE(1) . . . . . . . . . . . . . . . . . . . . . . . . . . . . . IF(1) . . . . . . . . . . . . . . . . . . . . . . . . . . . . . IH(1) . . . . . . . . . . . . . . . . . . . . . . . . . . . .
45,635,000 13,041,000 66,658,000 35,651,000 25,263,000 56,339,453 92,284,000 26,372,000
134,798,000 72,095,000 51,088,000
369,136,079 105,490,098 539,190,960 288,379,041 204,354,073 77,024,313 20,125,430
123,441,160 62,378,905
3.50 3.50 3.50 3.50 3.50 4.50 3.50 3.50 3.50 3.50 3.50 3.50 3.50 3.50 3.50 3.50 4.50 4.50 4.50 4.50
SEQ SEQ SEQ SEQ SEQ
NTL(PT) SEQ SEQ SEQ SEQ SEQ SEQ SEQ SEQ SEQ SEQ
NTL(PT) NTL(PT) NTL(PT) NTL(PT)
FIX FIX FIX FIX FIX
FIX/IO FIX FIX FIX FIX FIX FIX FIX FIX FIX FIX
FIX/IO FIX/IO FIX/IO FIX/IO
38382EL88 38382EL96 38382EM20 38382EM38 38382EM46 38382EM53 38382EM61 38382EM79 38382EM87 38382EM95 38382EN29 38382EN37 38382EN45 38382EN52 38382EN60 38382EN78 38382EN86 38382EN94 38382EP27 38382EP35
November 2025 August 2025
September 2025 October 2025
December 2025 May 2050
October 2033 April 2033 June 2033
August 2033 November 2033
May 2050 May 2050 May 2050 May 2050 May 2050 May 2050 May 2050 May 2050 May 2050
Security Group 19 AJ . . . . . . . . . . . . . . . . . . . . . . . . . . . . . . . AK . . . . . . . . . . . . . . . . . . . . . . . . . . . . . . AL . . . . . . . . . . . . . . . . . . . . . . . . . . . . . . AM . . . . . . . . . . . . . . . . . . . . . . . . . . . . . . AN . . . . . . . . . . . . . . . . . . . . . . . . . . . . . . DP . . . . . . . . . . . . . . . . . . . . . . . . . . . . . . DQ . . . . . . . . . . . . . . . . . . . . . . . . . . . . . . ZD . . . . . . . . . . . . . . . . . . . . . . . . . . . . . .
10,461,000 1,494,855 5,739,386
20,234,546 2,023,454 5,212,000
53,000 712,929
2.50 2.50 2.50 2.25 5.00 2.50 2.50 2.50
SEQ SEQ SEQ SEQ SEQ
PAC/AD PAC/AD
SUP
FIX FIX FIX FIX FIX FIX FIX
FIX/Z
38382EP43 38382EP50 38382EP68 38382EP76 38382EP84 38382EP92 38382EQ26 38382EQ34
February 2048 May 2050 May 2050 July 2046 July 2046 April 2050 May 2050 May 2050
Security Group 20 IQ . . . . . . . . . . . . . . . . . . . . . . . . . . . . . . . QA(1) . . . . . . . . . . . . . . . . . . . . . . . . . . . . QP(1) . . . . . . . . . . . . . . . . . . . . . . . . . . . . ZQ . . . . . . . . . . . . . . . . . . . . . . . . . . . . . .
16,000,000 25,096,634
291,406 14,611,960
2.50 1.50 1.50 1.50
NTL(PT) PAC/AD PAC/AD
SUP
FIX/IO FIX FIX
FIX/Z
38382EQ42 38382EQ59 38382EQ67 38382EQ75
May 2050 April 2050 May 2050 May 2050
Security Group 21 IY . . . . . . . . . . . . . . . . . . . . . . . . . . . . . . . 38,554,268 4.00 NTL(SC/PT) FIX/IO 38382EQ83 April 2050
Security Group 22 IW . . . . . . . . . . . . . . . . . . . . . . . . . . . . . . 22,279,518 (5) NTL(SC/PT) WAC/INV/IO 38382EQ91 May 2048
Security Group 23 KU(1) . . . . . . . . . . . . . . . . . . . . . . . . . . . . KW(1) . . . . . . . . . . . . . . . . . . . . . . . . . . . UH(1) . . . . . . . . . . . . . . . . . . . . . . . . . . . . UZ . . . . . . . . . . . . . . . . . . . . . . . . . . . . . . ZU . . . . . . . . . . . . . . . . . . . . . . . . . . . . . .
5,177,000 4,651,000
37,054,000 3,940,946
212,000
3.50 3.50 3.50 3.50 3.50
PAC/AD PAC/AD PAC/AD
SUP PAC/AD
FIX FIX FIX
FIX/Z FIX/Z
38382ER25 38382ER33 38382ER41 38382ER58 38382ER66
October 2048 March 2050
December 2046 May 2050 May 2050
Security Group 24 ID . . . . . . . . . . . . . . . . . . . . . . . . . . . . . . . UQ . . . . . . . . . . . . . . . . . . . . . . . . . . . . . . UT . . . . . . . . . . . . . . . . . . . . . . . . . . . . . . UV . . . . . . . . . . . . . . . . . . . . . . . . . . . . . .
19,080,000 30,000,000 30,000,000 30,000,000
2.50 1.95 1.97 1.99
NTL(PT) PT PT PT
FIX/IO FIX FIX FIX
38382ER74 38382ER82 38382ER90 38382ES24
May 2050 May 2050 May 2050 May 2050
Security Group 25 BA . . . . . . . . . . . . . . . . . . . . . . . . . . . . . . IB . . . . . . . . . . . . . . . . . . . . . . . . . . . . . . .
11,460,512 5,730,256
1.00 5.00
SC/PT NTL(SC/PT)
FIX FIX/IO
38382ES32 38382ES40
October 2047 October 2047
Residual RR . . . . . . . . . . . . . . . . . . . . . . . . . . . . . . 0 0.00 NPR NPR 38382ES57 May 2050
(1) These Securities may be exchanged for MX Securities described in Schedule I to this Supplement. (2) Subject to increase as described under “Increase in Size” in this Supplement. The amount shown for each Notional
Class (indicated by “NTL” under Principal Type) is its original Class Notional Balance and does not represent princi-pal that will be paid.
(3) As defined under “Class Types” in Appendix I to the Base Offering Circular. The Class Notional Balance of each Notional Class will be reduced as shown under “Terms Sheet — Notional Classes” in this Supplement.
(4) See “Yield, Maturity and Prepayment Considerations — Final Distribution Date” in this Supplement. (5) See “Terms Sheet — Interest Rates” in this Supplement.

AVAILABLE INFORMATION
You should purchase the securities only if you have read and understood the following documents:
� this Offering Circular Supplement (this “Supplement”),
� the Base Offering Circular and
� in the case of the Group 2, 5, 6, 8, 13, 14, 15, 16, 21, 22 and 25 securities, each disclosure docu-ment relating to the Underlying Certificates (the “Underlying Certificate Disclosure Documents”).
The Base Offering Circular and the Underlying Certificate Disclosure Documents are available on Ginnie Mae’s website located at http://www.ginniemae.gov (“ginniemae.gov”).
If you do not have access to the internet, call BNY Mellon, which will act as information agent for the Trust, at (800) 234-GNMA, to order copies of the Base Offering Circular. In addition, you can obtain copies of any other document listed above by contacting BNY Mellon at the telephone number listed above.
Please consult the standard abbreviations of Class Types included in the Base Offering Circular as Appendix I and the glossary included in the Base Offering Circular as Appendix II for definitions of capitalized terms.
TABLE OF CONTENTS
Page Page
Terms Sheet . . . . . . . . . . . . . . . . . . . . . . . S-3 ERISA Matters . . . . . . . . . . . . . . . . . . . . . . S-76 Risk Factors . . . . . . . . . . . . . . . . . . . . . . . S-17 Legal Investment Considerations . . . . . . . S-76 The Trust Assets . . . . . . . . . . . . . . . . . . . . S-22 Plan of Distribution . . . . . . . . . . . . . . . . . S-76 Ginnie Mae Guaranty . . . . . . . . . . . . . . . . S-23 Increase in Size . . . . . . . . . . . . . . . . . . . . . S-77 Description of the Securities . . . . . . . . . . S-23 Legal Matters . . . . . . . . . . . . . . . . . . . . . . . S-77 Yield, Maturity and Prepayment Schedule I: Available Combinations . . . . S-I-1
Considerations . . . . . . . . . . . . . . . . . . . S-28 Schedule II: Scheduled Principal Certain United States Federal Income Tax Balances . . . . . . . . . . . . . . . . . . . . . . . . S-II-1
Consequences . . . . . . . . . . . . . . . . . . . S-74 Exhibit A: Underlying Certificates . . . . . . A-1
S-2

TERMS SHEET
This terms sheet contains selected information for quick reference only. You should read this Sup-plement, particularly “Risk Factors,” and each of the other documents listed under “Available Information.”
Sponsor: Wells Fargo Bank, N.A.
Co-Sponsor: Tribal Capital Markets, LLC
Trustee: U.S. Bank National Association
Tax Administrator: The Trustee
Closing Date: May 29, 2020
Distribution Dates: For the Group 14 and 15 Securities, the 16th day of each month or, if the 16th day is not a Business Day, the first Business Day thereafter, commencing in June 2020. For the Group 1 through 13 and 16 through 25 Securities, the 20th day of each month or, if the 20th day is not a Busi-ness Day, the first Business Day thereafter, commencing in June 2020.
Trust Assets:
Trust Asset Original Term Group or To Maturity
Subgroup(2) Trust Asset Type Certificate Rate (in years)
1 Ginnie Mae II 2.500% 30 2 Underlying Certificates (1) (1)
3 Ginnie Mae II 3.000% 30 4 Ginnie Mae II 5.000% 30 5 Underlying Certificate (1) (1)
6A Underlying Certificate (1) (1)
6B Underlying Certificate (1) (1)
6C Underlying Certificate (1) (1)
6D Underlying Certificate (1) (1)
6E Underlying Certificate (1) (1)
6F Underlying Certificate (1) (1)
6G Underlying Certificate (1) (1)
6H Underlying Certificate (1) (1)
6I Underlying Certificates (1) (1)
6J Underlying Certificate (1) (1)
6K Underlying Certificate (1) (1)
6L Underlying Certificate (1) (1)
7 Ginnie Mae II 4.000% 30 8 Underlying Certificate (1) (1)
9 Ginnie Mae II 3.000% 30 10 Ginnie Mae II 4.000% 30 11 Ginnie Mae II 5.000% 30 12 Ginnie Mae II 4.500% 30
S-3

Trust Asset Original Term Group or To Maturity
Subgroup(2) Trust Asset Type Certificate Rate (in years)
(1) (1) 13A Underlying Certificate (1) (1) 13B Underlying Certificate
13C Underlying Certificates (1) (1)
(1) (1) 13D Underlying Certificate 14A Underlying Certificate (1) (1)
14B Underlying Certificate (1) (1)
(1) (1) 14C Underlying Certificate 15 Underlying Certificates (1) (1)
(1) (1) 16A Underlying Certificates (1) (1) 16B Underlying Certificates
16C Underlying Certificates (1) (1)
(1) (1) 16D Underlying Certificates (1) (1) 16E Underlying Certificates
17 Ginnie Mae II 3.500% 30 18A Ginnie Mae II 4.000% 30 18B Ginnie Mae I 4.000% 30 18C Ginnie Mae I 4.125% 30 18D Ginnie Mae I 4.250% 30 18E Ginnie Mae I 4.375% 30 18F Ginnie Mae II 4.500% 30 18G Ginnie Mae I 4.500% 30 19 Ginnie Mae II 2.500% 30 20 Ginnie Mae II 2.500% 30
(1) (1) 21 Underlying Certificates 22 Underlying Certificates (1) (1)
23 Ginnie Mae II 3.500% 30 24 Ginnie Mae II 2.500% 30 25 Underlying Certificate (1) (1)
(1) Certain information regarding the Underlying Certificates is set forth in Exhibit A to this Supplement.
(2) The Group 6, 13, 14, 16 and 18 Trust Assets consist of the enumerated sub-groups (each, a “Subgroup”).
Security Groups: This series of Securities consists of multiple Security Groups (each, a “Group”), as shown on the front cover of this Supplement and on Schedule I to this Supplement. Payments on each Group will be based solely on payments on the Trust Asset Group with the same numerical designation.
S-4

Assumed Characteristics of the Mortgage Loans Underlying the Group 1, 3, 4, 7, 9, 10, 11, 12, 17, 18, 19, 20, 23 and 24 Trust Assets(1):
Weighted Average Remaining Term Weighted Average Weighted
Principal to Maturity Loan Age Average Balance (in months) (in months) Mortgage Rate(2)
Group 1 Trust Assets $20,000,000(3) 358 1 2.968%
Group 3 Trust Assets $46,771,221(3) 359 1 3.460%
Group 4 Trust Assets $87,710,917 333 25 5.471%
Group 7 Trust Assets $47,832,730 358 1 4.490%
Group 9 Trust Assets $68,635,585 353 0 3.468%
Group 10 Trust Assets $35,910,873 357 3 4.479%
Group 11 Trust Assets $21,377,250 338 21 5.358%
Group 12 Trust Assets $20,331,700 343 17 5.045%
Group 17 Trust Assets $168,122,022 358 2 3.980%
Subgroup 18A Trust Assets $294,532,053 280 69 4.312%
Subgroup 18B Trust Assets $212,523,026 238 113 4.500%
Subgroup 18C Trust Assets $144,903,098 239 113 4.625%
Subgroup 18D Trust Assets $740,646,960 241 110 4.750%
Subgroup 18E Trust Assets $396,125,041 240 111 4.875%
Subgroup 18F Trust Assets $33,178,079 278 71 4.774%
Subgroup 18G Trust Assets $247,526,994 237 115 5.000%
Group 19 Trust Assets $45,931,170(3) 358 1 2.958%
Group 20 Trust Assets $40,000,000(3) 359 0 2.908%
Group 23 Trust Assets $51,034,946 356 1 4.020%
S-5

Weighted Average Remaining Term Weighted Average Weighted
Principal to Maturity Loan Age Average Balance (in months) (in months) Mortgage Rate(2)
Group 24 Trust Assets $90,000,000(3) 359 0 2.908%
(1) As of May 1, 2020. (2) The Mortgage Loans underlying the Group 1, 3, 4, 7, 9, 10, 11, 12, 17, 19, 20, 23
and 24 and Subgroup 18A and 18F Trust Assets may bear interest at rates ranging from 0.25% to 1.50% per annum above the related Certificate Rate.
(3) More than 10% of the Mortgage Loans underlying the Group 1, 3, 19, 20 and 24 Trust Assets may be higher balance Mortgage Loans. See “Risk Factors” in this Supplement.
The actual remaining terms to maturity, loan ages and, in the case of the Group 1, 3, 4, 7, 9, 10, 11, 12, 17, 19, 20, 23 and 24 and Subgroup 18A and 18F Trust Assets, Mortgage Rates of many of the Mortgage Loans underlying the Group 1, 3, 4, 7, 9, 10, 11, 12, 17, 18, 19, 20, 23 and 24 Trust Assets will differ from the weighted averages shown above, perhaps significantly. See “The Trust Assets — The Mortgage Loans” in this Supplement.
Characteristics of the Group 2, 5, 6, 8, 13, 14, 15, 16, 21, 22 and 25 Trust Assets: See Exhibit A to this Supplement for certain information regarding the characteristics of the related Underlying Certifi-cates.
Issuance of Securities: The Securities, other than the Residual Securities, will initially be issued in book-entry form through the book-entry system of the U.S. Federal Reserve Banks (the “Fedwire Book-Entry System”). The Residual Securities will be issued in fully registered, certificated form. See “Description of the Securities — Form of Securities” in this Supplement.
Modification and Exchange: If you own exchangeable Securities you will be able, upon notice and payment of an exchange fee, to exchange them for a proportionate interest in the related Securities shown on Schedule I to this Supplement. See “Description of the Securities — Modification and Exchange” in this Supplement.
Increased Minimum Denomination Classes: Each Class that constitutes a Principal Only or Interest Only Class. See “Description of the Securities — Form of Securities” in this Supplement.
Interest Rates: The Interest Rates for the Fixed Rate Classes are shown on the front cover of this Supplement or on Schedule I to this Supplement.
S-6

The Floating Rate and Inverse Floating Rate Classes will bear interest at per annum rates based on one-month LIBOR (hereinafter referred to as “LIBOR”) as follows:
Initial LIBOR Interest Interest Minimum Maximum Delay for Minimum
Class Rate Formula(1) Rate(2) Rate Rate (in days) Interest Rate
Security Group 6 NA . . . . . . . . . . . . . . . . . . . . . 5.55% � LIBOR 5.37925% 0.00% 5.55% 0 5.55% NB . . . . . . . . . . . . . . . . . . . . . 5.55% � LIBOR 5.37925% 0.00% 5.55% 0 5.55% NC . . . . . . . . . . . . . . . . . . . . . 5.55% � LIBOR 5.37925% 0.00% 5.55% 0 5.55% ND . . . . . . . . . . . . . . . . . . . . 5.55% � LIBOR 5.37925% 0.00% 5.55% 0 5.55% NE . . . . . . . . . . . . . . . . . . . . . 5.55% � LIBOR 5.37925% 0.00% 5.55% 0 5.55% NF . . . . . . . . . . . . . . . . . . . . . 6.44% � LIBOR 6.26925% 0.00% 6.44% 0 6.44% NG . . . . . . . . . . . . . . . . . . . . 6.44% � LIBOR 6.26925% 0.00% 6.44% 0 6.44% NH . . . . . . . . . . . . . . . . . . . . 6.44% � LIBOR 6.26925% 0.00% 6.44% 0 6.44% NI . . . . . . . . . . . . . . . . . . . . . 6.44% � LIBOR 6.26925% 0.00% 6.44% 0 6.44% NJ . . . . . . . . . . . . . . . . . . . . . 6.44% � LIBOR 6.26925% 0.00% 6.44% 0 6.44% NK . . . . . . . . . . . . . . . . . . . . . 6.44% � LIBOR 6.26925% 0.00% 6.44% 0 6.44% NL . . . . . . . . . . . . . . . . . . . . . 6.44% � LIBOR 6.26925% 0.00% 6.44% 0 6.44% SA . . . . . . . . . . . . . . . . . . . . . 5.55% � LIBOR 5.37925% 0.00% 5.55% 0 5.55% SF . . . . . . . . . . . . . . . . . . . . . 6.44% � LIBOR 6.26925% 0.00% 6.44% 0 6.44% TB . . . . . . . . . . . . . . . . . . . . . 5.65% � LIBOR 0.10000% 0.00% 0.10% 0 5.65% TC . . . . . . . . . . . . . . . . . . . . . 5.66% � LIBOR 0.11000% 0.00% 0.11% 0 5.66% TD . . . . . . . . . . . . . . . . . . . . . 5.67% � LIBOR 0.12000% 0.00% 0.12% 0 5.67% TE . . . . . . . . . . . . . . . . . . . . . 5.77% � LIBOR 0.22000% 0.00% 0.22% 0 5.77% TG . . . . . . . . . . . . . . . . . . . . . 6.45% � LIBOR 0.01000% 0.00% 0.01% 0 6.45% TH . . . . . . . . . . . . . . . . . . . . . 6.49% � LIBOR 0.05000% 0.00% 0.05% 0 6.49% TI . . . . . . . . . . . . . . . . . . . . . 6.50% � LIBOR 0.06000% 0.00% 0.06% 0 6.50% TJ . . . . . . . . . . . . . . . . . . . . . 6.60% � LIBOR 0.16000% 0.00% 0.16% 0 6.60% TK . . . . . . . . . . . . . . . . . . . . . 6.65% � LIBOR 0.21000% 0.00% 0.21% 0 6.65% TL . . . . . . . . . . . . . . . . . . . . . 6.75% � LIBOR 0.31000% 0.00% 0.31% 0 6.75% Security Group 13 N . . . . . . . . . . . . . . . . . . . . . . 6.60% � LIBOR 6.42925% 0.00% 6.60% 0 6.60% NM . . . . . . . . . . . . . . . . . . . . 6.60% � LIBOR 6.42925% 0.00% 6.60% 0 6.60% NP . . . . . . . . . . . . . . . . . . . . . 6.60% � LIBOR 6.42925% 0.00% 6.60% 0 6.60% NQ . . . . . . . . . . . . . . . . . . . . 6.60% � LIBOR 6.42925% 0.00% 6.60% 0 6.60% SM . . . . . . . . . . . . . . . . . . . . . 6.60% � LIBOR 6.42925% 0.00% 6.60% 0 6.60% TN . . . . . . . . . . . . . . . . . . . . . 6.62% � LIBOR 0.02000% 0.00% 0.02% 0 6.62% TP . . . . . . . . . . . . . . . . . . . . . 6.65% � LIBOR 0.05000% 0.00% 0.05% 0 6.65% TQ . . . . . . . . . . . . . . . . . . . . . 6.70% � LIBOR 0.10000% 0.00% 0.10% 0 6.70% Security Group 14 NS . . . . . . . . . . . . . . . . . . . . . 6.10% � LIBOR 5.91787% 0.00% 6.10% 0 6.10% NT . . . . . . . . . . . . . . . . . . . . . 6.10% � LIBOR 5.91787% 0.00% 6.10% 0 6.10% NU . . . . . . . . . . . . . . . . . . . . 6.10% � LIBOR 5.91787% 0.00% 6.10% 0 6.10% ST . . . . . . . . . . . . . . . . . . . . . 6.10% � LIBOR 5.91787% 0.00% 6.10% 0 6.10% T . . . . . . . . . . . . . . . . . . . . . . 6.15% � LIBOR 0.05000% 0.00% 0.05% 0 6.15% TU . . . . . . . . . . . . . . . . . . . . . 6.20% � LIBOR 0.10000% 0.00% 0.10% 0 6.20% Security Group 15 SU . . . . . . . . . . . . . . . . . . . . . 5.60% � LIBOR 5.41787% 0.00% 5.60% 0 5.60%
S-7

Initial LIBOR Interest Interest Minimum Maximum Delay for Minimum
Class Rate Formula(1) Rate(2) Rate Rate (in days) Interest Rate
Security Group 16 CN . . . . . . . . . . . . . . . . . . . . . 6.05% � LIBOR 5.87925% 0.00% 6.05% 0 6.05% CT . . . . . . . . . . . . . . . . . . . . . 6.25% � LIBOR 0.20000% 0.00% 0.20% 0 6.25% NV . . . . . . . . . . . . . . . . . . . . . 6.05% � LIBOR 5.87925% 0.00% 6.05% 0 6.05% NW . . . . . . . . . . . . . . . . . . . . 6.05% � LIBOR 5.87925% 0.00% 6.05% 0 6.05% NX . . . . . . . . . . . . . . . . . . . . . 6.05% � LIBOR 5.87925% 0.00% 6.05% 0 6.05% NY . . . . . . . . . . . . . . . . . . . . . 6.05% � LIBOR 5.87925% 0.00% 6.05% 0 6.05% SW . . . . . . . . . . . . . . . . . . . . 6.05% � LIBOR 5.87925% 0.00% 6.05% 0 6.05% TV . . . . . . . . . . . . . . . . . . . . . 6.10% � LIBOR 0.05000% 0.00% 0.05% 0 6.10% TX . . . . . . . . . . . . . . . . . . . . . 6.15% � LIBOR 0.10000% 0.00% 0.10% 0 6.15% TY . . . . . . . . . . . . . . . . . . . . . 6.20% � LIBOR 0.15000% 0.00% 0.15% 0 6.20% Security Group 17 FH . . . . . . . . . . . . . . . . . . . . . LIBOR + 0.45% 0.65000% 0.45% 6.50% 0 0.00% SH . . . . . . . . . . . . . . . . . . . . . 6.05% � LIBOR 5.85000% 0.00% 6.05% 0 6.05%
(1) LIBOR will be established as described under “Description of the Securities — Interest Dis-tributions — Floating Rate and Inverse Floating Rate Classes” in this Supplement.
(2) The initial Interest Rate will be in effect during the first Accrual Period; the Interest Rate will adjust monthly thereafter.
Each of Classes IT, IW, TA, TF, TM, TS and TW is a Weighted Average Coupon Class. Class IW will accrue interest during each Accrual Period at a per annum Interest Rate equal to the total interest accrued on the Group 22 Trust Assets for that Accrual Period, multiplied by 12, and divided by the Class Notional Balance of Class IW (before giving effect to any payments on such Distribution Date) for such Accrual Period. Each of Classes IT, TA, TF, TM, TS and TW will accrue interest during each Accrual Period at an equivalent annualized rate derived by aggregating the accrued interest on its related REMIC Classes for such Accrual Period expressed as a percentage of its outstanding notional balance for such Accrual Period. The approximate initial Interest Rate for each Weighted Average Coupon Class, which will be in effect for the first Accrual Period, is as follows:
Approximate Initial Class Interest Rate
IT . . . . . . . . . . . . . . . . . . . . . . . . . . . . . . . . . . . . . . . . . . . . . . . . . . . . . . . . . . . 0.12654% IW . . . . . . . . . . . . . . . . . . . . . . . . . . . . . . . . . . . . . . . . . . . . . . . . . . . . . . . . . . . 5.65317% TA . . . . . . . . . . . . . . . . . . . . . . . . . . . . . . . . . . . . . . . . . . . . . . . . . . . . . . . . . . . 0.13813% TF . . . . . . . . . . . . . . . . . . . . . . . . . . . . . . . . . . . . . . . . . . . . . . . . . . . . . . . . . . . 0.11631% TM . . . . . . . . . . . . . . . . . . . . . . . . . . . . . . . . . . . . . . . . . . . . . . . . . . . . . . . . . . 0.06191% TS . . . . . . . . . . . . . . . . . . . . . . . . . . . . . . . . . . . . . . . . . . . . . . . . . . . . . . . . . . . 0.07338% TW . . . . . . . . . . . . . . . . . . . . . . . . . . . . . . . . . . . . . . . . . . . . . . . . . . . . . . . . . . 0.10930%
Allocation of Principal: On each Distribution Date for a Security Group, the following distributions will be made to the related Securities:
SECURITY GROUP 1
The Group 1 Principal Distribution Amount will be allocated to JE, until retired
S-8

SECURITY GROUP 3
The Group 3 Principal Distribution Amount and the AZ Accrual Amount will be allocated in the following order of priority:
1. Sequentially, to AB and AC, in that order, until reduced to their Aggregate Scheduled Principal Balance for that Distribution Date
2. To AZ, until retired
3. Sequentially, to AB and AC, in that order, without regard to their Aggregate Scheduled Principal Balance, until retired
SECURITY GROUP 4
The Group 4 Principal Distribution Amount will be allocated to GT, until retired
SECURITY GROUP 5
The Group 5 Principal Distribution Amount will be allocated to DL, until retired
SECURITY GROUP 7
The Group 7 Principal Distribution Amount, the KZ Accrual Amount and the ZK Accrual Amount will be allocated as follows:
� The ZK Accrual Amount in the following order of priority:
1. Concurrently:
a. 90.2069548512%, concurrently, to KA and KC, pro rata, until retired
b. 9.7930451488%, sequentially, to UA and KY, in that order, until retired
2. To ZK, until retired
� The Group 7 Principal Distribution Amount and the KZ Accrual Amount in the following order of priority:
1. To KA, KC, KY, UA and ZK, until reduced to their Aggregate Scheduled Principal Balance for that Distribution Date, in the following order of priority:
a. Concurrently:
i. 90.2069548512%, concurrently, to KA and KC, pro rata, until retired
ii. 9.7930451488%, sequentially, to UA and KY, in that order, until retired
b. To ZK, until retired
2. To KZ, until retired
3. To KA, KC, KY, UA and ZK, in the same manner and priority as step 1. above, but without regard to their Aggregate Scheduled Principal Balance, until retired
SECURITY GROUP 8
The Group 8 Principal Distribution Amount will be allocated to HT, until retired
S-9

SECURITY GROUP 9
The Group 9 Principal Distribution Amount and the ZA Accrual Amount will be allocated in the following order of priority:
1. To AP, until reduced to its Scheduled Principal Balance for that Distribution Date
2. To ZA, until retired
3. To AP, without regard to its Scheduled Principal Balance, until retired
SECURITY GROUP 10
The Group 10 Principal Distribution Amount will be allocated in the following order of priority:
1. To CA, CD and CW, until reduced to their Aggregate Scheduled Principal Balance for that Dis-tribution Date, in the following order of priority:
a. Concurrently, to CA and CD, pro rata, until retired
b. To CW, until retired
2. To CS, until retired
3. To CA, CD and CW, in the same manner and priority as step 1. above, but without regard to their Aggregate Scheduled Principal Balance, until retired
SECURITY GROUP 11
The Group 11 Principal Distribution Amount will be allocated to D, until retired
SECURITY GROUP 12
The Group 12 Principal Distribution Amount will be allocated to BP, until retired
SECURITY GROUP 17
The Group 17 Principal Distribution Amount will be allocated, concurrently, to FH, H and HK, pro rata, until retired
SECURITY GROUP 18
The Subgroup 18A Principal Distribution Amount, the Subgroup 18B Principal Distribution Amount, the Subgroup 18C Principal Distribution Amount, the Subgroup 18D Principal Distribution Amount, the Subgroup 18E Principal Distribution Amount, the Subgroup 18F Principal Distribution Amount and the Subgroup 18G Principal Distribution Amount will be allocated as follows:
� The Subgroup 18A Principal Distribution Amount and the Subgroup 18B Principal Distribution Amount, sequentially, to AD, AQ and BQ, in that order, until retired
� The Subgroup 18C Principal Distribution Amount, sequentially, to AE, AT and BT, in that order, until retired
� The Subgroup 18D Principal Distribution Amount, sequentially, to AF, AU and BU, in that order, until retired
� The Subgroup 18E Principal Distribution Amount, sequentially, to AG, AV and BV, in that order, until retired
S-10

� The Subgroup 18F Principal Distribution Amount and the Subgroup 18G Principal Distribution Amount, sequentially, to AH, AW and BW, in that order, until retired
SECURITY GROUP 19
The Group 19 Principal Distribution Amount and the ZD Accrual Amount will be allocated as fol-lows:
� The ZD Accrual Amount in the following order of priority:
1. Sequentially, to DP and DQ, in that order, until reduced to their Aggregate Scheduled Principal Balance for that Distribution Date
2. To ZD, until retired
� The Group 19 Principal Distribution Amount, concurrently, as follows:
1. 26.0299378396%, sequentially, to AJ and AK, in that order, until retired
2. 60.9550899748% in the following order of priority:
a. Concurrently, to AM and AN, pro rata, until retired
b. To AL, until retired
3. 13.0149721856% in the following order of priority:
a. Sequentially, to DP and DQ, in that order, until reduced to their Aggregate Scheduled Principal Balance for that Distribution Date
b. To ZD, until retired
c. Sequentially, to DP and DQ, in that order, without regard to their Aggregate Scheduled Principal Balance, until retired
SECURITY GROUP 20
The Group 20 Principal Distribution Amount and the ZQ Accrual Amount will be allocated in the following order of priority:
1. Sequentially, to QA and QP, in that order, until reduced to their Aggregate Scheduled Principal Balance for that Distribution Date
2. To ZQ, until retired
3. Sequentially, to QA and QP, in that order, without regard to their Aggregate Scheduled Principal Balance, until retired
SECURITY GROUP 23
The Group 23 Principal Distribution Amount, the UZ Accrual Amount and the ZU Accrual Amount will be allocated as follows:
� The ZU Accrual Amount, sequentially, to UH, KU, KW and ZU, in that order, until retired
� The Group 23 Principal Distribution Amount and the UZ Accrual Amount in the following order of priority:
1. Sequentially, to UH, KU, KW and ZU, in that order, until reduced to their Aggregate Sched-uled Principal Balance for that Distribution Date
S-11

2. To UZ, until retired
3. Sequentially, to UH, KU, KW and ZU, in that order, without regard to their Aggregate Scheduled Principal Balance, until retired
SECURITY GROUP 24
The Group 24 Principal Distribution Amount will be allocated, concurrently, to UQ, UT and UV, pro rata, until retired
SECURITY GROUP 25
The Group 25 Principal Distribution Amount will be allocated to BA, until retired
Scheduled Principal Balances: The Scheduled Principal Balances or Aggregate Scheduled Principal Balances for the Classes listed below are included in Schedule II to this Supplement. They were calcu-lated using among other things the following Structuring Ranges:
Security Group Class Structuring Ranges
PAC Classes 3 AB and AC (in the aggregate) . . . . . . . . . . . . . . 130% PSA through 250% PSA 7 KA, KC, KY, UA and ZK (in the aggregate) . . . 430% PSA through 550% PSA 9 AP . . . . . . . . . . . . . . . . . . . . . . . . . . . . . . . . . . . . 125% PSA through 250% PSA 10 CA, CD and CW (in the aggregate) . . . . . . . . . . 185% PSA through 400% PSA 19 DP and DQ (in the aggregate) . . . . . . . . . . . . . . 110% PSA through 185% PSA 20 QA and QP (in the aggregate) . . . . . . . . . . . . . . 125% PSA through 450% PSA 23 KU, KW, UH and ZU (in the aggregate) . . . . . . 440% PSA through 550% PSA
Accrual Classes: Interest will accrue on each Accrual Class identified on the front cover of this Supplement at the per annum rate set forth on that page. However, no interest will be distributed to the Accrual Classes as interest. Interest so accrued on each Accrual Class on each Distribution Date will constitute an Accrual Amount, which will be added to the Class Principal Balance of that Class on each Distribution Date and will be distributable as principal as set forth in this Terms Sheet under “Allocation of Principal.”
Notional Classes: The Notional Classes will not receive distributions of principal but have Class Notional Balances for convenience in describing their entitlements to interest. The Class Notional Balance of each Notional Class represents the percentage indicated below of, and reduces to that extent with, the Class Principal Balances or the outstanding principal or notional balance of the related Trust Asset Group or Subgroups indicated:
Original Class Class Notional Balance Represents Approximately
Security Group 1 JI . . . . . . . . . . . . . . . . . . $ 3,600,000 18% of JE (PT Class) Security Group 2 IJ . . . . . . . . . . . . . . . . . . $ 91,965,792 100% of the Group 2 Trust Assets Security Group 4 GI . . . . . . . . . . . . . . . . . $ 70,168,733 80% of GT (PT Class)
S-12

Original Class Class Notional Balance Represents Approximately
Security Group 5 DI . . . . . . . . . . . . . . . . . $ 9,252,787 40.9090909091% of DL (SC/PT Class) Security Group 6 IT . . . . . . . . . . . . . . . . . . $ 193,666,280 100% of the Subgroup 6B Trust Assets, the Subgroup 6C Trust
Assets, the Subgroup 6D Trust Assets, the Subgroup 6E Trust Assets, the Subgroup 6G Trust Assets, the Subgroup 6H Trust Assets, the Subgroup 6I Trust Assets, the Subgroup 6J Trust
Assets, the Subgroup 6K Trust Assets and the Subgroup 6L Trust Assets (in the aggregate)
NA . . . . . . . . . . . . . . . . . 16,150,012 100% of the Subgroup 6A Trust Assets NB . . . . . . . . . . . . . . . . . 9,507,253 100% of the Subgroup 6B Trust Assets NC . . . . . . . . . . . . . . . . . 19,225,270 100% of the Subgroup 6C Trust Assets ND . . . . . . . . . . . . . . . . . 41,762,689 100% of the Subgroup 6D Trust Assets NE . . . . . . . . . . . . . . . . . 20,291,016 100% of the Subgroup 6E Trust Assets NF . . . . . . . . . . . . . . . . . 21,902,917 100% of the Subgroup 6F Trust Assets NG . . . . . . . . . . . . . . . . . 18,236,020 100% of the Subgroup 6G Trust Assets NH . . . . . . . . . . . . . . . . . 5,413,517 100% of the Subgroup 6H Trust Assets NI . . . . . . . . . . . . . . . . . 41,347,619 100% of the Subgroup 6I Trust Assets NJ . . . . . . . . . . . . . . . . . 11,523,914 100% of the Subgroup 6J Trust Assets NK . . . . . . . . . . . . . . . . . 9,823,184 100% of the Subgroup 6K Trust Assets NL . . . . . . . . . . . . . . . . . 16,535,798 100% of the Subgroup 6L Trust Assets SA . . . . . . . . . . . . . . . . . 106,936,240 100% of the Subgroup 6A Trust Assets, the Subgroup 6B Trust
Assets, the Subgroup 6C Trust Assets, the Subgroup 6D Trust Assets and the Subgroup 6E Trust Assets (in the aggregate)
SF . . . . . . . . . . . . . . . . . 124,782,969 100% of the Subgroup 6F Trust Assets, the Subgroup 6G Trust Assets, the Subgroup 6H Trust Assets, the Subgroup 6I Trust Assets, the Subgroup 6J Trust Assets, the Subgroup 6K Trust Assets and the Subgroup 6L Trust Assets (in the aggregate)
TA . . . . . . . . . . . . . . . . . 90,786,228 100% of the Subgroup 6B Trust Assets, the Subgroup 6C Trust Assets, the Subgroup 6D Trust Assets and the Subgroup 6E
Trust Assets (in the aggregate) TB . . . . . . . . . . . . . . . . . 9,507,253 100% of the Subgroup 6B Trust Assets TC . . . . . . . . . . . . . . . . . 19,225,270 100% of the Subgroup 6C Trust Assets TD . . . . . . . . . . . . . . . . . 41,762,689 100% of the Subgroup 6D Trust Assets TE . . . . . . . . . . . . . . . . . 20,291,016 100% of the Subgroup 6E Trust Assets TF . . . . . . . . . . . . . . . . . 102,880,052 100% of the Subgroup 6G Trust Assets, the Subgroup 6H Trust
Assets, the Subgroup 6I Trust Assets, the Subgroup 6J Trust Assets, the Subgroup 6K Trust Assets and the Subgroup 6L Trust
Assets (in the aggregate) TG . . . . . . . . . . . . . . . . . 18,236,020 100% of the Subgroup 6G Trust Assets TH . . . . . . . . . . . . . . . . . 5,413,517 100% of the Subgroup 6H Trust Assets TI . . . . . . . . . . . . . . . . . . 41,347,619 100% of the Subgroup 6I Trust Assets TJ . . . . . . . . . . . . . . . . . . 11,523,914 100% of the Subgroup 6J Trust Assets TK . . . . . . . . . . . . . . . . . 9,823,184 100% of the Subgroup 6K Trust Assets TL . . . . . . . . . . . . . . . . . 16,535,798 100% of the Subgroup 6L Trust Assets Security Group 7 KI . . . . . . . . . . . . . . . . . . $ 812,500 12.5% of KC (PAC/AD Class)
S-13

Original Class Class Notional Balance Represents Approximately
Security Group 8 HI . . . . . . . . . . . . . . . . . $ 52,188,947 44.4444444444% of HT (SC/PT Class) Security Group 9 IA . . . . . . . . . . . . . . . . . . $ 23,794,166 41.6666666667% of AP (PAC/AD Class) Security Group 10 CI . . . . . . . . . . . . . . . . . . $ 6,562,500 43.75% of CA (PAC Class)
3,358,125 31.25% of CD (PAC Class)
$ 9,920,625
IC . . . . . . . . . . . . . . . . . . $ 13,466,577 37.5% of the Group 10 Trust Assets Security Group 11 BI . . . . . . . . . . . . . . . . . . $ 17,101,800 80% of D (PT Class) Security Group 12 IG . . . . . . . . . . . . . . . . . $ 15,813,544 77.7777777778% of BP (PT Class) Security Group 13 N . . . . . . . . . . . . . . . . . . $ 3,818,824 100% of the Subgroup 13B Trust Assets NM . . . . . . . . . . . . . . . . . 9,508,968 100% of the Subgroup 13A Trust Assets NP . . . . . . . . . . . . . . . . . 57,348,779 100% of the Subgroup 13C Trust Assets NQ . . . . . . . . . . . . . . . . . 22,144,656 100% of the Subgroup 13D Trust Assets SM . . . . . . . . . . . . . . . . . 92,821,227 100% of the Group 13 Trust Assets TM . . . . . . . . . . . . . . . . . 83,312,259 100% of the Subgroup 13B Trust Assets, the Subgroup 13C Trust
Assets and the Subgroup 13D Trust Assets (in the aggregate) TN . . . . . . . . . . . . . . . . . 3,818,824 100% of the Subgroup 13B Trust Assets TP . . . . . . . . . . . . . . . . . 57,348,779 100% of the Subgroup 13C Trust Assets TQ . . . . . . . . . . . . . . . . . 22,144,656 100% of the Subgroup 13D Trust Assets Security Group 14 NS . . . . . . . . . . . . . . . . . $ 17,112,566 100% of the Subgroup 14A Trust Assets NT . . . . . . . . . . . . . . . . . 14,186,469 100% of the Subgroup 14B Trust Assets NU . . . . . . . . . . . . . . . . . 12,463,818 100% of the Subgroup 14C Trust Assets ST . . . . . . . . . . . . . . . . . 43,762,853 100% of the Group 14 Trust Assets T . . . . . . . . . . . . . . . . . . 14,186,469 100% of the Subgroup 14B Trust Assets TS . . . . . . . . . . . . . . . . . 26,650,287 100% of the Subgroup 14B Trust Assets and the Subgroup 14C
Trust Assets (in the aggregate) TU . . . . . . . . . . . . . . . . . 12,463,818 100% of the Subgroup 14C Trust Assets Security Group 15 SU . . . . . . . . . . . . . . . . . $ 54,183,602 100% of the Group 15 Trust Assets Security Group 16 CN . . . . . . . . . . . . . . . . . $ 20,623,163 100% of the Subgroup 16E Trust Assets CT . . . . . . . . . . . . . . . . . 20,623,163 100% of the Subgroup 16E Trust Assets
Assets, the Subgroup 16D Trust Assets and the Subgroup 16E Trust Assets (in the aggregate)
NV . . . . . . . . . . . . . . . . . 199,482,873 100% of the Subgroup 16B Trust Assets NW . . . . . . . . . . . . . . . . 385,385,353 100% of the Subgroup 16A Trust Assets NX . . . . . . . . . . . . . . . . . 56,133,267 100% of the Subgroup 16C Trust Assets NY . . . . . . . . . . . . . . . . . 257,577,610 100% of the Subgroup 16D Trust Assets SW . . . . . . . . . . . . . . . . . 919,202,266 100% of the Group 16 Trust Assets TV . . . . . . . . . . . . . . . . . 199,482,873 100% of the Subgroup 16B Trust Assets TW . . . . . . . . . . . . . . . . . 533,816,913 100% of the Subgroup 16B Trust Assets, the Subgroup 16C Trust
S-14

Original Class Class Notional Balance Represents Approximately
TX . . . . . . . . . . . . . . . . . $ 56,133,267 100% of the Subgroup 16C Trust Assets TY . . . . . . . . . . . . . . . . . 257,577,610 100% of the Subgroup 16D Trust Assets Security Group 17 SH . . . . . . . . . . . . . . . . . $ 50,485,118 100% of FH (PT Class) Security Group 18 AI . . . . . . . . . . . . . . . . . . $ 56,339,453 11.1111111111% of AD, AQ and BQ (in the aggregate) (SEQ
Classes) AY . . . . . . . . . . . . . . . . . 162,967,000 87.5% of AD, AE, AF, AG and AH (in the aggregate) (SEQ
Classes) EI . . . . . . . . . . . . . . . . . . 1,046,215,139 55.5555555556% of AQ, AT, AU, AV, AW, BQ, BT, BU, BV and
BW (in the aggregate) (SEQ Classes) FI . . . . . . . . . . . . . . . . . . 77,024,313 19.4444444444% of AG, AV and BV (in the aggregate) (SEQ
Classes) IE . . . . . . . . . . . . . . . . . . 20,125,430 13.8888888889% of AE, AT and BT (in the aggregate) (SEQ
Classes) IF . . . . . . . . . . . . . . . . . . 123,441,160 16.6666666667% of AF, AU and BU (in the aggregate) (SEQ
Classes) IH . . . . . . . . . . . . . . . . . 62,378,905 22.2222222222% of AH, AW and BW (in the aggregate) (SEQ
Classes) IO . . . . . . . . . . . . . . . . . $ 56,339,453 11.1111111111% of AD, AQ and BQ (in the aggregate) (SEQ
Classes) 20,125,430 13.8888888889% of AE, AT and BT (in the aggregate) (SEQ
Classes) 123,441,160 16.6666666667% of AF, AU and BU (in the aggregate) (SEQ
Classes) 77,024,313 19.4444444444% of AG, AV and BV (in the aggregate) (SEQ
Classes) 62,378,905 22.2222222222% of AH, AW and BW (in the aggregate) (SEQ
Classes)
$ 339,309,261
XI . . . . . . . . . . . . . . . . . . $ 235,398,125 62.5% of AQ, AT, AU, AV and AW (in the aggregate) (SEQ Classes)
YI . . . . . . . . . . . . . . . . . . 836,972,361 55.5555555556% of BQ, BT, BU, BV and BW (in the aggregate) (SEQ Classes)
Security Group 20 IQ . . . . . . . . . . . . . . . . . $ 16,000,000 40% of the Group 20 Trust Assets QI . . . . . . . . . . . . . . . . . 7,528,990 30% of QA (PAC/AD Class) Security Group 21 IY . . . . . . . . . . . . . . . . . . $ 38,554,268 100% of the Group 21 Trust Assets Security Group 22 IW . . . . . . . . . . . . . . . . . $ 22,279,518 100% of the Group 22 Trust Assets Security Group 23 IK . . . . . . . . . . . . . . . . . . $ 33,487,142 71.4285714286% of KU, KW and UH (in the aggregate)
(PAC/AD Classes) IU . . . . . . . . . . . . . . . . . 30,165,000 71.4285714286% of KU and UH (in the aggregate) (PAC/AD
Classes) UI . . . . . . . . . . . . . . . . . 26,467,142 71.4285714286% of UH (PAC/AD Class)
S-15

Original Class Class Notional Balance Represents Approximately
Security Group 24 ID . . . . . . . . . . . . . . . . . $ 19,080,000 21.2% of UQ, UT and UV (in the aggregate) (PT Classes) Security Group 25 IB . . . . . . . . . . . . . . . . . . $ 5,730,256 50% of BA (SC/PT Class)
Tax Status: Double REMIC Series. See “Certain United States Federal Income Tax Consequences” in this Supplement and in the Base Offering Circular.
Regular and Residual Classes: Class RR is a Residual Class and represents the Residual Interest of the Issuing REMIC and the Pooling REMIC. All other Classes of REMIC Securities are Regular Classes.
S-16

RISK FACTORS
You should purchase securities only if you understand and are able to bear the associated risks. The risks applicable to your investment depend on the principal and interest type of your securities. This sec-tion highlights certain of these risks.
The rate of principal payments on the underlying mortgage loans will affect the rate of principal payments on your securities. The rate at which you will receive principal payments will depend largely on the rate of principal payments, including prepay-ments, on the mortgage loans underlying the related trust assets. Any historical data regarding mortgage loan prepayment rates may not be indicative of the rate of future prepayments on the underlying mortgage loans, and no assur-ances can be given about the rates at which the underlying mortgage loans will prepay. We expect the rate of principal payments on the underlying mortgage loans to vary. Borrowers generally may prepay their mortgage loans at any time without penalty.
The terms of the mortgage loans may be modi-fied to permit, among other things, a partial release of security, which releases a portion of the mortgaged property from the lien securing the related mortgage loan. Partial releases of security may reduce the value of the remaining security and also allow the related borrower to sell the released property and generate proceeds that may be used to prepay the related mortgage loan in whole or in part.
In addition to voluntary prepayments, mortgage loans can be prepaid as a result of governmental mortgage insurance claim payments, loss miti-gation arrangements, repurchases or liquidations of defaulted mortgage loans. Although under certain circumstances Ginnie Mae issuers have the option to repurchase defaulted mortgage loans from the related pool underlying a Ginnie Mae MBS certificate, they are not obligated to do so. Defaulted mortgage loans that remain in pools backing Ginnie Mae MBS certificates may be subject to governmental mortgage insurance claim payments, loss mitigation arrangements or foreclosure, which could have the same effect as voluntary prepayments on the cash flow avail-able to pay the securities.
A catastrophic weather event, pandemic or other natural disaster may affect the rate of principal payments, including prepayments, on the under-lying mortgage loans. Any such event may damage the related mortgaged properties that secure the mortgage loans or may lead to a general economic downturn in the affected regions, including job losses and declines in real estate values. A general economic downturn may increase the rate of defaults on the mortgage loans in such areas resulting in prepayments on the related securities due to governmental mort-gage insurance claim payments, loss mitigation arrangements, repurchases or liquidations of defaulted mortgage loans. Insurance payments on damaged or destroyed homes may also lead to prepayments on the underlying mortgage loans. Further, in connection with presidentially declared major disasters, Ginnie Mae may authorize optional special assistance to issuers, including expanded buyout authority which allows issuers, upon receiving written approval from Ginnie Mae, to repurchase eligible loans from the related pool underlying a Ginnie Mae MBS certificate, even if such loans are not delin-quent or do not otherwise meet the standard conditions for removal or repurchase.
No assurances can be given as to the timing or frequency of any governmental mortgage insurance claim payments, issuer repurchases, loss mitigation arrangements or foreclosure pro-ceedings with respect to defaulted mortgage loans and the resulting effect on the timing or rate of principal payments on your securities.
Rates of principal payments can reduce your yield. The yield on your securities prob-ably will be lower than you expect if:
� you bought your securities at a premium (interest only securities, for example) and principal payments are faster than you expected, or
S-17

� you bought your securities at a discount (principal only securities, for example) and principal payments are slower than you expected.
In addition, if your securities are interest only securities or securities purchased at a significant premium, you could lose money on your investment if prepayments occur at a rapid rate.
Under certain circumstances, a Ginnie Mae issuer has the right to repurchase a defaulted mortgage loan from the related pool of mortgage loans underlying a particular Ginnie Mae MBS certificate, the effect of which would be comparable to a prepayment of such mortgage loan. At its option and without Ginnie Mae’s prior consent, a Ginnie Mae issuer may repurchase any mortgage loan at an amount equal to par less any amounts previously advanced by such issuer in con-nection with its responsibilities as servicer of such mortgage loan to the extent that (i) in the case of a mortgage loan included in a pool of mortgage loans underlying a Ginnie Mae MBS certificate issued on or before December 1, 2002, such mortgage loan has been delinquent for four consecutive months, and at least one delinquent payment remains uncured or (ii) in the case of a mortgage loan included in a pool of mortgage loans underlying a Ginnie Mae MBS certificate issued on or after January 1, 2003, no payment has been made on such mortgage loan for three consecutive months. Any such repurchase will result in prepayment of the principal balance or reduction in the notional balance of the securities ultimately backed by such mortgage loan. No assurances can be given as to the timing or fre-quency of any such repurchases.
The levels of LIBOR will affect the yields on the floating rate, inverse floating rate and weighted average coupon securities. If LIBOR performs differently from what you expect, the yield on the floating rate, inverse floating rate and weighted average coupon secu-rities may be lower than you expect. Lower lev-els of LIBOR will generally reduce the yield on floating rate securities; higher levels of LIBOR will generally reduce the yield on the inverse
floating rate and weighted average coupon secu-rities. You should bear in mind that the timing of changes in the level of LIBOR may affect your yield: generally, the earlier a change, the greater the effect on your yield. It is doubtful that LIBOR will remain constant.
An investment in the securities is subject to significant reinvestment risk. The rate of principal payments on your securities is uncertain. You may be unable to reinvest the payments on your securities at the same returns provided by the securities. Lower prevailing interest rates may result in an unexpected return of principal. In that interest rate climate, higher yielding reinvestment opportunities may be lim-ited. Conversely, higher prevailing interest rates may result in slower returns of principal, and you may not be able to take advantage of higher yielding investment opportunities. The final payment on your security may occur much ear-lier than the final distribution date.
Support securities will be more sensitive to rates of principal payments than other securities. If principal prepayments result in principal distributions on any distribution date equal to or less than the amount needed to produce scheduled payments on the PAC classes, the related support class will not receive any principal distribution on that date. If prepay-ments result in principal distributions on any distribution date greater than the amount needed to produce scheduled payments on the PAC classes for that distribution date, this excess will be distributed to the related support class.
The rate of payments on the underlying cer-tificates will directly affect the rate of payments on the group 2, 5, 6, 8, 13, 14, 15, 16, 21, 22 and 25 securities. The underlying certificates will be sensitive in varying degrees to:
� the rate of payments of principal (including prepayments) of the related mortgage loans, and
� the priorities for the distribution of principal among the classes of the related underlying series.
S-18
As described in the related underlying certificate disclosure documents, the reductions in notional balance of certain of the underlying certificates included in trust asset groups 2, 6, 13, 16, 21 and 22 on any payment date are calculated, directly or indirectly, on the basis of schedules; no assurance can be given that the underlying certificates will adhere to their schedules. Fur-ther, prepayments on the related mortgage loans may have occurred at rates faster or slower than those initially assumed.
In addition, the trust assets underlying certain of the underlying certificates included in trust asset groups 2, 6, 14, 15, 16 and 22 are also previously issued certificates that represent beneficial ownership interests in separate trusts. The rate of payments on the previously issued certificates backing these underlying certificates will directly affect the timing and rate of payments on your securities. You should read the related under-lying certificate disclosure documents, including the risk factors contained therein, to understand the payments on and related risks of the pre-viously issued certificates backing these underlying certificates.
This supplement contains no information as to whether the underlying certificates or the related classes with which the notional underlying certificates reduce have adhered to any applicable principal balance schedules, whether any related supporting classes remain outstanding or whether the underlying certificates otherwise have performed as origi-nally anticipated. Additional information as to the underlying certificates may be obtained by per-forming an analysis of current principal factors of the underlying certificates in light of applicable information contained in the related underlying certificate disclosure documents.
Up to 10% of the mortgage loans underlying the group 4 through 13, 15, 17, 18, 21, 23 and 25 and subgroup 14B, 14C, 16A, 16C, 16D and 16E trust assets and up to 100% of the mortgage loans underlying the group 1, 2, 3, 19, 20, 22 and 24 and subgroup 14A and 16B trust assets may be higher balance mortgage loans. Subject to special pooling parameters set forth in the Ginnie Mae Mortgage-
Backed Securities Guide, qualifying federally-insured or guaranteed mortgage loans that exceed certain balance thresholds established by Ginnie Mae (“higher balance mortgage loans”) may be included in Ginnie Mae guaranteed pools. There are no historical performance data regarding the prepayment rates for higher bal-ance mortgage loans. If the higher balance mort-gage loans prepay faster or slower than expected, the weighted average lives and yields of the related securities are likely to be affected, perhaps significantly. Furthermore, higher bal-ance mortgage loans tend to be concentrated in certain geographic areas, which may experience relatively higher rates of defaults in the event of adverse economic conditions. No assurances can be given about the prepayment experience or performance of the higher balance mortgage loans.
Changes to, the elimination of, and uncertainty with respect to, LIBOR could adversely affect your investment in LIBOR Classes. On July 27, 2017, the U.K.-based Financial Conduct Authority (the “FCA”) announced its intention to cease sustaining LIBOR after 2021. The FCA indicated that it does not intend to sustain LIBOR through using its influence or legal powers beyond that date. It is possible that the ICE Benchmark Administration (“ICE”) and the reference banks could continue to produce LIBOR on the current basis after 2021, if they are willing and able to do so, but it cannot be predicted or assured whether LIBOR will survive in its current form, a modified form, or at all. If LIBOR changes in a manner that causes regulators or market participants to ques-tion LIBOR’s continued viability as a benchmark, or if LIBOR becomes unavailable, investors in financial instruments linked to LIBOR will likely experience disparate outcomes based on relevant contractual terms, market or product type, juris-diction, and a host of other factors. There can be no assurance that legislative or regulatory actions will provide for an effective LIBOR substitute or replacement or that broadly accepted industry practices regarding LIBOR cessation will develop. It is uncertain what effect such disparate out-comes or divergent industry practices will have on the performance or value of securities with an interest rate based on LIBOR (“LIBOR Classes”).
S-19
In the event of a benchmark transition event with respect to LIBOR, Ginnie Mae will select an alternative index for LIBOR Classes in accord-ance with the ARRC Endorsed Terms, as described under “Description of the Securities — Interest Rate Indices — Determination of LIBOR” in the base offering circular. The ARRC Endorsed Terms, however, generally rely on actions to be taken by regulators or the Alternative Reference Rates Committee (“ARRC”) convened by the Federal Reserve Board and the Federal Reserve Bank of New York, and there can be no assur-ance whether or when those actions will be taken. Further, there can be no assurance that those actions or related events will be sufficient to trigger a change from LIBOR to an alternative index in all circumstances where LIBOR is no longer representative of market interest rates, or that benchmark transition events for the LIBOR Classes will align with similar events in the market generally or in other parts of the financial markets, such as the derivatives market.
The ARRC Endorsed Terms provide for various alternative benchmarks based on availability: the first two alternatives involve the secured over-night financing rate (“SOFR”) published by the Federal Reserve Bank of New York, and the last two alternatives are not currently specified. SOFR is a secured, risk-free rate that is calculated based on different criteria than LIBOR, which is an unsecured rate reflecting counterparty risk. Accordingly, SOFR and LIBOR may diverge, par-ticularly in times of macroeconomic stress. Since the initial publication of SOFR in April 2018, daily changes in SOFR have at times been more volatile than daily changes in comparable benchmark or market rates. Over the lives of the LIBOR Classes, SOFR may diverge from historical or indicative data. Term SOFR, which is the first alternative benchmark, is expected to be a pro-spective term rate based on SOFR. Term SOFR is currently in development and no assurance can be provided that its development will be com-pleted. If term SOFR is unavailable as of the benchmark replacement date, as defined in the base offering circular under “Description of the Securities — Interest Rate Indices — Determi-nation of LIBOR”, the next alternative benchmark is compounded SOFR. Compounded SOFR is a
compounded average for which there are multi-ple methodologies, which may also diverge from LIBOR. If a benchmark replacement other than term SOFR is chosen because term SOFR is not initially available, term SOFR will become the benchmark replacement if it later becomes avail-able, which could lead to further volatility in the interest rates on the LIBOR Classes. Moreover, a benchmark replacement adjustment will be applied to compensate for the foregoing effects of any benchmark replacement. However, no assurance can be provided that any benchmark replacement adjustment will be sufficient to produce the economic equivalent of the then-current benchmark, either at the benchmark replacement date or over the lives of the LIBOR Classes. Additionally, Ginnie Mae cannot antici-pate how long it will take to develop the systems and processes necessary to adopt a specific benchmark replacement, which may delay and contribute to uncertainty and volatility surround-ing any benchmark transition for LIBOR Classes.
Ginnie Mae will have sole discretion with respect to certain elements of the benchmark replace-ment process, including determining whether a benchmark transition event and its related benchmark replacement date have occurred, determining which benchmark replacement is available, determining the earliest practicable index determination date for using the bench-mark replacement, selecting a benchmark replacement in the event term SOFR or com-pounded SOFR is unavailable, determining benchmark replacement adjustments (if not otherwise determined by applicable governing bodies or authorities) and making benchmark replacement conforming changes (including potential changes affecting the business day convention and index determination date). If Ginnie Mae, in its sole discretion, determines that an alternative index is not administratively fea-sible, including as a result of technical, admin-istrative or operational issues, then such alternative index will be deemed not determi-nable as of such date. Ginnie Mae may determine an alternative not to be admin-istratively feasible even if such alternative index has been adopted by other market participants in similar products. Furthermore, if Ginnie Mae
S-20

does not select an alternative index on any date as a result of its determination that an alternative higher on the list of ARRC Endorsed Terms is not administratively feasible as of such date and such higher alternative subsequently becomes admin-istratively feasible (as determined by Ginnie Mae in its sole discretion), then Ginnie Mae may elect to replace the previously selected alternative with such higher alternative. Any of the foregoing determinations will be at the sole discretion of Ginnie Mae and may adversely affect the return on LIBOR Classes, the trading market for such classes and the value of such classes. None of the foregoing determinations, or the application thereof to payment calculations on the LIBOR Classes, will be subject to the approval of secu-rity holders.
Notwithstanding the foregoing, Ginnie Mae will select only an alternative index as to which it and the trustee will receive an opinion of coun-sel that the selection of such alternative index will not cause any related Trust REMIC to lose its classification as a REMIC for United States federal income tax purposes.
The securities may not be a suitable invest-ment for you. The securities, especially the group 2, 5, 6, 8, 13, 14, 15, 16, 21, 22 and 25 securities and, in particular, the support, interest only, principal only, accrual and residual classes, are not suitable investments for all investors.
In addition, although the sponsor intends to make a market for the purchase and sale of the secu-rities after their initial issuance, it has no obligation to do so. There is no assurance that a secondary market will develop, that any secondary market will continue, or that the price at which you can sell an investment in any class will enable you to realize a desired yield on that investment.
You will bear the market risks of your invest-ment. The market values of the classes are likely to fluctuate. These fluctuations may be significant and could result in significant losses to you.
The secondary markets for mortgage-related securities have experienced periods of illiquidity and can be expected to do so in the future. Illiquidity can have a severely adverse effect on the prices of classes that are especially sensitive to prepayment or interest rate risk or that have been structured to meet the investment require-ments of limited categories of investors.
The residual securities may experience significant adverse tax timing consequences. Accordingly, you are urged to consult tax advisors and to consider the after-tax effect of ownership of a residual security and the suitability of the residual securities to your investment objectives. See “Certain United States Federal Income Tax Con-sequences” in this supplement and in the base offering circular.
You are encouraged to consult advisors regard-ing the financial, legal, tax and other aspects of an investment in the securities. You should not purchase the securities of any class unless you understand and are able to bear the prepayment, yield, liquidity and market risks associated with that class.
The actual characteristics of the underlying mortgage loans will affect the weighted average lives and yields of your securities. The yield and decrement tables in this supple-ment are based on assumed characteristics which are likely to be different from the actual characteristics. As a result, the yields on your securities could be lower than you expected, even if the mortgage loans prepay at the constant prepayment rates set forth in the applicable table.
It is highly unlikely that the underlying mortgage loans will prepay at any of the prepayment rates assumed in this supplement, or at any constant prepayment rate.
S-21

THE TRUST ASSETS
General
The Sponsor intends to acquire the Trust Assets in privately negotiated transactions on or prior to the Closing Date and to sell them to the Trust according to the terms of a Trust Agreement between the Sponsor and the Trustee. The Sponsor will make certain representations and warranties with respect to the Trust Assets. All Trust Assets, regardless of whether the assets consist of Trust MBS or the Underlying Certificates, will evidence, directly or indirectly, Ginnie Mae Certificates.
The Trust MBS (Groups 1, 3, 4, 7, 9, 10, 11, 12, 17, 18, 19, 20, 23 and 24)
The Subgroup 18B, 18C, 18D, 18E and 18G Trust Assets are either:
1. Ginnie Mae I MBS Certificates guaranteed by Ginnie Mae, or
2. Ginnie Mae Platinum Certificates backed by Ginnie Mae I MBS Certificates and guaranteed by Ginnie Mae.
Each Mortgage Loan underlying a Ginnie Mae I MBS Certificate bears interest at a Mortgage Rate 0.50% per annum greater than the related Certificate Rate. The difference between the Mortgage Rate and the Certificate Rate is used to pay the related servicers of the Mortgage Loans a monthly servicing fee and Ginnie Mae a fee for its guaranty of the Ginnie Mae I MBS Certificate of 0.44% per annum and 0.06% per annum, respectively, of the outstanding principal balance of the Mortgage Loan.
The Group 1, 3, 4, 7, 9, 10, 11, 12, 17, 19, 20, 23 and 24 and Subgroup 18A and 18F Trust Assets are either:
1. Ginnie Mae II MBS Certificates guaranteed by Ginnie Mae, or
2. Ginnie Mae Platinum Certificates backed by Ginnie Mae II MBS Certificates and guaranteed by Ginnie Mae.
Each Mortgage Loan underlying a Ginnie Mae II MBS Certificate issued prior to July 1, 2003 bears interest at a Mortgage Rate 0.50% to 1.50% per annum greater than the related Certificate Rate. Each Mortgage Loan underlying a Ginnie Mae II MBS Certificate issued on or after July 1, 2003 bears interest at a Mortgage Rate 0.25% to 0.75% per annum greater than the related Certificate Rate. Ginnie Mae receives a fee (the “Ginnie Mae Certificate Guaranty Fee”) for its guaranty of each Ginnie Mae II MBS Certificate of 0.06% per annum of the outstanding principal balance of each related Mortgage Loan. The difference between (a) the Mortgage Rate and (b) the sum of the Certificate Rate and the rate of the Ginnie Mae Certificate Guaranty Fee is used to pay the related servicers of the Mortgage Loans a monthly servicing fee.
The Underlying Certificates (Groups 2, 5, 6, 8, 13, 14, 15, 16, 21, 22 and 25)
The Group 2, 5, 6, 8, 13, 14, 15, 16, 21, 22 and 25 Trust Assets are Underlying Certificates that represent beneficial ownership interests in one or more separate trusts, the assets of which evidence direct or indirect beneficial ownership interests in certain Ginnie Mae Certificates. Each Underlying Certificate constitutes all or a portion of a class of a separate Series of certificates described in the related Underlying Certificate Disclosure Document. Each Underlying Certificate Disclosure Document may be obtained from the Information Agent as described under “Available Information” in this Supplement or on ginniemae.gov. Investors are cautioned that material changes in facts and circumstances may have occurred since the date of each Underlying Certificate Disclosure Document, including changes in pre-payment rates, prevailing interest rates and other economic factors, which may limit the usefulness of, and be directly contrary to the assumptions used in preparing the information included in, the offering document. See “Underlying Certificates” in the Base Offering Circular.
S-22

Each Underlying Certificate provides for monthly distributions and is further described in the table contained in Exhibit A to this Supplement.
The Mortgage Loans
The Mortgage Loans underlying the Group 1, 3, 4, 7, 9, 10, 11, 12, 17, 18, 19, 20, 23 and 24 Trust Assets are expected to have, on a weighted average basis, the characteristics set forth in the Terms Sheet under “Assumed Characteristics of the Mortgage Loans Underlying the Group 1, 3, 4, 7, 9, 10, 11, 12, 17, 18, 19, 20, 23 and 24 Trust Assets” and the general characteristics described in the Base Offering Circular. The Mortgage Loans will consist of first lien, single-family, fixed rate, residential mortgage loans that are insured or guaranteed by the Federal Housing Administration, the United States Department of Veterans Affairs, Rural Development (formerly the Rural Housing Service) or the United States Depart-ment of Housing and Urban Development (“HUD”). See “The Ginnie Mae Certificates — General” in the Base Offering Circular.
Specific information regarding the characteristics of the Mortgage Loans underlying the Trust MBS is not available. For purposes of this Supplement, certain assumptions have been made regarding the remaining terms to maturity, loan ages and, in the case of the Group 1, 3, 4, 7, 9, 10, 11, 12, 17, 19, 20, 23 and 24 and Subgroup 18A and 18F Trust Assets, Mortgage Rates of the Mortgage Loans underlying the Trust MBS. However, the actual remaining terms to maturity, loan ages and, in the case of the Group 1, 3, 4, 7, 9, 10, 11, 12, 17, 19, 20, 23 and 24 and Subgroup 18A and 18F Trust Assets, Mortgage Rates of many of the Mortgage Loans will differ from the characteristics assumed, perhaps significantly. This will be the case even if the weighted average characteristics of the Mortgage Loans are the same as the assumed characteristics. Small differences in the characteristics of the Mortgage Loans can have a significant effect on the Weighted Average Lives and yields of the Securities. See “Risk Factors” and “Yield, Maturity and Prepayment Considerations” in this Supplement.
The Trustee Fee
The Sponsor will contribute certain Ginnie Mae Certificates in respect of the Trustee Fee. On each Distribution Date, the Trustee will retain all principal and interest distributions received on such Ginnie Mae Certificates in payment of the Trustee Fee.
GINNIE MAE GUARANTY
The Government National Mortgage Association (“Ginnie Mae”), a wholly-owned corporate instrumentality of the United States of America within HUD, guarantees the timely payment of principal and interest on the Securities. The General Counsel of HUD has provided an opinion to the effect that Ginnie Mae has the authority to guarantee multiclass securities and that Ginnie Mae guaranties will con-stitute general obligations of the United States, for which the full faith and credit of the United States is pledged. See “Ginnie Mae Guaranty” in the Base Offering Circular.
DESCRIPTION OF THE SECURITIES
General
The description of the Securities contained in this Supplement is not complete and is subject to, and is qualified in its entirety by reference to, all of the provisions of the Trust Agreement. See “Description of the Securities” in the Base Offering Circular.
Form of Securities
Each Class of Securities other than the Residual Securities initially will be issued and maintained, and may be transferred only on the Fedwire Book-Entry System. Beneficial Owners of Book-Entry Secu-
S-23

rities will ordinarily hold these Securities through one or more financial intermediaries, such as banks, brokerage firms and securities clearing organizations that are eligible to maintain book-entry accounts on the Fedwire Book-Entry System. By request accompanied by the payment of a transfer fee of $25,000 per Certificated Security to be issued, a Beneficial Owner may receive a Regular Security in certificated form.
The Residual Securities will not be issued in book-entry form but will be issued in fully registered, certificated form and may be transferred or exchanged, subject to the transfer restrictions applicable to Residual Securities set forth in the Trust Agreement, at the Corporate Trust Office of the Trustee. See “Description of the Securities — Forms of Securities; Book-Entry Procedures” in the Base Offering Circular.
Each Regular and MX Class (other than the Increased Minimum Denomination Classes) will be issued in minimum dollar denominations of initial principal balance of $1,000 and integral multiples of $1 in excess of $1,000. The Increased Minimum Denomination Classes will be issued in minimum denominations that equal $100,000 in initial principal or notional balance.
Distributions
Distributions on the Securities will be made on each Distribution Date as specified under “Terms Sheet — Distribution Dates” in this Supplement. On each Distribution Date for a Security, or in the case of the Certificated Securities, on the first Business Day after the related Distribution Date, the Dis-tribution Amount will be distributed to the Holders of record as of the related Record Date. Beneficial Owners of Book-Entry Securities will receive distributions through credits to accounts maintained for their benefit on the books and records of the appropriate financial intermediaries. Holders of Certifi-cated Securities will receive distributions by check or, subject to the restrictions set forth in the Base Offering Circular, by wire transfer. See “Description of the Securities — Distributions” and “— Method of Distributions” in the Base Offering Circular.
Interest Distributions
The Interest Distribution Amount will be distributed on each Distribution Date to the Holders of all Classes of Securities entitled to distributions of interest.
� Interest will be calculated on the basis of a 360-day year consisting of twelve 30-day months.
� Interest distributable (or accrued in the case of an Accrual Class) on any Class for any Dis-tribution Date will consist of 30 days’ interest on its Class Principal Balance (or Class Notional Balance) as of the related Record Date.
� Investors can calculate the amount of interest to be distributed (or accrued in the case of an Accrual Class) on each Class of Securities for any Distribution Date by using the Class Factors published in the preceding month. See “— Class Factors” below.
Categories of Classes
For purposes of interest distributions, the Classes will be categorized as shown under “Interest Type” on the front cover of this Supplement and on Schedule I to this Supplement. The abbreviations used in this Supplement to describe the interest entitlements of the Classes are explained under “Class Types” in Appendix I to the Base Offering Circular.
S-24

Accrual Periods
The Accrual Period for each Regular and MX Class is set forth in the table below:
Class Accrual Period
Fixed Rate Classes The calendar month preceding the related Distribution Date
Group 14 and 15 Inverse From the 16th day of the month preceding the month of the related Floating Rate and Distribution Date through the 15th day of the month of that Distribution Date Weighted Average Coupon Classes
Group 6, 13, 16, 17 and From the 20th day of the month preceding the month of the related 22 Floating Rate, Distribution Date through the 19th day of the month of that Distribution Date Inverse Floating Rate and Weighted Average Coupon Classes
Fixed Rate Classes
Each Fixed Rate Class will bear interest at the per annum Interest Rate shown on the front cover of this Supplement or on Schedule I to this Supplement.
Floating Rate and Inverse Floating Rate Classes
The Floating Rate and Inverse Floating Rate Classes will bear interest as shown under “Terms Sheet — Interest Rates” in this Supplement. The Interest Rates for the Floating Rate and Inverse Floating Rate Classes will be based on LIBOR. The Trustee or its agent will determine LIBOR on the basis of the ICE LIBOR method, as described under “Description of the Securities — Interest Rate Indices — Determination of LIBOR” in the Base Offering Circular. In the case of the Group 6, 13, 14, 15 and 16 Securities, the Trustee will use the same values of LIBOR as are used for the related Underlying Certificates.
We can provide no assurance that LIBOR for a Distribution Date accurately represents the offered rate at which one-month U.S. dollar deposits are being quoted to prime banks in the London interbank market, nor that the procedures for calculating LIBOR on the basis of the ICE LIBOR method for one-month U.S. dollar deposits will not change. Any change in LIBOR values resulting from any change in reporting or in the determination of LIBOR may cause LIBOR to fluctuate disproportionately to changes in other market lending rates. If LIBOR becomes unavailable, a replacement rate will be selected, as described under “Description of the Securities — Interest Rate Indices — Determination of LIBOR” in the Base Offering Circular.
Weighted Average Coupon Classes
The Weighted Average Coupon Classes will bear interest at per annum Interest Rates as shown under “Terms Sheet — Interest Rates” in this Supplement.
The Trustee’s determination of LIBOR and its calculation of the Interest Rates will be final except in the case of clear error. Investors can obtain LIBOR levels and Interest Rates for the current and preced-ing Accrual Periods on ginniemae.gov or by calling the Information Agent at (800) 234-GNMA.
Accrual Classes
Each of Classes AZ, KZ, UZ, ZA, ZD, ZK, ZQ and ZU is an Accrual Class. Interest will accrue on the Accrual Classes and be distributed as described under “Terms Sheet — Accrual Classes” in this Supplement.
S-25

Principal Distributions
The Principal Distribution Amount for each Group or Subgroup, as applicable, and each Accrual Amount will be distributed to the Holders entitled thereto as described under “Terms Sheet — Alloca-tion of Principal” in this Supplement. Investors can calculate the amount of principal to be distributed with respect to any Distribution Date by using the Class Factors published in the preceding and current months. See “— Class Factors” below.
Categories of Classes
For purposes of principal distributions, the Classes will be categorized as shown under “Principal Type” on the front cover of this Supplement and on Schedule I to this Supplement. The abbreviations used in this Supplement to describe the principal entitlements of the Classes are explained under “Class Types” in Appendix I to the Base Offering Circular.
Notional Classes
The Notional Classes will not receive principal distributions. For convenience in describing interest distributions, the Notional Classes will have the original Class Notional Balances shown on the front cover of this Supplement and on Schedule I to this Supplement. The Class Notional Balances will be reduced as shown under “Terms Sheet — Notional Classes” in this Supplement.
Residual Securities
The Class RR Securities will represent the beneficial ownership of the Residual Interest in the Issu-ing REMIC and the beneficial ownership of the Residual Interest in the Pooling REMIC, as described in “Certain United States Federal Income Tax Consequences” in the Base Offering Circular. The Class RR Securities have no Class Principal Balance and do not accrue interest. The Class RR Securities will be entitled to receive the proceeds of the disposition of any assets remaining in the Trust REMICs after the Class Principal Balance or Class Notional Balance of each Class of Regular Securities has been reduced to zero. However, any remaining proceeds are not likely to be significant. The Residual Securities may not be transferred to a Plan Investor, a Non-U.S. Person or a Disqualified Organization.
Class Factors
The Trustee will calculate and make available for each Class of Securities, no later than the day preceding the applicable Distribution Date, the factor (carried out to eight decimal places) that when multiplied by the Original Class Principal Balance (or original Class Notional Balance) of that Class, determines the Class Principal Balance (or Class Notional Balance) after giving effect to the distribution of principal to be made on the Securities (and any addition to the Class Principal Balance of an Accrual Class) or any reduction of Class Notional Balance on that Distribution Date (each, a “Class Factor”).
� The Class Factor for any Class of Securities for each month following the issuance of the Secu-rities will reflect its remaining Class Principal Balance (or Class Notional Balance) after giving effect to any principal distribution (or addition to principal) to be made or any reduction of Class Notional Balance on the Distribution Date occurring in that month.
� The Class Factor for each Class for the month of issuance is 1.00000000.
� The Class Factors for the MX Classes and the Classes of REMIC Securities that are exchangeable for the MX Classes will be calculated assuming that the maximum possible amount of each Class is outstanding at all times, regardless of any exchanges that may occur.
� Based on the Class Factors published in the preceding and current months (and Interest Rates), investors in any Class (other than an Accrual Class) can calculate the amount of principal and
S-26

interest to be distributed to that Class and investors in an Accrual Class can calculate the total amount of principal to be distributed to (or interest to be added to the Class Principal Balance of) that Class on the Distribution Date in the current month.
� Investors may obtain current Class Factors on ginniemae.gov.
See “Description of the Securities — Distributions” in the Base Offering Circular.
Termination
The Trustee, at its option, may purchase or cause the sale of the Trust Assets and thereby terminate the Trust on any Distribution Date on which the aggregate of the Class Principal Balances of the Secu-rities is less than 1% of the aggregate Original Class Principal Balances of the Securities. On any Dis-tribution Date upon the Trustee’s determination that the REMIC status of any Trust REMIC has been lost or that a substantial risk exists that this status will be lost for the then current taxable year, the Trustee will terminate the Trust and retire the Securities.
Upon any termination of the Trust, the Holder of any outstanding Security (other than a Residual or Notional Class Security) will be entitled to receive that Holder’s allocable share of the Class Principal Balance of that Class plus any accrued and unpaid interest thereon at the applicable Interest Rate, and any Holder of any outstanding Notional Class Security will be entitled to receive that Holder’s allocable share of any accrued and unpaid interest thereon at the applicable Interest Rate. The Residual Holders will be entitled to their pro rata share of any assets remaining in the Trust REMICs after payment in full of the amounts described in the foregoing sentence. However, any remaining assets are not likely to be significant.
Modification and Exchange
All or a portion of the Classes of REMIC Securities specified on the front cover may be exchanged for a proportionate interest in the related MX Class or Classes shown on Schedule I to this Supplement. Sim-ilarly, all or a portion of the related MX Class or Classes may be exchanged for proportionate interests in the related Class or Classes of REMIC Securities and, in the case of Combinations 1, 7, 8, 9, 18, 19, 20, 21, 22, 24, 25 and 26, other related MX Classes. This process may occur repeatedly.
Each exchange may be effected only in proportions that result in the principal and interest entitle-ments of the Securities received being equal to the entitlements of the Securities surrendered.
In the case of Combinations 1, 7, 8, 9, 18, 19, 20, 21, 22, 24, 25 and 26, the related REMIC Securities may be exchanged for proportionate interests in various subcombinations of MX Classes. Similarly, all or a portion of these MX Classes may be exchanged for proportionate interests in the related REMIC Secu-rities or in other subcombinations of the related MX Classes. Each subcombination may be effected only in proportions that result in the principal and interest entitlements of the Securities received being equal to the entitlements of the Securities surrendered. See the example under “Description of the Securities — Modification and Exchange” in the Base Offering Circular.
A Beneficial Owner proposing to effect an exchange must notify the Trustee through the Beneficial Owner’s Book-Entry Depository participant. This notice must be received by the Trustee not later than two Business Days before the proposed exchange date. The exchange date can be any Business Day other than the last Business Day of the month. The notice must contain the outstanding principal and notional balances of the Securities to be included in the exchange and the proposed exchange date. The notice is required to be delivered to the Trustee by email to [email protected] or in writing at its Corporate Trust Office at U.S. Bank National Association, One Federal Street, 3rd Floor, Boston,
S-27

Massachusetts, 02110, Attention: Ginnie Mae REMIC Trust 2020-061. The Trustee may be contacted by telephone at (617) 603-6451 and by fax at (617) 603-6644.
A fee will be payable to the Trustee in connection with each exchange equal to 1/32 of 1% of the outstanding principal balance (or notional balance) of the Securities surrendered for exchange (but not less than $2,000 or more than $25,000); provided, however, that no fee will be payable in respect of an interest only security unless all securities involved in the exchange are interest only securities. The fee must be paid concurrently with the exchange.
The first distribution on a REMIC Security or an MX Security received in an exchange will be made on the Distribution Date in the month following the month of the exchange. The distribution will be made to the Holder of record as of the Record Date in the month of exchange.
See “Description of the Securities — Modification and Exchange” in the Base Offering Circular.
YIELD, MATURITY AND PREPAYMENT CONSIDERATIONS
General
The prepayment experience of the Mortgage Loans will affect the Weighted Average Lives of and the yields realized by investors in the related Securities.
� The Mortgage Loans do not contain “due-on-sale” provisions, and any Mortgage Loan may be prepaid in full or in part at any time without penalty.
� The rate of payments (including prepayments and payments in respect of liquidations) on the Mortgage Loans is dependent on a variety of economic, geographic, social and other factors, including prevailing market interest rates and general economic factors.
The rate of prepayments with respect to single-family mortgage loans has fluctuated significantly in recent years. Although there is no assurance that prepayment patterns for the Mortgage Loans will con-form to patterns for more traditional types of conventional fixed rate mortgage loans, generally:
� if mortgage interest rates fall materially below the Mortgage Rates on any of the Mortgage Loans (giving consideration to the cost of refinancing), the rate of prepayment of those Mortgage Loans would be expected to increase; and
� if mortgage interest rates rise materially above the Mortgage Rates on any of the Mortgage Loans, the rate of prepayment of those Mortgage Loans would be expected to decrease.
In addition, following any Mortgage Loan default and the subsequent liquidation of the underlying Mortgaged Property, the principal balance of the Mortgage Loan will be distributed through a combina-tion of liquidation proceeds, advances from the related Ginnie Mae Issuer and, to the extent necessary, proceeds of Ginnie Mae’s guaranty of the Ginnie Mae Certificates. As a result, defaults experienced on the Mortgage Loans will accelerate the distribution of principal of the Securities.
The terms of the Mortgage Loans may be modified to permit, among other things, a partial release of security, which releases a portion of the mortgaged property from the lien securing the related Mort-gage Loan. Partial releases of security may allow the related borrower to sell the released property and generate proceeds that may be used to prepay the related Mortgage Loan in whole or in part.
Under certain circumstances, the Trustee has the option to purchase the Trust Assets, thereby effect-ing early retirement of the Securities. See “Description of the Securities — Termination” in this Supplement.
S-28

Investors in the Group 2, 5, 6, 8, 13, 14, 15, 16, 21, 22 and 25 Securities are urged to review the discussion under “Risk Factors — The rate of payments on the underlying certificates will directly affect the rate of payments on the group 2, 5, 6, 8, 13, 14, 15, 16, 21, 22 and 25 securities” in this Supplement.
Accretion Directed Classes
Classes AB, AC, AP, DP, DQ, KA, KC, KU, KW, KY, QA, QP, UA, UH, ZK and ZU are Accretion Directed Classes. The related Accrual Amounts will be applied to making principal distributions on those Classes as described in this Supplement. Each of Classes IA and KI is a Notional Class whose Class Notional Balance is determined by reference to the Class Principal Balance of the related Accretion Directed Class shown under “Terms Sheet — Notional Classes” in this Supplement.
Each of the Accretion Directed Classes has the AD designation in the suffix position, rather than the prefix position, in its class principal type because it does not have principal payment stability through the applicable pricing prepayment assumption. Although the Accretion Directed Classes are entitled to receive payments from the related Accrual Amounts, they do not have principal payment stability through any constant prepayment rate significantly higher than 0% PSA, except within their Effective Ranges.
Securities that Receive Principal on the Basis of Schedules
As described in this Supplement, each PAC Class will receive principal payments in accordance with a schedule calculated on the basis of, among other things, a Structuring Range. See “Terms Sheet — Scheduled Principal Balances.” However, whether any such Class will adhere to its schedule and receive “Scheduled Payments” on a Distribution Date will largely depend on the level of prepayments experienced by the related Mortgage Loans.
Each PAC Class exhibits an Effective Range of constant prepayment rates at which such Class will receive Scheduled Payments. That range may differ from the Structuring Range used to create the related principal balance schedule. Based on the Modeling Assumptions, the initial Effective Ranges for the PAC Classes are as follows:
Security Group Class Initial Effective Ranges
PAC Classes 3 AB and AC (in the aggregate) . . . . . . . . . . . . . . . 130% PSA through 250% PSA 7 KA, KC, KY, UA and ZK (in the aggregate) . . . . . 430% PSA through 550% PSA 9 AP . . . . . . . . . . . . . . . . . . . . . . . . . . . . . . . . . . . . . 125% PSA through 250% PSA 10 CA, CD and CW (in the aggregate) . . . . . . . . . . . 185% PSA through 400% PSA 19 DP and DQ (in the aggregate) . . . . . . . . . . . . . . . 110% PSA through 185% PSA 20 QA and QP (in the aggregate) . . . . . . . . . . . . . . . 125% PSA through 450% PSA 23 KU, KW, UH and ZU (in the aggregate) . . . . . . . 440% PSA through 550% PSA
� The principal payment stability of the PAC Classes will be supported by the related Support Class.
If the Class supporting a given Class is retired before the Class being supported is retired, the outstanding Class will no longer have an Effective Range and will become more sensitive to prepayments on the related Mortgage Loans.
S-29

There is no assurance that the related Mortgage Loans will have the characteristics assumed in the Modeling Assumptions, which were used to determine the initial Effective Ranges. If the initial Effective Ranges were calculated using the actual characteristics of the related Mortgage Loans, the initial Effective Ranges could differ from those shown in the above table. Therefore, even if the Mortgage Loans were to prepay at a constant rate within the initial Effective Range shown for any Class in the above table, that Class could fail to receive Scheduled Payments.
Moreover, the related Mortgage Loans will not prepay at any constant rate. Non-constant prepay-ment rates can cause any PAC Class not to receive Scheduled Payments, even if prepayment rates remain within the initial Effective Range for that Class. Further, the Effective Range for any PAC Class can narrow, shift over time or cease to exist depending on the actual characteristics of the related Mort-gage Loans.
If the related Mortgage Loans prepay at rates that are generally below the Effective Range for any PAC Class, the amount available to pay principal on the Securities may be insufficient to produce Scheduled Payments on such related PAC Class, and its Weighted Average Life may be extended, per-haps significantly.
If the related Mortgage Loans prepay at rates that are generally above the Effective Range for any PAC Class, its supporting Class may be retired earlier than that PAC Class, and its Weighted Average Life may be shortened, perhaps significantly.
Assumability
Each Mortgage Loan may be assumed, subject to HUD review and approval, upon the sale of the related Mortgaged Property. See “Yield, Maturity and Prepayment Considerations — Assumability of Government Loans” in the Base Offering Circular.
Final Distribution Date
The Final Distribution Date for each Class, which is set forth on the front cover of this Supplement or on Schedule I to this Supplement, is the latest date on which the related Class Principal Balance or Class Notional Balance will be reduced to zero.
� The actual retirement of any Class may occur earlier than its Final Distribution Date.
� According to the terms of the Ginnie Mae Guaranty, Ginnie Mae will guarantee payment in full of the Class Principal Balance of each Class of Securities no later than its Final Distribution Date.
Modeling Assumptions
Unless otherwise indicated, the tables that follow have been prepared on the basis of the characteristics of the Underlying Certificates, the priorities of distributions on the Underlying Certificates, and the following assumptions (the “Modeling Assumptions”), among others:
1. The Mortgage Loans underlying the Group 1, 3, 4, 7, 9, 10, 11, 12, 17, 18, 19, 20, 23 and 24 Trust Assets have the assumed characteristics shown under “Assumed Characteristics of the Mortgage Loans Underlying the Group 1, 3, 4, 7, 9, 10, 11, 12, 17, 18, 19, 20, 23 and 24 Trust Assets” in the Terms Sheet, except in the case of information set forth under the 0% PSA Prepayment Assumption Rate, for which each Mortgage Loan underlying a Group 1, 3, 4, 7, 9, 10, 11, 12, 17, 18, 19, 20, 23 or 24 Trust Asset is assumed to have an original and a remaining term to maturity of 360 months and each Mortgage Loan underlying a Group 1, 3, 4, 7, 9, 10, 11, 12, 17, 19, 20, 23 or 24 or Subgroup 18A or 18F Trust Asset is assumed to have a Mortgage Rate of 1.50% per annum higher than the related Certificate Rate.
S-30

2. The Mortgage Loans prepay at the constant percentages of PSA (described below) shown in the related table.
3. Distributions on the Group 14 and 15 Securities are always received on the 16th day of the month and distributions on the Group 1 through 13 and 16 through 25 Securities are always received on the 20th day of the month, in each case, whether or not a Business Day, commencing in June 2020.
4. A termination of the Trust or any Underlying Trust does not occur.
5. The Closing Date for the Securities is May 29, 2020.
6. No expenses or fees are paid by the Trust other than the Trustee Fee, which is paid as described under “The Trust Assets — The Trustee Fee” in this Supplement.
7. Distributions on the Underlying Certificates are made as described in the related Underlying Cer-tificate Disclosure Documents.
8. Each Class is held from the Closing Date and is not exchanged in whole or in part.
When reading the tables and the related text, investors should bear in mind that the Modeling Assumptions, like any other stated assumptions, are unlikely to be entirely consistent with actual experience.
� For example, most of the Mortgage Loans will not have the characteristics assumed, many Dis-tribution Dates will occur on a Business Day after the 16th or 20th day of the month, as applicable, and the Trustee may cause a termination of the Trust as described under “Description of the Securities — Termination” in this Supplement.
� In addition, distributions on the Securities are based on Certificate Factors and Calculated Certifi-cate Factors, as applicable, which may not reflect actual receipts on the Trust Assets.
See “Description of the Securities — Distributions” in the Base Offering Circular.
Decrement Tables
Prepayments of mortgage loans are commonly measured by a prepayment standard or model. The model used in this Supplement, Prepayment Speed Assumption (“PSA”), is the standard prepayment assumption model of The Securities Industry and Financial Markets Association. PSA represents an assumed rate of prepayment each month relative to the then outstanding principal balance of the Mort-gage Loans to which the model is applied. See “Yield, Maturity and Prepayment Considerations — Standard Prepayment Assumption Models” in the Base Offering Circular.
The decrement tables set forth below are based on the assumption that the Mortgage Loans prepay at the indicated percentages of PSA (the “PSA Prepayment Assumption Rates”). As used in the tables, each of the PSA Prepayment Assumption Rates reflects a percentage of the 100% PSA assumed prepay-ment rate. The Mortgage Loans will not prepay at any of the PSA Prepayment Assumption Rates, and the timing of changes in the rate of prepayments actually experienced on the Mortgage Loans will not follow the pattern described for the PSA assumption.
The decrement tables set forth below illustrate the percentage of the Original Class Principal Bal-ance (or, in the case of a Notional Class, the original Class Notional Balance) that would remain out-standing following the distribution made each specified month for each Regular or MX Class, based on the assumption that the related Mortgage Loans prepay at the PSA Prepayment Assumption Rates. The percentages set forth in the following decrement tables have been rounded to the nearest whole percentage (including rounding down to zero).
S-31

The decrement tables also indicate the Weighted Average Life of each Class under each PSA Prepayment Assumption Rate. The Weighted Average Life of each Class is calculated by:
(a) multiplying the net reduction, if any, of the Class Principal Balance (or the net reduction of the Class Notional Balance, in the case of a Notional Class) from one Distribution Date to the next Distribution Date by the number of years from the date of issuance thereof to the related Dis-tribution Date,
(b) summing the results, and
(c) dividing the sum by the aggregate amount of the assumed net reductions in principal balance or notional balance, as applicable, referred to in clause (a).
The information shown for each Notional Class is for illustrative purposes only, as a Notional Class is not entitled to distributions of principal and has no Weighted Average Life. The Weighted Aver-age Life shown for each Notional Class has been calculated on the assumption that a reduction in the Class Notional Balance thereof is a distribution of principal.
The Weighted Average Lives are likely to vary, perhaps significantly, from those set forth in the tables below due to the differences between the actual characteristics of the Mortgage Loans underlying the related Trust Assets and the Modeling Assumptions.
S-32

Percentages of Original Class Principal (or Class Notional) Balances and Weighted Average Lives
Security Group 1 PSA Prepayment Assumption Rates
Classes JE and JI
Distribution Date 0% 100% 182% 300% 400%
Initial Percent . . . . . . . . . 100 100 100 100 100 May 2021 . . . . . . . . . . . . 98 96 95 93 92 May 2022 . . . . . . . . . . . . 96 91 86 81 76 May 2023 . . . . . . . . . . . . 94 83 75 65 57 May 2024 . . . . . . . . . . . . 93 76 66 52 42 May 2025 . . . . . . . . . . . . 90 70 57 41 31 May 2026 . . . . . . . . . . . . 88 64 49 33 23 May 2027 . . . . . . . . . . . . 86 58 43 26 17 May 2028 . . . . . . . . . . . . 84 53 37 21 13 May 2029 . . . . . . . . . . . . 81 48 32 17 9 May 2030 . . . . . . . . . . . . 79 44 27 13 7 May 2031 . . . . . . . . . . . . 76 40 23 10 5 May 2032 . . . . . . . . . . . . 73 36 20 8 4 May 2033 . . . . . . . . . . . . 71 32 17 6 3 May 2034 . . . . . . . . . . . . 68 29 14 5 2 May 2035 . . . . . . . . . . . . 65 26 12 4 1 May 2036 . . . . . . . . . . . . 61 23 10 3 1 May 2037 . . . . . . . . . . . . 58 20 9 2 1 May 2038 . . . . . . . . . . . . 55 18 7 2 0 May 2039 . . . . . . . . . . . . 51 15 6 1 0 May 2040 . . . . . . . . . . . . 47 13 5 1 0 May 2041 . . . . . . . . . . . . 43 11 4 1 0 May 2042 . . . . . . . . . . . . 39 10 3 1 0 May 2043 . . . . . . . . . . . . 35 8 2 0 0 May 2044 . . . . . . . . . . . . 31 7 2 0 0 May 2045 . . . . . . . . . . . . 26 5 1 0 0 May 2046 . . . . . . . . . . . . 21 4 1 0 0 May 2047 . . . . . . . . . . . . 16 3 1 0 0 May 2048 . . . . . . . . . . . . 11 2 0 0 0 May 2049 . . . . . . . . . . . . 6 1 0 0 0 May 2050 . . . . . . . . . . . . 0 0 0 0 0 Weighted Average
Life (years) . . . . . . . . . 17.9 10.4 7.6 5.4 4.4
Security Group 2 PSA Prepayment Assumption Rates
Class IJ
Distribution Date 0% 100% 178% 300% 400%
Initial Percent . . . . . . . . . 100 100 100 100 100 May 2021 . . . . . . . . . . . . 98 92 87 80 74 May 2022 . . . . . . . . . . . . 96 84 76 64 55 May 2023 . . . . . . . . . . . . 93 77 66 51 41 May 2024 . . . . . . . . . . . . 91 71 58 41 30 May 2025 . . . . . . . . . . . . 88 65 50 33 22 May 2026 . . . . . . . . . . . . 86 59 43 26 16 May 2027 . . . . . . . . . . . . 83 54 38 21 12 May 2028 . . . . . . . . . . . . 80 49 32 16 9 May 2029 . . . . . . . . . . . . 77 44 28 13 6 May 2030 . . . . . . . . . . . . 74 40 24 10 5 May 2031 . . . . . . . . . . . . 71 36 20 8 3 May 2032 . . . . . . . . . . . . 68 32 17 6 2 May 2033 . . . . . . . . . . . . 64 29 15 5 2 May 2034 . . . . . . . . . . . . 61 25 12 4 1 May 2035 . . . . . . . . . . . . 57 22 10 3 1 May 2036 . . . . . . . . . . . . 53 20 9 2 0 May 2037 . . . . . . . . . . . . 49 17 7 1 0 May 2038 . . . . . . . . . . . . 45 15 6 1 0 May 2039 . . . . . . . . . . . . 40 12 5 1 0 May 2040 . . . . . . . . . . . . 36 10 4 0 0 May 2041 . . . . . . . . . . . . 31 8 3 0 0 May 2042 . . . . . . . . . . . . 26 7 2 0 0 May 2043 . . . . . . . . . . . . 21 5 1 0 0 May 2044 . . . . . . . . . . . . 16 3 1 0 0 May 2045 . . . . . . . . . . . . 10 2 0 0 0 May 2046 . . . . . . . . . . . . 5 1 0 0 0 May 2047 . . . . . . . . . . . . 0 0 0 0 0 May 2048 . . . . . . . . . . . . 0 0 0 0 0 Weighted Average
Life (years) . . . . . . . . . 15.7 9.3 6.6 4.4 3.3
S-33

Security Group 3 PSA Prepayment Assumption Rates
Class AB Class AC Class AZ
Distribution Date 0% 130% 200% 250% 400% 0% 130% 200% 250% 400% 0% 130% 200% 250% 400%
Initial Percent . . . . . . . . . 100 100 100 100 100 100 100 100 100 100 100 100 100 100 100 May 2021 . . . . . . . . . . . . 97 94 94 94 94 100 100 100 100 100 103 103 97 92 78 May 2022 . . . . . . . . . . . . 94 84 84 84 84 100 100 100 100 100 106 106 84 69 24 May 2023 . . . . . . . . . . . . 91 71 71 71 63 100 100 100 100 100 109 109 68 40 0 May 2024 . . . . . . . . . . . . 88 59 59 59 43 100 100 100 100 100 113 113 57 20 0 May 2025 . . . . . . . . . . . . 84 49 49 49 27 100 100 100 100 100 116 116 50 8 0 May 2026 . . . . . . . . . . . . 81 39 39 39 16 100 100 100 100 100 120 120 46 1 0 May 2027 . . . . . . . . . . . . 77 29 29 29 8 100 100 100 100 100 123 123 45 0 0 May 2028 . . . . . . . . . . . . 73 21 21 21 1 100 100 100 100 100 127 125 45 0 0 May 2029 . . . . . . . . . . . . 69 15 15 15 0 100 100 100 100 80 131 123 43 0 0 May 2030 . . . . . . . . . . . . 65 9 9 9 0 100 100 100 100 59 135 119 41 0 0 May 2031 . . . . . . . . . . . . 60 5 5 5 0 100 100 100 100 43 139 114 38 0 0 May 2032 . . . . . . . . . . . . 56 1 1 1 0 100 100 100 100 31 143 108 35 0 0 May 2033 . . . . . . . . . . . . 51 0 0 0 0 100 85 85 85 23 148 100 31 0 0 May 2034 . . . . . . . . . . . . 46 0 0 0 0 100 69 69 69 17 152 93 28 0 0 May 2035 . . . . . . . . . . . . 40 0 0 0 0 100 56 56 56 12 157 85 25 0 0 May 2036 . . . . . . . . . . . . 35 0 0 0 0 100 45 45 45 9 162 77 22 0 0 May 2037 . . . . . . . . . . . . 29 0 0 0 0 100 36 36 36 6 166 69 19 0 0 May 2038 . . . . . . . . . . . . 23 0 0 0 0 100 29 29 29 4 171 62 17 0 0 May 2039 . . . . . . . . . . . . 17 0 0 0 0 100 23 23 23 3 177 54 14 0 0 May 2040 . . . . . . . . . . . . 11 0 0 0 0 100 18 18 18 2 182 47 12 0 0 May 2041 . . . . . . . . . . . . 4 0 0 0 0 100 14 14 14 2 188 41 10 0 0 May 2042 . . . . . . . . . . . . 0 0 0 0 0 82 11 11 11 1 193 35 8 0 0 May 2043 . . . . . . . . . . . . 0 0 0 0 0 37 8 8 8 1 199 29 7 0 0 May 2044 . . . . . . . . . . . . 0 0 0 0 0 6 6 6 6 0 193 23 5 0 0 May 2045 . . . . . . . . . . . . 0 0 0 0 0 4 4 4 4 0 165 19 4 0 0 May 2046 . . . . . . . . . . . . 0 0 0 0 0 3 3 3 3 0 136 14 3 0 0 May 2047 . . . . . . . . . . . . 0 0 0 0 0 2 2 2 2 0 104 10 2 0 0 May 2048 . . . . . . . . . . . . 0 0 0 0 0 1 1 1 1 0 71 6 1 0 0 May 2049 . . . . . . . . . . . . 0 0 0 0 0 0 0 0 0 0 36 3 1 0 0 May 2050 . . . . . . . . . . . . 0 0 0 0 0 0 0 0 0 0 0 0 0 0 0 Weighted Average
Life (years) . . . . . . . . . 12.4 5.3 5.3 5.3 3.9 22.9 16.6 16.6 16.6 11.4 27.0 18.4 9.1 2.8 1.5
Security Group 4 PSA Prepayment Assumption Rates
Classes GA, GB, GC, GD, GE, GI and GT
Distribution Date 0% 250% 539% 850% 1,100%
Initial Percent . . . . . . . 100 100 100 100 100 May 2021 . . . . . . . . . . 99 84 67 50 35 May 2022 . . . . . . . . . . 98 70 45 24 12 May 2023 . . . . . . . . . . 96 59 30 11 4 May 2024 . . . . . . . . . . 95 49 20 6 1 May 2025 . . . . . . . . . . 94 41 13 3 0 May 2026 . . . . . . . . . . 92 34 9 1 0 May 2027 . . . . . . . . . . 90 28 6 1 0 May 2028 . . . . . . . . . . 89 23 4 0 0 May 2029 . . . . . . . . . . 87 19 2 0 0 May 2030 . . . . . . . . . . 85 16 2 0 0 May 2031 . . . . . . . . . . 83 13 1 0 0 May 2032 . . . . . . . . . . 80 11 1 0 0 May 2033 . . . . . . . . . . 78 9 0 0 0 May 2034 . . . . . . . . . . 75 7 0 0 0 May 2035 . . . . . . . . . . 73 6 0 0 0 May 2036 . . . . . . . . . . 70 5 0 0 0 May 2037 . . . . . . . . . . 66 4 0 0 0 May 2038 . . . . . . . . . . 63 3 0 0 0 May 2039 . . . . . . . . . . 59 2 0 0 0 May 2040 . . . . . . . . . . 56 2 0 0 0 May 2041 . . . . . . . . . . 52 1 0 0 0 May 2042 . . . . . . . . . . 47 1 0 0 0 May 2043 . . . . . . . . . . 43 1 0 0 0 May 2044 . . . . . . . . . . 38 0 0 0 0 May 2045 . . . . . . . . . . 32 0 0 0 0 May 2046 . . . . . . . . . . 27 0 0 0 0 May 2047 . . . . . . . . . . 21 0 0 0 0 May 2048 . . . . . . . . . . 14 0 0 0 0 May 2049 . . . . . . . . . . 7 0 0 0 0 May 2050 . . . . . . . . . . 0 0 0 0 0 Weighted Average
Life (years) . . . . . . . 19.6 5.4 2.5 1.4 1.0
S-34

Security Group 5 PSA Prepayment Assumption Rates
Classes DI and DL
Distribution Date 0% 300% 578% 900% 1,200%
Initial Percent . . . . . . . 100 100 100 100 100 May 2021 . . . . . . . . . . 99 85 73 58 45 May 2022 . . . . . . . . . . 97 69 47 27 12 May 2023 . . . . . . . . . . 96 56 30 12 3 May 2024 . . . . . . . . . . 94 45 19 5 1 May 2025 . . . . . . . . . . 92 36 12 2 0 May 2026 . . . . . . . . . . 90 29 8 1 0 May 2027 . . . . . . . . . . 88 23 5 0 0 May 2028 . . . . . . . . . . 86 19 3 0 0 May 2029 . . . . . . . . . . 84 15 2 0 0 May 2030 . . . . . . . . . . 82 12 1 0 0 May 2031 . . . . . . . . . . 79 9 1 0 0 May 2032 . . . . . . . . . . 76 7 1 0 0 May 2033 . . . . . . . . . . 74 6 0 0 0 May 2034 . . . . . . . . . . 71 5 0 0 0 May 2035 . . . . . . . . . . 67 4 0 0 0 May 2036 . . . . . . . . . . 64 3 0 0 0 May 2037 . . . . . . . . . . 61 2 0 0 0 May 2038 . . . . . . . . . . 57 2 0 0 0 May 2039 . . . . . . . . . . 53 1 0 0 0 May 2040 . . . . . . . . . . 49 1 0 0 0 May 2041 . . . . . . . . . . 44 1 0 0 0 May 2042 . . . . . . . . . . 39 1 0 0 0 May 2043 . . . . . . . . . . 34 0 0 0 0 May 2044 . . . . . . . . . . 29 0 0 0 0 May 2045 . . . . . . . . . . 23 0 0 0 0 May 2046 . . . . . . . . . . 17 0 0 0 0 May 2047 . . . . . . . . . . 11 0 0 0 0 May 2048 . . . . . . . . . . 4 0 0 0 0 May 2049 . . . . . . . . . . 0 0 0 0 0 Weighted Average
Life (years) . . . . . . . 18.1 4.8 2.5 1.6 1.1
Security Group 6 PSA Prepayment Assumption Rates
Class IT Class NA Classes NB and TB Classes NC and TC
Distribution Date 0% 100% 200% 300% 400% 0% 100% 200% 300% 400% 0% 100% 200% 300% 400% 0% 100% 200% 300% 400%
Initial Percent . . . . . . . . . 100 100 100 100 100 100 100 100 100 100 100 100 100 100 100 100 100 100 100 100 May 2021 . . . . . . . . . . . . 97 91 85 79 73 97 91 85 79 74 97 91 85 79 74 97 91 85 79 74 May 2022 . . . . . . . . . . . . 94 83 72 63 54 94 83 72 63 54 94 83 73 63 54 94 83 72 63 54 May 2023 . . . . . . . . . . . . 90 75 61 49 39 90 75 61 50 40 90 75 62 50 40 90 75 61 50 40 May 2024 . . . . . . . . . . . . 86 67 51 38 28 86 68 52 39 29 87 68 52 39 29 86 68 52 39 29 May 2025 . . . . . . . . . . . . 83 60 43 30 20 83 61 44 31 21 83 61 44 31 21 83 61 44 31 21 May 2026 . . . . . . . . . . . . 78 54 36 23 14 79 54 36 24 15 79 54 37 24 15 79 54 36 24 15 May 2027 . . . . . . . . . . . . 74 48 30 18 10 74 48 30 19 11 75 48 30 19 11 74 48 30 19 11 May 2028 . . . . . . . . . . . . 70 42 24 13 7 70 43 25 14 8 70 43 25 14 8 70 43 25 14 8 May 2029 . . . . . . . . . . . . 65 37 20 10 5 65 37 21 11 5 65 38 21 11 6 65 37 21 11 5 May 2030 . . . . . . . . . . . . 60 32 16 8 4 60 32 17 8 4 61 33 17 8 4 60 32 17 8 4 May 2031 . . . . . . . . . . . . 54 27 12 6 2 55 28 13 6 3 55 28 14 6 3 55 28 13 6 3 May 2032 . . . . . . . . . . . . 49 23 10 4 2 49 23 11 5 2 50 24 11 5 2 49 23 11 5 2 May 2033 . . . . . . . . . . . . 43 19 8 3 1 43 19 8 3 1 44 20 8 3 1 43 19 8 3 1 May 2034 . . . . . . . . . . . . 37 15 6 2 1 37 16 6 2 1 38 16 6 2 1 37 16 6 2 1 May 2035 . . . . . . . . . . . . 30 11 4 1 0 30 12 4 2 0 31 12 5 2 1 31 12 4 2 0 May 2036 . . . . . . . . . . . . 23 8 3 1 0 23 9 3 1 0 25 9 3 1 0 24 9 3 1 0 May 2037 . . . . . . . . . . . . 16 5 2 1 0 16 6 2 1 0 18 6 2 1 0 16 6 2 1 0 May 2038 . . . . . . . . . . . . 9 3 1 0 0 9 3 1 0 0 10 3 1 0 0 9 3 1 0 0 May 2039 . . . . . . . . . . . . 1 0 0 0 0 1 0 0 0 0 2 1 0 0 0 1 0 0 0 0 May 2040 . . . . . . . . . . . . 0 0 0 0 0 0 0 0 0 0 0 0 0 0 0 0 0 0 0 0 May 2041 . . . . . . . . . . . . 0 0 0 0 0 0 0 0 0 0 0 0 0 0 0 0 0 0 0 0 May 2042 . . . . . . . . . . . . 0 0 0 0 0 0 0 0 0 0 0 0 0 0 0 0 0 0 0 0 May 2043 . . . . . . . . . . . . 0 0 0 0 0 0 0 0 0 0 0 0 0 0 0 0 0 0 0 0 May 2044 . . . . . . . . . . . . 0 0 0 0 0 0 0 0 0 0 0 0 0 0 0 0 0 0 0 0 May 2045 . . . . . . . . . . . . 0 0 0 0 0 0 0 0 0 0 0 0 0 0 0 0 0 0 0 0 May 2046 . . . . . . . . . . . . 0 0 0 0 0 0 0 0 0 0 0 0 0 0 0 0 0 0 0 0 Weighted Average
Life (years) . . . . . . . . . 11.1 7.5 5.3 4.0 3.1 11.1 7.6 5.4 4.1 3.2 11.2 7.6 5.5 4.1 3.2 11.1 7.6 5.4 4.1 3.2
S-35

Security Group 6 PSA Prepayment Assumption Rates
Classes ND and TD Classes NE and TE Class NF Classes NG and TG
Distribution Date 0% 100% 200% 300% 400% 0% 100% 200% 300% 400% 0% 100% 200% 300% 400% 0% 100% 200% 300% 400%
Initial Percent . . . . . . . . . 100 100 100 100 100 100 100 100 100 100 100 100 100 100 100 100 100 100 100 100 May 2021 . . . . . . . . . . . . 97 91 85 79 74 97 91 85 79 74 97 91 85 79 74 97 91 85 79 74 May 2022 . . . . . . . . . . . . 94 83 72 63 54 94 83 73 63 54 94 83 72 63 54 94 83 73 63 54 May 2023 . . . . . . . . . . . . 90 75 61 50 40 90 75 61 50 40 90 75 61 50 40 90 75 61 50 40 May 2024 . . . . . . . . . . . . 86 68 52 39 29 87 68 52 39 29 86 67 52 39 29 87 68 52 39 29 May 2025 . . . . . . . . . . . . 83 61 44 31 21 83 61 44 31 21 83 61 44 31 21 83 61 44 31 21 May 2026 . . . . . . . . . . . . 79 54 36 24 15 79 54 37 24 15 78 54 36 24 15 79 54 37 24 15 May 2027 . . . . . . . . . . . . 74 48 30 19 11 74 48 30 19 11 74 48 30 18 11 75 48 30 19 11 May 2028 . . . . . . . . . . . . 70 43 25 14 8 70 43 25 14 8 70 42 25 14 8 70 43 25 14 8 May 2029 . . . . . . . . . . . . 65 37 21 11 5 65 37 21 11 6 65 37 21 11 5 65 37 21 11 6 May 2030 . . . . . . . . . . . . 60 32 17 8 4 60 32 17 8 4 60 32 17 8 4 60 33 17 8 4 May 2031 . . . . . . . . . . . . 55 28 13 6 3 55 28 13 6 3 54 28 13 6 3 55 28 14 6 3 May 2032 . . . . . . . . . . . . 49 23 11 5 2 49 24 11 5 2 49 23 11 5 2 50 24 11 5 2 May 2033 . . . . . . . . . . . . 43 19 8 3 1 44 20 8 3 1 43 19 8 3 1 44 20 8 3 1 May 2034 . . . . . . . . . . . . 37 16 6 2 1 38 16 6 2 1 37 15 6 2 1 38 16 6 2 1 May 2035 . . . . . . . . . . . . 31 12 4 2 0 31 12 5 2 1 30 12 4 2 0 31 12 5 2 1 May 2036 . . . . . . . . . . . . 24 9 3 1 0 24 9 3 1 0 23 9 3 1 0 24 9 3 1 0 May 2037 . . . . . . . . . . . . 16 6 2 1 0 17 6 2 1 0 16 6 2 1 0 17 6 2 1 0 May 2038 . . . . . . . . . . . . 9 3 1 0 0 9 3 1 0 0 8 3 1 0 0 10 3 1 0 0 May 2039 . . . . . . . . . . . . 1 0 0 0 0 1 0 0 0 0 1 0 0 0 0 2 0 0 0 0 May 2040 . . . . . . . . . . . . 0 0 0 0 0 0 0 0 0 0 0 0 0 0 0 0 0 0 0 0 May 2041 . . . . . . . . . . . . 0 0 0 0 0 0 0 0 0 0 0 0 0 0 0 0 0 0 0 0 May 2042 . . . . . . . . . . . . 0 0 0 0 0 0 0 0 0 0 0 0 0 0 0 0 0 0 0 0 May 2043 . . . . . . . . . . . . 0 0 0 0 0 0 0 0 0 0 0 0 0 0 0 0 0 0 0 0 May 2044 . . . . . . . . . . . . 0 0 0 0 0 0 0 0 0 0 0 0 0 0 0 0 0 0 0 0 May 2045 . . . . . . . . . . . . 0 0 0 0 0 0 0 0 0 0 0 0 0 0 0 0 0 0 0 0 May 2046 . . . . . . . . . . . . 0 0 0 0 0 0 0 0 0 0 0 0 0 0 0 0 0 0 0 0 Weighted Average
Life (years) . . . . . . . . . 11.1 7.6 5.4 4.1 3.2 11.2 7.6 5.4 4.1 3.2 11.1 7.6 5.4 4.1 3.2 11.2 7.6 5.4 4.1 3.2
PSA Prepayment Assumption Rates
Classes NH and TH Classes NI and TI Classes NJ and TJ
Distribution Date 0% 100% 200% 300% 400% 0% 100% 200% 300% 400% 0% 100% 200% 300% 400%
Initial Percent . . . . . . . . . 100 100 100 100 100 100 100 100 100 100 100 100 100 100 100 May 2021 . . . . . . . . . . . . 97 91 85 79 74 97 91 85 79 74 97 91 85 80 74 May 2022 . . . . . . . . . . . . 94 83 72 63 54 94 83 73 63 54 94 83 73 63 54 May 2023 . . . . . . . . . . . . 90 75 61 50 40 90 75 61 50 40 91 75 62 50 40 May 2024 . . . . . . . . . . . . 86 68 52 39 29 87 68 52 39 29 87 68 52 39 29 May 2025 . . . . . . . . . . . . 83 61 44 31 21 83 61 44 31 21 84 61 44 31 21 May 2026 . . . . . . . . . . . . 79 54 36 24 15 79 54 37 24 15 80 55 37 24 15 May 2027 . . . . . . . . . . . . 74 48 30 19 11 74 48 30 19 11 76 49 31 19 11 May 2028 . . . . . . . . . . . . 70 43 25 14 8 70 43 25 14 8 71 43 26 15 8 May 2029 . . . . . . . . . . . . 65 37 21 11 6 65 37 21 11 6 67 38 21 11 6 May 2030 . . . . . . . . . . . . 60 32 17 8 4 60 32 17 8 4 62 33 17 9 4 May 2031 . . . . . . . . . . . . 55 28 13 6 3 55 28 13 6 3 57 29 14 6 3 May 2032 . . . . . . . . . . . . 49 23 11 5 2 50 24 11 5 2 52 25 11 5 2 May 2033 . . . . . . . . . . . . 43 19 8 3 1 44 20 8 3 1 46 21 9 4 1 May 2034 . . . . . . . . . . . . 37 16 6 2 1 38 16 6 2 1 40 17 7 3 1 May 2035 . . . . . . . . . . . . 31 12 4 2 0 31 12 5 2 1 34 14 5 2 1 May 2036 . . . . . . . . . . . . 24 9 3 1 0 24 9 3 1 0 28 10 4 1 0 May 2037 . . . . . . . . . . . . 16 6 2 1 0 17 6 2 1 0 21 7 2 1 0 May 2038 . . . . . . . . . . . . 9 3 1 0 0 9 3 1 0 0 14 4 1 0 0 May 2039 . . . . . . . . . . . . 1 0 0 0 0 1 0 0 0 0 6 2 1 0 0 May 2040 . . . . . . . . . . . . 0 0 0 0 0 0 0 0 0 0 0 0 0 0 0 May 2041 . . . . . . . . . . . . 0 0 0 0 0 0 0 0 0 0 0 0 0 0 0 May 2042 . . . . . . . . . . . . 0 0 0 0 0 0 0 0 0 0 0 0 0 0 0 May 2043 . . . . . . . . . . . . 0 0 0 0 0 0 0 0 0 0 0 0 0 0 0 May 2044 . . . . . . . . . . . . 0 0 0 0 0 0 0 0 0 0 0 0 0 0 0 May 2045 . . . . . . . . . . . . 0 0 0 0 0 0 0 0 0 0 0 0 0 0 0 May 2046 . . . . . . . . . . . . 0 0 0 0 0 0 0 0 0 0 0 0 0 0 0 Weighted Average
Life (years) . . . . . . . . . 11.1 7.6 5.4 4.1 3.2 11.2 7.6 5.4 4.1 3.2 11.6 7.8 5.5 4.1 3.2
S-36

Security Group 6 PSA Prepayment Assumption Rates
Classes NK and TK Classes NL and TL Class SA
Distribution Date 0% 100% 200% 300% 400% 0% 100% 200% 300% 400% 0% 100% 200% 300% 400%
Initial Percent . . . . . . . . . 100 100 100 100 100 100 100 100 100 100 100 100 100 100 100 May 2021 . . . . . . . . . . . . 97 91 85 79 74 96 90 83 77 70 97 91 85 79 74 May 2022 . . . . . . . . . . . . 94 83 73 63 54 93 80 69 58 48 94 83 72 63 54 May 2023 . . . . . . . . . . . . 90 75 61 50 40 89 71 56 43 31 90 75 61 50 40 May 2024 . . . . . . . . . . . . 87 68 52 39 29 84 63 45 31 19 87 68 52 39 29 May 2025 . . . . . . . . . . . . 83 61 44 31 21 80 55 36 21 10 83 61 44 31 21 May 2026 . . . . . . . . . . . . 79 54 37 24 15 75 48 28 13 4 79 54 37 24 15 May 2027 . . . . . . . . . . . . 75 48 30 19 11 70 41 21 7 0 74 48 30 19 11 May 2028 . . . . . . . . . . . . 70 43 25 14 8 65 34 15 3 0 70 43 25 14 8 May 2029 . . . . . . . . . . . . 65 37 21 11 6 59 28 10 0 0 65 37 21 11 6 May 2030 . . . . . . . . . . . . 60 33 17 8 4 53 23 5 0 0 60 32 17 8 4 May 2031 . . . . . . . . . . . . 55 28 14 6 3 47 17 1 0 0 55 28 13 6 3 May 2032 . . . . . . . . . . . . 50 24 11 5 2 41 12 0 0 0 49 23 11 5 2 May 2033 . . . . . . . . . . . . 44 20 8 3 1 34 8 0 0 0 43 19 8 3 1 May 2034 . . . . . . . . . . . . 38 16 6 2 1 27 3 0 0 0 37 16 6 2 1 May 2035 . . . . . . . . . . . . 31 12 5 2 1 19 0 0 0 0 31 12 5 2 1 May 2036 . . . . . . . . . . . . 24 9 3 1 0 11 0 0 0 0 24 9 3 1 0 May 2037 . . . . . . . . . . . . 17 6 2 1 0 3 0 0 0 0 17 6 2 1 0 May 2038 . . . . . . . . . . . . 10 3 1 0 0 0 0 0 0 0 9 3 1 0 0 May 2039 . . . . . . . . . . . . 2 1 0 0 0 0 0 0 0 0 1 0 0 0 0 May 2040 . . . . . . . . . . . . 0 0 0 0 0 0 0 0 0 0 0 0 0 0 0 May 2041 . . . . . . . . . . . . 0 0 0 0 0 0 0 0 0 0 0 0 0 0 0 May 2042 . . . . . . . . . . . . 0 0 0 0 0 0 0 0 0 0 0 0 0 0 0 May 2043 . . . . . . . . . . . . 0 0 0 0 0 0 0 0 0 0 0 0 0 0 0 May 2044 . . . . . . . . . . . . 0 0 0 0 0 0 0 0 0 0 0 0 0 0 0 May 2045 . . . . . . . . . . . . 0 0 0 0 0 0 0 0 0 0 0 0 0 0 0 May 2046 . . . . . . . . . . . . 0 0 0 0 0 0 0 0 0 0 0 0 0 0 0 Weighted Average
Life (years) . . . . . . . . . 11.2 7.6 5.4 4.1 3.2 10.0 6.2 4.2 3.0 2.3 11.2 7.6 5.4 4.1 3.2
PSA Prepayment Assumption Rates
Class SF Class TA Class TF
Distribution Date 0% 100% 200% 300% 400% 0% 100% 200% 300% 400% 0% 100% 200% 300% 400%
Initial Percent . . . . . . . . . 100 100 100 100 100 100 100 100 100 100 100 100 100 100 100 May 2021 . . . . . . . . . . . . 97 91 85 79 73 97 91 85 79 74 97 91 85 79 73 May 2022 . . . . . . . . . . . . 94 82 72 62 53 94 83 72 63 54 93 82 72 62 53 May 2023 . . . . . . . . . . . . 90 74 61 49 39 90 75 61 50 40 90 74 61 49 38 May 2024 . . . . . . . . . . . . 86 67 51 38 28 87 68 52 39 29 86 67 51 38 27 May 2025 . . . . . . . . . . . . 82 60 43 29 20 83 61 44 31 21 82 60 42 29 19 May 2026 . . . . . . . . . . . . 78 53 35 23 14 79 54 37 24 15 78 53 35 22 13 May 2027 . . . . . . . . . . . . 74 47 29 17 9 74 48 30 19 11 74 47 29 17 9 May 2028 . . . . . . . . . . . . 69 42 24 13 7 70 43 25 14 8 69 41 24 12 7 May 2029 . . . . . . . . . . . . 65 36 19 10 5 65 37 21 11 6 64 36 19 9 5 May 2030 . . . . . . . . . . . . 59 31 15 7 3 60 32 17 8 4 59 31 15 7 3 May 2031 . . . . . . . . . . . . 54 27 12 5 2 55 28 13 6 3 54 26 12 5 2 May 2032 . . . . . . . . . . . . 48 22 9 4 2 49 23 11 5 2 48 22 9 4 2 May 2033 . . . . . . . . . . . . 43 18 7 3 1 43 19 8 3 1 42 18 7 3 1 May 2034 . . . . . . . . . . . . 36 14 5 2 1 37 16 6 2 1 36 14 5 2 1 May 2035 . . . . . . . . . . . . 30 11 4 1 0 31 12 5 2 1 29 10 4 1 0 May 2036 . . . . . . . . . . . . 23 8 3 1 0 24 9 3 1 0 22 8 3 1 0 May 2037 . . . . . . . . . . . . 15 5 2 1 0 17 6 2 1 0 15 5 2 1 0 May 2038 . . . . . . . . . . . . 8 3 1 0 0 9 3 1 0 0 8 3 1 0 0 May 2039 . . . . . . . . . . . . 2 0 0 0 0 1 0 0 0 0 2 1 0 0 0 May 2040 . . . . . . . . . . . . 0 0 0 0 0 0 0 0 0 0 0 0 0 0 0 May 2041 . . . . . . . . . . . . 0 0 0 0 0 0 0 0 0 0 0 0 0 0 0 May 2042 . . . . . . . . . . . . 0 0 0 0 0 0 0 0 0 0 0 0 0 0 0 May 2043 . . . . . . . . . . . . 0 0 0 0 0 0 0 0 0 0 0 0 0 0 0 May 2044 . . . . . . . . . . . . 0 0 0 0 0 0 0 0 0 0 0 0 0 0 0 May 2045 . . . . . . . . . . . . 0 0 0 0 0 0 0 0 0 0 0 0 0 0 0 May 2046 . . . . . . . . . . . . 0 0 0 0 0 0 0 0 0 0 0 0 0 0 0 Weighted Average
Life (years) . . . . . . . . . 11.0 7.4 5.3 3.9 3.1 11.2 7.6 5.4 4.1 3.2 11.0 7.4 5.2 3.9 3.0
S-37

Security Group 7 PSA Prepayment Assumption Rates
Classes KA, KC and KI Class KY Class KZ
Distribution Date 0% 430% 475% 550% 1,000% 0% 430% 475% 550% 1,000% 0% 430% 475% 550% 1,000%
Initial Percent . . . . 100 100 100 100 100 100 100 100 100 100 100 100 100 100 100 May 2021 . . . . . . . 98 91 91 91 91 100 100 100 100 100 104 104 96 83 1 May 2022 . . . . . . . 96 72 72 72 54 100 100 100 100 100 108 108 83 41 0 May 2023 . . . . . . . 94 50 50 50 22 100 100 100 100 100 113 113 71 6 0 May 2024 . . . . . . . 92 33 33 33 9 100 100 100 100 75 117 117 70 0 0 May 2025 . . . . . . . 90 22 22 22 3 100 100 100 100 29 122 110 65 0 0 May 2026 . . . . . . . 87 14 14 14 1 100 100 100 100 11 127 97 56 0 0 May 2027 . . . . . . . 85 9 9 9 0 100 81 81 81 4 132 81 46 0 0 May 2028 . . . . . . . 82 6 6 6 0 100 53 53 53 1 138 66 36 0 0 May 2029 . . . . . . . 79 4 4 4 0 100 34 34 34 0 143 52 28 0 0 May 2030 . . . . . . . 76 2 2 2 0 100 22 22 22 0 149 41 22 0 0 May 2031 . . . . . . . 73 2 2 2 0 100 14 14 14 0 155 31 16 0 0 May 2032 . . . . . . . 70 1 1 1 0 100 8 8 8 0 161 24 12 0 0 May 2033 . . . . . . . 67 1 1 1 0 100 5 5 5 0 168 18 9 0 0 May 2034 . . . . . . . 63 0 0 0 0 100 3 3 3 0 175 13 6 0 0 May 2035 . . . . . . . 59 0 0 0 0 100 1 1 1 0 182 10 5 0 0 May 2036 . . . . . . . 55 0 0 0 0 100 0 0 0 0 189 7 3 0 0 May 2037 . . . . . . . 51 0 0 0 0 100 0 0 0 0 197 5 2 0 0 May 2038 . . . . . . . 46 0 0 0 0 100 0 0 0 0 205 4 2 0 0 May 2039 . . . . . . . 42 0 0 0 0 100 0 0 0 0 214 3 1 0 0 May 2040 . . . . . . . 37 0 0 0 0 100 0 0 0 0 222 2 1 0 0 May 2041 . . . . . . . 31 0 0 0 0 100 0 0 0 0 231 1 0 0 0 May 2042 . . . . . . . 26 0 0 0 0 100 0 0 0 0 241 1 0 0 0 May 2043 . . . . . . . 20 0 0 0 0 100 0 0 0 0 251 1 0 0 0 May 2044 . . . . . . . 14 0 0 0 0 100 0 0 0 0 261 0 0 0 0 May 2045 . . . . . . . 7 0 0 0 0 65 0 0 0 0 271 0 0 0 0 May 2046 . . . . . . . 1 0 0 0 0 5 0 0 0 0 282 0 0 0 0 May 2047 . . . . . . . 0 0 0 0 0 0 0 0 0 0 224 0 0 0 0 May 2048 . . . . . . . 0 0 0 0 0 0 0 0 0 0 154 0 0 0 0 May 2049 . . . . . . . 0 0 0 0 0 0 0 0 0 0 79 0 0 0 0 May 2050 . . . . . . . 0 0 0 0 0 0 0 0 0 0 0 0 0 0 0 Weighted Average
Life (years) . . . . 15.9 3.6 3.6 3.6 2.3 25.3 8.7 8.7 8.7 4.7 28.1 9.4 6.8 1.8 0.7
PSA Prepayment Assumption Rates
Class UA Class ZK
Distribution Date 0% 430% 475% 550% 1,000% 0% 430% 475% 550% 1,000%
Initial Percent . . . . . 100 100 100 100 100 100 100 100 100 100 May 2021 . . . . . . . . . 98 90 90 90 90 104 104 104 104 104 May 2022 . . . . . . . . . 96 69 69 69 48 108 108 108 108 108 May 2023 . . . . . . . . . 93 44 44 44 12 113 113 113 113 113 May 2024 . . . . . . . . . 91 25 25 25 0 117 117 117 117 117 May 2025 . . . . . . . . . 88 12 12 12 0 122 122 122 122 122 May 2026 . . . . . . . . . 86 3 3 3 0 127 127 127 127 127 May 2027 . . . . . . . . . 83 0 0 0 0 132 132 132 132 132 May 2028 . . . . . . . . . 80 0 0 0 0 138 138 138 138 138 May 2029 . . . . . . . . . 77 0 0 0 0 143 143 143 143 92 May 2030 . . . . . . . . . 73 0 0 0 0 149 149 149 149 36 May 2031 . . . . . . . . . 70 0 0 0 0 155 155 155 155 14 May 2032 . . . . . . . . . 66 0 0 0 0 161 161 161 161 5 May 2033 . . . . . . . . . 62 0 0 0 0 168 168 168 168 2 May 2034 . . . . . . . . . 58 0 0 0 0 175 175 175 175 1 May 2035 . . . . . . . . . 54 0 0 0 0 182 182 182 182 0 May 2036 . . . . . . . . . 49 0 0 0 0 189 189 189 189 0 May 2037 . . . . . . . . . 44 0 0 0 0 197 136 136 136 0 May 2038 . . . . . . . . . 39 0 0 0 0 205 86 86 86 0 May 2039 . . . . . . . . . 34 0 0 0 0 214 54 54 54 0 May 2040 . . . . . . . . . 28 0 0 0 0 222 33 33 33 0 May 2041 . . . . . . . . . 23 0 0 0 0 231 21 21 21 0 May 2042 . . . . . . . . . 16 0 0 0 0 241 12 12 12 0 May 2043 . . . . . . . . . 10 0 0 0 0 251 7 7 7 0 May 2044 . . . . . . . . . 3 0 0 0 0 261 4 4 4 0 May 2045 . . . . . . . . . 0 0 0 0 0 271 2 2 2 0 May 2046 . . . . . . . . . 0 0 0 0 0 282 1 1 1 0 May 2047 . . . . . . . . . 0 0 0 0 0 1 1 1 1 0 May 2048 . . . . . . . . . 0 0 0 0 0 0 0 0 0 0 May 2049 . . . . . . . . . 0 0 0 0 0 0 0 0 0 0 May 2050 . . . . . . . . . 0 0 0 0 0 0 0 0 0 0 Weighted Average
Life (years) . . . . . 14.7 2.9 2.9 2.9 2.0 26.1 18.4 18.4 18.4 9.6
S-38

Security Group 8 PSA Prepayment Assumption Rates
Classes HA, HB, HC, HD, HE, HG, HI, HJ and HT
Distribution Date 0% 200% 420% 650% 900%
Initial Percent . . . . . . . . . 100 100 100 100 100 May 2021 . . . . . . . . . . . . 98 86 73 60 45 May 2022 . . . . . . . . . . . . 96 75 54 36 20 May 2023 . . . . . . . . . . . . 94 64 39 21 9 May 2024 . . . . . . . . . . . . 92 55 29 13 4 May 2025 . . . . . . . . . . . . 90 47 21 8 2 May 2026 . . . . . . . . . . . . 88 41 15 5 1 May 2027 . . . . . . . . . . . . 85 35 11 3 0 May 2028 . . . . . . . . . . . . 82 30 8 2 0 May 2029 . . . . . . . . . . . . 80 25 6 1 0 May 2030 . . . . . . . . . . . . 77 21 4 1 0 May 2031 . . . . . . . . . . . . 74 18 3 0 0 May 2032 . . . . . . . . . . . . 71 15 2 0 0 May 2033 . . . . . . . . . . . . 67 13 2 0 0 May 2034 . . . . . . . . . . . . 64 11 1 0 0 May 2035 . . . . . . . . . . . . 60 9 1 0 0 May 2036 . . . . . . . . . . . . 57 7 1 0 0 May 2037 . . . . . . . . . . . . 53 6 0 0 0 May 2038 . . . . . . . . . . . . 48 5 0 0 0 May 2039 . . . . . . . . . . . . 44 4 0 0 0 May 2040 . . . . . . . . . . . . 39 3 0 0 0 May 2041 . . . . . . . . . . . . 34 2 0 0 0 May 2042 . . . . . . . . . . . . 29 2 0 0 0 May 2043 . . . . . . . . . . . . 24 1 0 0 0 May 2044 . . . . . . . . . . . . 18 1 0 0 0 May 2045 . . . . . . . . . . . . 13 1 0 0 0 May 2046 . . . . . . . . . . . . 7 0 0 0 0 May 2047 . . . . . . . . . . . . 1 0 0 0 0 May 2048 . . . . . . . . . . . . 0 0 0 0 0 Weighted Average
Life (years) . . . . . . . . . 16.4 6.3 3.2 2.0 1.3
Security Group 9 PSA Prepayment Assumption Rates
Classes AP and IA Class ZA
Distribution Date 0% 125% 200% 250% 400% 0% 125% 200% 250% 400%
Initial Percent . . . . . . . . . 100 100 100 100 100 100 100 100 100 100 May 2021 . . . . . . . . . . . . 97 95 95 95 95 103 103 97 93 82 May 2022 . . . . . . . . . . . . 95 87 87 87 87 106 106 85 72 31 May 2023 . . . . . . . . . . . . 92 76 76 76 70 109 109 69 43 0 May 2024 . . . . . . . . . . . . 89 66 66 66 52 113 113 56 22 0 May 2025 . . . . . . . . . . . . 86 57 57 57 39 116 116 49 9 0 May 2026 . . . . . . . . . . . . 83 48 48 48 28 120 120 44 2 0 May 2027 . . . . . . . . . . . . 80 40 40 40 21 123 123 43 0 0 May 2028 . . . . . . . . . . . . 76 33 33 33 16 127 125 43 0 0 May 2029 . . . . . . . . . . . . 73 27 27 27 11 131 124 41 0 0 May 2030 . . . . . . . . . . . . 69 22 22 22 8 135 120 39 0 0 May 2031 . . . . . . . . . . . . 65 18 18 18 6 139 115 36 0 0 May 2032 . . . . . . . . . . . . 61 15 15 15 4 143 109 33 0 0 May 2033 . . . . . . . . . . . . 57 12 12 12 3 148 102 30 0 0 May 2034 . . . . . . . . . . . . 53 10 10 10 2 152 94 27 0 0 May 2035 . . . . . . . . . . . . 48 8 8 8 2 157 86 24 0 0 May 2036 . . . . . . . . . . . . 43 6 6 6 1 162 78 21 0 0 May 2037 . . . . . . . . . . . . 38 5 5 5 1 166 70 18 0 0 May 2038 . . . . . . . . . . . . 33 4 4 4 1 171 62 16 0 0 May 2039 . . . . . . . . . . . . 28 3 3 3 0 177 55 13 0 0 May 2040 . . . . . . . . . . . . 22 2 2 2 0 182 48 11 0 0 May 2041 . . . . . . . . . . . . 16 2 2 2 0 188 41 9 0 0 May 2042 . . . . . . . . . . . . 10 1 1 1 0 193 35 8 0 0 May 2043 . . . . . . . . . . . . 4 1 1 1 0 199 29 6 0 0 May 2044 . . . . . . . . . . . . 1 1 1 1 0 186 23 5 0 0 May 2045 . . . . . . . . . . . . 1 1 1 1 0 159 18 4 0 0 May 2046 . . . . . . . . . . . . 0 0 0 0 0 130 13 3 0 0 May 2047 . . . . . . . . . . . . 0 0 0 0 0 100 9 2 0 0 May 2048 . . . . . . . . . . . . 0 0 0 0 0 69 5 1 0 0 May 2049 . . . . . . . . . . . . 0 0 0 0 0 35 1 0 0 0 May 2050 . . . . . . . . . . . . 0 0 0 0 0 0 0 0 0 0 Weighted Average
Life (years) . . . . . . . . . 13.7 6.9 6.9 6.9 5.0 26.9 18.4 8.8 2.9 1.6
S-39

Security Group 10 PSA Prepayment Assumption Rates
Classes CA, CD and CI Class CS Class CW Class IC
Distribution Date 0% 185% 350% 400% 700% 0% 185% 350% 400% 700% 0% 185% 350% 400% 700% 0% 185% 350% 400% 700%
Initial Percent . . . . . . . . . 100 100 100 100 100 100 100 100 100 100 100 100 100 100 100 100 100 100 100 100 May 2021 . . . . . . . . . . . . 98 93 93 93 93 100 100 88 85 63 100 100 100 100 100 99 95 92 91 85 May 2022 . . . . . . . . . . . . 96 80 80 80 79 100 100 65 55 0 100 100 100 100 100 97 86 77 74 58 May 2023 . . . . . . . . . . . . 94 65 65 65 44 100 100 42 26 0 100 100 100 100 100 96 75 60 55 33 May 2024 . . . . . . . . . . . . 92 52 52 52 24 100 100 28 9 0 100 100 100 100 100 94 65 46 41 19 May 2025 . . . . . . . . . . . . 89 40 40 40 13 100 100 20 2 0 100 100 100 100 100 92 57 36 31 11 May 2026 . . . . . . . . . . . . 87 29 29 29 6 100 100 18 0 0 100 100 100 100 100 91 49 28 23 6 May 2027 . . . . . . . . . . . . 84 21 21 21 3 100 97 16 0 0 100 100 100 100 100 89 43 21 17 3 May 2028 . . . . . . . . . . . . 82 15 15 15 0 100 92 14 0 0 100 100 100 100 100 87 37 16 12 2 May 2029 . . . . . . . . . . . . 79 11 11 11 0 100 86 12 0 0 100 100 100 100 67 85 32 13 9 1 May 2030 . . . . . . . . . . . . 76 7 7 7 0 100 78 11 0 0 100 100 100 100 38 83 28 10 7 1 May 2031 . . . . . . . . . . . . 72 5 5 5 0 100 70 9 0 0 100 100 100 100 21 80 24 7 5 0 May 2032 . . . . . . . . . . . . 69 3 3 3 0 100 63 7 0 0 100 100 100 100 12 78 20 6 4 0 May 2033 . . . . . . . . . . . . 65 1 1 1 0 100 55 6 0 0 100 100 100 100 7 75 17 4 3 0 May 2034 . . . . . . . . . . . . 61 0 0 0 0 100 49 5 0 0 100 100 100 100 4 72 15 3 2 0 May 2035 . . . . . . . . . . . . 57 0 0 0 0 100 42 4 0 0 100 86 86 86 2 69 13 2 1 0 May 2036 . . . . . . . . . . . . 53 0 0 0 0 100 36 3 0 0 100 62 62 62 1 66 11 2 1 0 May 2037 . . . . . . . . . . . . 49 0 0 0 0 100 31 2 0 0 100 45 45 45 1 63 9 1 1 0 May 2038 . . . . . . . . . . . . 44 0 0 0 0 100 26 2 0 0 100 32 32 32 0 60 8 1 1 0 May 2039 . . . . . . . . . . . . 39 0 0 0 0 100 22 1 0 0 100 23 23 23 0 56 6 1 0 0 May 2040 . . . . . . . . . . . . 33 0 0 0 0 100 18 1 0 0 100 16 16 16 0 52 5 1 0 0 May 2041 . . . . . . . . . . . . 28 0 0 0 0 100 15 1 0 0 100 11 11 11 0 48 4 0 0 0 May 2042 . . . . . . . . . . . . 22 0 0 0 0 100 12 1 0 0 100 7 7 7 0 44 3 0 0 0 May 2043 . . . . . . . . . . . . 16 0 0 0 0 100 10 0 0 0 100 5 5 5 0 40 3 0 0 0 May 2044 . . . . . . . . . . . . 9 0 0 0 0 100 8 0 0 0 100 3 3 3 0 35 2 0 0 0 May 2045 . . . . . . . . . . . . 2 0 0 0 0 100 6 0 0 0 100 2 2 2 0 30 2 0 0 0 May 2046 . . . . . . . . . . . . 0 0 0 0 0 92 4 0 0 0 1 1 1 1 0 24 1 0 0 0 May 2047 . . . . . . . . . . . . 0 0 0 0 0 70 3 0 0 0 1 1 1 1 0 19 1 0 0 0 May 2048 . . . . . . . . . . . . 0 0 0 0 0 48 2 0 0 0 0 0 0 0 0 13 0 0 0 0 May 2049 . . . . . . . . . . . . 0 0 0 0 0 25 1 0 0 0 0 0 0 0 0 7 0 0 0 0 May 2050 . . . . . . . . . . . . 0 0 0 0 0 0 0 0 0 0 0 0 0 0 0 0 0 0 0 0 Weighted Average
Life (years) . . . . . . . . . 15.5 4.7 4.7 4.7 3.1 27.9 14.8 4.1 2.3 1.2 25.5 17.5 17.5 17.5 10.1 19.0 7.6 4.8 4.3 2.7
Security Group 11 PSA Prepayment Assumption Rates
Classes BC, BI, D, DA and DB
Distribution Date 0% 200% 400% 600% 800%
Initial Percent . . . . . . . . . 100 100 100 100 100 May 2021 . . . . . . . . . . . . 99 88 77 66 56 May 2022 . . . . . . . . . . . . 98 76 58 42 28 May 2023 . . . . . . . . . . . . 96 66 43 26 15 May 2024 . . . . . . . . . . . . 95 57 32 16 7 May 2025 . . . . . . . . . . . . 94 49 24 10 4 May 2026 . . . . . . . . . . . . 92 42 18 6 2 May 2027 . . . . . . . . . . . . 90 36 13 4 1 May 2028 . . . . . . . . . . . . 89 31 10 3 0 May 2029 . . . . . . . . . . . . 87 26 7 2 0 May 2030 . . . . . . . . . . . . 85 23 5 1 0 May 2031 . . . . . . . . . . . . 83 19 4 1 0 May 2032 . . . . . . . . . . . . 80 16 3 0 0 May 2033 . . . . . . . . . . . . 78 14 2 0 0 May 2034 . . . . . . . . . . . . 75 12 2 0 0 May 2035 . . . . . . . . . . . . 73 10 1 0 0 May 2036 . . . . . . . . . . . . 70 8 1 0 0 May 2037 . . . . . . . . . . . . 66 7 1 0 0 May 2038 . . . . . . . . . . . . 63 5 0 0 0 May 2039 . . . . . . . . . . . . 59 4 0 0 0 May 2040 . . . . . . . . . . . . 56 4 0 0 0 May 2041 . . . . . . . . . . . . 52 3 0 0 0 May 2042 . . . . . . . . . . . . 47 2 0 0 0 May 2043 . . . . . . . . . . . . 43 2 0 0 0 May 2044 . . . . . . . . . . . . 38 1 0 0 0 May 2045 . . . . . . . . . . . . 32 1 0 0 0 May 2046 . . . . . . . . . . . . 27 1 0 0 0 May 2047 . . . . . . . . . . . . 21 0 0 0 0 May 2048 . . . . . . . . . . . . 14 0 0 0 0 May 2049 . . . . . . . . . . . . 7 0 0 0 0 May 2050 . . . . . . . . . . . . 0 0 0 0 0 Weighted Average
Life (years) . . . . . . . . . 19.6 6.5 3.5 2.3 1.6
S-40

Security Group 12 PSA Prepayment Assumption Rates
Classes BJ, BK, BL, BP and IG
Distribution Date 0% 150% 350% 500% 700%
Initial Percent . . . . . . . . . 100 100 100 100 100 May 2021 . . . . . . . . . . . . 99 91 82 75 66 May 2022 . . . . . . . . . . . . 97 82 64 52 38 May 2023 . . . . . . . . . . . . 96 73 49 36 21 May 2024 . . . . . . . . . . . . 95 65 38 24 12 May 2025 . . . . . . . . . . . . 93 58 30 17 7 May 2026 . . . . . . . . . . . . 91 52 23 11 4 May 2027 . . . . . . . . . . . . 90 46 18 8 2 May 2028 . . . . . . . . . . . . 88 41 14 5 1 May 2029 . . . . . . . . . . . . 86 36 10 4 1 May 2030 . . . . . . . . . . . . 84 32 8 2 0 May 2031 . . . . . . . . . . . . 81 28 6 2 0 May 2032 . . . . . . . . . . . . 79 24 5 1 0 May 2033 . . . . . . . . . . . . 77 21 4 1 0 May 2034 . . . . . . . . . . . . 74 19 3 1 0 May 2035 . . . . . . . . . . . . 71 16 2 0 0 May 2036 . . . . . . . . . . . . 68 14 1 0 0 May 2037 . . . . . . . . . . . . 65 12 1 0 0 May 2038 . . . . . . . . . . . . 61 10 1 0 0 May 2039 . . . . . . . . . . . . 58 9 1 0 0 May 2040 . . . . . . . . . . . . 54 7 0 0 0 May 2041 . . . . . . . . . . . . 50 6 0 0 0 May 2042 . . . . . . . . . . . . 46 5 0 0 0 May 2043 . . . . . . . . . . . . 41 4 0 0 0 May 2044 . . . . . . . . . . . . 36 3 0 0 0 May 2045 . . . . . . . . . . . . 31 2 0 0 0 May 2046 . . . . . . . . . . . . 26 1 0 0 0 May 2047 . . . . . . . . . . . . 20 1 0 0 0 May 2048 . . . . . . . . . . . . 14 0 0 0 0 May 2049 . . . . . . . . . . . . 7 0 0 0 0 May 2050 . . . . . . . . . . . . 0 0 0 0 0 Weighted Average
Life (years) . . . . . . . . . 19.3 8.1 4.1 2.9 2.0
Security Group 13 PSA Prepayment Assumption Rates
Classes N and TN Class NM Classes NP and TP
Distribution Date 0% 100% 200% 300% 400% 0% 100% 200% 300% 400% 0% 100% 200% 300% 400%
Initial Percent . . . . . . . . . 100 100 100 100 100 100 100 100 100 100 100 100 100 100 100 May 2021 . . . . . . . . . . . . 97 91 85 79 74 97 91 85 79 74 97 91 85 79 74 May 2022 . . . . . . . . . . . . 93 83 72 63 54 93 83 72 63 54 94 83 73 63 54 May 2023 . . . . . . . . . . . . 90 75 61 50 39 90 75 61 50 39 90 75 62 50 40 May 2024 . . . . . . . . . . . . 86 67 52 39 29 86 67 52 39 29 87 68 52 39 29 May 2025 . . . . . . . . . . . . 82 61 44 31 21 82 60 44 31 21 83 61 44 31 21 May 2026 . . . . . . . . . . . . 78 54 36 24 15 78 54 36 24 15 79 55 37 24 15 May 2027 . . . . . . . . . . . . 74 48 30 18 11 74 48 30 18 11 75 49 31 19 11 May 2028 . . . . . . . . . . . . 70 42 25 14 8 70 42 25 14 8 71 43 25 14 8 May 2029 . . . . . . . . . . . . 65 37 21 11 5 65 37 21 11 5 66 38 21 11 6 May 2030 . . . . . . . . . . . . 60 32 17 8 4 60 32 17 8 4 62 33 17 8 4 May 2031 . . . . . . . . . . . . 55 28 13 6 3 55 28 13 6 3 57 29 14 6 3 May 2032 . . . . . . . . . . . . 49 24 11 5 2 49 24 11 5 2 51 24 11 5 2 May 2033 . . . . . . . . . . . . 44 20 8 3 1 44 20 8 3 1 46 21 9 3 1 May 2034 . . . . . . . . . . . . 38 16 6 2 1 38 16 6 2 1 40 17 7 3 1 May 2035 . . . . . . . . . . . . 32 12 5 2 1 31 12 5 2 1 34 14 5 2 1 May 2036 . . . . . . . . . . . . 25 9 3 1 0 25 9 3 1 0 28 10 4 1 0 May 2037 . . . . . . . . . . . . 18 6 2 1 0 18 6 2 1 0 21 7 2 1 0 May 2038 . . . . . . . . . . . . 11 4 1 0 0 11 4 1 0 0 14 5 1 0 0 May 2039 . . . . . . . . . . . . 3 1 0 0 0 3 1 0 0 0 7 2 1 0 0 May 2040 . . . . . . . . . . . . 0 0 0 0 0 0 0 0 0 0 1 0 0 0 0 May 2041 . . . . . . . . . . . . 0 0 0 0 0 0 0 0 0 0 0 0 0 0 0 May 2042 . . . . . . . . . . . . 0 0 0 0 0 0 0 0 0 0 0 0 0 0 0 May 2043 . . . . . . . . . . . . 0 0 0 0 0 0 0 0 0 0 0 0 0 0 0 May 2044 . . . . . . . . . . . . 0 0 0 0 0 0 0 0 0 0 0 0 0 0 0 Weighted Average
Life (years) . . . . . . . . . 11.2 7.6 5.4 4.1 3.2 11.2 7.6 5.4 4.1 3.2 11.6 7.8 5.5 4.1 3.2
S-41

Security Group 13 PSA Prepayment Assumption Rates
Classes NQ and TQ Class SM Class TM
Distribution Date 0% 100% 200% 300% 400% 0% 100% 200% 300% 400% 0% 100% 200% 300% 400%
Initial Percent . . . . . . . . . 100 100 100 100 100 100 100 100 100 100 100 100 100 100 100 May 2021 . . . . . . . . . . . . 97 91 85 80 74 97 91 85 79 74 97 91 85 80 74 May 2022 . . . . . . . . . . . . 94 83 73 63 54 94 83 73 63 54 94 83 73 63 54 May 2023 . . . . . . . . . . . . 91 75 62 50 40 90 75 62 50 40 90 75 62 50 40 May 2024 . . . . . . . . . . . . 87 68 52 39 29 87 68 52 39 29 87 68 52 39 29 May 2025 . . . . . . . . . . . . 84 61 44 31 21 83 61 44 31 21 83 61 44 31 21 May 2026 . . . . . . . . . . . . 80 55 37 24 15 79 55 37 24 15 79 55 37 24 15 May 2027 . . . . . . . . . . . . 76 49 31 19 11 75 49 31 19 11 75 49 31 19 11 May 2028 . . . . . . . . . . . . 72 44 26 15 8 71 43 25 14 8 71 43 26 15 8 May 2029 . . . . . . . . . . . . 67 39 21 11 6 66 38 21 11 6 67 38 21 11 6 May 2030 . . . . . . . . . . . . 63 34 17 9 4 62 33 17 8 4 62 33 17 8 4 May 2031 . . . . . . . . . . . . 58 29 14 7 3 57 29 14 6 3 57 29 14 6 3 May 2032 . . . . . . . . . . . . 53 25 11 5 2 52 25 11 5 2 52 25 11 5 2 May 2033 . . . . . . . . . . . . 48 21 9 4 1 46 21 9 3 1 46 21 9 4 1 May 2034 . . . . . . . . . . . . 42 18 7 3 1 40 17 7 3 1 41 17 7 3 1 May 2035 . . . . . . . . . . . . 36 14 5 2 1 34 14 5 2 1 35 14 5 2 1 May 2036 . . . . . . . . . . . . 30 11 4 1 0 28 10 4 1 0 28 11 4 1 0 May 2037 . . . . . . . . . . . . 24 8 3 1 0 21 7 2 1 0 22 8 2 1 0 May 2038 . . . . . . . . . . . . 17 6 2 0 0 15 5 1 0 0 15 5 1 0 0 May 2039 . . . . . . . . . . . . 10 3 1 0 0 7 2 1 0 0 8 2 1 0 0 May 2040 . . . . . . . . . . . . 3 1 0 0 0 1 0 0 0 0 2 0 0 0 0 May 2041 . . . . . . . . . . . . 0 0 0 0 0 0 0 0 0 0 0 0 0 0 0 May 2042 . . . . . . . . . . . . 0 0 0 0 0 0 0 0 0 0 0 0 0 0 0 May 2043 . . . . . . . . . . . . 0 0 0 0 0 0 0 0 0 0 0 0 0 0 0 May 2044 . . . . . . . . . . . . 0 0 0 0 0 0 0 0 0 0 0 0 0 0 0 Weighted Average
Life (years) . . . . . . . . . 11.8 7.9 5.6 4.1 3.2 11.6 7.8 5.5 4.1 3.2 11.6 7.8 5.5 4.1 3.2
Security Group 14 PSA Prepayment Assumption Rates
Class NS Classes NT and T Classes NU and TU
Distribution Date 0% 100% 200% 300% 400% 0% 100% 200% 300% 400% 0% 100% 200% 300% 400%
Initial Percent . . . . . . . . . 100 100 100 100 100 100 100 100 100 100 100 100 100 100 100 May 2021 . . . . . . . . . . . . 97 91 85 79 74 99 96 93 86 81 97 91 85 79 74 May 2022 . . . . . . . . . . . . 94 83 72 63 54 97 92 86 76 66 93 82 72 63 54 May 2023 . . . . . . . . . . . . 90 75 61 50 40 96 89 80 67 54 90 75 61 50 39 May 2024 . . . . . . . . . . . . 87 68 52 39 29 94 85 75 56 44 86 67 52 39 29 May 2025 . . . . . . . . . . . . 83 61 44 31 21 93 82 66 46 36 82 60 43 30 21 May 2026 . . . . . . . . . . . . 79 54 37 24 15 91 80 58 39 30 78 54 36 24 15 May 2027 . . . . . . . . . . . . 75 48 31 19 11 89 75 51 34 22 74 48 30 18 11 May 2028 . . . . . . . . . . . . 70 43 25 14 8 87 70 45 29 16 69 42 25 14 8 May 2029 . . . . . . . . . . . . 66 38 21 11 6 85 65 40 22 11 65 37 21 11 5 May 2030 . . . . . . . . . . . . 61 33 17 8 4 83 61 35 17 8 60 32 17 8 4 May 2031 . . . . . . . . . . . . 56 28 14 6 3 81 57 29 13 6 55 28 13 6 3 May 2032 . . . . . . . . . . . . 51 24 11 5 2 79 51 23 10 4 50 24 11 5 2 May 2033 . . . . . . . . . . . . 46 20 9 3 1 74 45 18 7 3 44 20 8 3 1 May 2034 . . . . . . . . . . . . 40 17 7 2 1 69 40 14 5 2 38 16 6 2 1 May 2035 . . . . . . . . . . . . 34 14 5 2 1 63 32 10 4 1 32 13 5 2 1 May 2036 . . . . . . . . . . . . 28 10 4 1 0 58 24 8 3 1 26 10 3 1 0 May 2037 . . . . . . . . . . . . 22 8 2 1 0 49 16 5 2 0 19 7 2 1 0 May 2038 . . . . . . . . . . . . 15 5 1 0 0 37 10 3 1 0 12 4 1 0 0 May 2039 . . . . . . . . . . . . 8 3 1 0 0 19 5 1 0 0 5 2 0 0 0 May 2040 . . . . . . . . . . . . 3 1 0 0 0 7 2 1 0 0 0 0 0 0 0 May 2041 . . . . . . . . . . . . 1 0 0 0 0 3 1 0 0 0 0 0 0 0 0 May 2042 . . . . . . . . . . . . 0 0 0 0 0 1 0 0 0 0 0 0 0 0 0 May 2043 . . . . . . . . . . . . 0 0 0 0 0 0 0 0 0 0 0 0 0 0 0 May 2044 . . . . . . . . . . . . 0 0 0 0 0 0 0 0 0 0 0 0 0 0 0 May 2045 . . . . . . . . . . . . 0 0 0 0 0 0 0 0 0 0 0 0 0 0 0 May 2046 . . . . . . . . . . . . 0 0 0 0 0 0 0 0 0 0 0 0 0 0 0 Weighted Average
Life (years) . . . . . . . . . 11.6 7.7 5.5 4.1 3.2 15.0 11.3 7.9 5.7 4.3 11.3 7.6 5.4 4.1 3.2
S-42

Security Group 14 PSA Prepayment Assumption Rates
Class ST Class TS
Distribution Date 0% 100% 200% 300% 400% 0% 100% 200% 300% 400%
Initial Percent . . . . . . . . . 100 100 100 100 100 100 100 100 100 100 May 2021 . . . . . . . . . . . . 97 93 88 81 76 98 94 89 83 78 May 2022 . . . . . . . . . . . . 95 86 77 67 58 95 88 80 70 60 May 2023 . . . . . . . . . . . . 92 79 67 55 44 93 82 71 59 47 May 2024 . . . . . . . . . . . . 89 73 59 44 34 90 77 64 48 37 May 2025 . . . . . . . . . . . . 86 68 51 36 26 88 72 55 39 29 May 2026 . . . . . . . . . . . . 83 62 43 29 20 85 68 48 32 23 May 2027 . . . . . . . . . . . . 79 57 37 24 14 82 63 41 27 17 May 2028 . . . . . . . . . . . . 76 52 32 19 10 79 57 36 22 12 May 2029 . . . . . . . . . . . . 72 47 27 15 7 76 52 31 17 9 May 2030 . . . . . . . . . . . . 68 42 23 11 5 72 48 27 13 6 May 2031 . . . . . . . . . . . . 64 37 19 8 4 69 43 22 10 4 May 2032 . . . . . . . . . . . . 60 33 15 6 3 65 38 17 7 3 May 2033 . . . . . . . . . . . . 54 28 12 5 2 60 33 14 5 2 May 2034 . . . . . . . . . . . . 49 24 9 3 1 54 29 10 4 1 May 2035 . . . . . . . . . . . . 43 19 7 2 1 49 23 8 3 1 May 2036 . . . . . . . . . . . . 37 15 5 2 0 43 17 6 2 1 May 2037 . . . . . . . . . . . . 30 10 3 1 0 35 12 4 1 0 May 2038 . . . . . . . . . . . . 21 6 2 1 0 25 7 2 1 0 May 2039 . . . . . . . . . . . . 11 3 1 0 0 13 3 1 0 0 May 2040 . . . . . . . . . . . . 3 1 0 0 0 4 1 0 0 0 May 2041 . . . . . . . . . . . . 1 0 0 0 0 1 0 0 0 0 May 2042 . . . . . . . . . . . . 0 0 0 0 0 1 0 0 0 0 May 2043 . . . . . . . . . . . . 0 0 0 0 0 0 0 0 0 0 May 2044 . . . . . . . . . . . . 0 0 0 0 0 0 0 0 0 0 May 2045 . . . . . . . . . . . . 0 0 0 0 0 0 0 0 0 0 May 2046 . . . . . . . . . . . . 0 0 0 0 0 0 0 0 0 0 Weighted Average
Life (years) . . . . . . . . . 12.6 8.8 6.3 4.6 3.5 13.3 9.6 6.8 4.9 3.8
Security Group 15 PSA Prepayment Assumption Rates
Class SU
Distribution Date 0% 100% 200% 300% 400%
Initial Percent . . . . . . . . . 100 100 100 100 100 May 2021 . . . . . . . . . . . . 97 91 85 79 74 May 2022 . . . . . . . . . . . . 94 83 72 63 54 May 2023 . . . . . . . . . . . . 90 75 61 50 40 May 2024 . . . . . . . . . . . . 86 67 52 39 29 May 2025 . . . . . . . . . . . . 82 60 43 31 21 May 2026 . . . . . . . . . . . . 78 54 36 24 15 May 2027 . . . . . . . . . . . . 74 48 30 18 11 May 2028 . . . . . . . . . . . . 69 42 25 14 8 May 2029 . . . . . . . . . . . . 64 37 20 11 5 May 2030 . . . . . . . . . . . . 59 32 16 8 4 May 2031 . . . . . . . . . . . . 54 27 13 6 3 May 2032 . . . . . . . . . . . . 48 23 10 4 2 May 2033 . . . . . . . . . . . . 42 19 8 3 1 May 2034 . . . . . . . . . . . . 35 15 6 2 1 May 2035 . . . . . . . . . . . . 29 11 4 1 0 May 2036 . . . . . . . . . . . . 22 8 3 1 0 May 2037 . . . . . . . . . . . . 14 5 2 0 0 May 2038 . . . . . . . . . . . . 6 2 1 0 0 May 2039 . . . . . . . . . . . . 1 0 0 0 0 May 2040 . . . . . . . . . . . . 0 0 0 0 0 May 2041 . . . . . . . . . . . . 0 0 0 0 0 May 2042 . . . . . . . . . . . . 0 0 0 0 0 May 2043 . . . . . . . . . . . . 0 0 0 0 0 May 2044 . . . . . . . . . . . . 0 0 0 0 0 May 2045 . . . . . . . . . . . . 0 0 0 0 0 May 2046 . . . . . . . . . . . . 0 0 0 0 0 Weighted Average
Life (years) . . . . . . . . . 10.9 7.5 5.4 4.0 3.1
S-43

Security Group 16 PSA Prepayment Assumption Rates
Classes CN and CT Classes NV and TV Class NW Classes NX and TX
Distribution Date 0% 100% 200% 300% 400% 0% 100% 200% 300% 400% 0% 100% 200% 300% 400% 0% 100% 200% 300% 400%
Initial Percent . . . . . . . . . 100 100 100 100 100 100 100 100 100 100 100 100 100 100 100 100 100 100 100 100 May 2021 . . . . . . . . . . . . 98 92 86 81 75 98 95 91 88 85 98 94 90 85 81 98 93 88 82 77 May 2022 . . . . . . . . . . . . 96 85 75 65 56 97 88 79 72 65 97 87 78 69 60 97 86 76 66 58 May 2023 . . . . . . . . . . . . 94 78 64 52 41 95 81 68 58 48 95 80 67 55 45 95 79 65 53 43 May 2024 . . . . . . . . . . . . 92 72 55 42 31 93 74 58 47 36 93 74 58 44 34 93 73 56 43 32 May 2025 . . . . . . . . . . . . 90 66 48 33 23 91 68 50 38 27 91 68 50 36 25 91 67 48 34 24 May 2026 . . . . . . . . . . . . 88 61 41 27 17 88 62 43 30 20 89 62 43 29 19 88 61 42 27 18 May 2027 . . . . . . . . . . . . 86 56 35 21 13 86 57 36 24 15 87 57 37 23 14 86 56 36 22 13 May 2028 . . . . . . . . . . . . 83 51 30 17 9 84 52 31 19 11 84 52 31 18 10 84 51 31 18 10 May 2029 . . . . . . . . . . . . 80 46 25 13 7 81 47 26 15 8 82 48 27 15 8 81 47 26 14 7 May 2030 . . . . . . . . . . . . 78 42 22 11 5 79 43 22 12 6 79 43 23 12 6 79 43 22 11 5 May 2031 . . . . . . . . . . . . 75 38 18 8 4 76 38 18 10 4 77 39 19 9 4 76 39 19 9 4 May 2032 . . . . . . . . . . . . 72 34 15 7 3 73 34 15 8 3 74 36 16 7 3 73 35 16 7 3 May 2033 . . . . . . . . . . . . 69 31 13 5 2 70 31 13 6 2 71 32 14 6 2 70 31 13 5 2 May 2034 . . . . . . . . . . . . 65 27 11 4 1 67 27 11 5 2 68 29 12 4 2 66 28 11 4 1 May 2035 . . . . . . . . . . . . 62 24 9 3 1 63 24 9 4 1 64 26 10 3 1 63 25 9 3 1 May 2036 . . . . . . . . . . . . 58 22 8 2 1 60 21 7 3 1 61 23 8 3 1 60 22 8 3 1 May 2037 . . . . . . . . . . . . 54 19 6 2 1 56 18 6 2 1 57 20 7 2 1 56 20 6 2 1 May 2038 . . . . . . . . . . . . 50 16 5 1 0 52 15 5 2 0 54 18 6 2 0 52 17 5 1 0 May 2039 . . . . . . . . . . . . 46 14 4 1 0 48 13 4 1 0 50 16 5 1 0 48 15 4 1 0 May 2040 . . . . . . . . . . . . 41 12 3 1 0 44 11 3 1 0 45 13 4 1 0 43 13 3 1 0 May 2041 . . . . . . . . . . . . 37 10 2 1 0 39 9 3 1 0 41 11 3 1 0 39 11 3 1 0 May 2042 . . . . . . . . . . . . 32 8 2 0 0 35 8 2 1 0 36 9 2 0 0 34 9 2 0 0 May 2043 . . . . . . . . . . . . 26 6 1 0 0 30 7 2 0 0 32 8 2 0 0 29 7 2 0 0 May 2044 . . . . . . . . . . . . 21 5 1 0 0 24 5 1 0 0 26 6 1 0 0 24 5 1 0 0 May 2045 . . . . . . . . . . . . 15 3 1 0 0 19 4 1 0 0 21 5 1 0 0 18 4 1 0 0 May 2046 . . . . . . . . . . . . 9 2 0 0 0 14 3 1 0 0 15 3 1 0 0 12 2 0 0 0 May 2047 . . . . . . . . . . . . 3 1 0 0 0 9 2 0 0 0 9 2 0 0 0 6 1 0 0 0 May 2048 . . . . . . . . . . . . 0 0 0 0 0 4 1 0 0 0 3 1 0 0 0 1 0 0 0 0 May 2049 . . . . . . . . . . . . 0 0 0 0 0 0 0 0 0 0 0 0 0 0 0 0 0 0 0 0 May 2050 . . . . . . . . . . . . 0 0 0 0 0 0 0 0 0 0 0 0 0 0 0 0 0 0 0 0 Weighted Average
Life (years) . . . . . . . . . 16.7 9.7 6.3 4.5 3.4 17.3 9.9 6.5 5.0 3.9 17.5 10.1 6.6 4.8 3.7 17.1 9.9 6.5 4.6 3.5
PSA Prepayment Assumption Rates
Classes NY and TY Class SW Class TW
Distribution Date 0% 100% 200% 300% 400% 0% 100% 200% 300% 400% 0% 100% 200% 300% 400%
Initial Percent . . . . . . . . . 100 100 100 100 100 100 100 100 100 100 100 100 100 100 100 May 2021 . . . . . . . . . . . . 98 93 87 82 76 98 94 89 85 80 98 94 89 84 80 May 2022 . . . . . . . . . . . . 97 86 76 66 57 97 87 77 69 60 97 86 77 68 60 May 2023 . . . . . . . . . . . . 95 79 65 53 43 95 80 67 55 45 95 80 66 55 45 May 2024 . . . . . . . . . . . . 93 73 56 43 32 93 73 57 44 33 93 73 57 44 33 May 2025 . . . . . . . . . . . . 91 67 48 34 24 91 67 49 36 25 91 67 49 35 25 May 2026 . . . . . . . . . . . . 88 61 41 27 17 89 62 42 28 18 88 62 42 28 18 May 2027 . . . . . . . . . . . . 86 56 36 22 13 86 57 36 23 14 86 56 36 23 14 May 2028 . . . . . . . . . . . . 84 51 30 17 10 84 52 31 18 10 84 51 30 18 10 May 2029 . . . . . . . . . . . . 81 47 26 14 7 82 47 26 14 7 81 47 26 14 7 May 2030 . . . . . . . . . . . . 79 43 22 11 5 79 43 22 11 5 79 42 22 11 5 May 2031 . . . . . . . . . . . . 76 39 19 9 4 76 39 19 9 4 76 38 19 9 4 May 2032 . . . . . . . . . . . . 73 35 16 7 3 73 35 16 7 3 73 35 16 7 3 May 2033 . . . . . . . . . . . . 70 31 13 5 2 70 32 13 6 2 70 31 13 6 2 May 2034 . . . . . . . . . . . . 66 28 11 4 1 67 28 11 4 2 67 28 11 4 2 May 2035 . . . . . . . . . . . . 63 25 9 3 1 64 25 9 3 1 63 25 9 3 1 May 2036 . . . . . . . . . . . . 60 22 8 3 1 60 22 8 3 1 60 22 8 3 1 May 2037 . . . . . . . . . . . . 56 20 6 2 1 57 20 6 2 1 56 19 6 2 1 May 2038 . . . . . . . . . . . . 52 17 5 1 0 53 17 5 2 0 52 16 5 2 0 May 2039 . . . . . . . . . . . . 48 15 4 1 0 49 15 4 1 0 48 14 4 1 0 May 2040 . . . . . . . . . . . . 43 13 3 1 0 44 13 3 1 0 43 12 3 1 0 May 2041 . . . . . . . . . . . . 39 11 3 1 0 40 11 3 1 0 39 10 3 1 0 May 2042 . . . . . . . . . . . . 34 9 2 0 0 35 9 2 0 0 34 8 2 0 0 May 2043 . . . . . . . . . . . . 29 7 2 0 0 30 7 2 0 0 29 7 2 0 0 May 2044 . . . . . . . . . . . . 24 5 1 0 0 25 6 1 0 0 24 5 1 0 0 May 2045 . . . . . . . . . . . . 18 4 1 0 0 19 4 1 0 0 18 4 1 0 0 May 2046 . . . . . . . . . . . . 12 2 0 0 0 14 3 1 0 0 13 3 0 0 0 May 2047 . . . . . . . . . . . . 6 1 0 0 0 8 2 0 0 0 7 1 0 0 0 May 2048 . . . . . . . . . . . . 0 0 0 0 0 2 0 0 0 0 2 0 0 0 0 May 2049 . . . . . . . . . . . . 0 0 0 0 0 0 0 0 0 0 0 0 0 0 0 May 2050 . . . . . . . . . . . . 0 0 0 0 0 0 0 0 0 0 0 0 0 0 0 Weighted Average
Life (years) . . . . . . . . . 17.1 9.9 6.4 4.6 3.5 17.3 10.0 6.5 4.7 3.6 17.2 9.9 6.5 4.7 3.6
S-44

Security Group 17 PSA Prepayment Assumption Rates
Classes FH, H, HK, HM and SH
Distribution Date 0% 300% 614% 950% 1,300%
Initial Percent . . . . . . . 100 100 100 100 100 May 2021 . . . . . . . . . . 99 93 88 82 76 May 2022 . . . . . . . . . . 97 80 64 49 34 May 2023 . . . . . . . . . . 95 65 40 21 8 May 2024 . . . . . . . . . . 94 52 25 9 2 May 2025 . . . . . . . . . . 92 42 15 4 0 May 2026 . . . . . . . . . . 90 33 9 2 0 May 2027 . . . . . . . . . . 88 27 6 1 0 May 2028 . . . . . . . . . . 86 21 4 0 0 May 2029 . . . . . . . . . . 84 17 2 0 0 May 2030 . . . . . . . . . . 81 13 1 0 0 May 2031 . . . . . . . . . . 79 11 1 0 0 May 2032 . . . . . . . . . . 76 8 0 0 0 May 2033 . . . . . . . . . . 74 7 0 0 0 May 2034 . . . . . . . . . . 71 5 0 0 0 May 2035 . . . . . . . . . . 68 4 0 0 0 May 2036 . . . . . . . . . . 65 3 0 0 0 May 2037 . . . . . . . . . . 61 2 0 0 0 May 2038 . . . . . . . . . . 58 2 0 0 0 May 2039 . . . . . . . . . . 54 1 0 0 0 May 2040 . . . . . . . . . . 51 1 0 0 0 May 2041 . . . . . . . . . . 47 1 0 0 0 May 2042 . . . . . . . . . . 42 1 0 0 0 May 2043 . . . . . . . . . . 38 0 0 0 0 May 2044 . . . . . . . . . . 33 0 0 0 0 May 2045 . . . . . . . . . . 28 0 0 0 0 May 2046 . . . . . . . . . . 23 0 0 0 0 May 2047 . . . . . . . . . . 18 0 0 0 0 May 2048 . . . . . . . . . . 12 0 0 0 0 May 2049 . . . . . . . . . . 6 0 0 0 0 May 2050 . . . . . . . . . . 0 0 0 0 0 Weighted Average
Life (years) . . . . . . . 18.6 5.4 3.1 2.2 1.7
Security Group 18 PSA Prepayment Assumption Rates
Classes A, AO, AY, BD, BE, BF, BG and BH Class AD Class AE Class AF
Distribution Date 0% 150% 260% 450% 600% 0% 150% 260% 450% 600% 0% 150% 260% 450% 600% 0% 150% 260% 450% 600%
Initial Percent . . . . . . . . . 100 100 100 100 100 100 100 100 100 100 100 100 100 100 100 100 100 100 100 100 May 2021 . . . . . . . . . . . . 83 0 0 0 0 84 0 0 0 0 82 0 0 0 0 83 0 0 0 0 May 2022 . . . . . . . . . . . . 66 0 0 0 0 67 0 0 0 0 64 0 0 0 0 65 0 0 0 0 May 2023 . . . . . . . . . . . . 47 0 0 0 0 49 0 0 0 0 45 0 0 0 0 46 0 0 0 0 May 2024 . . . . . . . . . . . . 28 0 0 0 0 30 0 0 0 0 25 0 0 0 0 26 0 0 0 0 May 2025 . . . . . . . . . . . . 8 0 0 0 0 10 0 0 0 0 4 0 0 0 0 6 0 0 0 0 May 2026 . . . . . . . . . . . . 0 0 0 0 0 0 0 0 0 0 0 0 0 0 0 0 0 0 0 0 May 2027 . . . . . . . . . . . . 0 0 0 0 0 0 0 0 0 0 0 0 0 0 0 0 0 0 0 0 May 2028 . . . . . . . . . . . . 0 0 0 0 0 0 0 0 0 0 0 0 0 0 0 0 0 0 0 0 May 2029 . . . . . . . . . . . . 0 0 0 0 0 0 0 0 0 0 0 0 0 0 0 0 0 0 0 0 May 2030 . . . . . . . . . . . . 0 0 0 0 0 0 0 0 0 0 0 0 0 0 0 0 0 0 0 0 May 2031 . . . . . . . . . . . . 0 0 0 0 0 0 0 0 0 0 0 0 0 0 0 0 0 0 0 0 May 2032 . . . . . . . . . . . . 0 0 0 0 0 0 0 0 0 0 0 0 0 0 0 0 0 0 0 0 May 2033 . . . . . . . . . . . . 0 0 0 0 0 0 0 0 0 0 0 0 0 0 0 0 0 0 0 0 May 2034 . . . . . . . . . . . . 0 0 0 0 0 0 0 0 0 0 0 0 0 0 0 0 0 0 0 0 May 2035 . . . . . . . . . . . . 0 0 0 0 0 0 0 0 0 0 0 0 0 0 0 0 0 0 0 0 May 2036 . . . . . . . . . . . . 0 0 0 0 0 0 0 0 0 0 0 0 0 0 0 0 0 0 0 0 May 2037 . . . . . . . . . . . . 0 0 0 0 0 0 0 0 0 0 0 0 0 0 0 0 0 0 0 0 May 2038 . . . . . . . . . . . . 0 0 0 0 0 0 0 0 0 0 0 0 0 0 0 0 0 0 0 0 May 2039 . . . . . . . . . . . . 0 0 0 0 0 0 0 0 0 0 0 0 0 0 0 0 0 0 0 0 May 2040 . . . . . . . . . . . . 0 0 0 0 0 0 0 0 0 0 0 0 0 0 0 0 0 0 0 0 May 2041 . . . . . . . . . . . . 0 0 0 0 0 0 0 0 0 0 0 0 0 0 0 0 0 0 0 0 May 2042 . . . . . . . . . . . . 0 0 0 0 0 0 0 0 0 0 0 0 0 0 0 0 0 0 0 0 May 2043 . . . . . . . . . . . . 0 0 0 0 0 0 0 0 0 0 0 0 0 0 0 0 0 0 0 0 May 2044 . . . . . . . . . . . . 0 0 0 0 0 0 0 0 0 0 0 0 0 0 0 0 0 0 0 0 May 2045 . . . . . . . . . . . . 0 0 0 0 0 0 0 0 0 0 0 0 0 0 0 0 0 0 0 0 May 2046 . . . . . . . . . . . . 0 0 0 0 0 0 0 0 0 0 0 0 0 0 0 0 0 0 0 0 May 2047 . . . . . . . . . . . . 0 0 0 0 0 0 0 0 0 0 0 0 0 0 0 0 0 0 0 0 May 2048 . . . . . . . . . . . . 0 0 0 0 0 0 0 0 0 0 0 0 0 0 0 0 0 0 0 0 May 2049 . . . . . . . . . . . . 0 0 0 0 0 0 0 0 0 0 0 0 0 0 0 0 0 0 0 0 May 2050 . . . . . . . . . . . . 0 0 0 0 0 0 0 0 0 0 0 0 0 0 0 0 0 0 0 0 Weighted Average
Life (years) . . . . . . . . . 2.8 0.4 0.3 0.2 0.1 2.9 0.4 0.3 0.2 0.1 2.7 0.4 0.2 0.2 0.1 2.8 0.4 0.3 0.2 0.1
S-45

Security Group 18 PSA Prepayment Assumption Rates
Class AG Class AH Class AI Class AQ
Distribution Date 0% 150% 260% 450% 600% 0% 150% 260% 450% 600% 0% 150% 260% 450% 600% 0% 150% 260% 450% 600%
Initial Percent . . . . . . . . . 100 100 100 100 100 100 100 100 100 100 100 100 100 100 100 100 100 100 100 100 May 2021 . . . . . . . . . . . . 83 0 0 0 0 84 0 0 0 0 99 88 82 71 62 100 86 51 0 0 May 2022 . . . . . . . . . . . . 66 0 0 0 0 67 0 0 0 0 97 78 67 50 39 100 29 0 0 0 May 2023 . . . . . . . . . . . . 47 0 0 0 0 49 0 0 0 0 95 69 55 35 24 100 0 0 0 0 May 2024 . . . . . . . . . . . . 28 0 0 0 0 31 0 0 0 0 94 60 45 25 15 100 0 0 0 0 May 2025 . . . . . . . . . . . . 7 0 0 0 0 11 0 0 0 0 92 53 36 18 9 100 0 0 0 0 May 2026 . . . . . . . . . . . . 0 0 0 0 0 0 0 0 0 0 90 46 29 12 6 95 0 0 0 0 May 2027 . . . . . . . . . . . . 0 0 0 0 0 0 0 0 0 0 88 40 24 9 3 84 0 0 0 0 May 2028 . . . . . . . . . . . . 0 0 0 0 0 0 0 0 0 0 86 35 19 6 2 72 0 0 0 0 May 2029 . . . . . . . . . . . . 0 0 0 0 0 0 0 0 0 0 84 30 15 4 1 60 0 0 0 0 May 2030 . . . . . . . . . . . . 0 0 0 0 0 0 0 0 0 0 82 25 12 3 1 48 0 0 0 0 May 2031 . . . . . . . . . . . . 0 0 0 0 0 0 0 0 0 0 79 22 9 2 0 35 0 0 0 0 May 2032 . . . . . . . . . . . . 0 0 0 0 0 0 0 0 0 0 77 18 7 1 0 21 0 0 0 0 May 2033 . . . . . . . . . . . . 0 0 0 0 0 0 0 0 0 0 74 15 6 1 0 6 0 0 0 0 May 2034 . . . . . . . . . . . . 0 0 0 0 0 0 0 0 0 0 71 12 4 1 0 0 0 0 0 0 May 2035 . . . . . . . . . . . . 0 0 0 0 0 0 0 0 0 0 68 10 3 0 0 0 0 0 0 0 May 2036 . . . . . . . . . . . . 0 0 0 0 0 0 0 0 0 0 65 8 2 0 0 0 0 0 0 0 May 2037 . . . . . . . . . . . . 0 0 0 0 0 0 0 0 0 0 62 6 2 0 0 0 0 0 0 0 May 2038 . . . . . . . . . . . . 0 0 0 0 0 0 0 0 0 0 58 4 1 0 0 0 0 0 0 0 May 2039 . . . . . . . . . . . . 0 0 0 0 0 0 0 0 0 0 55 3 1 0 0 0 0 0 0 0 May 2040 . . . . . . . . . . . . 0 0 0 0 0 0 0 0 0 0 51 2 0 0 0 0 0 0 0 0 May 2041 . . . . . . . . . . . . 0 0 0 0 0 0 0 0 0 0 47 1 0 0 0 0 0 0 0 0 May 2042 . . . . . . . . . . . . 0 0 0 0 0 0 0 0 0 0 43 1 0 0 0 0 0 0 0 0 May 2043 . . . . . . . . . . . . 0 0 0 0 0 0 0 0 0 0 38 0 0 0 0 0 0 0 0 0 May 2044 . . . . . . . . . . . . 0 0 0 0 0 0 0 0 0 0 34 0 0 0 0 0 0 0 0 0 May 2045 . . . . . . . . . . . . 0 0 0 0 0 0 0 0 0 0 29 0 0 0 0 0 0 0 0 0 May 2046 . . . . . . . . . . . . 0 0 0 0 0 0 0 0 0 0 23 0 0 0 0 0 0 0 0 0 May 2047 . . . . . . . . . . . . 0 0 0 0 0 0 0 0 0 0 18 0 0 0 0 0 0 0 0 0 May 2048 . . . . . . . . . . . . 0 0 0 0 0 0 0 0 0 0 12 0 0 0 0 0 0 0 0 0 May 2049 . . . . . . . . . . . . 0 0 0 0 0 0 0 0 0 0 6 0 0 0 0 0 0 0 0 0 May 2050 . . . . . . . . . . . . 0 0 0 0 0 0 0 0 0 0 0 0 0 0 0 0 0 0 0 0 Weighted Average
Life (years) . . . . . . . . . 2.8 0.4 0.3 0.2 0.1 2.9 0.4 0.3 0.2 0.1 18.7 6.8 4.7 2.9 2.1 9.7 1.6 1.0 0.6 0.4
PSA Prepayment Assumption Rates
Class AT Class AU Class AV Class AW
Distribution Date 0% 150% 260% 450% 600% 0% 150% 260% 450% 600% 0% 150% 260% 450% 600% 0% 150% 260% 450% 600%
Initial Percent . . . . . . . . . 100 100 100 100 100 100 100 100 100 100 100 100 100 100 100 100 100 100 100 100 May 2021 . . . . . . . . . . . . 100 84 49 0 0 100 85 50 0 0 100 85 50 0 0 100 85 50 0 0 May 2022 . . . . . . . . . . . . 100 26 0 0 0 100 27 0 0 0 100 27 0 0 0 100 27 0 0 0 May 2023 . . . . . . . . . . . . 100 0 0 0 0 100 0 0 0 0 100 0 0 0 0 100 0 0 0 0 May 2024 . . . . . . . . . . . . 100 0 0 0 0 100 0 0 0 0 100 0 0 0 0 100 0 0 0 0 May 2025 . . . . . . . . . . . . 100 0 0 0 0 100 0 0 0 0 100 0 0 0 0 100 0 0 0 0 May 2026 . . . . . . . . . . . . 91 0 0 0 0 92 0 0 0 0 93 0 0 0 0 95 0 0 0 0 May 2027 . . . . . . . . . . . . 79 0 0 0 0 81 0 0 0 0 82 0 0 0 0 84 0 0 0 0 May 2028 . . . . . . . . . . . . 67 0 0 0 0 69 0 0 0 0 70 0 0 0 0 73 0 0 0 0 May 2029 . . . . . . . . . . . . 55 0 0 0 0 57 0 0 0 0 58 0 0 0 0 61 0 0 0 0 May 2030 . . . . . . . . . . . . 42 0 0 0 0 44 0 0 0 0 45 0 0 0 0 48 0 0 0 0 May 2031 . . . . . . . . . . . . 28 0 0 0 0 30 0 0 0 0 32 0 0 0 0 35 0 0 0 0 May 2032 . . . . . . . . . . . . 14 0 0 0 0 16 0 0 0 0 18 0 0 0 0 21 0 0 0 0 May 2033 . . . . . . . . . . . . 0 0 0 0 0 1 0 0 0 0 3 0 0 0 0 7 0 0 0 0 May 2034 . . . . . . . . . . . . 0 0 0 0 0 0 0 0 0 0 0 0 0 0 0 0 0 0 0 0 May 2035 . . . . . . . . . . . . 0 0 0 0 0 0 0 0 0 0 0 0 0 0 0 0 0 0 0 0 May 2036 . . . . . . . . . . . . 0 0 0 0 0 0 0 0 0 0 0 0 0 0 0 0 0 0 0 0 May 2037 . . . . . . . . . . . . 0 0 0 0 0 0 0 0 0 0 0 0 0 0 0 0 0 0 0 0 May 2038 . . . . . . . . . . . . 0 0 0 0 0 0 0 0 0 0 0 0 0 0 0 0 0 0 0 0 May 2039 . . . . . . . . . . . . 0 0 0 0 0 0 0 0 0 0 0 0 0 0 0 0 0 0 0 0 May 2040 . . . . . . . . . . . . 0 0 0 0 0 0 0 0 0 0 0 0 0 0 0 0 0 0 0 0 May 2041 . . . . . . . . . . . . 0 0 0 0 0 0 0 0 0 0 0 0 0 0 0 0 0 0 0 0 May 2042 . . . . . . . . . . . . 0 0 0 0 0 0 0 0 0 0 0 0 0 0 0 0 0 0 0 0 May 2043 . . . . . . . . . . . . 0 0 0 0 0 0 0 0 0 0 0 0 0 0 0 0 0 0 0 0 May 2044 . . . . . . . . . . . . 0 0 0 0 0 0 0 0 0 0 0 0 0 0 0 0 0 0 0 0 May 2045 . . . . . . . . . . . . 0 0 0 0 0 0 0 0 0 0 0 0 0 0 0 0 0 0 0 0 May 2046 . . . . . . . . . . . . 0 0 0 0 0 0 0 0 0 0 0 0 0 0 0 0 0 0 0 0 May 2047 . . . . . . . . . . . . 0 0 0 0 0 0 0 0 0 0 0 0 0 0 0 0 0 0 0 0 May 2048 . . . . . . . . . . . . 0 0 0 0 0 0 0 0 0 0 0 0 0 0 0 0 0 0 0 0 May 2049 . . . . . . . . . . . . 0 0 0 0 0 0 0 0 0 0 0 0 0 0 0 0 0 0 0 0 May 2050 . . . . . . . . . . . . 0 0 0 0 0 0 0 0 0 0 0 0 0 0 0 0 0 0 0 0 Weighted Average
Life (years) . . . . . . . . . 9.3 1.6 1.0 0.6 0.4 9.4 1.6 1.0 0.6 0.4 9.5 1.6 1.0 0.6 0.4 9.8 1.6 1.0 0.6 0.4
S-46
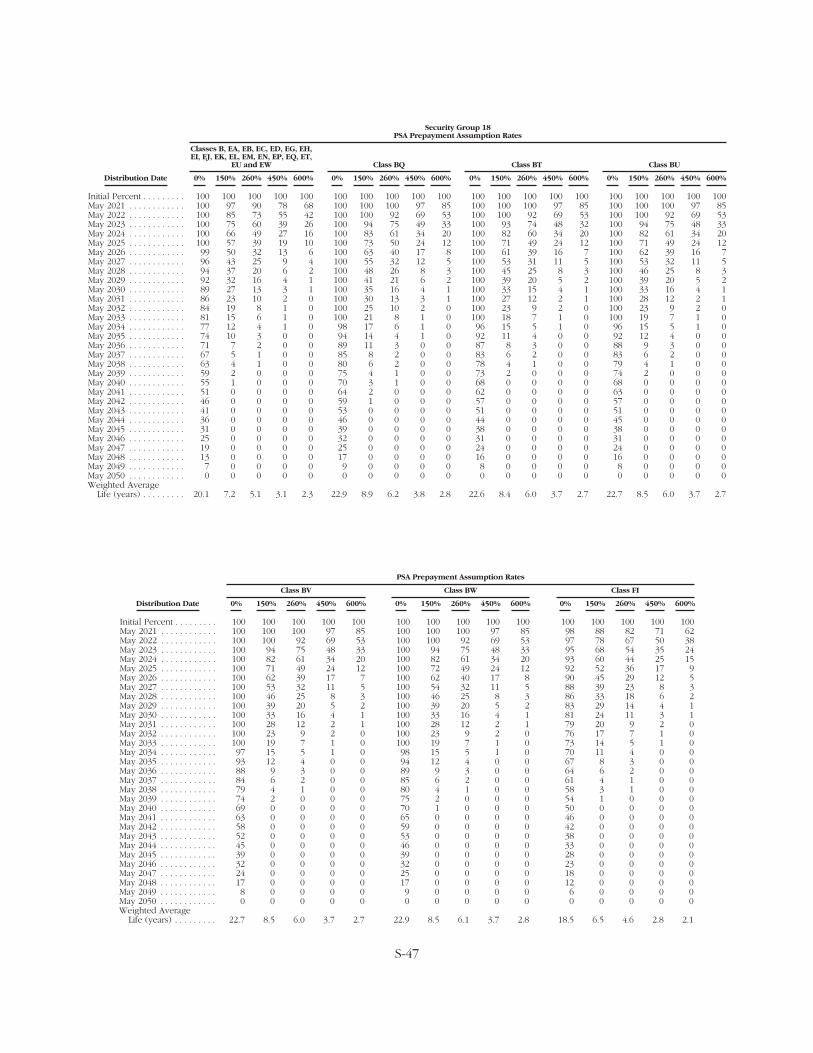
Security Group 18 PSA Prepayment Assumption Rates
Classes B, EA, EB, EC, ED, EG, EH, EI, EJ, EK, EL, EM, EN, EP, EQ, ET,
EU and EW Class BQ Class BT Class BU
Distribution Date 0% 150% 260% 450% 600% 0% 150% 260% 450% 600% 0% 150% 260% 450% 600% 0% 150% 260% 450% 600%
Initial Percent . . . . . . . . . 100 100 100 100 100 100 100 100 100 100 100 100 100 100 100 100 100 100 100 100 May 2021 . . . . . . . . . . . . 100 97 90 78 68 100 100 100 97 85 100 100 100 97 85 100 100 100 97 85 May 2022 . . . . . . . . . . . . 100 85 73 55 42 100 100 92 69 53 100 100 92 69 53 100 100 92 69 53 May 2023 . . . . . . . . . . . . 100 75 60 39 26 100 94 75 49 33 100 93 74 48 32 100 94 75 48 33 May 2024 . . . . . . . . . . . . 100 66 49 27 16 100 83 61 34 20 100 82 60 34 20 100 82 61 34 20 May 2025 . . . . . . . . . . . . 100 57 39 19 10 100 73 50 24 12 100 71 49 24 12 100 71 49 24 12 May 2026 . . . . . . . . . . . . 99 50 32 13 6 100 63 40 17 8 100 61 39 16 7 100 62 39 16 7 May 2027 . . . . . . . . . . . . 96 43 25 9 4 100 55 32 12 5 100 53 31 11 5 100 53 32 11 5 May 2028 . . . . . . . . . . . . 94 37 20 6 2 100 48 26 8 3 100 45 25 8 3 100 46 25 8 3 May 2029 . . . . . . . . . . . . 92 32 16 4 1 100 41 21 6 2 100 39 20 5 2 100 39 20 5 2 May 2030 . . . . . . . . . . . . 89 27 13 3 1 100 35 16 4 1 100 33 15 4 1 100 33 16 4 1 May 2031 . . . . . . . . . . . . 86 23 10 2 0 100 30 13 3 1 100 27 12 2 1 100 28 12 2 1 May 2032 . . . . . . . . . . . . 84 19 8 1 0 100 25 10 2 0 100 23 9 2 0 100 23 9 2 0 May 2033 . . . . . . . . . . . . 81 15 6 1 0 100 21 8 1 0 100 18 7 1 0 100 19 7 1 0 May 2034 . . . . . . . . . . . . 77 12 4 1 0 98 17 6 1 0 96 15 5 1 0 96 15 5 1 0 May 2035 . . . . . . . . . . . . 74 10 3 0 0 94 14 4 1 0 92 11 4 0 0 92 12 4 0 0 May 2036 . . . . . . . . . . . . 71 7 2 0 0 89 11 3 0 0 87 8 3 0 0 88 9 3 0 0 May 2037 . . . . . . . . . . . . 67 5 1 0 0 85 8 2 0 0 83 6 2 0 0 83 6 2 0 0 May 2038 . . . . . . . . . . . . 63 4 1 0 0 80 6 2 0 0 78 4 1 0 0 79 4 1 0 0 May 2039 . . . . . . . . . . . . 59 2 0 0 0 75 4 1 0 0 73 2 0 0 0 74 2 0 0 0 May 2040 . . . . . . . . . . . . 55 1 0 0 0 70 3 1 0 0 68 0 0 0 0 68 0 0 0 0 May 2041 . . . . . . . . . . . . 51 0 0 0 0 64 2 0 0 0 62 0 0 0 0 63 0 0 0 0 May 2042 . . . . . . . . . . . . 46 0 0 0 0 59 1 0 0 0 57 0 0 0 0 57 0 0 0 0 May 2043 . . . . . . . . . . . . 41 0 0 0 0 53 0 0 0 0 51 0 0 0 0 51 0 0 0 0 May 2044 . . . . . . . . . . . . 36 0 0 0 0 46 0 0 0 0 44 0 0 0 0 45 0 0 0 0 May 2045 . . . . . . . . . . . . 31 0 0 0 0 39 0 0 0 0 38 0 0 0 0 38 0 0 0 0 May 2046 . . . . . . . . . . . . 25 0 0 0 0 32 0 0 0 0 31 0 0 0 0 31 0 0 0 0 May 2047 . . . . . . . . . . . . 19 0 0 0 0 25 0 0 0 0 24 0 0 0 0 24 0 0 0 0 May 2048 . . . . . . . . . . . . 13 0 0 0 0 17 0 0 0 0 16 0 0 0 0 16 0 0 0 0 May 2049 . . . . . . . . . . . . 7 0 0 0 0 9 0 0 0 0 8 0 0 0 0 8 0 0 0 0 May 2050 . . . . . . . . . . . . 0 0 0 0 0 0 0 0 0 0 0 0 0 0 0 0 0 0 0 0 Weighted Average
Life (years) . . . . . . . . . 20.1 7.2 5.1 3.1 2.3 22.9 8.9 6.2 3.8 2.8 22.6 8.4 6.0 3.7 2.7 22.7 8.5 6.0 3.7 2.7
PSA Prepayment Assumption Rates
Class BV Class BW Class FI
Distribution Date 0% 150% 260% 450% 600% 0% 150% 260% 450% 600% 0% 150% 260% 450% 600%
Initial Percent . . . . . . . . . 100 100 100 100 100 100 100 100 100 100 100 100 100 100 100 May 2021 . . . . . . . . . . . . 100 100 100 97 85 100 100 100 97 85 98 88 82 71 62 May 2022 . . . . . . . . . . . . 100 100 92 69 53 100 100 92 69 53 97 78 67 50 38 May 2023 . . . . . . . . . . . . 100 94 75 48 33 100 94 75 48 33 95 68 54 35 24 May 2024 . . . . . . . . . . . . 100 82 61 34 20 100 82 61 34 20 93 60 44 25 15 May 2025 . . . . . . . . . . . . 100 71 49 24 12 100 72 49 24 12 92 52 36 17 9 May 2026 . . . . . . . . . . . . 100 62 39 17 7 100 62 40 17 8 90 45 29 12 5 May 2027 . . . . . . . . . . . . 100 53 32 11 5 100 54 32 11 5 88 39 23 8 3 May 2028 . . . . . . . . . . . . 100 46 25 8 3 100 46 25 8 3 86 33 18 6 2 May 2029 . . . . . . . . . . . . 100 39 20 5 2 100 39 20 5 2 83 29 14 4 1 May 2030 . . . . . . . . . . . . 100 33 16 4 1 100 33 16 4 1 81 24 11 3 1 May 2031 . . . . . . . . . . . . 100 28 12 2 1 100 28 12 2 1 79 20 9 2 0 May 2032 . . . . . . . . . . . . 100 23 9 2 0 100 23 9 2 0 76 17 7 1 0 May 2033 . . . . . . . . . . . . 100 19 7 1 0 100 19 7 1 0 73 14 5 1 0 May 2034 . . . . . . . . . . . . 97 15 5 1 0 98 15 5 1 0 70 11 4 0 0 May 2035 . . . . . . . . . . . . 93 12 4 0 0 94 12 4 0 0 67 8 3 0 0 May 2036 . . . . . . . . . . . . 88 9 3 0 0 89 9 3 0 0 64 6 2 0 0 May 2037 . . . . . . . . . . . . 84 6 2 0 0 85 6 2 0 0 61 4 1 0 0 May 2038 . . . . . . . . . . . . 79 4 1 0 0 80 4 1 0 0 58 3 1 0 0 May 2039 . . . . . . . . . . . . 74 2 0 0 0 75 2 0 0 0 54 1 0 0 0 May 2040 . . . . . . . . . . . . 69 0 0 0 0 70 1 0 0 0 50 0 0 0 0 May 2041 . . . . . . . . . . . . 63 0 0 0 0 65 0 0 0 0 46 0 0 0 0 May 2042 . . . . . . . . . . . . 58 0 0 0 0 59 0 0 0 0 42 0 0 0 0 May 2043 . . . . . . . . . . . . 52 0 0 0 0 53 0 0 0 0 38 0 0 0 0 May 2044 . . . . . . . . . . . . 45 0 0 0 0 46 0 0 0 0 33 0 0 0 0 May 2045 . . . . . . . . . . . . 39 0 0 0 0 39 0 0 0 0 28 0 0 0 0 May 2046 . . . . . . . . . . . . 32 0 0 0 0 32 0 0 0 0 23 0 0 0 0 May 2047 . . . . . . . . . . . . 24 0 0 0 0 25 0 0 0 0 18 0 0 0 0 May 2048 . . . . . . . . . . . . 17 0 0 0 0 17 0 0 0 0 12 0 0 0 0 May 2049 . . . . . . . . . . . . 8 0 0 0 0 9 0 0 0 0 6 0 0 0 0 May 2050 . . . . . . . . . . . . 0 0 0 0 0 0 0 0 0 0 0 0 0 0 0 Weighted Average
Life (years) . . . . . . . . . 22.7 8.5 6.0 3.7 2.7 22.9 8.5 6.1 3.7 2.8 18.5 6.5 4.6 2.8 2.1
S-47
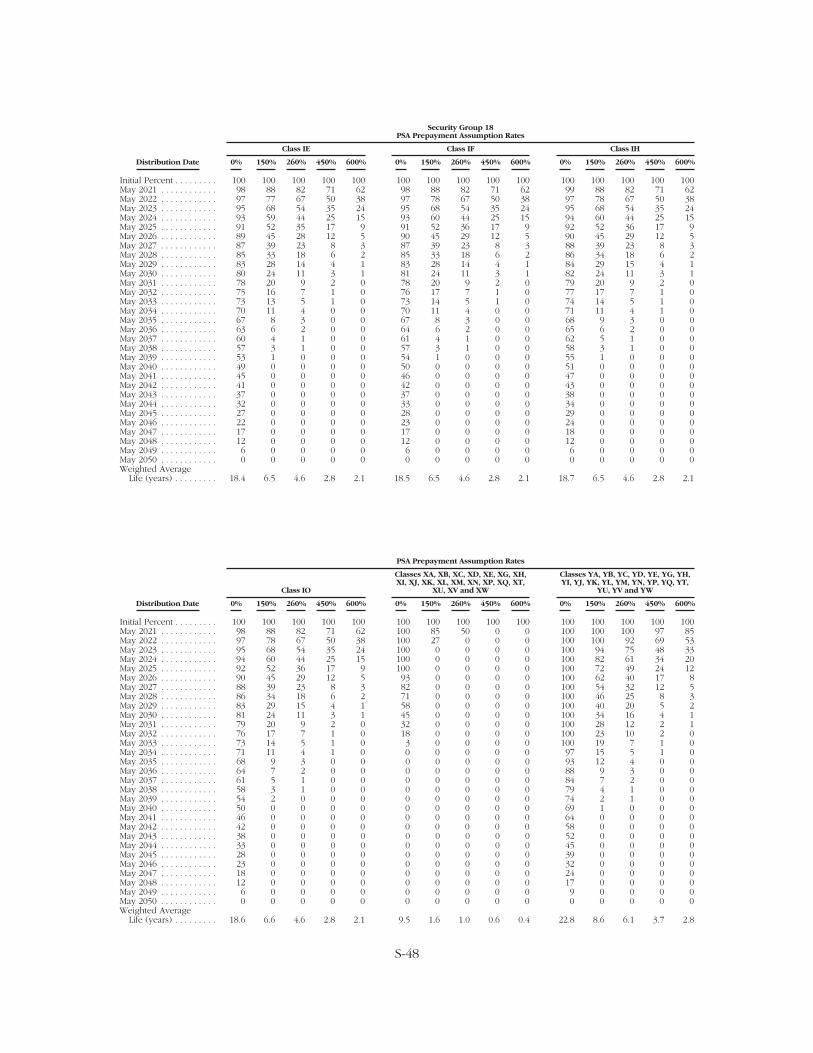
Security Group 18 PSA Prepayment Assumption Rates
Class IE Class IF Class IH
Distribution Date 0% 150% 260% 450% 600% 0% 150% 260% 450% 600% 0% 150% 260% 450% 600%
Initial Percent . . . . . . . . . 100 100 100 100 100 100 100 100 100 100 100 100 100 100 100 May 2021 . . . . . . . . . . . . 98 88 82 71 62 98 88 82 71 62 99 88 82 71 62 May 2022 . . . . . . . . . . . . 97 77 67 50 38 97 78 67 50 38 97 78 67 50 38 May 2023 . . . . . . . . . . . . 95 68 54 35 24 95 68 54 35 24 95 68 54 35 24 May 2024 . . . . . . . . . . . . 93 59 44 25 15 93 60 44 25 15 94 60 44 25 15 May 2025 . . . . . . . . . . . . 91 52 35 17 9 91 52 36 17 9 92 52 36 17 9 May 2026 . . . . . . . . . . . . 89 45 28 12 5 90 45 29 12 5 90 45 29 12 5 May 2027 . . . . . . . . . . . . 87 39 23 8 3 87 39 23 8 3 88 39 23 8 3 May 2028 . . . . . . . . . . . . 85 33 18 6 2 85 33 18 6 2 86 34 18 6 2 May 2029 . . . . . . . . . . . . 83 28 14 4 1 83 28 14 4 1 84 29 15 4 1 May 2030 . . . . . . . . . . . . 80 24 11 3 1 81 24 11 3 1 82 24 11 3 1 May 2031 . . . . . . . . . . . . 78 20 9 2 0 78 20 9 2 0 79 20 9 2 0 May 2032 . . . . . . . . . . . . 75 16 7 1 0 76 17 7 1 0 77 17 7 1 0 May 2033 . . . . . . . . . . . . 73 13 5 1 0 73 14 5 1 0 74 14 5 1 0 May 2034 . . . . . . . . . . . . 70 11 4 0 0 70 11 4 0 0 71 11 4 1 0 May 2035 . . . . . . . . . . . . 67 8 3 0 0 67 8 3 0 0 68 9 3 0 0 May 2036 . . . . . . . . . . . . 63 6 2 0 0 64 6 2 0 0 65 6 2 0 0 May 2037 . . . . . . . . . . . . 60 4 1 0 0 61 4 1 0 0 62 5 1 0 0 May 2038 . . . . . . . . . . . . 57 3 1 0 0 57 3 1 0 0 58 3 1 0 0 May 2039 . . . . . . . . . . . . 53 1 0 0 0 54 1 0 0 0 55 1 0 0 0 May 2040 . . . . . . . . . . . . 49 0 0 0 0 50 0 0 0 0 51 0 0 0 0 May 2041 . . . . . . . . . . . . 45 0 0 0 0 46 0 0 0 0 47 0 0 0 0 May 2042 . . . . . . . . . . . . 41 0 0 0 0 42 0 0 0 0 43 0 0 0 0 May 2043 . . . . . . . . . . . . 37 0 0 0 0 37 0 0 0 0 38 0 0 0 0 May 2044 . . . . . . . . . . . . 32 0 0 0 0 33 0 0 0 0 34 0 0 0 0 May 2045 . . . . . . . . . . . . 27 0 0 0 0 28 0 0 0 0 29 0 0 0 0 May 2046 . . . . . . . . . . . . 22 0 0 0 0 23 0 0 0 0 24 0 0 0 0 May 2047 . . . . . . . . . . . . 17 0 0 0 0 17 0 0 0 0 18 0 0 0 0 May 2048 . . . . . . . . . . . . 12 0 0 0 0 12 0 0 0 0 12 0 0 0 0 May 2049 . . . . . . . . . . . . 6 0 0 0 0 6 0 0 0 0 6 0 0 0 0 May 2050 . . . . . . . . . . . . 0 0 0 0 0 0 0 0 0 0 0 0 0 0 0 Weighted Average
Life (years) . . . . . . . . . 18.4 6.5 4.6 2.8 2.1 18.5 6.5 4.6 2.8 2.1 18.7 6.5 4.6 2.8 2.1
PSA Prepayment Assumption Rates
Classes XA, XB, XC, XD, XE, XG, XH, Classes YA, YB, YC, YD, YE, YG, YH, XI, XJ, XK, XL, XM, XN, XP, XQ, XT, YI, YJ, YK, YL, YM, YN, YP, YQ, YT,
Class IO XU, XV and XW YU, YV and YW
Distribution Date 0% 150% 260% 450% 600% 0% 150% 260% 450% 600% 0% 150% 260% 450% 600%
Initial Percent . . . . . . . . . 100 100 100 100 100 100 100 100 100 100 100 100 100 100 100 May 2021 . . . . . . . . . . . . 98 88 82 71 62 100 85 50 0 0 100 100 100 97 85 May 2022 . . . . . . . . . . . . 97 78 67 50 38 100 27 0 0 0 100 100 92 69 53 May 2023 . . . . . . . . . . . . 95 68 54 35 24 100 0 0 0 0 100 94 75 48 33 May 2024 . . . . . . . . . . . . 94 60 44 25 15 100 0 0 0 0 100 82 61 34 20 May 2025 . . . . . . . . . . . . 92 52 36 17 9 100 0 0 0 0 100 72 49 24 12 May 2026 . . . . . . . . . . . . 90 45 29 12 5 93 0 0 0 0 100 62 40 17 8 May 2027 . . . . . . . . . . . . 88 39 23 8 3 82 0 0 0 0 100 54 32 12 5 May 2028 . . . . . . . . . . . . 86 34 18 6 2 71 0 0 0 0 100 46 25 8 3 May 2029 . . . . . . . . . . . . 83 29 15 4 1 58 0 0 0 0 100 40 20 5 2 May 2030 . . . . . . . . . . . . 81 24 11 3 1 45 0 0 0 0 100 34 16 4 1 May 2031 . . . . . . . . . . . . 79 20 9 2 0 32 0 0 0 0 100 28 12 2 1 May 2032 . . . . . . . . . . . . 76 17 7 1 0 18 0 0 0 0 100 23 10 2 0 May 2033 . . . . . . . . . . . . 73 14 5 1 0 3 0 0 0 0 100 19 7 1 0 May 2034 . . . . . . . . . . . . 71 11 4 1 0 0 0 0 0 0 97 15 5 1 0 May 2035 . . . . . . . . . . . . 68 9 3 0 0 0 0 0 0 0 93 12 4 0 0 May 2036 . . . . . . . . . . . . 64 7 2 0 0 0 0 0 0 0 88 9 3 0 0 May 2037 . . . . . . . . . . . . 61 5 1 0 0 0 0 0 0 0 84 7 2 0 0 May 2038 . . . . . . . . . . . . 58 3 1 0 0 0 0 0 0 0 79 4 1 0 0 May 2039 . . . . . . . . . . . . 54 2 0 0 0 0 0 0 0 0 74 2 1 0 0 May 2040 . . . . . . . . . . . . 50 0 0 0 0 0 0 0 0 0 69 1 0 0 0 May 2041 . . . . . . . . . . . . 46 0 0 0 0 0 0 0 0 0 64 0 0 0 0 May 2042 . . . . . . . . . . . . 42 0 0 0 0 0 0 0 0 0 58 0 0 0 0 May 2043 . . . . . . . . . . . . 38 0 0 0 0 0 0 0 0 0 52 0 0 0 0 May 2044 . . . . . . . . . . . . 33 0 0 0 0 0 0 0 0 0 45 0 0 0 0 May 2045 . . . . . . . . . . . . 28 0 0 0 0 0 0 0 0 0 39 0 0 0 0 May 2046 . . . . . . . . . . . . 23 0 0 0 0 0 0 0 0 0 32 0 0 0 0 May 2047 . . . . . . . . . . . . 18 0 0 0 0 0 0 0 0 0 24 0 0 0 0 May 2048 . . . . . . . . . . . . 12 0 0 0 0 0 0 0 0 0 17 0 0 0 0 May 2049 . . . . . . . . . . . . 6 0 0 0 0 0 0 0 0 0 9 0 0 0 0 May 2050 . . . . . . . . . . . . 0 0 0 0 0 0 0 0 0 0 0 0 0 0 0 Weighted Average
Life (years) . . . . . . . . . 18.6 6.6 4.6 2.8 2.1 9.5 1.6 1.0 0.6 0.4 22.8 8.6 6.1 3.7 2.8
S-48

Security Group 19 PSA Prepayment Assumption Rates
Class AJ Class AK Class AL Classes AM and AN
Distribution Date 0% 110% 150% 185% 400% 0% 110% 150% 185% 400% 0% 110% 150% 185% 400% 0% 110% 150% 185% 400%
Initial Percent . . . . . . . . . 100 100 100 100 100 100 100 100 100 100 100 100 100 100 100 100 100 100 100 100 May 2021 . . . . . . . . . . . . 98 96 95 94 91 100 100 100 100 100 100 100 100 100 100 98 95 95 94 90 May 2022 . . . . . . . . . . . . 96 89 86 84 72 100 100 100 100 100 100 100 100 100 100 95 88 85 83 70 May 2023 . . . . . . . . . . . . 94 80 75 72 51 100 100 100 100 100 100 100 100 100 100 93 78 73 69 46 May 2024 . . . . . . . . . . . . 91 71 65 60 34 100 100 100 100 100 100 100 100 100 100 91 69 62 56 27 May 2025 . . . . . . . . . . . . 89 64 56 50 21 100 100 100 100 100 100 100 100 100 100 88 60 52 45 13 May 2026 . . . . . . . . . . . . 87 56 48 41 12 100 100 100 100 100 100 100 100 100 100 85 52 43 36 3 May 2027 . . . . . . . . . . . . 84 50 41 34 5 100 100 100 100 100 100 100 100 100 83 82 45 35 27 0 May 2028 . . . . . . . . . . . . 81 44 34 27 0 100 100 100 100 100 100 100 100 100 61 80 38 28 20 0 May 2029 . . . . . . . . . . . . 79 38 28 21 0 100 100 100 100 73 100 100 100 100 45 76 32 21 13 0 May 2030 . . . . . . . . . . . . 76 33 23 16 0 100 100 100 100 54 100 100 100 100 33 73 26 16 8 0 May 2031 . . . . . . . . . . . . 73 28 19 12 0 100 100 100 100 39 100 100 100 100 24 70 21 10 3 0 May 2032 . . . . . . . . . . . . 70 24 14 8 0 100 100 100 100 29 100 100 100 95 18 67 16 6 0 0 May 2033 . . . . . . . . . . . . 66 20 11 5 0 100 100 100 100 21 100 100 100 81 13 63 12 2 0 0 May 2034 . . . . . . . . . . . . 63 16 7 2 0 100 100 100 100 15 100 100 93 69 9 59 8 0 0 0 May 2035 . . . . . . . . . . . . 59 13 4 0 0 100 100 100 95 11 100 100 80 58 7 55 4 0 0 0 May 2036 . . . . . . . . . . . . 56 9 2 0 0 100 100 100 80 8 100 100 69 49 5 51 0 0 0 0 May 2037 . . . . . . . . . . . . 52 7 0 0 0 100 100 97 67 6 100 89 59 41 3 47 0 0 0 0 May 2038 . . . . . . . . . . . . 48 4 0 0 0 100 100 82 55 4 100 78 50 34 2 43 0 0 0 0 May 2039 . . . . . . . . . . . . 44 1 0 0 0 100 100 69 46 3 100 67 42 28 2 38 0 0 0 0 May 2040 . . . . . . . . . . . . 40 0 0 0 0 100 95 58 37 2 100 58 35 23 1 34 0 0 0 0 May 2041 . . . . . . . . . . . . 35 0 0 0 0 100 81 48 30 1 100 49 29 19 1 29 0 0 0 0 May 2042 . . . . . . . . . . . . 30 0 0 0 0 100 68 39 24 1 100 41 24 15 1 23 0 0 0 0 May 2043 . . . . . . . . . . . . 26 0 0 0 0 100 56 32 19 1 100 34 19 12 0 18 0 0 0 0 May 2044 . . . . . . . . . . . . 21 0 0 0 0 100 45 25 15 0 100 28 15 9 0 13 0 0 0 0 May 2045 . . . . . . . . . . . . 15 0 0 0 0 100 36 19 11 0 100 22 12 7 0 7 0 0 0 0 May 2046 . . . . . . . . . . . . 10 0 0 0 0 100 27 14 8 0 100 16 9 5 0 1 0 0 0 0 May 2047 . . . . . . . . . . . . 4 0 0 0 0 100 19 10 5 0 79 11 6 3 0 0 0 0 0 0 May 2048 . . . . . . . . . . . . 0 0 0 0 0 88 12 6 3 0 54 7 3 2 0 0 0 0 0 0 May 2049 . . . . . . . . . . . . 0 0 0 0 0 45 5 2 1 0 27 3 1 1 0 0 0 0 0 0 May 2050 . . . . . . . . . . . . 0 0 0 0 0 0 0 0 0 0 0 0 0 0 0 0 0 0 0 0 Weighted Average
Life (years) . . . . . . . . . 16.4 7.9 6.6 5.8 3.4 28.9 24.0 21.5 19.5 11.2 28.1 21.6 19.0 17.0 9.6 15.3 6.9 5.8 5.0 3.0
PSA Prepayment Assumption Rates
Class DP Class DQ Class ZD
Distribution Date 0% 110% 150% 185% 400% 0% 110% 150% 185% 400% 0% 110% 150% 185% 400%
Initial Percent . . . . . . . . . 100 100 100 100 100 100 100 100 100 100 100 100 100 100 100 May 2021 . . . . . . . . . . . . 98 95 95 95 95 100 100 100 100 100 103 103 98 93 67 May 2022 . . . . . . . . . . . . 95 88 88 88 86 100 100 100 100 100 105 105 88 74 0 May 2023 . . . . . . . . . . . . 93 79 79 79 64 100 100 100 100 100 108 108 76 48 0 May 2024 . . . . . . . . . . . . 90 70 70 70 47 100 100 100 100 100 111 110 66 28 0 May 2025 . . . . . . . . . . . . 87 62 62 62 35 100 100 100 100 100 113 113 59 15 0 May 2026 . . . . . . . . . . . . 84 54 54 54 25 100 100 100 100 100 116 116 55 6 0 May 2027 . . . . . . . . . . . . 81 47 47 47 18 100 100 100 100 100 119 119 53 1 0 May 2028 . . . . . . . . . . . . 78 41 41 41 13 100 100 100 100 100 122 122 53 0 0 May 2029 . . . . . . . . . . . . 75 35 35 35 10 100 100 100 100 100 125 123 52 0 0 May 2030 . . . . . . . . . . . . 72 30 30 30 7 100 100 100 100 100 128 123 51 0 0 May 2031 . . . . . . . . . . . . 68 25 25 25 5 100 100 100 100 100 132 120 50 0 0 May 2032 . . . . . . . . . . . . 65 21 21 21 3 100 100 100 100 100 135 116 47 0 0 May 2033 . . . . . . . . . . . . 61 18 18 18 2 100 100 100 100 100 138 111 44 0 0 May 2034 . . . . . . . . . . . . 57 15 15 15 1 100 100 100 100 100 142 104 41 0 0 May 2035 . . . . . . . . . . . . 53 13 13 13 1 100 100 100 100 100 145 98 38 0 0 May 2036 . . . . . . . . . . . . 49 10 10 10 0 100 100 100 100 100 149 90 35 0 0 May 2037 . . . . . . . . . . . . 45 9 9 9 0 100 100 100 100 79 153 83 31 0 0 May 2038 . . . . . . . . . . . . 40 7 7 7 0 100 100 100 100 56 157 75 28 0 0 May 2039 . . . . . . . . . . . . 35 6 6 6 0 100 100 100 100 40 161 68 25 0 0 May 2040 . . . . . . . . . . . . 31 4 4 4 0 100 100 100 100 28 165 60 22 0 0 May 2041 . . . . . . . . . . . . 25 3 3 3 0 100 100 100 100 19 169 53 19 0 0 May 2042 . . . . . . . . . . . . 20 2 2 2 0 100 100 100 100 13 173 46 16 0 0 May 2043 . . . . . . . . . . . . 15 2 2 2 0 100 100 100 100 9 178 39 13 0 0 May 2044 . . . . . . . . . . . . 9 1 1 1 0 100 100 100 100 6 182 32 11 0 0 May 2045 . . . . . . . . . . . . 3 1 1 1 0 100 100 100 100 4 187 26 9 0 0 May 2046 . . . . . . . . . . . . 0 0 0 0 0 100 100 100 100 2 169 20 7 0 0 May 2047 . . . . . . . . . . . . 0 0 0 0 0 73 73 73 73 1 130 14 5 0 0 May 2048 . . . . . . . . . . . . 0 0 0 0 0 42 42 42 42 1 89 9 3 0 0 May 2049 . . . . . . . . . . . . 0 0 0 0 0 17 17 17 17 0 46 4 1 0 0 May 2050 . . . . . . . . . . . . 0 0 0 0 0 0 0 0 0 0 0 0 0 0 0 Weighted Average
Life (years) . . . . . . . . . 14.8 7.9 7.9 7.9 4.6 27.8 27.8 27.8 27.8 19.1 27.8 20.0 11.4 3.2 1.2
S-49

Security Group 20 PSA Prepayment Assumption Rates
Class IQ Classes QA, QC, QD, QE and QI Class QB
Distribution Date 0% 125% 182% 450% 500% 0% 125% 182% 450% 500% 0% 125% 182% 450% 500%
Initial Percent . . . . . . . . . 100 100 100 100 100 100 100 100 100 100 100 100 100 100 100 May 2021 . . . . . . . . . . . . 98 96 96 92 91 96 93 93 93 93 96 93 93 93 93 May 2022 . . . . . . . . . . . . 96 90 87 75 73 93 82 82 82 82 93 82 82 82 82 May 2023 . . . . . . . . . . . . 94 81 76 54 51 89 68 68 68 68 89 68 68 68 68 May 2024 . . . . . . . . . . . . 93 73 66 39 35 84 54 54 54 54 85 54 54 54 54 May 2025 . . . . . . . . . . . . 90 66 57 27 24 80 41 41 41 36 80 42 42 42 37 May 2026 . . . . . . . . . . . . 88 59 50 19 16 76 30 30 30 24 76 31 31 31 25 May 2027 . . . . . . . . . . . . 86 53 43 14 11 71 21 21 21 16 72 22 22 22 17 May 2028 . . . . . . . . . . . . 84 48 37 10 7 67 14 14 14 11 67 15 15 15 12 May 2029 . . . . . . . . . . . . 81 43 32 7 5 62 10 10 10 7 62 11 11 11 8 May 2030 . . . . . . . . . . . . 79 38 27 5 3 57 7 7 7 4 57 8 8 8 5 May 2031 . . . . . . . . . . . . 76 34 24 3 2 52 4 4 4 2 52 5 5 5 4 May 2032 . . . . . . . . . . . . 73 30 20 2 2 46 3 3 3 1 47 4 4 4 2 May 2033 . . . . . . . . . . . . 71 27 17 2 1 41 1 1 1 0 41 3 3 3 2 May 2034 . . . . . . . . . . . . 68 24 15 1 1 35 1 1 1 0 36 2 2 2 1 May 2035 . . . . . . . . . . . . 65 21 12 1 0 29 0 0 0 0 30 1 1 1 1 May 2036 . . . . . . . . . . . . 61 18 10 1 0 23 0 0 0 0 23 1 1 1 0 May 2037 . . . . . . . . . . . . 58 16 9 0 0 16 0 0 0 0 17 1 1 1 0 May 2038 . . . . . . . . . . . . 55 14 7 0 0 9 0 0 0 0 11 0 0 0 0 May 2039 . . . . . . . . . . . . 51 12 6 0 0 3 0 0 0 0 4 0 0 0 0 May 2040 . . . . . . . . . . . . 47 10 5 0 0 0 0 0 0 0 0 0 0 0 0 May 2041 . . . . . . . . . . . . 43 8 4 0 0 0 0 0 0 0 0 0 0 0 0 May 2042 . . . . . . . . . . . . 39 7 3 0 0 0 0 0 0 0 0 0 0 0 0 May 2043 . . . . . . . . . . . . 35 6 3 0 0 0 0 0 0 0 0 0 0 0 0 May 2044 . . . . . . . . . . . . 31 5 2 0 0 0 0 0 0 0 0 0 0 0 0 May 2045 . . . . . . . . . . . . 26 4 1 0 0 0 0 0 0 0 0 0 0 0 0 May 2046 . . . . . . . . . . . . 21 3 1 0 0 0 0 0 0 0 0 0 0 0 0 May 2047 . . . . . . . . . . . . 16 2 1 0 0 0 0 0 0 0 0 0 0 0 0 May 2048 . . . . . . . . . . . . 11 1 0 0 0 0 0 0 0 0 0 0 0 0 0 May 2049 . . . . . . . . . . . . 6 1 0 0 0 0 0 0 0 0 0 0 0 0 0 May 2050 . . . . . . . . . . . . 0 0 0 0 0 0 0 0 0 0 0 0 0 0 0 Weighted Average
Life (years) . . . . . . . . . 17.9 9.4 7.6 4.0 3.7 10.8 4.8 4.8 4.8 4.5 10.9 5.0 5.0 5.0 4.6
PSA Prepayment Assumption Rates
Class QP Class ZQ
Distribution Date 0% 125% 182% 450% 500% 0% 125% 182% 450% 500%
Initial Percent . . . . . . . . . 100 100 100 100 100 100 100 100 100 100 May 2021 . . . . . . . . . . . . 100 100 100 100 100 102 102 100 90 88 May 2022 . . . . . . . . . . . . 100 100 100 100 100 103 103 96 63 57 May 2023 . . . . . . . . . . . . 100 100 100 100 100 105 105 90 30 21 May 2024 . . . . . . . . . . . . 100 100 100 100 100 106 106 86 11 0 May 2025 . . . . . . . . . . . . 100 100 100 100 100 108 108 84 2 0 May 2026 . . . . . . . . . . . . 100 100 100 100 100 109 109 83 0 0 May 2027 . . . . . . . . . . . . 100 100 100 100 100 111 108 80 0 0 May 2028 . . . . . . . . . . . . 100 100 100 100 100 113 104 75 0 0 May 2029 . . . . . . . . . . . . 100 100 100 100 100 114 98 69 0 0 May 2030 . . . . . . . . . . . . 100 100 100 100 100 116 91 62 0 0 May 2031 . . . . . . . . . . . . 100 100 100 100 100 118 84 55 0 0 May 2032 . . . . . . . . . . . . 100 100 100 100 100 120 76 49 0 0 May 2033 . . . . . . . . . . . . 100 100 100 100 100 122 69 42 0 0 May 2034 . . . . . . . . . . . . 100 100 100 100 94 123 61 37 0 0 May 2035 . . . . . . . . . . . . 100 100 100 100 62 125 54 32 0 0 May 2036 . . . . . . . . . . . . 100 76 76 76 41 127 48 27 0 0 May 2037 . . . . . . . . . . . . 100 52 52 52 27 129 42 23 0 0 May 2038 . . . . . . . . . . . . 100 36 36 36 18 131 37 19 0 0 May 2039 . . . . . . . . . . . . 100 24 24 24 12 133 32 16 0 0 May 2040 . . . . . . . . . . . . 16 16 16 16 7 129 27 13 0 0 May 2041 . . . . . . . . . . . . 11 11 11 11 5 118 23 11 0 0 May 2042 . . . . . . . . . . . . 7 7 7 7 3 107 19 9 0 0 May 2043 . . . . . . . . . . . . 5 5 5 5 2 96 16 7 0 0 May 2044 . . . . . . . . . . . . 3 3 3 3 1 83 13 5 0 0 May 2045 . . . . . . . . . . . . 2 2 2 2 1 71 10 4 0 0 May 2046 . . . . . . . . . . . . 1 1 1 1 0 58 7 3 0 0 May 2047 . . . . . . . . . . . . 1 1 1 1 0 44 5 2 0 0 May 2048 . . . . . . . . . . . . 0 0 0 0 0 30 3 1 0 0 May 2049 . . . . . . . . . . . . 0 0 0 0 0 15 1 0 0 0 May 2050 . . . . . . . . . . . . 0 0 0 0 0 0 0 0 0 0 Weighted Average
Life (years) . . . . . . . . . 19.9 17.9 17.9 17.9 16.2 25.1 15.9 12.3 2.5 2.2
S-50

Security Group 21 PSA Prepayment Assumption Rates
Class IY
Distribution Date 0% 100% 175% 300% 400%
Initial Percent . . . . . . . . . 100 100 100 100 100 May 2021 . . . . . . . . . . . . 98 94 92 87 84 May 2022 . . . . . . . . . . . . 96 88 82 73 67 May 2023 . . . . . . . . . . . . 94 81 72 59 50 May 2024 . . . . . . . . . . . . 92 74 63 48 37 May 2025 . . . . . . . . . . . . 90 68 55 38 27 May 2026 . . . . . . . . . . . . 88 62 47 30 20 May 2027 . . . . . . . . . . . . 85 57 41 24 15 May 2028 . . . . . . . . . . . . 83 51 36 19 11 May 2029 . . . . . . . . . . . . 80 47 31 15 8 May 2030 . . . . . . . . . . . . 77 42 26 12 6 May 2031 . . . . . . . . . . . . 74 38 23 9 4 May 2032 . . . . . . . . . . . . 71 34 19 7 3 May 2033 . . . . . . . . . . . . 68 30 16 6 2 May 2034 . . . . . . . . . . . . 65 27 14 4 1 May 2035 . . . . . . . . . . . . 62 24 12 3 1 May 2036 . . . . . . . . . . . . 58 21 10 2 1 May 2037 . . . . . . . . . . . . 54 18 8 2 0 May 2038 . . . . . . . . . . . . 50 16 7 1 0 May 2039 . . . . . . . . . . . . 46 13 5 1 0 May 2040 . . . . . . . . . . . . 42 11 4 1 0 May 2041 . . . . . . . . . . . . 37 10 3 1 0 May 2042 . . . . . . . . . . . . 33 8 3 0 0 May 2043 . . . . . . . . . . . . 28 6 2 0 0 May 2044 . . . . . . . . . . . . 22 5 1 0 0 May 2045 . . . . . . . . . . . . 17 3 1 0 0 May 2046 . . . . . . . . . . . . 12 2 1 0 0 May 2047 . . . . . . . . . . . . 8 2 0 0 0 May 2048 . . . . . . . . . . . . 5 1 0 0 0 May 2049 . . . . . . . . . . . . 2 0 0 0 0 May 2050 . . . . . . . . . . . . 0 0 0 0 0 Weighted Average
Life (years) . . . . . . . . . 16.9 9.8 7.2 4.9 3.9
Security Group 22 PSA Prepayment Assumption Rates
Class IW
Distribution Date 0% 100% 175% 300% 400%
Initial Percent . . . . . . . . . 100 100 100 100 100 May 2021 . . . . . . . . . . . . 96 89 84 77 71 May 2022 . . . . . . . . . . . . 92 79 72 60 52 May 2023 . . . . . . . . . . . . 87 71 62 47 38 May 2024 . . . . . . . . . . . . 82 64 52 37 27 May 2025 . . . . . . . . . . . . 78 57 44 29 19 May 2026 . . . . . . . . . . . . 73 50 37 22 14 May 2027 . . . . . . . . . . . . 68 44 31 17 10 May 2028 . . . . . . . . . . . . 63 38 26 13 7 May 2029 . . . . . . . . . . . . 57 33 21 9 5 May 2030 . . . . . . . . . . . . 51 27 17 7 3 May 2031 . . . . . . . . . . . . 45 23 13 5 2 May 2032 . . . . . . . . . . . . 39 18 10 3 1 May 2033 . . . . . . . . . . . . 32 14 7 2 1 May 2034 . . . . . . . . . . . . 25 10 5 1 0 May 2035 . . . . . . . . . . . . 17 7 3 1 0 May 2036 . . . . . . . . . . . . 11 4 2 0 0 May 2037 . . . . . . . . . . . . 6 2 1 0 0 May 2038 . . . . . . . . . . . . 2 1 0 0 0 May 2039 . . . . . . . . . . . . 0 0 0 0 0 May 2040 . . . . . . . . . . . . 0 0 0 0 0 May 2041 . . . . . . . . . . . . 0 0 0 0 0 May 2042 . . . . . . . . . . . . 0 0 0 0 0 May 2043 . . . . . . . . . . . . 0 0 0 0 0 May 2044 . . . . . . . . . . . . 0 0 0 0 0 May 2045 . . . . . . . . . . . . 0 0 0 0 0 May 2046 . . . . . . . . . . . . 0 0 0 0 0 May 2047 . . . . . . . . . . . . 0 0 0 0 0 May 2048 . . . . . . . . . . . . 0 0 0 0 0 Weighted Average
Life (years) . . . . . . . . . 9.7 6.8 5.4 3.8 3.0
S-51

Security Group 23 PSA Prepayment Assumption Rates
Classes IK, KE, KG, KH, KJ, Classes IU, UB, UC, UD, UE, KL and KM UG and UP Class KU Class KW
Distribution Date 0% 440% 500% 550% 1,000% 0% 440% 500% 550% 1,000% 0% 440% 500% 550% 1,000% 0% 440% 500% 550% 1,000%
Initial Percent . . . 100 100 100 100 100 100 100 100 100 100 100 100 100 100 100 100 100 100 100 100 May 2021 . . . . . . . 98 91 91 91 90 98 90 90 90 89 100 100 100 100 100 100 100 100 100 100 May 2022 . . . . . . . 96 72 72 72 53 96 68 68 68 48 100 100 100 100 100 100 100 100 100 100 May 2023 . . . . . . . 94 49 49 49 21 93 44 44 44 13 100 100 100 100 100 100 100 100 100 100 May 2024 . . . . . . . 92 32 32 32 8 91 25 25 25 0 100 100 100 100 0 100 100 100 100 81 May 2025 . . . . . . . 89 21 21 21 3 88 12 12 12 0 100 100 100 100 0 100 100 100 100 28 May 2026 . . . . . . . 87 14 14 14 1 86 4 4 4 0 100 33 33 33 0 100 100 100 100 8 May 2027 . . . . . . . 84 9 9 9 0 83 0 0 0 0 100 0 0 0 0 100 87 87 87 0 May 2028 . . . . . . . 82 5 5 5 0 80 0 0 0 0 100 0 0 0 0 100 54 54 54 0 May 2029 . . . . . . . 79 3 3 3 0 77 0 0 0 0 100 0 0 0 0 100 33 33 33 0 May 2030 . . . . . . . 76 2 2 2 0 73 0 0 0 0 100 0 0 0 0 100 19 19 19 0 May 2031 . . . . . . . 73 1 1 1 0 70 0 0 0 0 100 0 0 0 0 100 10 10 10 0 May 2032 . . . . . . . 70 0 0 0 0 66 0 0 0 0 100 0 0 0 0 100 4 4 4 0 May 2033 . . . . . . . 66 0 0 0 0 63 0 0 0 0 100 0 0 0 0 100 0 0 0 0 May 2034 . . . . . . . 63 0 0 0 0 59 0 0 0 0 100 0 0 0 0 100 0 0 0 0 May 2035 . . . . . . . 59 0 0 0 0 54 0 0 0 0 100 0 0 0 0 100 0 0 0 0 May 2036 . . . . . . . 55 0 0 0 0 50 0 0 0 0 100 0 0 0 0 100 0 0 0 0 May 2037 . . . . . . . 51 0 0 0 0 45 0 0 0 0 100 0 0 0 0 100 0 0 0 0 May 2038 . . . . . . . 47 0 0 0 0 41 0 0 0 0 100 0 0 0 0 100 0 0 0 0 May 2039 . . . . . . . 42 0 0 0 0 36 0 0 0 0 100 0 0 0 0 100 0 0 0 0 May 2040 . . . . . . . 37 0 0 0 0 30 0 0 0 0 100 0 0 0 0 100 0 0 0 0 May 2041 . . . . . . . 32 0 0 0 0 25 0 0 0 0 100 0 0 0 0 100 0 0 0 0 May 2042 . . . . . . . 27 0 0 0 0 19 0 0 0 0 100 0 0 0 0 100 0 0 0 0 May 2043 . . . . . . . 22 0 0 0 0 13 0 0 0 0 100 0 0 0 0 100 0 0 0 0 May 2044 . . . . . . . 16 0 0 0 0 7 0 0 0 0 53 0 0 0 0 100 0 0 0 0 May 2045 . . . . . . . 10 0 0 0 0 0 0 0 0 0 0 0 0 0 0 98 0 0 0 0 May 2046 . . . . . . . 3 0 0 0 0 0 0 0 0 0 0 0 0 0 0 34 0 0 0 0 May 2047 . . . . . . . 0 0 0 0 0 0 0 0 0 0 0 0 0 0 0 0 0 0 0 0 May 2048 . . . . . . . 0 0 0 0 0 0 0 0 0 0 0 0 0 0 0 0 0 0 0 0 May 2049 . . . . . . . 0 0 0 0 0 0 0 0 0 0 0 0 0 0 0 0 0 0 0 0 May 2050 . . . . . . . 0 0 0 0 0 0 0 0 0 0 0 0 0 0 0 0 0 0 0 0 Weighted Average
Life (years) . . . . 16.0 3.5 3.5 3.5 2.3 14.9 2.9 2.9 2.9 2.0 24.1 5.8 5.8 5.8 3.4 25.8 8.6 8.6 8.6 4.7
PSA Prepayment Assumption Rates
Classes UH, UI, UJ, UK, UL, UM and UN Class UZ Class ZU
Distribution Date 0% 440% 500% 550% 1,000% 0% 440% 500% 550% 1,000% 0% 440% 500% 550% 1,000%
Initial Percent . . . . 100 100 100 100 100 100 100 100 100 100 100 100 100 100 100 May 2021 . . . . . . . 98 88 88 88 87 104 104 92 82 0 104 104 104 104 104 May 2022 . . . . . . . 95 64 64 64 41 107 107 71 40 0 107 107 107 107 107 May 2023 . . . . . . . 92 36 36 36 1 111 111 53 6 0 111 111 111 111 111 May 2024 . . . . . . . 90 14 14 14 0 115 114 49 0 0 115 115 115 115 115 May 2025 . . . . . . . 87 0 0 0 0 119 107 45 0 0 119 119 119 119 119 May 2026 . . . . . . . 84 0 0 0 0 123 94 38 0 0 123 123 123 123 123 May 2027 . . . . . . . 80 0 0 0 0 128 78 31 0 0 128 128 128 128 113 May 2028 . . . . . . . 77 0 0 0 0 132 63 24 0 0 132 132 132 132 44 May 2029 . . . . . . . 73 0 0 0 0 137 49 19 0 0 137 137 137 137 17 May 2030 . . . . . . . 70 0 0 0 0 142 38 14 0 0 142 142 142 142 7 May 2031 . . . . . . . 66 0 0 0 0 147 29 10 0 0 147 147 147 147 3 May 2032 . . . . . . . 62 0 0 0 0 152 22 8 0 0 152 152 152 152 1 May 2033 . . . . . . . 57 0 0 0 0 158 16 5 0 0 158 150 150 150 0 May 2034 . . . . . . . 53 0 0 0 0 163 12 4 0 0 163 96 96 96 0 May 2035 . . . . . . . 48 0 0 0 0 169 9 3 0 0 169 61 61 61 0 May 2036 . . . . . . . 43 0 0 0 0 175 6 2 0 0 175 39 39 39 0 May 2037 . . . . . . . 38 0 0 0 0 181 5 1 0 0 181 24 24 24 0 May 2038 . . . . . . . 32 0 0 0 0 188 3 1 0 0 188 15 15 15 0 May 2039 . . . . . . . 27 0 0 0 0 194 2 1 0 0 194 9 9 9 0 May 2040 . . . . . . . 21 0 0 0 0 201 2 0 0 0 201 6 6 6 0 May 2041 . . . . . . . 14 0 0 0 0 208 1 0 0 0 208 3 3 3 0 May 2042 . . . . . . . 8 0 0 0 0 216 1 0 0 0 216 2 2 2 0 May 2043 . . . . . . . 1 0 0 0 0 223 0 0 0 0 223 1 1 1 0 May 2044 . . . . . . . 0 0 0 0 0 231 0 0 0 0 231 1 1 1 0 May 2045 . . . . . . . 0 0 0 0 0 240 0 0 0 0 240 0 0 0 0 May 2046 . . . . . . . 0 0 0 0 0 248 0 0 0 0 248 0 0 0 0 May 2047 . . . . . . . 0 0 0 0 0 232 0 0 0 0 0 0 0 0 0 May 2048 . . . . . . . 0 0 0 0 0 158 0 0 0 0 0 0 0 0 0 May 2049 . . . . . . . 0 0 0 0 0 81 0 0 0 0 0 0 0 0 0 May 2050 . . . . . . . 0 0 0 0 0 0 0 0 0 0 0 0 0 0 0 Weighted Average
Life (years) . . . . 13.7 2.5 2.5 2.5 1.8 28.4 9.2 5.2 1.8 0.6 26.6 15.1 15.1 15.1 8.0
S-52
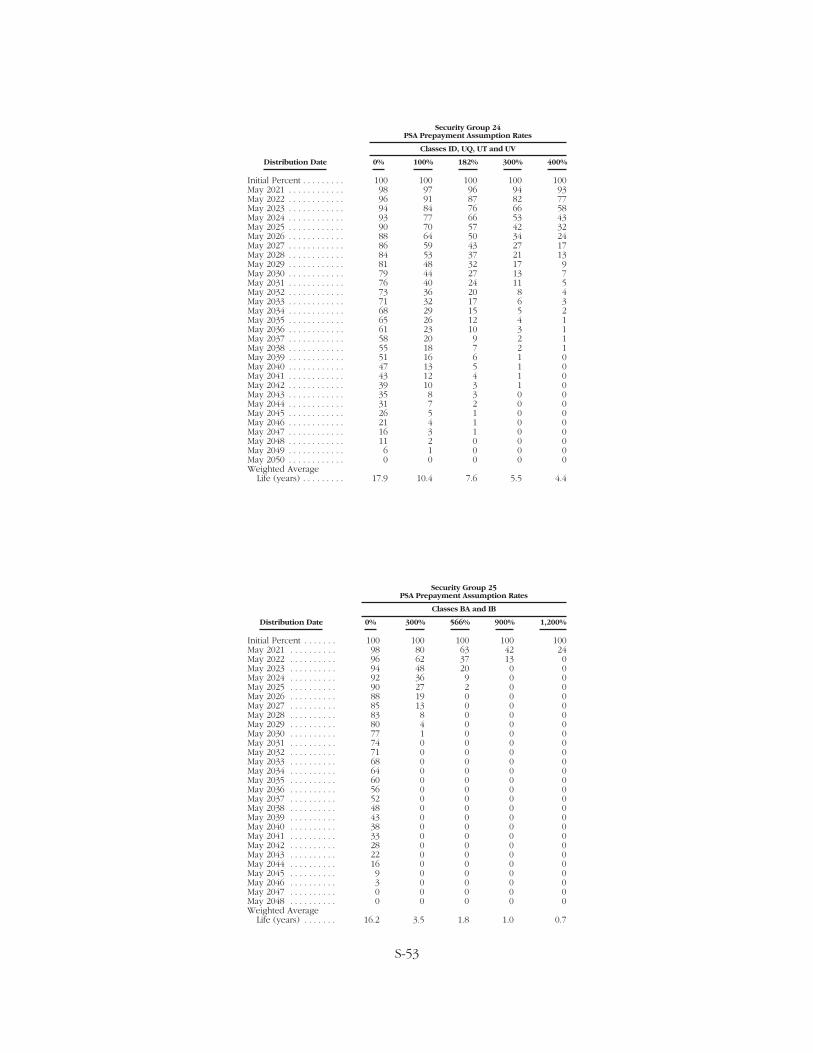
Security Group 24 PSA Prepayment Assumption Rates
Classes ID, UQ, UT and UV
Distribution Date 0% 100% 182% 300% 400%
Initial Percent . . . . . . . . . 100 100 100 100 100 May 2021 . . . . . . . . . . . . 98 97 96 94 93 May 2022 . . . . . . . . . . . . 96 91 87 82 77 May 2023 . . . . . . . . . . . . 94 84 76 66 58 May 2024 . . . . . . . . . . . . 93 77 66 53 43 May 2025 . . . . . . . . . . . . 90 70 57 42 32 May 2026 . . . . . . . . . . . . 88 64 50 34 24 May 2027 . . . . . . . . . . . . 86 59 43 27 17 May 2028 . . . . . . . . . . . . 84 53 37 21 13 May 2029 . . . . . . . . . . . . 81 48 32 17 9 May 2030 . . . . . . . . . . . . 79 44 27 13 7 May 2031 . . . . . . . . . . . . 76 40 24 11 5 May 2032 . . . . . . . . . . . . 73 36 20 8 4 May 2033 . . . . . . . . . . . . 71 32 17 6 3 May 2034 . . . . . . . . . . . . 68 29 15 5 2 May 2035 . . . . . . . . . . . . 65 26 12 4 1 May 2036 . . . . . . . . . . . . 61 23 10 3 1 May 2037 . . . . . . . . . . . . 58 20 9 2 1 May 2038 . . . . . . . . . . . . 55 18 7 2 1 May 2039 . . . . . . . . . . . . 51 16 6 1 0 May 2040 . . . . . . . . . . . . 47 13 5 1 0 May 2041 . . . . . . . . . . . . 43 12 4 1 0 May 2042 . . . . . . . . . . . . 39 10 3 1 0 May 2043 . . . . . . . . . . . . 35 8 3 0 0 May 2044 . . . . . . . . . . . . 31 7 2 0 0 May 2045 . . . . . . . . . . . . 26 5 1 0 0 May 2046 . . . . . . . . . . . . 21 4 1 0 0 May 2047 . . . . . . . . . . . . 16 3 1 0 0 May 2048 . . . . . . . . . . . . 11 2 0 0 0 May 2049 . . . . . . . . . . . . 6 1 0 0 0 May 2050 . . . . . . . . . . . . 0 0 0 0 0 Weighted Average
Life (years) . . . . . . . . . 17.9 10.4 7.6 5.5 4.4
Security Group 25 PSA Prepayment Assumption Rates
Classes BA and IB
Distribution Date 0% 300% 566% 900% 1,200%
Initial Percent . . . . . . . 100 100 100 100 100 May 2021 . . . . . . . . . . 98 80 63 42 24 May 2022 . . . . . . . . . . 96 62 37 13 0 May 2023 . . . . . . . . . . 94 48 20 0 0 May 2024 . . . . . . . . . . 92 36 9 0 0 May 2025 . . . . . . . . . . 90 27 2 0 0 May 2026 . . . . . . . . . . 88 19 0 0 0 May 2027 . . . . . . . . . . 85 13 0 0 0 May 2028 . . . . . . . . . . 83 8 0 0 0 May 2029 . . . . . . . . . . 80 4 0 0 0 May 2030 . . . . . . . . . . 77 1 0 0 0 May 2031 . . . . . . . . . . 74 0 0 0 0 May 2032 . . . . . . . . . . 71 0 0 0 0 May 2033 . . . . . . . . . . 68 0 0 0 0 May 2034 . . . . . . . . . . 64 0 0 0 0 May 2035 . . . . . . . . . . 60 0 0 0 0 May 2036 . . . . . . . . . . 56 0 0 0 0 May 2037 . . . . . . . . . . 52 0 0 0 0 May 2038 . . . . . . . . . . 48 0 0 0 0 May 2039 . . . . . . . . . . 43 0 0 0 0 May 2040 . . . . . . . . . . 38 0 0 0 0 May 2041 . . . . . . . . . . 33 0 0 0 0 May 2042 . . . . . . . . . . 28 0 0 0 0 May 2043 . . . . . . . . . . 22 0 0 0 0 May 2044 . . . . . . . . . . 16 0 0 0 0 May 2045 . . . . . . . . . . 9 0 0 0 0 May 2046 . . . . . . . . . . 3 0 0 0 0 May 2047 . . . . . . . . . . 0 0 0 0 0 May 2048 . . . . . . . . . . 0 0 0 0 0 Weighted Average
Life (years) . . . . . . . 16.2 3.5 1.8 1.0 0.7
S-53

Yield Considerations
An investor seeking to maximize yield should make a decision whether to invest in any Regular or MX Class based on:
� the anticipated yield of that Class resulting from its purchase price,
� the investor’s own projection of Mortgage Loan prepayment rates under a variety of scenarios,
� in the case of the Group 2, 5, 6, 8, 13, 14, 15, 16, 21, 22 and 25 Securities, the investor’s own projection of payment rates on the Underlying Certificates under a variety of scenarios and
� in the case of a Floating Rate, an Inverse Floating Rate or a Weighted Average Coupon Class, the investor’s own projection of levels of LIBOR under a variety of scenarios.
No representation is made regarding Mortgage Loan prepayment rates, Underlying Certifi-cate payment rates, LIBOR levels or the yield of any Class.
Prepayments: Effect on Yields
The yields to investors will be sensitive in varying degrees to the rate of prepayments on the related Mortgage Loans.
� In the case of Regular Securities or MX Securities purchased at a premium (especially the Interest Only Classes), faster than anticipated rates of principal payments could result in actual yields to investors that are lower than the anticipated yields.
� Investors in the Interest Only Classes should also consider the risk that rapid rates of principal payments could result in the failure of investors to recover fully their investments.
� In the case of Regular Securities or MX Securities purchased at a discount (especially the Princi-pal Only Class), slower than anticipated rates of principal payments could result in actual yields to investors that are lower than the anticipated yields.
See “Risk Factors — Rates of principal payments can reduce your yield” in this Supplement.
Rapid rates of prepayments on the Mortgage Loans are likely to coincide with periods of low pre-vailing interest rates.
During periods of low prevailing interest rates, the yields at which an investor may be able to reinvest amounts received as principal payments on the investor’s Class of Securities may be lower than the yield on that Class.
Slow rates of prepayments on the Mortgage Loans are likely to coincide with periods of high pre-vailing interest rates.
During periods of high prevailing interest rates, the amount of principal payments available to an investor for reinvestment at those high rates may be relatively low.
The Mortgage Loans will not prepay at any constant rate until maturity, nor will all of the Mortgage Loans underlying any Trust Asset Group prepay at the same rate at any one time. The timing of changes in the rate of prepayments may affect the actual yield to an investor, even if the average rate of principal prepayments is consistent with the investor’s expectation. In general, the earlier a prepayment of principal on the Mortgage Loans, the greater the effect on an investor’s yield. As a result, the effect on an investor’s yield of principal prepayments occurring at a rate higher (or lower) than the rate antici-pated by the investor during the period immediately following the Closing Date is not likely to be offset by a later equivalent reduction (or increase) in the rate of principal prepayments.
S-54

LIBOR: Effect on Yields of the Floating Rate, Inverse Floating Rate and Weighted Average Coupon Classes
Low levels of LIBOR can reduce the yield of the Floating Rate Class. High levels of LIBOR can reduce the yield of the Inverse Floating Rate and Weighted Average Coupon Classes. In addition, the Floating Rate Class will not necessarily benefit from a higher yield at high levels of LIBOR and certain Inverse Floating Rate Classes may not benefit from particularly low levels of LIBOR because the rate on such Classes is capped at a maximum rate described under “Terms Sheet — Interest Rates.”
Payment Delay: Effect on Yields of the Fixed Rate Classes
The effective yield on any Fixed Rate Class will be less than the yield otherwise produced by its Interest Rate and purchase price because, on each Distribution Date, 30 days’ interest will be payable on (or added to the principal amount of) that Class even though interest began to accrue approximately 50 days earlier.
Yield Tables
The following tables show the pre-tax yields to maturity on a corporate bond equivalent basis of specified Classes at various constant percentages of PSA and, in the case of the Inverse Floating Rate and Weighted Average Coupon Classes, at various constant levels of LIBOR.
The Mortgage Loans will not prepay at any constant rate until maturity, and it is unlikely that LIBOR will remain constant. Moreover, it is likely that the Mortgage Loans will experience actual prepayment rates that differ from those of the Modeling Assumptions. Therefore, the actual pre-tax yield of any Class may differ from those shown in the applicable table below for that Class even if the Class is purchased at the assumed price shown.
The yields were calculated by
1. determining the monthly discount rates that, when applied to the applicable assumed streams of cash flows to be paid on the applicable Class, would cause the discounted present value of the assumed streams of cash flows to equal the assumed purchase price of that Class plus accrued interest (in the case of interest-bearing Classes), and
2. converting the monthly rates to corporate bond equivalent rates.
These calculations do not take into account variations that may occur in the interest rates at which investors may be able to reinvest funds received by them as distributions on their Securities and con-sequently do not purport to reflect the return on any investment in any Class when those reinvestment rates are considered.
The information set forth in the following tables was prepared on the basis of the Modeling Assumptions and the assumptions that (1) the Interest Rate applicable to each Inverse Floating Rate and Weighted Average Coupon Class for each Accrual Period following the first Accrual Period will be based on the indicated level of LIBOR and (2) the purchase price of each Class (expressed as a percentage of its Original Class Principal Balance or original Class Notional Balance) plus accrued interest (in the case of interest-bearing Classes) is as indicated in the related table. The assumed purchase price is not necessarily that at which actual sales will occur.
S-55

SECURITY GROUP 1
Sensitivity of Class JI to Prepayments Assumed Price 7.5%*
PSA Prepayment Assumption Rates
100%
27.3%
182%
23.3%
300%
17.3%
400%
12.2%
634%
0.0%
SECURITY GROUP 2
Sensitivity of Class IJ to Prepayments Assumed Price 6.3890625%*
100%
48.9%
PSA Prepayment Assumption Rates
178% 300% 400%
42.8% 32.9% 24.4%
664%
0.1%
SECURITY GROUP 4
Sensitivity of Class GI to Prepayments Assumed Price 10.5%*
250%
30.3%
PSA Prepayment Assumption Rates
539% 611% 850%
6.4% 0.0% (23.0)%
1,100%
(51.0)%
SECURITY GROUP 5
Sensitivity of Class DI to Prepayments Assumed Price 16.0%*
PSA Prepayment Assumption Rates
300% 497% 578% 900% 1,200%
14.2% 0.0% (6.2)% (33.0)% (62.9)%
SECURITY GROUP 6
Sensitivity of Class IT to Prepayments Assumed Price 0.3793%*
PSA Prepayment Assumption Rates
LIBOR 100% 200% 300% 400%
5.55% and below 6.15% . . . . . . . . .6.75% and above
. . . . . . . . . . . . . .
. . . . . . . . . . . . . .
. . . . . . . . . . . . . .
23.6% 2.9% **
16.0% (4.7)%
**
8.1% (12.6)%
**
(0.1)% (20.5)%
**
* The price does not include accrued interest. Accrued interest has been added to the price in calculat-ing the yields set forth in the table.
** Indicates that investors will suffer a loss of virtually all of their investment.
S-56

Sensitivity of Class NA to Prepayments Assumed Price 18.75%*
PSA Prepayment Assumption Rates
LIBOR 100% 200% 300% 400%
0.100000% . . . . . . . . . . . . . . . . . . . 19.1% 12.1% 4.9% (2.6)% 0.170750% . . . . . . . . . . . . . . . . . . . 18.7% 11.7% 4.5% (3.0)% 2.860375% . . . . . . . . . . . . . . . . . . . 1.7% (4.8)% (11.5)% (18.5)% 5.550000% and above . . . . . . . . . . ** ** ** **
Sensitivity of Class NB to Prepayments Assumed Price 18.75%*
PSA Prepayment Assumption Rates
LIBOR 100% 200% 300% 400%
0.100000% . . . . . . . . . . . . . . . . . . . 19.2% 12.2% 5.0% (2.5)% 0.170750% . . . . . . . . . . . . . . . . . . . 18.7% 11.8% 4.6% (2.9)% 2.860375% . . . . . . . . . . . . . . . . . . . 1.8% (4.7)% (11.4)% (18.4)% 5.550000% and above . . . . . . . . . . ** ** ** **
Sensitivity of Class NC to Prepayments Assumed Price 18.75%*
PSA Prepayment Assumption Rates
LIBOR 100% 200% 300% 400%
0.100000% . . . . . . . . . . . . . . . . . . . 19.1% 12.1% 4.9% (2.6)% 0.170750% . . . . . . . . . . . . . . . . . . . 18.7% 11.7% 4.5% (3.0)% 2.860375% . . . . . . . . . . . . . . . . . . . 1.7% (4.8)% (11.5)% (18.4)% 5.550000% and above . . . . . . . . . . ** ** ** **
Sensitivity of Class ND to Prepayments Assumed Price 18.75%*
PSA Prepayment Assumption Rates
LIBOR 100% 200% 300% 400%
0.100000% . . . . . . . . . . . . . . . . . . . 19.1% 12.1% 4.9% (2.6)% 0.170750% . . . . . . . . . . . . . . . . . . . 18.7% 11.7% 4.5% (3.0)% 2.860375% . . . . . . . . . . . . . . . . . . . 1.7% (4.8)% (11.5)% (18.4)% 5.550000% and above . . . . . . . . . . ** ** ** **
* The price does not include accrued interest. Accrued interest has been added to the price in calculat-ing the yields set forth in the table.
** Indicates that investors will suffer a loss of virtually all of their investment.
S-57

Sensitivity of Class NE to Prepayments Assumed Price 18.75%*
PSA Prepayment Assumption Rates
LIBOR 100% 200% 300% 400%
0.100000% . . . . . . . . . . . . . . . . . . . 19.1% 12.2% 4.9% (2.6)% 0.170750% . . . . . . . . . . . . . . . . . . . 18.7% 11.7% 4.5% (3.0)% 2.860375% . . . . . . . . . . . . . . . . . . . 1.7% (4.7)% (11.4)% (18.4)% 5.550000% and above . . . . . . . . . . ** ** ** **
Sensitivity of Class NF to Prepayments Assumed Price 21.25%*
PSA Prepayment Assumption Rates
LIBOR 100% 200% 300% 400%
0.100000% . . . . . . . . . . . . . . . . . . . 20.0% 12.9% 5.7% (1.8)% 0.170750% . . . . . . . . . . . . . . . . . . . 19.6% 12.6% 5.3% (2.2)% 3.305375% . . . . . . . . . . . . . . . . . . . 2.2% (4.3)% (11.0)% (18.0)% 6.440000% and above . . . . . . . . . . ** ** ** **
Sensitivity of Class NG to Prepayments Assumed Price 21.25%*
PSA Prepayment Assumption Rates
LIBOR 100% 200% 300% 400%
0.100000% . . . . . . . . . . . . . . . . . . . 20.0% 13.0% 5.8% (1.8)% 0.170750% . . . . . . . . . . . . . . . . . . . 19.7% 12.7% 5.4% (2.1)% 3.305375% . . . . . . . . . . . . . . . . . . . 2.3% (4.2)% (10.9)% (17.9)% 6.440000% and above . . . . . . . . . . ** ** ** **
Sensitivity of Class NH to Prepayments Assumed Price 21.25%*
PSA Prepayment Assumption Rates
LIBOR 100% 200% 300% 400%
0.100000% . . . . . . . . . . . . . . . . . . . 20.0% 13.0% 5.7% (1.8)% 0.170750% . . . . . . . . . . . . . . . . . . . 19.6% 12.6% 5.4% (2.2)% 3.305375% . . . . . . . . . . . . . . . . . . . 2.2% (4.3)% (11.0)% (18.0)% 6.440000% and above . . . . . . . . . . ** ** ** **
* The price does not include accrued interest. Accrued interest has been added to the price in calculat-ing the yields set forth in the table.
** Indicates that investors will suffer a loss of virtually all of their investment.
S-58

Sensitivity of Class NI to Prepayments Assumed Price 21.25%*
PSA Prepayment Assumption Rates
LIBOR 100% 200% 300% 400%
0.100000% . . . . . . . . . . . . . . . . . . . 20.0% 13.0% 5.8% (1.8)% 0.170750% . . . . . . . . . . . . . . . . . . . 19.6% 12.7% 5.4% (2.1)% 3.305375% . . . . . . . . . . . . . . . . . . . 2.3% (4.2)% (10.9)% (17.9)% 6.440000% and above . . . . . . . . . . ** ** ** **
Sensitivity of Class NJ to Prepayments Assumed Price 21.25%*
PSA Prepayment Assumption Rates
LIBOR 100% 200% 300% 400%
0.100000% . . . . . . . . . . . . . . . . . . . 20.3% 13.3% 6.0% (1.6)% 0.170750% . . . . . . . . . . . . . . . . . . . 19.9% 12.9% 5.6% (1.9)% 3.305375% . . . . . . . . . . . . . . . . . . . 2.6% (3.9)% (10.6)% (17.6)% 6.440000% and above . . . . . . . . . . ** ** ** **
Sensitivity of Class NK to Prepayments Assumed Price 21.25%*
PSA Prepayment Assumption Rates
LIBOR 100% 200% 300% 400%
0.100000% . . . . . . . . . . . . . . . . . . . 20.0% 13.0% 5.8% (1.8)% 0.170750% . . . . . . . . . . . . . . . . . . . 19.7% 12.7% 5.4% (2.1)% 3.305375% . . . . . . . . . . . . . . . . . . . 2.3% (4.2)% (10.9)% (17.9)% 6.440000% and above . . . . . . . . . . ** ** ** **
Sensitivity of Class NL to Prepayments Assumed Price 21.25%*
PSA Prepayment Assumption Rates
LIBOR 100% 200% 300% 400%
0.100000% . . . . . . . . . . . . . . . . . . 17.3% 7.4% (4.2)% (17.3)% 0.170750% . . . . . . . . . . . . . . . . . . 16.9% 7.0% (4.6)% (17.7)% 3.305375% . . . . . . . . . . . . . . . . . . (1.6)% (12.5)% (25.4)% (39.9)% 6.440000% and above . . . . . . . . . ** ** ** **
* The price does not include accrued interest. Accrued interest has been added to the price in calculat-ing the yields set forth in the table.
** Indicates that investors will suffer a loss of virtually all of their investment.
S-59

Sensitivity of Class SA to Prepayments Assumed Price 18.75%*
PSA Prepayment Assumption Rates
LIBOR 100% 200% 300% 400%
0.100000% . . . . . . . . . . . . . . . . . . . 19.1% 12.1% 4.9% (2.6)% 0.170750% . . . . . . . . . . . . . . . . . . . 18.7% 11.7% 4.5% (3.0)% 2.860375% . . . . . . . . . . . . . . . . . . . 1.7% (4.8)% (11.5)% (18.4)% 5.550000% and above . . . . . . . . . . ** ** ** **
Sensitivity of Class SF to Prepayments Assumed Price 21.25%*
PSA Prepayment Assumption Rates
LIBOR 100% 200% 300% 400%
0.100000% . . . . . . . . . . . . . . . . . . . 19.7% 12.4% 4.8% (3.0)% 0.170750% . . . . . . . . . . . . . . . . . . . 19.3% 12.1% 4.5% (3.3)% 3.305375% . . . . . . . . . . . . . . . . . . . 1.9% (4.9)% (11.9)% (19.1)% 6.440000% and above . . . . . . . . . . ** ** ** **
Sensitivity of Class TA to Prepayments Assumed Price 0.3793%*
PSA Prepayment Assumption Rates
LIBOR 100% 200% 300% 400%
5.55% and below . . . . . . . . . . . . . 27.6% 20.4% 12.9% 5.1% 5.66% . . . . . . . . . . . . . . . . . . . . . . (7.9)% (14.0)% (20.4)% (27.1)% 5.77% and above . . . . . . . . . . . . . ** ** ** **
Sensitivity of Class TB to Prepayments Assumed Price 0.3793%*
PSA Prepayment Assumption Rates
LIBOR 100% 200% 300% 400%
5.55% and below . . . . . . . . . . . . . . 16.1% 9.2% 2.0% (5.4)% 5.60% . . . . . . . . . . . . . . . . . . . . . . . 0.2% (6.2)% (12.8)% (19.8)% 5.65% and above . . . . . . . . . . . . . . ** ** ** **
Sensitivity of Class TC to Prepayments Assumed Price 0.3793%*
PSA Prepayment Assumption Rates
LIBOR 100% 200% 300% 400%
5.550% and below . . . . . . . . . . . . . 19.0% 12.0% 4.8% (2.7)% 5.605% . . . . . . . . . . . . . . . . . . . . . . 1.9% (4.6)% (11.3)% (18.3)% 5.660% and above . . . . . . . . . . . . . ** ** ** **
* The price does not include accrued interest. Accrued interest has been added to the price in calculat-ing the yields set forth in the table.
** Indicates that investors will suffer a loss of virtually all of their investment.
S-60

Sensitivity of Class TD to Prepayments Assumed Price 0.3793%*
PSA Prepayment Assumption Rates
LIBOR 100% 200% 300% 400%
5.55% and below . . . . . . . . . . . . . . . 22.1% 15.0% 7.7% 0.1% 5.61% . . . . . . . . . . . . . . . . . . . . . . . . 3.6% (2.9)% (9.7)% (16.7)% 5.67% and above . . . . . . . . . . . . . . . ** ** ** **
Sensitivity of Class TE to Prepayments Assumed Price 0.3793%*
PSA Prepayment Assumption Rates
LIBOR 100% 200% 300% 400%
5.55% and below . . . . . . . . . . . . . . . . . 53.2% 45.3% 37.1% 28.5% 5.66% . . . . . . . . . . . . . . . . . . . . . . . . . . 19.6% 12.6% 5.4% (2.1)% 5.77% and above . . . . . . . . . . . . . . . . . ** ** ** **
Sensitivity of Class TF to Prepayments Assumed Price 0.3793%*
PSA Prepayment Assumption Rates
LIBOR 100% 200% 300% 400%
6.440% and below . . . . . . . . . . . 19.9% 11.9% 3.5% (5.3)% 6.595% . . . . . . . . . . . . . . . . . . . . (10.8)% (20.2)% (29.3)% (37.4)% 6.750% and above . . . . . . . . . . . ** ** ** **
Sensitivity of Class TG to Prepayments Assumed Price 0.04%*
PSA Prepayment Assumption Rates
LIBOR 100% 200% 300% 400%
6.440% and below . . . . . . . . . . . . . 14.5% 7.6% 0.5% (6.8)% 6.445% . . . . . . . . . . . . . . . . . . . . . . (0.7)% (7.1)% (13.8)% (20.6)% 6.450% and above . . . . . . . . . . . . . ** ** ** **
Sensitivity of Class TH to Prepayments Assumed Price 0.25%*
PSA Prepayment Assumption Rates
LIBOR 100% 200% 300% 400%
6.440% and below . . . . . . . . . . . . 8.5% 1.9% (5.1)% (12.2)% 6.465% . . . . . . . . . . . . . . . . . . . . . (4.4)% (10.7)% (17.2)% (24.0)% 6.490% and above . . . . . . . . . . . . ** ** ** **
* The price does not include accrued interest. Accrued interest has been added to the price in calculat-ing the yields set forth in the table.
** Indicates that investors will suffer a loss of virtually all of their investment.
S-61

Sensitivity of Class TI to Prepayments Assumed Price 0.25%*
PSA Prepayment Assumption Rates
LIBOR 100% 200% 300% 400%
6.44% and below . . . . . . . . . . . . . . 13.3% 6.5% (0.6)% (7.9)% 6.47% . . . . . . . . . . . . . . . . . . . . . . . (1.4)% (7.8)% (14.4)% (21.3)% 6.50% and above . . . . . . . . . . . . . . ** ** ** **
Sensitivity of Class TJ to Prepayments Assumed Price 0.625%*
PSA Prepayment Assumption Rates
LIBOR 100% 200% 300% 400%
6.44% and below 6.52% . . . . . . . . .6.60% and above
.
.
.
. . . . . . . . . . . . .
. . . . . . . . . . . . .
. . . . . . . . . . . . .
15.4% 0.0% **
8.5% (6.4)%
**
1.4% (13.0)%
**
(6.0)% (19.9)%
**
Sensitivity of Class TK to Prepayments Assumed Price 0.71875%*
PSA Prepayment Assumption Rates
LIBOR 100% 200% 300% 400%
6.440% and below 6.545% . . . . . . . . .6.650% and above
. . . . . . . . . . . . .
. . . . . . . . . . . . .
. . . . . . . . . . . . .
19.3% 2.1% **
12.3% (4.4)%
**
5.1% (11.1)%
**
(2.4)% (18.1)%
**
Sensitivity of Class TL to Prepayments Assumed Price 0.746%*
PSA Prepayment Assumption Rates
LIBOR
6.440% and below . . . . . . . . . . . . . 6.595% . . . . . . . . . . . . . . . . . . . . . . 6.750% and above . . . . . . . . . . . . .
100%
31.2% 6.6% **
200%
21.5% (3.8)%
**
300%
10.4% (16.0)%
**
400%
(2.2)% (29.8)%
**
SECURITY GROUP 7
Sensitivity of Class KI to Prepayments Assumed Price 5.25%*
430%
61.6%
PSA Prepayment Assumption Rates
475% 550% 1,000%
61.6% 61.6% 45.5%
1,999%
0.3%
* The price does not include accrued interest. Accrued interest has been added to the price in calculat-ing the yields set forth in the table.
** Indicates that investors will suffer a loss of virtually all of their investment.
S-62
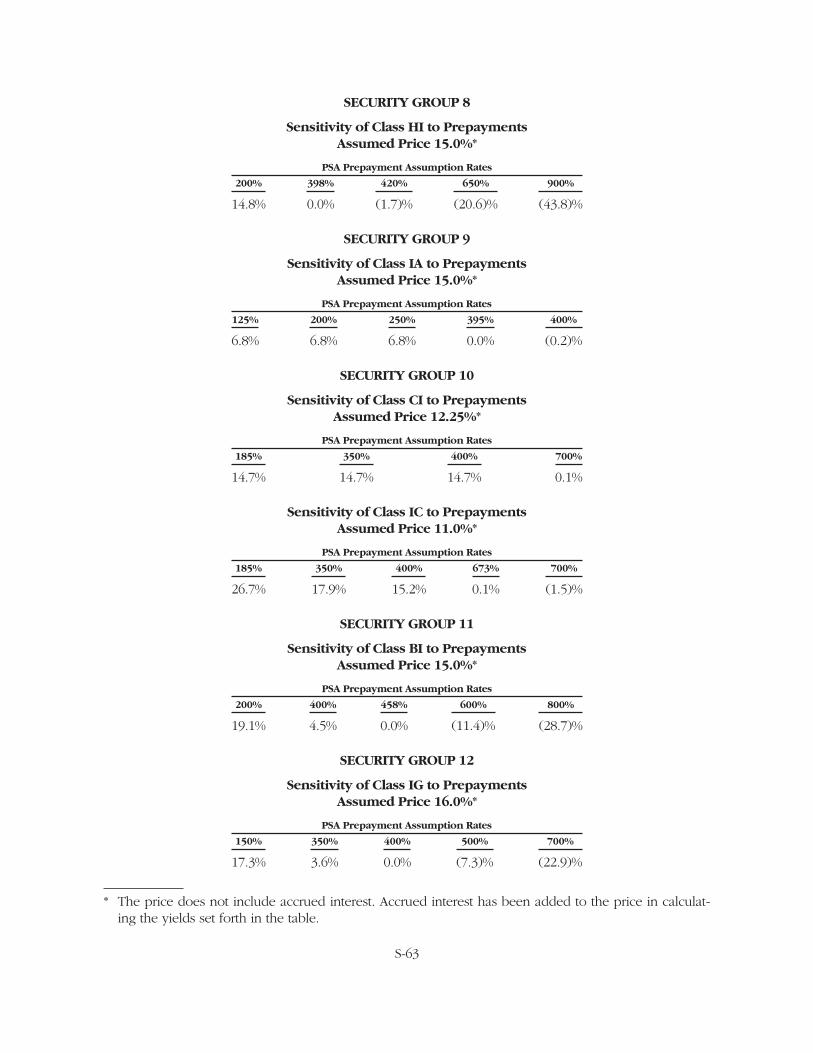
SECURITY GROUP 8
Sensitivity of Class HI to Prepayments Assumed Price 15.0%*
PSA Prepayment Assumption Rates
200% 398% 420% 650% 900%
14.8% 0.0% (1.7)% (20.6)% (43.8)%
SECURITY GROUP 9
Sensitivity of Class IA to Prepayments Assumed Price 15.0%*
PSA Prepayment Assumption Rates
125% 200% 250% 395% 400%
6.8% 6.8% 6.8% 0.0% (0.2)%
SECURITY GROUP 10
Sensitivity of Class CI to Prepayments Assumed Price 12.25%*
PSA Prepayment Assumption Rates
185% 350% 400% 700%
14.7% 14.7% 14.7% 0.1%
Sensitivity of Class IC to Prepayments Assumed Price 11.0%*
PSA Prepayment Assumption Rates
185% 350% 400% 673% 700%
26.7% 17.9% 15.2% 0.1% (1.5)%
SECURITY GROUP 11
Sensitivity of Class BI to Prepayments Assumed Price 15.0%*
PSA Prepayment Assumption Rates
200% 400% 458% 600% 800%
19.1% 4.5% 0.0% (11.4)% (28.7)%
SECURITY GROUP 12
Sensitivity of Class IG to Prepayments Assumed Price 16.0%*
PSA Prepayment Assumption Rates
150% 350% 400% 500% 700%
17.3% 3.6% 0.0% (7.3)% (22.9)%
* The price does not include accrued interest. Accrued interest has been added to the price in calculat-ing the yields set forth in the table.
S-63

SECURITY GROUP 13
Sensitivity of Class N to Prepayments Assumed Price 23.4558%*
PSA Prepayment Assumption Rates
LIBOR 100% 200% 300% 400%
0.100000% . . . . . . . . . . . . . . . . . . . 17.5% 10.6% 3.4% (4.0)% 0.170750% . . . . . . . . . . . . . . . . . . . 17.2% 10.3% 3.1% (4.4)% 3.385375% . . . . . . . . . . . . . . . . . . . 0.9% (5.6)% (12.2)% (19.2)% 6.600000% and above . . . . . . . . . . ** ** ** **
Sensitivity of Class NM to Prepayments Assumed Price 23.4558%*
PSA Prepayment Assumption Rates
LIBOR 100% 200% 300% 400%
0.100000% . . . . . . . . . . . . . . . . . . . 17.5% 10.6% 3.4% (4.1)% 0.170750% . . . . . . . . . . . . . . . . . . . 17.2% 10.3% 3.1% (4.4)% 3.385375% . . . . . . . . . . . . . . . . . . . 0.9% (5.6)% (12.2)% (19.2)% 6.600000% and above . . . . . . . . . . ** ** ** **
Sensitivity of Class NP to Prepayments Assumed Price 23.4558%*
PSA Prepayment Assumption Rates
LIBOR 100% 200% 300% 400%
0.100000% . . . . . . . . . . . . . . . . . . . 17.7% 10.8% 3.6% (3.8)% 0.170750% . . . . . . . . . . . . . . . . . . . 17.4% 10.5% 3.3% (4.2)% 3.385375% . . . . . . . . . . . . . . . . . . . 1.2% (5.2)% (11.9)% (18.9)% 6.600000% and above . . . . . . . . . . ** ** ** **
Sensitivity of Class NQ to Prepayments Assumed Price 23.4558%*
PSA Prepayment Assumption Rates
LIBOR 100% 200% 300% 400%
0.100000% . . . . . . . . . . . . . . . . . . . 17.9% 11.0% 3.8% (3.7)% 0.170750% . . . . . . . . . . . . . . . . . . . 17.6% 10.6% 3.4% (4.0)% 3.385375% . . . . . . . . . . . . . . . . . . . 1.4% (5.0)% (11.7)% (18.7)% 6.600000% and above . . . . . . . . . . ** ** ** **
* The price does not include accrued interest. Accrued interest has been added to the price in calculat-ing the yields set forth in the table.
** Indicates that investors will suffer a loss of virtually all of their investment.
S-64

Sensitivity of Class SM to Prepayments Assumed Price 23.4558%*
PSA Prepayment Assumption Rates
LIBOR 100% 200% 300% 400%
0.100000% . . . . . . . . . . . . . . . . . . . 17.8% 10.8% 3.6% (3.8)% 0.170750% . . . . . . . . . . . . . . . . . . . 17.4% 10.5% 3.3% (4.2)% 3.385375% . . . . . . . . . . . . . . . . . . . 1.2% (5.2)% (11.9)% (18.9)% 6.600000% and above . . . . . . . . . . ** ** ** **
Sensitivity of Class TM to Prepayments Assumed Price 0.25%*
PSA Prepayment Assumption Rates
LIBOR 100% 200% 300% 400%
6.60% and below . . . . . . . . . . . . 14.4% 7.6% 0.5% (6.9)% 6.65% . . . . . . . . . . . . . . . . . . . . . (11.5)% (17.5)% (23.8)% (30.3)% 6.70% and above . . . . . . . . . . . . ** ** ** **
Sensitivity of Class TN to Prepayments Assumed Price 0.09375%*
PSA Prepayment Assumption Rates
LIBOR 100% 200% 300% 400%
6.60% and below . . . . . . . . . . . . . . 10.1% 3.4% (3.6)% (10.8)% 6.61% . . . . . . . . . . . . . . . . . . . . . . . (3.3)% (9.6)% (16.2)% (23.0)% 6.62% and above . . . . . . . . . . . . . . ** ** ** **
Sensitivity of Class TP to Prepayments Assumed Price 0.25%*
PSA Prepayment Assumption Rates
LIBOR 100% 200% 300% 400%
6.600% and below . . . . . . . . . . . . 8.8% 2.1% (4.8)% (12.0)% 6.625% . . . . . . . . . . . . . . . . . . . . . (3.9)% (10.2)% (16.8)% (23.5)% 6.650% and above . . . . . . . . . . . . ** ** ** **
Sensitivity of Class TQ to Prepayments Assumed Price 0.277%*
PSA Prepayment Assumption Rates
LIBOR 100% 200% 300% 400%
6.60% and below . . . . . . . . . . . . . . . 27.5% 20.3% 12.8% 5.0% 6.65% . . . . . . . . . . . . . . . . . . . . . . . . . 6.9% 0.3% (6.6)% (13.7)% 6.70% and above . . . . . . . . . . . . . . . ** ** ** **
* The price does not include accrued interest. Accrued interest has been added to the price in calculat-ing the yields set forth in the table.
** Indicates that investors will suffer a loss of virtually all of their investment.
S-65

SECURITY GROUP 14
Sensitivity of Class NS to Prepayments Assumed Price 24.1512%*
PSA Prepayment Assumption Rates
LIBOR 100% 200% 300% 400%
0.100000% . . . . . . . . . . . . . . . . . . . 14.4% 7.5% 0.4% (7.0)% 0.182130% . . . . . . . . . . . . . . . . . . . 14.0% 7.1% 0.0% (7.4)% 3.141065% . . . . . . . . . . . . . . . . . . . (0.8)% (7.2)% (13.9)% (20.7)% 6.100000% and above . . . . . . . . . . ** ** ** **
Sensitivity of Class NT to Prepayments Assumed Price 24.1512%*
PSA Prepayment Assumption Rates
LIBOR 100% 200% 300% 400%
0.100000% . . . . . . . . . . . . . . . . . . . . 20.7% 15.6% 8.6% 2.0% 0.182130% . . . . . . . . . . . . . . . . . . . . 20.3% 15.2% 8.2% 1.6% 3.141065% . . . . . . . . . . . . . . . . . . . . 5.1% (0.4)% (7.0)% (13.4)% 6.100000% and above . . . . . . . . . . . ** ** ** **
Sensitivity of Class NU to Prepayments Assumed Price 24.1512%*
PSA Prepayment Assumption Rates
LIBOR 100% 200% 300% 400%
0.100000% . . . . . . . . . . . . . . . . . . . 14.2% 7.3% 0.2% (7.2)% 0.182130% . . . . . . . . . . . . . . . . . . . 13.8% 6.9% (0.2)% (7.5)% 3.141065% . . . . . . . . . . . . . . . . . . . (1.1)% (7.5)% (14.1)% (21.0)% 6.100000% and above . . . . . . . . . . ** ** ** **
Sensitivity of Class ST to Prepayments Assumed Price 24.1512%*
PSA Prepayment Assumption Rates
LIBOR 100% 200% 300% 400%
0.100000% . . . . . . . . . . . . . . . . . . . 16.7% 10.4% 3.4% (3.7)% 0.182130% . . . . . . . . . . . . . . . . . . . 16.3% 10.0% 3.0% (4.0)% 3.141065% . . . . . . . . . . . . . . . . . . . 1.4% (4.7)% (11.3)% (18.0)% 6.100000% and above . . . . . . . . . . ** ** ** **
* The price does not include accrued interest. Accrued interest has been added to the price in calculat-ing the yields set forth in the table.
** Indicates that investors will suffer a loss of virtually all of their investment.
S-66

Sensitivity of Class T to Prepayments Assumed Price 0.375%*
PSA Prepayment Assumption Rates
LIBOR 100% 200% 300% 400%
6.100% and below . . . . . . . . . . . . . 6.5% 1.0% (5.6)% (12.0)% 6.125% . . . . . . . . . . . . . . . . . . . . . . (3.7)% (9.5)% (15.8)% (22.1)% 6.150% and above . . . . . . . . . . . . . ** ** ** **
Sensitivity of Class TS to Prepayments Assumed Price 0.375%*
PSA Prepayment Assumption Rates
LIBOR 100% 200% 300% 400%
6.10% and below . . . . . . . . . . . . 10.7% 4.6% (2.3)% (9.1)% 6.15% . . . . . . . . . . . . . . . . . . . . . (10.4)% (16.6)% (22.9)% (29.4)% 6.20% and above . . . . . . . . . . . . ** ** ** **
Sensitivity of Class TU to Prepayments Assumed Price 0.375%*
PSA Prepayment Assumption Rates
LIBOR 100% 200% 300% 400%
6.10% and below . . . . . . . . . . . . . . 16.3% 9.3% 2.2% (5.3)% 6.15% . . . . . . . . . . . . . . . . . . . . . . . 0.4% (6.1)% (12.8)% (19.7)% 6.20% and above . . . . . . . . . . . . . . ** ** ** **
SECURITY GROUP 15
Sensitivity of Class SU to Prepayments Assumed Price 18.7397%*
PSA Prepayment Assumption Rates
LIBOR 100% 200% 300% 400%
0.100000% . . . . . . . . . . . . . . . . . . . 19.3% 12.3% 5.0% (2.5)% 0.182130% . . . . . . . . . . . . . . . . . . . 18.8% 11.8% 4.5% (3.0)% 2.891065% . . . . . . . . . . . . . . . . . . . 1.6% (4.9)% (11.6)% (18.6)% 5.600000% and above . . . . . . . . . . ** ** ** **
* The price does not include accrued interest. Accrued interest has been added to the price in calculat-ing the yields set forth in the table.
** Indicates that investors will suffer a loss of virtually all of their investment.
S-67

SECURITY GROUP 16
Sensitivity of Class CN to Prepayments Assumed Price 15.0633%*
PSA Prepayment Assumption Rates
LIBOR 100% 200% 300% 400%
0.100000% . . . . . . . . . . . . . . . . . . . . . . 33.2% 25.9% 18.2% 10.3% 0.170750% . . . . . . . . . . . . . . . . . . . . . . 32.7% 25.3% 17.7% 9.8% 3.110375% . . . . . . . . . . . . . . . . . . . . . . 11.1% 4.3% (2.7)% (9.9)% 6.050000% and above . . . . . . . . . . . . . ** ** ** **
Sensitivity of Class CT to Prepayments Assumed Price 0.41%*
PSA Prepayment Assumption Rates
LIBOR 100% 200% 300% 400%
6.05% and below . . . . . . . . . . . . . . . . . 44.1% 36.4% 28.4% 20.2% 6.15% . . . . . . . . . . . . . . . . . . . . . . . . . . 16.6% 9.7% 2.6% (4.9)% 6.25% and above . . . . . . . . . . . . . . . . . ** ** ** **
Sensitivity of Class NV to Prepayments Assumed Price 15.0633%*
PSA Prepayment Assumption Rates
LIBOR 100% 200% 300% 400%
0.100000% . . . . . . . . . . . . . . . . . . . . . . 34.2% 27.8% 22.2% 15.7% 0.170750% . . . . . . . . . . . . . . . . . . . . . . 33.7% 27.2% 21.7% 15.2% 3.110375% . . . . . . . . . . . . . . . . . . . . . . 11.5% 5.1% (0.3)% (6.9)% 6.050000% and above . . . . . . . . . . . . . ** ** ** **
Sensitivity of Class NW to Prepayments Assumed Price 15.0633%*
PSA Prepayment Assumption Rates
LIBOR 100% 200% 300% 400%
0.100000% . . . . . . . . . . . . . . . . . . . . . . 34.1% 27.4% 20.4% 13.3% 0.170750% . . . . . . . . . . . . . . . . . . . . . . 33.5% 26.8% 19.9% 12.8% 3.110375% . . . . . . . . . . . . . . . . . . . . . . 11.6% 5.2% (1.4)% (8.2)% 6.050000% and above . . . . . . . . . . . . . ** ** ** **
* The price does not include accrued interest. Accrued interest has been added to the price in calculat-ing the yields set forth in the table.
** Indicates that investors will suffer a loss of virtually all of their investment.
S-68

Sensitivity of Class NX to Prepayments Assumed Price 15.0633%*
PSA Prepayment Assumption Rates
LIBOR 100% 200% 300% 400%
0.100000% . . . . . . . . . . . . . . . . . . . . . . 33.6% 26.5% 19.2% 11.5% 0.170750% . . . . . . . . . . . . . . . . . . . . . . 33.1% 26.0% 18.6% 11.1% 3.110375% . . . . . . . . . . . . . . . . . . . . . . 11.3% 4.7% (2.1)% (9.2)% 6.050000% and above . . . . . . . . . . . . . ** ** ** **
Sensitivity of Class NY to Prepayments Assumed Price 15.0633%*
PSA Prepayment Assumption Rates
LIBOR 100% 200% 300% 400%
0.100000% . . . . . . . . . . . . . . . . . . . . . . 33.5% 26.3% 18.9% 11.2% 0.170750% . . . . . . . . . . . . . . . . . . . . . . 33.0% 25.8% 18.4% 10.7% 3.110375% . . . . . . . . . . . . . . . . . . . . . . 11.3% 4.6% (2.3)% (9.4)% 6.050000% and above . . . . . . . . . . . . . ** ** ** **
Sensitivity of Class SW to Prepayments Assumed Price 15.0633%*
PSA Prepayment Assumption Rates
LIBOR 100% 200% 300% 400%
0.100000% . . . . . . . . . . . . . . . . . . . . . . 33.9% 27.1% 20.3% 13.1% 0.170750% . . . . . . . . . . . . . . . . . . . . . . 33.4% 26.6% 19.8% 12.6% 3.110375% . . . . . . . . . . . . . . . . . . . . . . 11.5% 5.0% (1.5)% (8.4)% 6.050000% and above . . . . . . . . . . . . . ** ** ** **
Sensitivity of Class TV to Prepayments Assumed Price 0.3125%*
PSA Prepayment Assumption Rates
LIBOR 100% 200% 300% 400%
6.050% and below . . . . . . . . . . . . . 7.2% 0.8% (4.6)% (11.1)% 6.075% . . . . . . . . . . . . . . . . . . . . . . (2.8)% (9.0)% (14.3)% (20.8)% 6.100% and above . . . . . . . . . . . . . ** ** ** **
Sensitivity of Class TW to Prepayments Assumed Price 0.3438%*
PSA Prepayment Assumption Rates
LIBOR 100% 200% 300% 400%
6.05% and below . . . . . . . . . . . . . . 24.8% 17.9% 11.0% 3.7% 6.15% . . . . . . . . . . . . . . . . . . . . . . . (2.5)% (8.8)% (15.3)% (22.1)% 6.25% and above . . . . . . . . . . . . . . ** ** ** **
* The price does not include accrued interest. Accrued interest has been added to the price in calculat-ing the yields set forth in the table.
** Indicates that investors will suffer a loss of virtually all of their investment.
S-69

Sensitivity of Class TX to Prepayments Assumed Price 0.359375%*
PSA Prepayment Assumption Rates
LIBOR 100% 200% 300% 400%
6.05% and below 6.10% . . . . . . . . .6.15% and above
. . . . . . . . . . . . . . .
. . . . . . . . . . . . . . .
. . . . . . . . . . . . . . .
20.4% 4.8% **
13.5% (1.7)%
**
6.5% (8.3)%
**
(0.8)% (15.3)%
**
Sensitivity of Class TY to Prepayments Assumed Price 0.359375%*
PSA Prepayment Assumption Rates
LIBOR 100% 200% 300% 400%
6.050% and below . . . . . . . . . . . . . . . 36.1% 28.9% 21.4% 13.6% 6.125% . . . . . . . . . . . . . . . . . . . . . . . . . 12.8% 6.1% (0.8)% (8.0)% 6.200% and above . . . . . . . . . . . . . . . ** ** ** **
SECURITY GROUP 17
Sensitivity of Class SH to Prepayments Assumed Price 20.0%*
PSA Prepayment Assumption Rates
LIBOR
0.100% . . . . . . . . . . . . . . . . . . . . . 0.200% . . . . . . . . . . . . . . . . . . . . . 3.125% . . . . . . . . . . . . . . . . . . . . . 6.050% and above . . . . . . . . . . . .
300%
13.6% 13.0% (4.5)%
**
614%
(3.5)% (4.2)%
(23.3)% **
950%
(22.9)% (23.7)% (45.3)%
**
1,300%
(44.3)% (45.1)% (70.3)%
**
SECURITY GROUP 18
Sensitivity of Class AI to Prepayments Assumed Price 16.25%*
150%
PSA Prepayment Assumption Rates
260% 349% 450% 600%
14.4% 6.6% 0.0% (7.6)% (19.7)%
Sensitivity of Class AO to Prepayments Assumed Price 99.4375%
PSA Prepayment Assumption Rates
150% 260% 450% 600%
1.4% 2.3% 3.7% 4.8%
* The price does not include accrued interest. Accrued interest has been added to the price in calculat-ing the yields set forth in the table.
** Indicates that investors will suffer a loss of virtually all of their investment.
S-70

Sensitivity of Class AY to Prepayments Assumed Price 0.78125%*
PSA Prepayment Assumption Rates
150% 260% 264% 450% 600%
256.9% 6.5% 0.4% ** **
Sensitivity of Class EI to Prepayments Assumed Price 17.5%*
PSA Prepayment Assumption Rates
150%
14.4%
260%
6.7%
351%
0.0%
450%
(7.5)%
600%
(19.5)%
Sensitivity of Class FI to Prepayments Assumed Price 16.25%*
150%
13.9%
PSA Prepayment Assumption Rates
260% 343% 450%
6.1% 0.0% (8.1)%
600%
(20.1)%
Sensitivity of Class IE to Prepayments Assumed Price 16.25%*
150%
13.8%
PSA Prepayment Assumption Rates
260% 341% 450%
6.0% 0.1% (8.2)%
600%
(20.2)%
Sensitivity of Class IF to Prepayments Assumed Price 16.25%*
150%
13.9%
PSA Prepayment Assumption Rates
260% 343% 450%
6.1% 0.0% (8.1)%
600%
(20.1)%
Sensitivity of Class IH to Prepayments Assumed Price 16.25%*
PSA Prepayment Assumption Rates
150% 260% 344% 450% 600%
14.0% 6.2% 0.0% (8.0)% (20.0)%
* The price does not include accrued interest. Accrued interest has been added to the price in calculat-ing the yields set forth in the table.
** Indicates that investors will suffer a loss of virtually all of their investment.
S-71

Sensitivity of Class IO to Prepayments Assumed Price 16.25%*
PSA Prepayment Assumption Rates
150%
14.0%
260%
6.2%
344%
0.0%
450%
(8.0)%
600%
(20.0)%
Sensitivity of Class XI to Prepayments Assumed Price 3.75%*
150%
68.6%
PSA Prepayment Assumption Rates
260% 270% 450%
5.8% 0.0% (92.5)%
600%
**
Sensitivity of Class YI to Prepayments Assumed Price 19.0%*
150%
16.4%
PSA Prepayment Assumption Rates
260% 392% 450%
9.4% 0.1% (4.3)%
600%
(16.2)%
SECURITY GROUP 20
Sensitivity of Class IQ to Prepayments Assumed Price 5.9375%*
125%
36.3%
PSA Prepayment Assumption Rates
182% 450% 500%
33.7% 21.2% 18.9%
891%
0.0%
Sensitivity of Class QI to Prepayments Assumed Price 6.5%*
125%
22.7%
PSA Prepayment Assumption Rates
182% 450% 500%
22.7% 22.7% 21.5%
1,037%
0.0%
SECURITY GROUP 21
Sensitivity of Class IY to Prepayments Assumed Price 13.0285%*
100%
23.4%
PSA Prepayment Assumption Rates
175% 300% 400%
18.9% 11.5% 5.0%
475%
0.0%
* The price does not include accrued interest. Accrued interest has been added to the price in calculat-ing the yields set forth in the table.
** Indicates that investors will suffer a loss of virtually all of their investment.
S-72

SECURITY GROUP 22
Sensitivity of Class IW to Prepayments Assumed Price 19.2715%*
PSA Prepayment Assumption Rates
LIBOR 100% 175% 300% 400%
0.100000% . . . . . . . . . . . . . . . . . . . 17.9% 12.6% 3.5% (4.1)% 0.182130% . . . . . . . . . . . . . . . . . . . 17.7% 12.4% 3.3% (4.3)% 3.191065% . . . . . . . . . . . . . . . . . . . 10.1% 5.0% (3.8)% (11.2)% 6.200000% and above . . . . . . . . . . 2.5% (2.5)% (11.2)% (18.3)%
SECURITY GROUP 23
Sensitivity of Class IK to Prepayments Assumed Price 10.5%*
PSA Prepayment Assumption Rates
440% 500% 550% 668% 1,000%
5.7% 5.7% 5.7% 0.0% (17.9)%
Sensitivity of Class IU to Prepayments Assumed Price 9.125%*
PSA Prepayment Assumption Rates
440% 500% 550% 648% 1,000%
5.4% 5.4% 5.4% 0.0% (21.0)%
Sensitivity of Class UI to Prepayments Assumed Price 8.0%*
PSA Prepayment Assumption Rates
440% 500% 550% 646% 1,000%
5.5% 5.5% 5.5% 0.0% (21.6)%
SECURITY GROUP 24
Sensitivity of Class ID to Prepayments Assumed Price 4.9772%*
PSA Prepayment Assumption Rates
100% 182% 300% 400% 1,131%
46.9% 43.3% 38.1% 33.6% 0.0%
* The price does not include accrued interest. Accrued interest has been added to the price in calculat-ing the yields set forth in the table.
S-73

SECURITY GROUP 25
Sensitivity of Class IB to Prepayments Assumed Price 9.75%*
PSA Prepayment Assumption Rates
300% 513% 566% 900% 1,200%
25.5% 0.0% (7.2)% (58.1)% **
* The price does not include accrued interest. Accrued interest has been added to the price in calculat-ing the yields set forth in the table.
** Indicates that investors will suffer a loss of virtually all of their investment.
CERTAIN UNITED STATES FEDERAL INCOME TAX CONSEQUENCES
The following tax discussion, when read in conjunction with the discussion of “Certain United States Federal Income Tax Consequences” in the Base Offering Circular, describes the material United States federal income tax considerations for investors in the Securities. However, these two tax dis-cussions do not purport to deal with all United States federal tax consequences applicable to all catego-ries of investors, some of which may be subject to special rules.
REMIC Elections
In the opinion of K&L Gates LLP, the Trust will constitute a Double REMIC Series for United States federal income tax purposes. Separate REMIC elections will be made for the Pooling REMIC and the Issuing REMIC.
Regular Securities
The Regular Securities will be treated as debt instruments issued by the Issuing REMIC for United States federal income tax purposes. Income on the Regular Securities must be reported under an accrual method of accounting.
The Notional and Accrual Classes of Regular Securities will be issued with original issue discount (“OID”), and certain other Classes of Regular Securities may be issued with OID. See “Certain United States Federal Income Tax Consequences — Tax Treatment of Regular Securities — Original Issue Discount,” “— Variable Rate Securities” and “— Interest Weighted Securities and Non-VRDI Securities” in the Base Offering Circular.
The prepayment assumption that should be used in determining the rates of accrual of OID, if any, on the Regular Securities is 182% PSA in the case of the Group 1, 20 and 24 Securities, 178% PSA in the case of the Group 2 Securities, 200% PSA in the case of the Group 3, 6, 9, 13, 14, 15 and 16 Securities, 539% PSA in the case of the Group 4 Securities, 578% PSA in the case of the Group 5 Securities, 475% PSA in the case of the Group 7 Securities, 420% PSA in the case of the Group 8 Securities, 350% PSA in the case of the Group 10 and 12 Securities, 400% PSA in the case of the Group 11 Securities, 614% PSA in the case of the Group 17 Securities, 260% PSA in the case of the Group 18 Securities, 150% PSA in the case of the Group 19 Securities, 175% PSA in the case of the Group 21 and 22 Securities, 500% PSA in the case of the Group 23 Securities and 566% PSA in the case of the Group 25 Securities (as described in “Yield, Maturity and Prepayment Considerations” in this Supplement). In the case of the Floating Rate and Inverse Floating Rate Classes, the interest rate values to be used for these determinations are the initial Interest Rates as set forth in the Terms Sheet under “Interest Rates.” No representation is made,
S-74

however, about the rate at which prepayments on the Mortgage Loans underlying any Group of Trust Assets actually will occur or the level of LIBOR at any time after the date of this Supplement. See “Certain United States Federal Income Tax Consequences” in the Base Offering Circular.
The Regular Securities generally will be treated as “regular interests” in a REMIC for domestic build-ing and loan associations and “real estate assets” for real estate investment trusts (“REITs”) as described in “Certain United States Federal Income Tax Consequences” in the Base Offering Circular. Similarly, interest on the Regular Securities will be considered “interest on obligations secured by mortgages on real property” for REITs as described in “Certain United States Federal Income Tax Consequences” in the Base Offering Circular.
Residual Securities
The Class RR Securities will represent the beneficial ownership of the Residual Interest in the Pooling REMIC and the beneficial ownership of the Residual Interest in the Issuing REMIC. The Residual Securities, i.e., the Class RR Securities, generally will be treated as “residual interests” in a REMIC for domestic building and loan associations and as “real estate assets” for REITs, as described in “Certain United States Federal Income Tax Consequences” in the Base Offering Circular, but will not be treated as debt for United States federal income tax purposes. Instead, the Holders of the Residual Securities will be required to report, and will be taxed on, their pro rata shares of the taxable income or loss of the Trust REMICs, and these requirements will continue until there are no outstanding regular interests in the respective Trust REMICs. Thus, Residual Holders will have taxable income attributable to the Residual Securities even though they will not receive principal or interest distributions with respect to the Residual Securities, which could result in a negative after-tax return for the Residual Holders. Even though the Holders of the Residual Securities are not entitled to any stated principal or interest pay-ments on the Residual Securities, the Trust REMICs may have substantial taxable income in certain peri-ods, and offsetting tax losses may not occur until much later periods. Accordingly, the Holders of the Residual Securities may experience substantial adverse tax timing consequences. Prospective investors are urged to consult their own tax advisors and consider the after-tax effect of ownership of the Residual Securities and the suitability of the Residual Securities to their investment objectives.
Prospective Holders of Residual Securities should be aware that, at issuance, based on the expected prices of the Regular and Residual Securities and the prepayment assumption described above, the residual interests represented by the Residual Securities will be treated as “noneconomic residual inter-ests” as that term is defined in Treasury regulations.
OID accruals on the Underlying Certificates will be computed using the same prepayment assump-tion as set forth under “Certain United States Federal Income Tax Consequences — Regular Securities” in this Supplement.
MX Securities
For a discussion of certain United States federal income tax consequences applicable to the MX Classes, see “Certain United States Federal Income Tax Consequences — Tax Treatment of MX Securities”, “— Exchanges of MX Classes and Regular Classes” and “— Taxation of Foreign Holders of REMIC Securities and MX Securities” in the Base Offering Circular.
Investors should consult their own tax advisors in determining the United States federal, state, local, foreign and any other tax consequences to them of the purchase, ownership and disposition of the Securities.
S-75

ERISA MATTERS
Ginnie Mae guarantees distributions of principal and interest with respect to the Securities. The Ginnie Mae Guaranty is supported by the full faith and credit of the United States of America. The Regu-lar and MX Securities will qualify as “guaranteed governmental mortgage pool certificates” within the meaning of a Department of Labor regulation, the effect of which is to provide that mortgage loans and participations therein underlying a “guaranteed governmental mortgage pool certificate” will not be considered assets of an employee benefit plan subject to the Employee Retirement Income Security Act of 1974, as amended (“ERISA”), or subject to Section 4975 of the Code (each, a “Plan”), solely by reason of the Plan’s purchase and holding of that certificate. Fiduciaries of any such Plans should consult with their counsel before purchasing any of the Securities.
Prospective Plan investors should consult with their advisors to determine whether the purchase, holding or resale of a Security could give rise to a transaction that is prohibited or is not otherwise permissible under either ERISA or the Code.
Governmental plans and certain church plans, while not subject to the fiduciary responsibility provi-sions of ERISA or the prohibited transaction provisions of ERISA and the Code, may nevertheless be subject to local, state or other federal laws that are substantially similar to the foregoing provisions of ERISA and the Code. Fiduciaries of any such plans should consult with their counsel before purchasing any of the Securities.
See “ERISA Considerations” in the Base Offering Circular.
The Residual Securities are not offered to, and may not be transferred to, a Plan Investor.
LEGAL INVESTMENT CONSIDERATIONS
Institutions whose investment activities are subject to legal investment laws and regulations or to review by certain regulatory authorities may be subject to restrictions on investment in the Securities. No representation is made about the proper characterization of any Class for legal investment or other purposes, or about the permissibility of the purchase by particular investors of any Class under applicable legal investment restrictions.
Investors should consult their own legal advisors regarding applicable investment restrictions and the effect of any restrictions on the liquidity of the Securities prior to investing in the Securities.
See “Legal Investment Considerations” in the Base Offering Circular.
PLAN OF DISTRIBUTION
Subject to the terms and conditions of the Sponsor Agreement, the Sponsor has agreed to purchase all of the Securities if any are sold and purchased. The Sponsor proposes to offer the Regular and MX Classes to the public from time to time for sale in negotiated transactions at varying prices to be determined at the time of sale, plus accrued interest, if any, from (1) May 1, 2020 on the Fixed Rate Classes, (2) May 16, 2020 on the Group 14 and 15 Inverse Floating Rate and Weighted Average Coupon Classes and (3) May 20, 2020 on the Group 6, 13, 16, 17 and 22 Floating Rate, Inverse Floating Rate and Weighted Average Coupon Classes. The Sponsor may effect these transactions by sales to or through certain securities dealers. These dealers may receive compensation in the form of discounts, concessions or commissions from the Sponsor and/or commissions from any purchasers for which they act as
S-76

agents. Some of the Securities may be sold through dealers in relatively small sales. In the usual case, the commission charged on a relatively small sale of securities will be a higher percentage of the sales price than that charged on a large sale of securities.
INCREASE IN SIZE
Before the Closing Date, Ginnie Mae, the Trustee and the Sponsor may agree to increase the size of this offering. In that event, the Securities will have the same characteristics as described in this Supple-ment, except that (1) the Original Class Principal Balance (or original Class Notional Balance) and (2) the Scheduled Principal Balances or Aggregate Scheduled Principal Balances of each Class receiving principal distributions or interest distributions based upon a notional balance from the same Trust Asset Group will increase by the same proportion. The Trust Agreement, the Final Data Statement, the Final Schedules and the Supplemental Statement, if any, will reflect any increase in the size of the transaction.
LEGAL MATTERS
Certain legal matters will be passed upon for Ginnie Mae by Hunton Andrews Kurth LLP, for the Trust by K&L Gates LLP, Charlotte, North Carolina, and Marcell Solomon & Associates, P.C., Bowie, Maryland, and for the Trustee by Nixon Peabody LLP.
S-77

S-I-1
Sch
edu
le I
Ava
ilab
le C
om
bin
atio
ns(
1)
RE
MIC
Sec
uri
ties
M
X S
ecu
riti
es
Max
imu
mO
rigi
nal
Cla
ss
Ori
gin
al C
lass
P
rin
cip
al B
alan
ce
Pri
nci
pal
Bal
ance
Fi
nal
o
r C
lass
No
tio
nal
R
elat
ed
or
Cla
ss N
oti
on
al
Pri
nci
pal
In
tere
st
Inte
rest
C
USI
P
Dis
trib
uti
on
Cla
ss
Bal
ance
M
X C
lass
B
alan
ce(2
) T
ype(
3)
Rat
e T
ype(
3)
Nu
mb
er
Dat
e(4)
Secu
rity
Gro
up
4
Com
bina
tion
1(6)
G
T
$ 87
,710
,917
G
A
$ 87
,710
,917
PT
1.
00%
FI
X
3838
2ES6
5 M
ay 2
050
GB
87
,710
,917
PT
1.
25
FIX
38
382E
S73
May
205
0 G
C
87,7
10,9
17
PT
1.50
FI
X
3838
2ES8
1 M
ay 2
050
GD
87
,710
,917
PT
1.
75
FIX
38
382E
S99
May
205
0 G
E 87
,710
,917
PT
2.
00
FIX
38
382E
T23
M
ay 2
050
GI
70,1
68,7
33
NTL(
PT)
5.00
FI
X/I
O
3838
2ET31
M
ay 2
050
Secu
rity
Gro
up
6
Com
bina
tion
2 N
A
$ 16
,150
,012
SA
$
106,
936,
240
NTL(
SC/P
T)
(5)
INV/I
O
3838
2ET49
Ja
nuar
y 20
46
NB
9,
507,
253
NC
19
,225
,270
N
D
41,7
62,6
89
NE
20,2
91,0
16
Com
bina
tion
3 TB
$
9,50
7,25
3 TA
$
90,7
86,2
28
NTL(
SC/P
T)
(5)
WAC/I
NV/I
O
3838
2ET56
Ja
nuar
y 20
46
TC
19
,225
,270
TD
41
,762
,689
TE
20,2
91,0
16
Com
bina
tion
4 N
F $
21,9
02,9
17
SF
$ 12
4,78
2,96
9 N
TL(
SC/P
T)
(5)
INV/I
O
3838
2ET64
Ju
ly 2
043
NG
18
,236
,020
N
H
5,41
3,51
7 N
I 41
,347
,619
N
J 11
,523
,914
N
K
9,82
3,18
4 N
L 16
,535
,798

RE
MIC
Sec
uri
ties
M
X S
ecu
riti
es
S-I-2
Max
imu
mO
rigi
nal
Cla
ss
Ori
gin
al C
lass
P
rin
cip
al B
alan
ce
Pri
nci
pal
Bal
ance
Fi
nal
o
r C
lass
No
tio
nal
R
elat
ed
or
Cla
ss N
oti
on
al
Pri
nci
pal
In
tere
st
Inte
rest
C
USI
P
Dis
trib
uti
on
Cla
ss
Bal
ance
M
X C
lass
B
alan
ce(2
) T
ype(
3)
Rat
e T
ype(
3)
Nu
mb
er
Dat
e(4)
Com
bina
tion
5 TG
$
18,2
36,0
20
TF
$ 10
2,88
0,05
2 N
TL(
SC/P
T)
(5)
WAC/I
NV/I
O
3838
2ET72
Ju
ly 2
043
TH
5,
413,
517
TI
41,3
47,6
19
TJ
11,5
23,9
14
TK
9,
823,
184
TL
16,5
35,7
98
Com
bina
tion
6 TB
$
9,50
7,25
3 IT
$
193,
666,
280
NTL(
SC/P
T)
(5)
WAC/I
NV/I
O
3838
2ET80
Ja
nuar
y 20
46
TC
19
,225
,270
TD
41
,762
,689
TE
20,2
91,0
16
TG
18
,236
,020
TH
5,
413,
517
TI
41,3
47,6
19
TJ
11,5
23,9
14
TK
9,
823,
184
TL
16,5
35,7
98
Secu
rity
Gro
up
8
Com
bina
tion
7(6)
H
T
$117
,425
,131
H
A
$ 11
7,42
5,13
1 SC
/PT
1.
00%
FI
X
3838
2ET98
Ja
nuar
y 20
48
HB
11
7,42
5,13
1 SC
/PT
1.
25
FIX
38
382E
U21
Ja
nuar
y 20
48
HC
11
7,42
5,13
1 SC
/PT
1.
50
FIX
38
382E
U39
Ja
nuar
y 20
48
HD
11
7,42
5,13
1 SC
/PT
1.
75
FIX
38
382E
U47
Ja
nuar
y 20
48
HE
117,
425,
131
SC/P
T
2.00
FI
X
3838
2EU
54
Janu
ary
2048
H
G
117,
425,
131
SC/P
T
2.25
FI
X
3838
2EU
62
Janu
ary
2048
H
I 52
,188
,947
N
TL(
SC/P
T)
4.50
FI
X/I
O
3838
2EU
70
Janu
ary
2048
H
J 11
7,42
5,13
1 SC
/PT
2.
50
FIX
38
382E
U88
Ja
nuar
y 20
48

RE
MIC
Sec
uri
ties
M
X S
ecu
riti
es
S-I-3
Max
imu
mO
rigi
nal
Cla
ss
Ori
gin
al C
lass
P
rin
cip
al B
alan
ce
Pri
nci
pal
Bal
ance
Fi
nal
o
r C
lass
No
tio
nal
R
elat
ed
or
Cla
ss N
oti
on
al
Pri
nci
pal
In
tere
st
Inte
rest
C
USI
P
Dis
trib
uti
on
Cla
ss
Bal
ance
M
X C
lass
B
alan
ce(2
) T
ype(
3)
Rat
e T
ype(
3)
Nu
mb
er
Dat
e(4)
Secu
rity
Gro
up
11
Com
bina
tion
8(6)
D
$
21,3
77,2
50
BC
$
21,3
77,2
50
PT
1.00
%
FIX
38
382E
U96
M
ay 2
050
BI
17,1
01,8
00
NTL(
PT)
5.00
FI
X/I
O
3838
2EV20
M
ay 2
050
DA
21
,377
,250
PT
1.
50
FIX
38
382E
V38
M
ay 2
050
DB
21
,377
,250
PT
2.
00
FIX
38
382E
V46
M
ay 2
050
Secu
rity
Gro
up
12
Com
bina
tion
9(6)
BP
$ 20
,331
,700
BJ
$ 20
,331
,700
PT
1.
00%
FI
X
3838
2EV53
M
ay 2
050
BK
20
,331
,700
PT
1.
50
FIX
38
382E
V61
M
ay 2
050
BL
20,3
31,7
00
PT
2.00
FI
X
3838
2EV79
M
ay 2
050
IG
15,8
13,5
44
NTL(
PT)
4.50
FI
X/I
O
3838
2EV87
M
ay 2
050
Secu
rity
Gro
up
13
Com
bina
tion
10
N
$ 3,
818,
824
SM
$ 92
,821
,227
N
TL(
SC/P
T)
(5)
INV/I
O
3838
2EV95
Ju
ly 2
043
NM
9,
508,
968
NP
57,3
48,7
79
NQ
22
,144
,656
Com
bina
tion
11
TN
$
3,81
8,82
4 TM
$
83,3
12,2
59
NTL(
SC/P
T)
(5)
WAC/I
NV/I
O
3838
2EW
29
July
204
3 TP
57,3
48,7
79
TQ
22
,144
,656
Se
curi
ty G
rou
p 1
4 Com
bina
tion
12
NS
$ 17
,112
,566
ST
$
43,7
62,8
53
NTL(
SC/P
T)
(5)
INV/I
O
3838
2EW
37
Nov
embe
r 20
45
NT
14
,186
,469
N
U
12,4
63,8
18
Com
bina
tion
13
T
$ 14
,186
,469
TS
$ 26
,650
,287
N
TL(
SC/P
T)
(5)
WAC/I
NV/I
O
3838
2EW
45
Nov
embe
r 20
45
TU
12
,463
,818

RE
MIC
Sec
uri
ties
M
X S
ecu
riti
es
S-I-4
Max
imu
mO
rigi
nal
Cla
ss
Ori
gin
al C
lass
P
rin
cip
al B
alan
ce
Pri
nci
pal
Bal
ance
Fi
nal
o
r C
lass
No
tio
nal
R
elat
ed
or
Cla
ss N
oti
on
al
Pri
nci
pal
In
tere
st
Inte
rest
C
USI
P
Dis
trib
uti
on
Cla
ss
Bal
ance
M
X C
lass
B
alan
ce(2
) T
ype(
3)
Rat
e T
ype(
3)
Nu
mb
er
Dat
e(4)
Secu
rity
Gro
up
16
Com
bina
tion
14
CN
$
20,6
23,1
63
SW
$ 91
9,20
2,26
6 N
TL(
SC/P
T)
(5)
INV/I
O
3838
2EW
52
Aug
ust 20
49
NV
19
9,48
2,87
3N
W
385,
385,
353
NX
56
,133
,267
N
Y
257,
577,
610
Com
bina
tion
15
CT
$
20,6
23,1
63
TW
$
533,
816,
913
NTL(
SC/P
T)
(5)
WAC/I
NV/I
O
3838
2EW
60
Aug
ust 20
49
TV
19
9,48
2,87
3TX
56
,133
,267
TY
25
7,57
7,61
0Se
curi
ty G
rou
p 1
7 Com
bina
tion
16
FH
$ 50
,485
,118
H
M
$ 50
,485
,118
PT
6.
50%
FI
X
3838
2EW
78
May
205
0 SH
50
,485
,118
Se
curi
ty G
rou
p 1
8 Com
bina
tion
17
AI
$ 56
,339
,453
IO
$
339,
309,
261
NTL(
PT)
4.50
%
FIX/I
O
3838
2EW
86
May
205
0 FI
77
,024
,313
IE
20
,125
,430
IF
12
3,44
1,16
0IH
62
,378
,905

RE
MIC
Sec
uri
ties
M
X S
ecu
riti
es
S-I-5
Max
imu
mO
rigi
nal
Cla
ss
Ori
gin
al C
lass
P
rin
cip
al B
alan
ce
Pri
nci
pal
Bal
ance
Fi
nal
o
r C
lass
No
tio
nal
R
elat
ed
or
Cla
ss N
oti
on
al
Pri
nci
pal
In
tere
st
Inte
rest
C
USI
P
Dis
trib
uti
on
Cla
ss
Bal
ance
M
X C
lass
B
alan
ce(2
) T
ype(
3)
Rat
e T
ype(
3)
Nu
mb
er
Dat
e(4)
Com
bina
tion
18(6
) AQ
$
92,2
84,0
00
B
$1,8
83,1
87,2
51
SEQ
3.
50%
FI
X
3838
2EW
94
May
205
0 AT
26
,372
,000
EA
1,
883,
187,
251
SEQ
1.
00
FIX
38
382E
X28
M
ay 2
050
AU
13
4,79
8,00
0 EB
1,
883,
187,
251
SEQ
1.
25
FIX
38
382E
X36
M
ay 2
050
AV
72
,095
,000
EC
1,
883,
187,
251
SEQ
1.
50
FIX
38
382E
X44
M
ay 2
050
AW
51
,088
,000
ED
1,
883,
187,
251
SEQ
1.
75
FIX
38
382E
X51
M
ay 2
050
BQ
36
9,13
6,07
9 EG
1,
883,
187,
251
SEQ
2.
00
FIX
38
382E
X69
M
ay 2
050
BT
10
5,49
0,09
8 EH
1,
883,
187,
251
SEQ
2.
25
FIX
38
382E
X77
M
ay 2
050
BU
53
9,19
0,96
0 EI
1,
046,
215,
139
NTL(
SEQ
) 4.
50
FIX/I
O
3838
2EX85
M
ay 2
050
BV
28
8,37
9,04
1 EJ
1,
883,
187,
251
SEQ
2.
50
FIX
38
382E
X93
M
ay 2
050
BW
20
4,35
4,07
3 EK
1,
883,
187,
251
SEQ
2.
75
FIX
38
382E
Y27
M
ay 2
050
EL
1,88
3,18
7,25
1 SE
Q
3.00
FI
X
3838
2EY
35
May
205
0 EM
1,
569,
322,
709
SEQ
4.
00
FIX
38
382E
Y43
M
ay 2
050
EN
1,44
8,60
5,57
7 SE
Q
4.25
FI
X
3838
2EY
50
May
205
0 EP
1,
345,
133,
750
SEQ
4.
50
FIX
38
382E
Y68
M
ay 2
050
EQ
1,17
6,99
2,03
1 SE
Q
5.00
FI
X
3838
2EY
76
May
205
0 ET
1,
046,
215,
139
SEQ
5.
50
FIX
38
382E
Y84
M
ay 2
050
EU
941,
593,
625
SEQ
6.
00
FIX
38
382E
Y92
M
ay 2
050
EW
855,
994,
205
SEQ
6.
50
FIX
38
382E
Z26
M
ay 2
050

RE
MIC
Sec
uri
ties
M
X S
ecu
riti
es
S-I-6
Max
imu
mO
rigi
nal
Cla
ss
Ori
gin
al C
lass
P
rin
cip
al B
alan
ce
Pri
nci
pal
Bal
ance
Fi
nal
o
r C
lass
No
tio
nal
R
elat
ed
or
Cla
ss N
oti
on
al
Pri
nci
pal
In
tere
st
Inte
rest
C
USI
P
Dis
trib
uti
on
Cla
ss
Bal
ance
M
X C
lass
B
alan
ce(2
) T
ype(
3)
Rat
e T
ype(
3)
Nu
mb
er
Dat
e(4)
Com
bina
tion
19(6
) BQ
$3
69,1
36,0
79
YA
$1
,506
,550
,251
SE
Q
1.00
%
FIX
38
382E
Z34
M
ay 2
050
BT
10
5,49
0,09
8 Y
B
1,50
6,55
0,25
1 SE
Q
1.25
FI
X
3838
2EZ42
M
ay 2
050
BU
53
9,19
0,96
0 Y
C
1,50
6,55
0,25
1 SE
Q
1.50
FI
X
3838
2EZ59
M
ay 2
050
BV
28
8,37
9,04
1 Y
D
1,50
6,55
0,25
1 SE
Q
1.75
FI
X
3838
2EZ67
M
ay 2
050
BW
20
4,35
4,07
3 Y
E 1,
506,
550,
251
SEQ
2.
00
FIX
38
382E
Z75
M
ay 2
050
YG
1,
506,
550,
251
SEQ
2.
25
FIX
38
382E
Z83
M
ay 2
050
YH
1,
506,
550,
251
SEQ
2.
50
FIX
38
382E
Z91
M
ay 2
050
YI
836,
972,
361
NTL(
SEQ
) 4.
50
FIX/I
O
3838
2E2A
4 M
ay 2
050
YJ
1,50
6,55
0,25
1 SE
Q
2.75
FI
X
3838
2E2B
2 M
ay 2
050
YK
1,
506,
550,
251
SEQ
3.
00
FIX
38
382E
2C0
May
205
0 Y
L 1,
506,
550,
251
SEQ
3.
25
FIX
38
382E
2D8
May
205
0 Y
M
1,50
6,55
0,25
1 SE
Q
3.50
FI
X
3838
2E2E
6 M
ay 2
050
YN
1,
255,
458,
542
SEQ
4.
00
FIX
38
382E
2F3
May
205
0 Y
P 1,
158,
884,
808
SEQ
4.
25
FIX
38
382E
2G1
May
205
0 Y
Q
1,07
6,10
7,32
2 SE
Q
4.50
FI
X
3838
2E2H
9 M
ay 2
050
YT
94
1,59
3,90
6 SE
Q
5.00
FI
X
3838
2E2J
5 M
ay 2
050
YU
83
6,97
2,36
1 SE
Q
5.50
FI
X
3838
2E2K
2 M
ay 2
050
YV
75
3,27
5,12
5 SE
Q
6.00
FI
X
3838
2E2L
0 M
ay 2
050
YW
68
4,79
5,56
8 SE
Q
6.50
FI
X
3838
2E2M
8 M
ay 2
050

RE
MIC
Sec
uri
ties
M
X S
ecu
riti
es
S-I-7
Max
imu
mO
rigi
nal
Cla
ss
Ori
gin
al C
lass
P
rin
cip
al B
alan
ce
Pri
nci
pal
Bal
ance
Fi
nal
o
r C
lass
No
tio
nal
R
elat
ed
or
Cla
ss N
oti
on
al
Pri
nci
pal
In
tere
st
Inte
rest
C
USI
P
Dis
trib
uti
on
Cla
ss
Bal
ance
M
X C
lass
B
alan
ce(2
) T
ype(
3)
Rat
e T
ype(
3)
Nu
mb
er
Dat
e(4)
Com
bina
tion
20(6
) AQ
$
92,2
84,0
00
XA
$
376,
637,
000
SEQ
1.
00%
FI
X
3838
2E2N
6 N
ovem
ber 20
33
AT
26
,372
,000
XB
37
6,63
7,00
0 SE
Q
1.25
FI
X
3838
2E2P
1 N
ovem
ber 20
33
AU
13
4,79
8,00
0 XC
37
6,63
7,00
0 SE
Q
1.50
FI
X
3838
2E2Q
9 N
ovem
ber 20
33
AV
72
,095
,000
XD
37
6,63
7,00
0 SE
Q
1.75
FI
X
3838
2E2R
7 N
ovem
ber 20
33
AW
51
,088
,000
XE
376,
637,
000
SEQ
2.
00
FIX
38
382E
2S5
Nov
embe
r 20
33
XG
37
6,63
7,00
0 SE
Q
2.25
FI
X
3838
2E2T
3 N
ovem
ber 20
33
XH
37
6,63
7,00
0 SE
Q
2.50
FI
X
3838
2E2U
0 N
ovem
ber 20
33
XI
235,
398,
125
NTL(
SEQ
) 4.
00
FIX/I
O
3838
2E2V
8 N
ovem
ber 20
33
XJ
376,
637,
000
SEQ
2.
75
FIX
38
382E
2W6
Nov
embe
r 20
33
XK
37
6,63
7,00
0 SE
Q
3.00
FI
X
3838
2E2X
4 N
ovem
ber 20
33
XL
376,
637,
000
SEQ
3.
25
FIX
38
382E
2Y2
Nov
embe
r 20
33
XM
37
6,63
7,00
0 SE
Q
3.50
FI
X
3838
2E2Z
9 N
ovem
ber 20
33
XN
31
3,86
4,16
6 SE
Q
4.00
FI
X
3838
2E3A
3 N
ovem
ber 20
33
XP
289,
720,
769
SEQ
4.
25
FIX
38
382E
3B1
Nov
embe
r 20
33
XQ
26
9,02
6,42
8 SE
Q
4.50
FI
X
3838
2E3C
9 N
ovem
ber 20
33
XT
23
5,39
8,12
5 SE
Q
5.00
FI
X
3838
2E3D
7 N
ovem
ber 20
33
XU
20
9,24
2,77
7 SE
Q
5.50
FI
X
3838
2E3E
5 N
ovem
ber 20
33
XV
18
8,31
8,50
0 SE
Q
6.00
FI
X
3838
2E3F
2 N
ovem
ber 20
33
XW
17
1,19
8,63
6 SE
Q
6.50
FI
X
3838
2E3G
0 N
ovem
ber 20
33
Com
bina
tion
21(6
) AD
$
45,6
35,0
00
A
$ 18
6,24
8,00
0 SE
Q
3.50
%
FIX
38
382E
3H8
Dec
embe
r 20
25
AE
13,0
41,0
00
AO
18
6,24
8,00
0 SE
Q
0.00
PO
38
382E
3J4
Dec
embe
r 20
25
AF
66,6
58,0
00
AY
16
2,96
7,00
0 N
TL(
SEQ
) 4.
00
FIX/I
O
3838
2E3K
1 D
ecem
ber 20
25
AG
35
,651
,000
BD
18
6,24
8,00
0 SE
Q
1.00
FI
X
3838
2E3L
9 D
ecem
ber 20
25
AH
25
,263
,000
BE
186,
248,
000
SEQ
1.
50
FIX
38
382E
3M7
Dec
embe
r 20
25
BF
186,
248,
000
SEQ
2.
00
FIX
38
382E
3N5
Dec
embe
r 20
25
BG
18
6,24
8,00
0 SE
Q
2.50
FI
X
3838
2E3P
0 D
ecem
ber 20
25
BH
18
6,24
8,00
0 SE
Q
3.00
FI
X
3838
2E3Q
8 D
ecem
ber 20
25

RE
MIC
Sec
uri
ties
M
X S
ecu
riti
es
S-I-8
Max
imu
mO
rigi
nal
Cla
ss
Ori
gin
al C
lass
P
rin
cip
al B
alan
ce
Pri
nci
pal
Bal
ance
Fi
nal
o
r C
lass
No
tio
nal
R
elat
ed
or
Cla
ss N
oti
on
al
Pri
nci
pal
In
tere
st
Inte
rest
C
USI
P
Dis
trib
uti
on
Cla
ss
Bal
ance
M
X C
lass
B
alan
ce(2
) T
ype(
3)
Rat
e T
ype(
3)
Nu
mb
er
Dat
e(4)
Secu
rity
Gro
up
20
Com
bina
tion
22(6
) Q
A
$ 25
,096
,634
Q
C
$ 25
,096
,634
PA
C/A
D
0.75
%
FIX
38
382E
3R6
April 2
050
QD
25
,096
,634
PA
C/A
D
1.00
FI
X
3838
2E3S
4 April 2
050
QE
25,0
96,6
34
PAC/A
D
1.25
FI
X
3838
2E3T
2 April 2
050
QI
7,52
8,99
0 N
TL(
PAC/A
D)
2.50
FI
X/I
O
3838
2E3U
9 April 2
050
Com
bina
tion
23
QA
$
25,0
96,6
34
QB
$
25,3
88,0
40
PAC/A
D
1.50
%
FIX
38
382E
3V7
May
205
0 Q
P 29
1,40
6 Se
curi
ty G
rou
p 2
3 Com
bina
tion
24(6
) U
H
$ 37
,054
,000
U
I $
26,4
67,1
42
NTL(
PAC/A
D)
3.50
%
FIX/I
O
3838
2E3W
5 D
ecem
ber 20
46
UJ
37,0
54,0
00
PAC/A
D
3.00
FI
X
3838
2E3X
3 D
ecem
ber 20
46
UK
37
,054
,000
PA
C/A
D
2.50
FI
X
3838
2E3Y
1 D
ecem
ber 20
46
UL
37,0
54,0
00
PAC/A
D
2.00
FI
X
3838
2E3Z
8 D
ecem
ber 20
46
UM
37
,054
,000
PA
C/A
D
1.50
FI
X
3838
2E4A
2 D
ecem
ber 20
46
UN
37
,054
,000
PA
C/A
D
1.00
FI
X
3838
2E4B
0 D
ecem
ber 20
46
Com
bina
tion
25(6
) K
U
$ 5,
177,
000
IU
$ 30
,165
,000
N
TL(
PAC/A
D)
3.50
%
FIX/I
O
3838
2E4C
8 O
ctob
er 2
048
UH
37
,054
,000
U
B
42,2
31,0
00
PAC/A
D
3.00
FI
X
3838
2E4D
6 O
ctob
er 2
048
UC
42
,231
,000
PA
C/A
D
2.50
FI
X
3838
2E4E
4 O
ctob
er 2
048
UD
42
,231
,000
PA
C/A
D
2.00
FI
X
3838
2E4F
1 O
ctob
er 2
048
UE
42,2
31,0
00
PAC/A
D
1.50
FI
X
3838
2E4G
9 O
ctob
er 2
048
UG
42
,231
,000
PA
C/A
D
1.00
FI
X
3838
2E4H
7 O
ctob
er 2
048
UP
42,2
31,0
00
PAC/A
D
3.50
FI
X
3838
2E4J
3 O
ctob
er 2
048
Com
bina
tion
26(6
) K
U
$ 5,
177,
000
IK
$ 33
,487
,142
N
TL(
PAC/A
D)
3.50
%
FIX/I
O
3838
2E4K
0 M
arch
205
0 K
W
4,65
1,00
0 K
E 46
,882
,000
PA
C/A
D
3.50
FI
X
3838
2E4L
8 M
arch
205
0 U
H
37,0
54,0
00
KG
46
,882
,000
PA
C/A
D
3.00
FI
X
3838
2E4M
6 M
arch
205
0 K
H
46,8
82,0
00
PAC/A
D
2.50
FI
X
3838
2E4N
4 M
arch
205
0 K
J 46
,882
,000
PA
C/A
D
2.00
FI
X
3838
2E4P
9 M
arch
205
0 K
L 46
,882
,000
PA
C/A
D
1.50
FI
X
3838
2E4Q
7 M
arch
205
0 K
M
46,8
82,0
00
PAC/A
D
1.00
FI
X
3838
2E4R
5 M
arch
205
0

(1)
All
exch
ange
s m
ust co
mply
with
min
imum
den
omin
atio
n re
strict
ions
. (2
) The
am
ount
sho
wn
for
each
MX
Cla
ss r
epre
sent
s th
e m
axim
um O
rigi
nal Cla
ss P
rinc
ipal
Bal
ance
(or
origi
nal Cla
ss N
otio
nal Bal
ance
) of
th
at C
lass
, ass
umin
g it
wer
e to
be
issu
ed o
n th
e Clo
sing
Dat
e.
(3)
As
defin
ed u
nder
“Cla
ss T
ypes
” in
Appen
dix
I to
the
Bas
e O
ffer
ing
Circu
lar.
(4
) Se
e “Y
ield
, Matu
rity
an
d P
repa
ymen
t Con
sider
ation
s —
Fin
al D
istr
ibu
tion
Date
” in
this
Su
pple
men
t. (5
) The
Int
eres
t Rat
e w
ill b
e ca
lcul
ated
as
desc
ribe
d un
der “T
erm
s Sh
eet —
Int
eres
t Rat
es”
in thi
s Su
pple
men
t. (6
) In
the
cas
e of
Com
bina
tions
1, 7,
8, 9,
18,
19,
20,
21,
22,
24,
25
and
26, va
riou
s su
bcom
bina
tions
are
per
mitt
ed.
See
“Des
crip
tion
of
the
Secu
rities
— M
odif
ication
an
d E
xcha
nge
” in
the
Base
Off
erin
g C
ircu
lar
for
a d
iscu
ssio
n o
f su
bcom
bin
ation
s.
S-I-9

Schedule II
SCHEDULED PRINCIPAL BALANCES
Classes KA, KC, Classes CA, Classes AB and AC KY, UA and ZK CD and CW
Distribution Date (in the aggregate) (in the aggregate) Class AP (in the aggregate)
Initial Balance . . . . . . . . . . . . . . . . $39,221,000.00 $43,825,508.00 $57,106,000.00 $26,337,000.00 June 2020 . . . . . . . . . . . . . . . . . . . 39,107,387.27 43,679,391.18 56,950,791.92 26,244,271.12 July 2020 . . . . . . . . . . . . . . . . . . . . 38,983,428.74 43,498,449.41 56,780,939.20 26,140,337.62 August 2020 . . . . . . . . . . . . . . . . . 38,849,166.10 43,282,742.41 56,596,493.61 26,025,254.77 September 2020 . . . . . . . . . . . . . . 38,704,647.95 43,032,405.32 56,397,516.29 25,899,088.49 October 2020 . . . . . . . . . . . . . . . . 38,549,929.75 42,747,649.23 56,184,077.72 25,761,915.31 November 2020 . . . . . . . . . . . . . . . 38,385,073.80 42,428,761.58 55,956,257.74 25,613,822.28 December 2020 . . . . . . . . . . . . . . . 38,210,149.18 42,076,106.20 55,714,145.43 25,454,906.98 January 2021 . . . . . . . . . . . . . . . . . 38,025,231.73 41,690,123.15 55,457,839.10 25,285,277.35 February 2021 . . . . . . . . . . . . . . . . 37,830,403.99 41,271,328.18 55,187,446.22 25,105,051.62 March 2021 . . . . . . . . . . . . . . . . . . 37,625,755.13 40,820,312.02 54,903,083.36 24,914,358.21 April 2021 . . . . . . . . . . . . . . . . . . . 37,411,380.90 40,337,739.36 54,604,876.05 24,713,335.57 May 2021 . . . . . . . . . . . . . . . . . . . . 37,187,383.51 39,824,347.45 54,292,958.76 24,502,132.01 June 2021 . . . . . . . . . . . . . . . . . . . 36,953,871.62 39,280,944.59 53,967,474.72 24,280,905.59 July 2021 . . . . . . . . . . . . . . . . . . . . 36,710,960.17 38,708,408.18 53,628,575.89 24,049,823.86 August 2021 . . . . . . . . . . . . . . . . . 36,458,770.33 38,107,682.58 53,276,422.76 23,809,063.73 September 2021 . . . . . . . . . . . . . . 36,197,429.40 37,479,776.70 52,911,184.25 23,558,811.18 October 2021 . . . . . . . . . . . . . . . . 35,927,070.64 36,825,761.28 52,533,037.58 23,299,261.09 November 2021 . . . . . . . . . . . . . . . 35,647,833.24 36,146,765.95 52,142,168.10 23,030,616.99 December 2021 . . . . . . . . . . . . . . . 35,359,862.12 35,443,976.04 51,738,769.13 22,753,090.74 January 2022 . . . . . . . . . . . . . . . . . 35,063,307.80 34,718,629.14 51,323,041.79 22,466,902.31 February 2022 . . . . . . . . . . . . . . . . 34,758,326.33 33,972,011.46 50,895,194.84 22,172,279.50 March 2022 . . . . . . . . . . . . . . . . . . 34,445,079.06 33,205,453.95 50,455,444.47 21,869,457.60 April 2022 . . . . . . . . . . . . . . . . . . . 34,123,732.55 32,420,328.29 50,004,014.12 21,558,679.07 May 2022 . . . . . . . . . . . . . . . . . . . . 33,794,458.37 31,618,042.59 49,541,134.28 21,240,193.28 June 2022 . . . . . . . . . . . . . . . . . . . 33,457,432.97 30,800,037.06 49,067,042.25 20,914,256.12 July 2022 . . . . . . . . . . . . . . . . . . . . 33,112,837.49 29,967,779.45 48,581,981.98 20,581,129.64 August 2022 . . . . . . . . . . . . . . . . . 32,760,857.60 29,122,760.41 48,086,203.78 20,241,081.74 September 2022 . . . . . . . . . . . . . . 32,401,683.29 28,266,488.72 47,579,964.14 19,904,629.42 October 2022 . . . . . . . . . . . . . . . . 32,035,508.75 27,400,486.49 47,063,525.46 19,571,735.91 November 2022 . . . . . . . . . . . . . . . 31,671,899.28 26,556,370.83 46,537,155.82 19,242,364.82 December 2022 . . . . . . . . . . . . . . . 31,310,836.01 25,733,581.39 46,014,314.39 18,916,480.11 January 2023 . . . . . . . . . . . . . . . . . 30,952,300.21 24,931,572.01 45,494,976.18 18,594,046.12 February 2023 . . . . . . . . . . . . . . . . 30,596,273.28 24,149,810.37 44,979,116.39 18,275,027.53 March 2023 . . . . . . . . . . . . . . . . . . 30,242,736.73 23,387,777.67 44,466,710.38 17,959,389.39 April 2023 . . . . . . . . . . . . . . . . . . . 29,891,672.23 22,644,968.26 43,957,733.64 17,647,097.09 May 2023 . . . . . . . . . . . . . . . . . . . . 29,543,061.54 21,920,889.30 43,452,161.87 17,338,116.38 June 2023 . . . . . . . . . . . . . . . . . . . 29,196,886.58 21,215,060.48 42,949,970.90 17,032,413.33 July 2023 . . . . . . . . . . . . . . . . . . . . 28,853,129.37 20,527,013.66 42,451,136.73 16,729,954.37 August 2023 . . . . . . . . . . . . . . . . . 28,511,772.07 19,856,292.59 41,955,635.52 16,430,706.28 September 2023 . . . . . . . . . . . . . . 28,172,796.94 19,202,452.60 41,463,443.58 16,134,636.13 October 2023 . . . . . . . . . . . . . . . . 27,836,186.40 18,565,060.30 40,974,537.38 15,841,711.38 November 2023 . . . . . . . . . . . . . . . 27,501,922.96 17,943,693.30 40,488,893.55 15,551,899.76 December 2023 . . . . . . . . . . . . . . . 27,169,989.26 17,337,939.94 40,006,488.87 15,265,169.36
S-II-1

Classes KA, KC, Classes CA, Classes AB and AC KY, UA and ZK CD and CW
Distribution Date (in the aggregate) (in the aggregate) Class AP (in the aggregate)
January 2024 . . . . . . . . . . . . . . . . . $26,840,368.07 $16,747,399.03 $39,527,300.27 $14,981,488.57 February 2024 . . . . . . . . . . . . . . . . 26,513,042.26 16,171,679.54 39,051,304.85 14,700,826.12 March 2024 . . . . . . . . . . . . . . . . . . 26,187,994.84 15,614,508.36 38,578,479.83 14,423,151.04 April 2024 . . . . . . . . . . . . . . . . . . . 25,865,208.91 15,076,395.20 38,108,802.62 14,148,432.67 May 2024 . . . . . . . . . . . . . . . . . . . . 25,544,667.72 14,556,692.04 37,642,250.75 13,876,640.67 June 2024 . . . . . . . . . . . . . . . . . . . 25,226,354.60 14,054,772.77 37,178,801.90 13,607,744.98 July 2024 . . . . . . . . . . . . . . . . . . . . 24,910,253.04 13,570,032.48 36,718,433.92 13,341,715.87 August 2024 . . . . . . . . . . . . . . . . . 24,596,346.59 13,101,886.74 36,261,124.78 13,078,523.90 September 2024 . . . . . . . . . . . . . . 24,284,618.96 12,649,770.89 35,806,852.61 12,818,139.93 October 2024 . . . . . . . . . . . . . . . . 23,975,053.95 12,213,139.40 35,355,595.68 12,560,535.09 November 2024 . . . . . . . . . . . . . . . 23,667,635.47 11,791,465.19 34,907,332.41 12,305,680.83 December 2024 . . . . . . . . . . . . . . . 23,362,347.56 11,384,239.06 34,462,041.35 12,053,548.87 January 2025 . . . . . . . . . . . . . . . . . 23,059,174.34 10,990,969.04 34,019,701.21 11,804,111.23 February 2025 . . . . . . . . . . . . . . . . 22,758,100.07 10,611,179.82 33,580,290.83 11,557,340.19 March 2025 . . . . . . . . . . . . . . . . . . 22,459,109.10 10,244,412.20 33,143,789.18 11,313,208.33 April 2025 . . . . . . . . . . . . . . . . . . . 22,162,185.90 9,890,222.56 32,710,175.39 11,071,688.49 May 2025 . . . . . . . . . . . . . . . . . . . . 21,867,315.03 9,548,182.27 32,279,428.71 10,832,753.79 June 2025 . . . . . . . . . . . . . . . . . . . 21,574,481.19 9,217,877.28 31,851,528.54 10,596,377.63 July 2025 . . . . . . . . . . . . . . . . . . . . 21,283,669.14 8,898,907.55 31,426,454.41 10,362,533.66 August 2025 . . . . . . . . . . . . . . . . . 20,994,863.78 8,590,886.60 31,004,185.99 10,131,195.82 September 2025 . . . . . . . . . . . . . . 20,708,050.10 8,293,441.06 30,584,703.07 9,902,338.27 October 2025 . . . . . . . . . . . . . . . . 20,423,213.20 8,006,210.24 30,167,985.59 9,675,935.48 November 2025 . . . . . . . . . . . . . . . 20,140,338.28 7,728,845.66 29,754,013.63 9,451,962.15 December 2025 . . . . . . . . . . . . . . . 19,859,410.65 7,461,010.69 29,342,767.36 9,230,393.23 January 2026 . . . . . . . . . . . . . . . . . 19,580,415.70 7,202,380.09 28,934,227.13 9,011,203.94 February 2026 . . . . . . . . . . . . . . . . 19,303,338.94 6,952,639.70 28,528,373.40 8,794,369.75 March 2026 . . . . . . . . . . . . . . . . . . 19,028,165.97 6,711,485.99 28,125,186.75 8,579,866.35 April 2026 . . . . . . . . . . . . . . . . . . . 18,754,882.50 6,478,625.75 27,724,647.90 8,369,489.02 May 2026 . . . . . . . . . . . . . . . . . . . . 18,483,474.34 6,253,775.73 27,326,737.70 8,164,178.63 June 2026 . . . . . . . . . . . . . . . . . . . 18,213,927.38 6,036,662.27 26,931,437.11 7,963,814.74 July 2026 . . . . . . . . . . . . . . . . . . . . 17,946,227.63 5,827,021.05 26,538,727.24 7,768,279.73 August 2026 . . . . . . . . . . . . . . . . . 17,680,361.17 5,624,596.70 26,148,589.30 7,577,458.75 September 2026 . . . . . . . . . . . . . . 17,416,314.20 5,429,142.53 25,761,004.64 7,391,239.67 October 2026 . . . . . . . . . . . . . . . . 17,154,073.01 5,240,420.25 25,375,954.73 7,209,512.99 November 2026 . . . . . . . . . . . . . . . 16,893,623.97 5,058,199.64 24,993,421.16 7,032,171.79 December 2026 . . . . . . . . . . . . . . . 16,634,953.57 4,882,258.33 24,613,385.64 6,859,111.66 January 2027 . . . . . . . . . . . . . . . . . 16,378,048.37 4,712,381.51 24,235,830.01 6,690,230.67 February 2027 . . . . . . . . . . . . . . . . 16,122,895.04 4,548,361.67 23,860,736.23 6,525,429.27 March 2027 . . . . . . . . . . . . . . . . . . 15,869,480.32 4,389,998.35 23,488,086.35 6,364,610.27 April 2027 . . . . . . . . . . . . . . . . . . . 15,618,993.33 4,237,097.93 23,117,862.59 6,207,678.78 May 2027 . . . . . . . . . . . . . . . . . . . . 15,372,268.36 4,089,473.34 22,751,008.80 6,054,542.12 June 2027 . . . . . . . . . . . . . . . . . . . 15,129,250.64 3,946,943.93 22,389,682.20 5,905,109.83 July 2027 . . . . . . . . . . . . . . . . . . . . 14,889,886.19 3,809,335.15 22,033,802.18 5,759,293.55 August 2027 . . . . . . . . . . . . . . . . . 14,654,121.79 3,676,478.42 21,683,289.24 5,617,007.03 September 2027 . . . . . . . . . . . . . . 14,421,904.97 3,548,210.89 21,338,065.05 5,478,166.04 October 2027 . . . . . . . . . . . . . . . . 14,193,184.03 3,424,375.25 20,998,052.38 5,342,688.35 November 2027 . . . . . . . . . . . . . . . 13,967,907.99 3,304,819.57 20,663,175.11 5,210,493.67
S-II-2

Classes KA, KC, Classes CA, Classes AB and AC KY, UA and ZK CD and CW
Distribution Date (in the aggregate) (in the aggregate) Class AP (in the aggregate)
December 2027 . . . . . . . . . . . . . . . $13,746,026.61 $ 3,189,397.08 $20,333,358.20 $ 5,081,503.60 January 2028 . . . . . . . . . . . . . . . . . 13,527,490.36 3,077,966.00 20,008,527.69 4,955,641.58 February 2028 . . . . . . . . . . . . . . . . 13,312,250.41 2,970,389.41 19,688,610.68 4,832,832.89 March 2028 . . . . . . . . . . . . . . . . . . 13,100,258.64 2,866,535.03 19,373,535.30 4,713,004.56 April 2028 . . . . . . . . . . . . . . . . . . . 12,891,467.62 2,766,275.11 19,063,230.73 4,596,085.32 May 2028 . . . . . . . . . . . . . . . . . . . . 12,685,830.59 2,669,486.24 18,757,627.14 4,482,005.63 June 2028 . . . . . . . . . . . . . . . . . . . 12,483,301.45 2,576,049.24 18,456,655.70 4,370,697.56 July 2028 . . . . . . . . . . . . . . . . . . . . 12,283,834.78 2,485,848.97 18,160,248.59 4,262,094.80 August 2028 . . . . . . . . . . . . . . . . . 12,087,385.79 2,398,774.23 17,868,338.94 4,156,132.60 September 2028 . . . . . . . . . . . . . . 11,893,910.35 2,314,717.62 17,580,860.84 4,052,747.76 October 2028 . . . . . . . . . . . . . . . . 11,703,364.93 2,233,575.41 17,297,749.32 3,951,878.55 November 2028 . . . . . . . . . . . . . . . 11,515,706.66 2,155,247.39 17,018,940.35 3,853,464.72 December 2028 . . . . . . . . . . . . . . . 11,330,893.26 2,079,636.79 16,744,370.81 3,757,447.45 January 2029 . . . . . . . . . . . . . . . . . 11,148,883.06 2,006,650.14 16,473,978.50 3,663,769.29 February 2029 . . . . . . . . . . . . . . . . 10,969,634.99 1,936,197.15 16,207,702.10 3,572,374.16 March 2029 . . . . . . . . . . . . . . . . . . 10,793,108.56 1,868,190.65 15,945,481.15 3,483,207.33 April 2029 . . . . . . . . . . . . . . . . . . . 10,619,263.88 1,802,546.41 15,687,256.10 3,396,215.34 May 2029 . . . . . . . . . . . . . . . . . . . . 10,448,061.60 1,739,183.09 15,432,968.21 3,311,346.00 June 2029 . . . . . . . . . . . . . . . . . . . 10,279,462.97 1,678,022.15 15,182,559.63 3,228,548.38 July 2029 . . . . . . . . . . . . . . . . . . . . 10,113,429.76 1,618,987.72 14,935,973.28 3,147,772.72 August 2029 . . . . . . . . . . . . . . . . . 9,949,924.32 1,562,006.51 14,693,152.97 3,068,970.47 September 2029 . . . . . . . . . . . . . . 9,788,909.51 1,507,007.77 14,454,043.25 2,992,094.22 October 2029 . . . . . . . . . . . . . . . . 9,630,348.74 1,453,923.15 14,218,589.51 2,917,097.70 November 2029 . . . . . . . . . . . . . . . 9,474,205.95 1,402,686.63 13,986,737.91 2,843,935.71 December 2029 . . . . . . . . . . . . . . . 9,320,445.59 1,353,234.48 13,758,435.38 2,772,564.14 January 2030 . . . . . . . . . . . . . . . . . 9,169,032.62 1,305,505.13 13,533,629.62 2,702,939.93 February 2030 . . . . . . . . . . . . . . . . 9,019,932.50 1,259,439.12 13,312,269.09 2,635,021.03 March 2030 . . . . . . . . . . . . . . . . . . 8,873,111.19 1,214,979.03 13,094,302.96 2,568,766.41 April 2030 . . . . . . . . . . . . . . . . . . . 8,728,535.13 1,172,069.41 12,879,681.17 2,504,136.00 May 2030 . . . . . . . . . . . . . . . . . . . . 8,586,171.27 1,130,656.70 12,668,354.35 2,441,090.67 June 2030 . . . . . . . . . . . . . . . . . . . 8,445,987.00 1,090,689.19 12,460,273.86 2,379,592.24 July 2030 . . . . . . . . . . . . . . . . . . . . 8,307,950.20 1,052,116.93 12,255,391.74 2,319,603.44 August 2030 . . . . . . . . . . . . . . . . . 8,172,029.21 1,014,891.70 12,053,660.75 2,261,087.86 September 2030 . . . . . . . . . . . . . . 8,038,192.82 978,966.91 11,855,034.31 2,204,010.00 October 2030 . . . . . . . . . . . . . . . . 7,906,410.26 944,297.58 11,659,466.50 2,148,335.16 November 2030 . . . . . . . . . . . . . . . 7,776,651.22 910,840.28 11,466,912.09 2,094,029.48 December 2030 . . . . . . . . . . . . . . . 7,648,885.82 878,553.06 11,277,326.48 2,041,059.93 January 2031 . . . . . . . . . . . . . . . . . 7,523,084.62 847,395.42 11,090,665.72 1,989,394.23 February 2031 . . . . . . . . . . . . . . . . 7,399,218.58 817,328.24 10,906,886.50 1,939,000.89 March 2031 . . . . . . . . . . . . . . . . . . 7,277,259.09 788,313.75 10,725,946.13 1,889,849.18 April 2031 . . . . . . . . . . . . . . . . . . . 7,157,177.96 760,315.48 10,547,802.53 1,841,909.07 May 2031 . . . . . . . . . . . . . . . . . . . . 7,038,947.40 733,298.21 10,372,414.24 1,795,151.27 June 2031 . . . . . . . . . . . . . . . . . . . 6,922,540.03 707,227.92 10,199,740.38 1,749,547.18 July 2031 . . . . . . . . . . . . . . . . . . . . 6,807,928.84 682,071.77 10,029,740.67 1,705,068.89 August 2031 . . . . . . . . . . . . . . . . . 6,695,087.23 657,798.06 9,862,375.43 1,661,689.14 September 2031 . . . . . . . . . . . . . . 6,583,988.98 634,376.16 9,697,605.52 1,619,381.35 October 2031 . . . . . . . . . . . . . . . . 6,474,608.25 611,776.51 9,535,392.39 1,578,119.54
S-II-3

Classes KA, KC, Classes CA, Classes AB and AC KY, UA and ZK CD and CW
Distribution Date (in the aggregate) (in the aggregate) Class AP (in the aggregate)
November 2031 . . . . . . . . . . . . . . . $ 6,366,919.57 $ 589,970.55 $ 9,375,698.03 $ 1,537,878.36 December 2031 . . . . . . . . . . . . . . . 6,260,897.84 568,930.72 9,218,485.00 1,498,633.09 January 2032 . . . . . . . . . . . . . . . . . 6,156,518.31 548,630.40 9,063,716.38 1,460,359.56 February 2032 . . . . . . . . . . . . . . . . 6,053,756.60 529,043.89 8,911,355.80 1,423,034.21 March 2032 . . . . . . . . . . . . . . . . . . 5,952,588.69 510,146.38 8,761,367.41 1,386,634.03 April 2032 . . . . . . . . . . . . . . . . . . . 5,852,990.90 491,913.89 8,613,715.87 1,351,136.56 May 2032 . . . . . . . . . . . . . . . . . . . . 5,754,939.87 474,323.30 8,468,366.37 1,316,519.87 June 2032 . . . . . . . . . . . . . . . . . . . 5,658,412.61 457,352.27 8,325,284.60 1,282,762.58 July 2032 . . . . . . . . . . . . . . . . . . . . 5,563,386.46 440,979.22 8,184,436.73 1,249,843.80 August 2032 . . . . . . . . . . . . . . . . . 5,469,839.06 425,183.35 8,045,789.44 1,217,743.13 September 2032 . . . . . . . . . . . . . . 5,377,748.40 409,944.54 7,909,309.88 1,186,440.68 October 2032 . . . . . . . . . . . . . . . . 5,287,092.77 395,243.37 7,774,965.68 1,155,917.04 November 2032 . . . . . . . . . . . . . . . 5,197,850.80 381,061.12 7,642,724.95 1,126,153.24 December 2032 . . . . . . . . . . . . . . . 5,110,001.41 367,379.68 7,512,556.25 1,097,130.79 January 2033 . . . . . . . . . . . . . . . . . 5,023,523.82 354,181.58 7,384,428.59 1,068,831.62 February 2033 . . . . . . . . . . . . . . . . 4,938,397.58 341,449.97 7,258,311.46 1,041,238.11 March 2033 . . . . . . . . . . . . . . . . . . 4,854,602.49 329,168.55 7,134,174.75 1,014,333.05 April 2033 . . . . . . . . . . . . . . . . . . . 4,772,118.69 317,321.60 7,011,988.82 988,099.66 May 2033 . . . . . . . . . . . . . . . . . . . . 4,690,926.58 305,893.96 6,891,724.45 962,521.55 June 2033 . . . . . . . . . . . . . . . . . . . 4,611,006.86 294,870.96 6,773,352.85 937,582.72 July 2033 . . . . . . . . . . . . . . . . . . . . 4,532,340.49 284,238.47 6,656,845.63 913,267.57 August 2033 . . . . . . . . . . . . . . . . . 4,454,908.73 273,982.82 6,542,174.85 889,560.86 September 2033 . . . . . . . . . . . . . . 4,378,693.10 264,090.84 6,429,312.92 866,447.71 October 2033 . . . . . . . . . . . . . . . . 4,303,675.38 254,549.80 6,318,232.72 843,913.62 November 2033 . . . . . . . . . . . . . . . 4,229,837.63 245,347.41 6,208,907.46 821,944.43 December 2033 . . . . . . . . . . . . . . . 4,157,162.17 236,471.81 6,101,310.78 800,526.30 January 2034 . . . . . . . . . . . . . . . . . 4,085,631.57 227,911.55 5,995,416.70 779,645.76 February 2034 . . . . . . . . . . . . . . . . 4,015,228.65 219,655.59 5,891,199.60 759,289.63 March 2034 . . . . . . . . . . . . . . . . . . 3,945,936.48 211,693.25 5,788,634.25 739,445.07 April 2034 . . . . . . . . . . . . . . . . . . . 3,877,738.40 204,014.24 5,687,695.78 720,099.53 May 2034 . . . . . . . . . . . . . . . . . . . . 3,810,617.97 196,608.61 5,588,359.68 701,240.79 June 2034 . . . . . . . . . . . . . . . . . . . 3,744,558.98 189,466.76 5,490,601.82 682,856.89 July 2034 . . . . . . . . . . . . . . . . . . . . 3,679,545.48 182,579.44 5,394,398.39 664,936.18 August 2034 . . . . . . . . . . . . . . . . . 3,615,561.74 175,937.70 5,299,725.94 647,467.28 September 2034 . . . . . . . . . . . . . . 3,552,592.26 169,532.92 5,206,561.37 630,439.11 October 2034 . . . . . . . . . . . . . . . . 3,490,621.77 163,356.75 5,114,881.92 613,840.82 November 2034 . . . . . . . . . . . . . . . 3,429,635.22 157,401.17 5,024,665.14 597,661.84 December 2034 . . . . . . . . . . . . . . . 3,369,617.78 151,658.40 4,935,888.93 581,891.87 January 2035 . . . . . . . . . . . . . . . . . 3,310,554.84 146,120.96 4,848,531.50 566,520.82 February 2035 . . . . . . . . . . . . . . . . 3,252,431.99 140,781.61 4,762,571.39 551,538.89 March 2035 . . . . . . . . . . . . . . . . . . 3,195,235.04 135,633.38 4,677,987.45 536,936.48 April 2035 . . . . . . . . . . . . . . . . . . . 3,138,950.01 130,669.53 4,594,758.83 522,704.23 May 2035 . . . . . . . . . . . . . . . . . . . . 3,083,563.13 125,883.56 4,512,864.99 508,833.03 June 2035 . . . . . . . . . . . . . . . . . . . 3,029,060.81 121,269.19 4,432,285.71 495,313.96 July 2035 . . . . . . . . . . . . . . . . . . . . 2,975,429.68 116,820.37 4,353,001.03 482,138.33 August 2035 . . . . . . . . . . . . . . . . . 2,922,656.55 112,531.25 4,274,991.31 469,297.66 September 2035 . . . . . . . . . . . . . . 2,870,728.43 108,396.19 4,198,237.19 456,783.68
S-II-4

Classes KA, KC, Classes CA, Classes AB and AC KY, UA and ZK CD and CW
Distribution Date (in the aggregate) (in the aggregate) Class AP (in the aggregate)
October 2035 . . . . . . . . . . . . . . . . $ 2,819,632.52 $ 104,409.75 $ 4,122,719.60 $ 444,588.30 November 2035 . . . . . . . . . . . . . . . 2,769,356.21 100,566.67 4,048,419.73 432,703.65 December 2035 . . . . . . . . . . . . . . . 2,719,887.08 96,861.88 3,975,319.07 421,122.04 January 2036 . . . . . . . . . . . . . . . . . 2,671,212.87 93,290.48 3,903,399.36 409,835.96 February 2036 . . . . . . . . . . . . . . . . 2,623,321.52 89,847.76 3,832,642.64 398,838.10 March 2036 . . . . . . . . . . . . . . . . . . 2,576,201.13 86,529.15 3,763,031.17 388,121.32 April 2036 . . . . . . . . . . . . . . . . . . . 2,529,840.00 83,330.27 3,694,547.51 377,678.63 May 2036 . . . . . . . . . . . . . . . . . . . . 2,484,226.58 80,246.85 3,627,174.44 367,503.25 June 2036 . . . . . . . . . . . . . . . . . . . 2,439,349.50 77,274.81 3,560,895.04 357,588.53 July 2036 . . . . . . . . . . . . . . . . . . . . 2,395,197.54 74,410.20 3,495,692.59 347,928.01 August 2036 . . . . . . . . . . . . . . . . . 2,351,759.67 71,649.19 3,431,550.64 338,515.37 September 2036 . . . . . . . . . . . . . . 2,309,025.00 68,988.12 3,368,453.00 329,344.44 October 2036 . . . . . . . . . . . . . . . . 2,266,982.82 66,423.42 3,306,383.67 320,409.21 November 2036 . . . . . . . . . . . . . . . 2,225,622.56 63,951.67 3,245,326.94 311,703.81 December 2036 . . . . . . . . . . . . . . . 2,184,933.82 61,569.57 3,185,267.28 303,222.52 January 2037 . . . . . . . . . . . . . . . . . 2,144,906.34 59,273.91 3,126,189.44 294,959.76 February 2037 . . . . . . . . . . . . . . . . 2,105,530.01 57,061.63 3,068,078.35 286,910.08 March 2037 . . . . . . . . . . . . . . . . . . 2,066,794.88 54,929.76 3,010,919.19 279,068.15 April 2037 . . . . . . . . . . . . . . . . . . . 2,028,691.15 52,875.42 2,954,697.35 271,428.81 May 2037 . . . . . . . . . . . . . . . . . . . . 1,991,209.15 50,895.85 2,899,398.43 263,986.97 June 2037 . . . . . . . . . . . . . . . . . . . 1,954,339.35 48,988.38 2,845,008.25 256,737.72 July 2037 . . . . . . . . . . . . . . . . . . . . 1,918,072.38 47,150.43 2,791,512.85 249,676.24 August 2037 . . . . . . . . . . . . . . . . . 1,882,399.00 45,379.54 2,738,898.45 242,797.82 September 2037 . . . . . . . . . . . . . . 1,847,310.09 43,673.28 2,687,151.49 236,097.89 October 2037 . . . . . . . . . . . . . . . . 1,812,796.69 42,029.36 2,636,258.62 229,571.97 November 2037 . . . . . . . . . . . . . . . 1,778,849.96 40,445.55 2,586,206.66 223,215.70 December 2037 . . . . . . . . . . . . . . . 1,745,461.19 38,919.68 2,536,982.66 217,024.82 January 2038 . . . . . . . . . . . . . . . . . 1,712,621.79 37,449.69 2,488,573.82 210,995.20 February 2038 . . . . . . . . . . . . . . . . 1,680,323.32 36,033.57 2,440,967.57 205,122.77 March 2038 . . . . . . . . . . . . . . . . . . 1,648,557.44 34,669.39 2,394,151.50 199,403.58 April 2038 . . . . . . . . . . . . . . . . . . . 1,617,315.95 33,355.29 2,348,113.40 193,833.79 May 2038 . . . . . . . . . . . . . . . . . . . . 1,586,590.77 32,089.46 2,302,841.23 188,409.64 June 2038 . . . . . . . . . . . . . . . . . . . 1,556,373.93 30,870.17 2,258,323.12 183,127.45 July 2038 . . . . . . . . . . . . . . . . . . . . 1,526,657.59 29,695.75 2,214,547.41 177,983.66 August 2038 . . . . . . . . . . . . . . . . . 1,497,434.02 28,564.59 2,171,502.58 172,974.77 September 2038 . . . . . . . . . . . . . . 1,468,695.59 27,475.12 2,129,177.30 168,097.38 October 2038 . . . . . . . . . . . . . . . . 1,440,434.82 26,425.84 2,087,560.39 163,348.17 November 2038 . . . . . . . . . . . . . . . 1,412,644.30 25,415.32 2,046,640.86 158,723.91 December 2038 . . . . . . . . . . . . . . . 1,385,316.75 24,442.14 2,006,407.85 154,221.43 January 2039 . . . . . . . . . . . . . . . . . 1,358,445.01 23,504.96 1,966,850.71 149,837.66 February 2039 . . . . . . . . . . . . . . . . 1,332,022.01 22,602.48 1,927,958.90 145,569.59 March 2039 . . . . . . . . . . . . . . . . . . 1,306,040.77 21,733.45 1,889,722.07 141,414.29 April 2039 . . . . . . . . . . . . . . . . . . . 1,280,494.46 20,896.66 1,852,130.00 137,368.90 May 2039 . . . . . . . . . . . . . . . . . . . . 1,255,376.30 20,090.93 1,815,172.65 133,430.63 June 2039 . . . . . . . . . . . . . . . . . . . 1,230,679.64 19,315.15 1,778,840.10 129,596.78 July 2039 . . . . . . . . . . . . . . . . . . . . 1,206,397.93 18,568.24 1,743,122.60 125,864.67 August 2039 . . . . . . . . . . . . . . . . . 1,182,524.71 17,849.13 1,708,010.53 122,231.73
S-II-5

Classes KA, KC, Classes CA, Classes AB and AC KY, UA and ZK CD and CW
Distribution Date (in the aggregate) (in the aggregate) Class AP (in the aggregate)
September 2039 . . . . . . . . . . . . . . $ 1,159,053.60 $ 17,156.83 $ 1,673,494.43 $ 118,695.44 October 2039 . . . . . . . . . . . . . . . . 1,135,978.36 16,490.36 1,639,564.97 115,253.33 November 2039 . . . . . . . . . . . . . . . 1,113,292.79 15,848.79 1,606,212.96 111,903.01 December 2039 . . . . . . . . . . . . . . . 1,090,990.82 15,231.20 1,573,429.34 108,642.13 January 2040 . . . . . . . . . . . . . . . . . 1,069,066.45 14,636.72 1,541,205.21 105,468.41 February 2040 . . . . . . . . . . . . . . . . 1,047,513.79 14,064.52 1,509,531.78 102,379.63 March 2040 . . . . . . . . . . . . . . . . . . 1,026,327.01 13,513.78 1,478,400.41 99,373.62 April 2040 . . . . . . . . . . . . . . . . . . . 1,005,500.39 12,983.72 1,447,802.56 96,448.26 May 2040 . . . . . . . . . . . . . . . . . . . . 985,028.29 12,473.58 1,417,729.85 93,601.49 June 2040 . . . . . . . . . . . . . . . . . . . 964,905.16 11,982.64 1,388,174.00 90,831.29 July 2040 . . . . . . . . . . . . . . . . . . . . 945,125.50 11,510.19 1,359,126.89 88,135.70 August 2040 . . . . . . . . . . . . . . . . . 925,683.94 11,055.56 1,330,580.47 85,512.81 September 2040 . . . . . . . . . . . . . . 906,575.16 10,618.10 1,302,526.86 82,960.75 October 2040 . . . . . . . . . . . . . . . . 887,793.93 10,197.17 1,274,958.27 80,477.70 November 2040 . . . . . . . . . . . . . . . 869,335.10 9,792.17 1,247,867.03 78,061.88 December 2040 . . . . . . . . . . . . . . . 851,193.58 9,402.52 1,221,245.59 75,711.57 January 2041 . . . . . . . . . . . . . . . . . 833,364.38 9,027.65 1,195,086.52 73,425.08 February 2041 . . . . . . . . . . . . . . . . 815,842.57 8,667.02 1,169,382.50 71,200.76 March 2041 . . . . . . . . . . . . . . . . . . 798,623.30 8,320.10 1,144,126.30 69,037.01 April 2041 . . . . . . . . . . . . . . . . . . . 781,701.79 7,986.40 1,119,310.82 66,932.26 May 2041 . . . . . . . . . . . . . . . . . . . . 765,073.34 7,665.41 1,094,929.06 64,884.99 June 2041 . . . . . . . . . . . . . . . . . . . 748,733.30 7,356.69 1,070,974.14 62,893.71 July 2041 . . . . . . . . . . . . . . . . . . . . 732,677.12 7,059.76 1,047,439.25 60,956.97 August 2041 . . . . . . . . . . . . . . . . . 716,900.29 6,774.19 1,024,317.71 59,073.36 September 2041 . . . . . . . . . . . . . . 701,398.39 6,499.58 1,001,602.94 57,241.50 October 2041 . . . . . . . . . . . . . . . . 686,167.05 6,235.50 979,288.45 55,460.05 November 2041 . . . . . . . . . . . . . . . 671,201.97 5,981.57 957,367.85 53,727.69 December 2041 . . . . . . . . . . . . . . . 656,498.92 5,737.41 935,834.85 52,043.15 January 2042 . . . . . . . . . . . . . . . . . 642,053.73 5,502.66 914,683.25 50,405.18 February 2042 . . . . . . . . . . . . . . . . 627,862.30 5,276.98 893,906.95 48,812.57 March 2042 . . . . . . . . . . . . . . . . . . 613,920.58 5,060.02 873,499.94 47,264.14 April 2042 . . . . . . . . . . . . . . . . . . . 600,224.59 4,851.45 853,456.29 45,758.73 May 2042 . . . . . . . . . . . . . . . . . . . . 586,770.40 4,650.98 833,770.19 44,295.21 June 2042 . . . . . . . . . . . . . . . . . . . 573,554.16 4,458.28 814,435.87 42,872.50 July 2042 . . . . . . . . . . . . . . . . . . . . 560,572.05 4,273.08 795,447.71 41,489.52 August 2042 . . . . . . . . . . . . . . . . . 547,820.34 4,095.09 776,800.11 40,145.23 September 2042 . . . . . . . . . . . . . . 535,295.32 3,924.05 758,487.61 38,838.61 October 2042 . . . . . . . . . . . . . . . . 522,993.37 3,759.69 740,504.79 37,568.69 November 2042 . . . . . . . . . . . . . . . 510,910.91 3,601.76 722,846.35 36,334.48 December 2042 . . . . . . . . . . . . . . . 499,044.40 3,450.03 705,507.04 35,135.05 January 2043 . . . . . . . . . . . . . . . . . 487,390.39 3,304.25 688,481.70 33,969.48 February 2043 . . . . . . . . . . . . . . . . 475,945.44 3,164.21 671,765.26 32,836.88 March 2043 . . . . . . . . . . . . . . . . . . 464,706.20 3,029.69 655,352.71 31,736.38 April 2043 . . . . . . . . . . . . . . . . . . . 453,669.34 2,900.47 639,239.13 30,667.13 May 2043 . . . . . . . . . . . . . . . . . . . . 442,831.60 2,776.37 623,419.67 29,628.31 June 2043 . . . . . . . . . . . . . . . . . . . 432,189.76 2,657.18 607,889.55 28,619.10 July 2043 . . . . . . . . . . . . . . . . . . . . 421,740.67 2,542.73 592,644.06 27,638.72
S-II-6

Distribution Date Classes AB and AC (in the aggregate)
Classes KA, KC, KY, UA and ZK
(in the aggregate) Class AP
Classes CA, CD and CW
(in the aggregate)
August 2043 . . . . . . . . . . . . . . . . . September 2043 . . . . . . . . . . . . . . October 2043 . . . . . . . . . . . . . . . . November 2043 . . . . . . . . . . . . . . . December 2043 . . . . . . . . . . . . . . . January 2044 . . . . . . . . . . . . . . . . . February 2044 . . . . . . . . . . . . . . . . March 2044 . . . . . . . . . . . . . . . . . . April 2044 . . . . . . . . . . . . . . . . . . . May 2044 . . . . . . . . . . . . . . . . . . . . June 2044 . . . . . . . . . . . . . . . . . . . July 2044 . . . . . . . . . . . . . . . . . . . . August 2044 . . . . . . . . . . . . . . . . . September 2044 . . . . . . . . . . . . . . October 2044 . . . . . . . . . . . . . . . . November 2044 . . . . . . . . . . . . . . . December 2044 . . . . . . . . . . . . . . . January 2045 . . . . . . . . . . . . . . . . . February 2045 . . . . . . . . . . . . . . . . March 2045 . . . . . . . . . . . . . . . . . . April 2045 . . . . . . . . . . . . . . . . . . . May 2045 . . . . . . . . . . . . . . . . . . . . June 2045 . . . . . . . . . . . . . . . . . . . July 2045 . . . . . . . . . . . . . . . . . . . . August 2045 . . . . . . . . . . . . . . . . . September 2045 . . . . . . . . . . . . . . October 2045 . . . . . . . . . . . . . . . . November 2045 . . . . . . . . . . . . . . . December 2045 . . . . . . . . . . . . . . . January 2046 . . . . . . . . . . . . . . . . . February 2046 . . . . . . . . . . . . . . . . March 2046 . . . . . . . . . . . . . . . . . . April 2046 . . . . . . . . . . . . . . . . . . . May 2046 . . . . . . . . . . . . . . . . . . . . June 2046 . . . . . . . . . . . . . . . . . . . July 2046 . . . . . . . . . . . . . . . . . . . . August 2046 . . . . . . . . . . . . . . . . . September 2046 . . . . . . . . . . . . . . October 2046 . . . . . . . . . . . . . . . . November 2046 . . . . . . . . . . . . . . . December 2046 . . . . . . . . . . . . . . . January 2047 . . . . . . . . . . . . . . . . . February 2047 . . . . . . . . . . . . . . . . March 2047 . . . . . . . . . . . . . . . . . . April 2047 . . . . . . . . . . . . . . . . . . . May 2047 . . . . . . . . . . . . . . . . . . . . June 2047 . . . . . . . . . . . . . . . . . . .
$ 411,481.19 401,408.26 391,518.85 381,809.99 372,278.74 362,922.22 353,737.58 344,722.02 335,872.78 327,187.15 318,662.46 310,296.07 302,085.38 294,027.86 286,120.98 278,362.27 270,749.29 263,279.64 255,950.97 248,760.94 241,707.27 234,787.69 228,000.00 221,342.01 214,811.55 208,406.53 202,124.84 195,964.44 189,923.30 183,999.43 178,190.88 172,495.71 166,912.03 161,437.97 156,071.68 150,811.35 145,655.21 140,601.49 135,648.46 130,794.43 126,037.72 121,376.67 116,809.68 112,335.13 107,951.46 103,657.12 99,450.59
$ 2,432.83 2,327.30 2,225.99 2,128.73 2,035.37 1,945.76 1,859.76 1,777.22 1,698.02 1,622.04 1,549.13 1,479.19 1,412.11 1,347.77 1,286.06 1,226.89 1,170.16 1,115.77 1,063.63 1,013.65
965.76 919.86 875.88 833.75 793.40 754.74 717.72 682.28 648.35 615.86 584.77 555.02 526.55 499.31 473.26 448.35 424.52 401.75 379.98 359.17 339.29 320.30 302.16 284.84 268.30 252.52 237.45
$ 577,678.58 562,988.55 548,569.47 534,416.92 520,526.55 506,894.07 493,515.25 480,385.94 467,502.05 454,859.54 442,454.45 430,282.87 418,340.95 406,624.90 395,131.00 383,855.56 372,794.98 361,945.70 351,304.20 340,867.05 330,630.83 320,592.21 310,747.90 301,094.65 291,629.26 282,348.61 273,249.59 264,329.16 255,584.32 247,012.11 238,609.65 230,374.05 222,302.52 214,392.27 206,640.58 199,044.76 191,602.17 184,310.21 177,166.31 170,167.96 163,312.66 156,597.99 150,021.53 143,580.91 137,273.81 131,097.94 125,051.03
$ 26,686.40 25,761.40 24,862.99 23,990.47 23,143.14 22,320.32 21,521.36 20,745.63 19,992.50 19,261.36 18,551.62 17,862.71 17,194.06 16,545.13 15,915.38 15,304.30 14,711.37 14,136.11 13,578.04 13,036.68 12,511.59 12,002.31 11,508.42 11,029.49 10,565.12 10,114.90 9,678.45 9,255.38 8,845.33 8,447.93 8,062.84 7,689.72 7,328.22 6,978.04 6,638.85 6,310.35 5,992.24 5,684.22 5,386.02 5,097.35 4,817.96 4,547.57 4,285.93 4,032.80 3,787.93 3,551.09 3,322.06
S-II-7

Distribution Date Classes AB and AC (in the aggregate)
Classes KA, KC, KY, UA and ZK
(in the aggregate) Class AP
Classes CA, CD and CW
(in the aggregate)
July 2047 . . . . . . . . . . . . . . . . . . . . August 2047 . . . . . . . . . . . . . . . . . September 2047 . . . . . . . . . . . . . . October 2047 . . . . . . . . . . . . . . . . November 2047 . . . . . . . . . . . . . . . December 2047 . . . . . . . . . . . . . . . January 2048 . . . . . . . . . . . . . . . . . February 2048 . . . . . . . . . . . . . . . . March 2048 . . . . . . . . . . . . . . . . . . April 2048 . . . . . . . . . . . . . . . . . . . May 2048 . . . . . . . . . . . . . . . . . . . . June 2048 . . . . . . . . . . . . . . . . . . . July 2048 . . . . . . . . . . . . . . . . . . . . August 2048 . . . . . . . . . . . . . . . . . September 2048 . . . . . . . . . . . . . . October 2048 . . . . . . . . . . . . . . . . November 2048 . . . . . . . . . . . . . . . December 2048 . . . . . . . . . . . . . . . January 2049 . . . . . . . . . . . . . . . . . February 2049 . . . . . . . . . . . . . . . . March 2049 . . . . . . . . . . . . . . . . . . April 2049 . . . . . . . . . . . . . . . . . . . May 2049 . . . . . . . . . . . . . . . . . . . . June 2049 . . . . . . . . . . . . . . . . . . . July 2049 . . . . . . . . . . . . . . . . . . . . August 2049 . . . . . . . . . . . . . . . . . September 2049 . . . . . . . . . . . . . . October 2049 . . . . . . . . . . . . . . . . November 2049 . . . . . . . . . . . . . . . December 2049 . . . . . . . . . . . . . . . January 2050 . . . . . . . . . . . . . . . . . February 2050 . . . . . . . . . . . . . . . . March 2050 . . . . . . . . . . . . . . . . . . April 2050 and thereafter . . . . . . .
$ 95,330.36 91,294.96 87,342.94 83,472.86 79,683.32 75,972.93 72,340.33 68,784.18 65,303.16 61,895.96 58,561.31 55,297.95 52,104.63 48,980.15 45,923.29 42,932.88 40,007.75 37,146.76 34,348.79 31,612.72 28,937.47 26,321.97 23,765.15 21,265.98 18,823.44 16,436.52 14,104.24 11,825.61 9,599.68 7,425.50 5,302.16 3,228.73 1,204.32
0.00
$ 223.08 209.37 196.30 183.84 171.96 160.64 149.86 139.60 129.82 120.52 111.67 103.25 95.25 87.65 80.42 73.56 67.05 60.86 55.00 49.45 44.18 39.19 34.47 30.01 25.79 21.80 18.03 14.48 11.13 7.97 4.99 2.20 0.00 0.00
$ 119,130.87 113,335.27 107,662.07 102,109.17 96,674.47 91,355.92 86,151.51 81,059.25 76,077.18 71,203.38 66,435.96 61,773.05 57,212.81 52,753.45 48,393.19 44,130.27 39,962.99 35,889.64 31,908.56 28,018.12 24,216.70 20,502.71 16,874.60 13,330.83 9,869.88 6,490.27 3,190.54
0.00 0.00 0.00 0.00 0.00 0.00 0.00
$ 3,100.59 2,886.49 2,679.54 2,479.53 2,286.27 2,099.55 1,919.20 1,745.02 1,576.83 1,414.47 1,257.76 1,106.53
960.63 819.90 684.19 553.34 427.22 305.68 188.59 75.82 0.00 0.00 0.00 0.00 0.00 0.00 0.00 0.00 0.00 0.00 0.00 0.00 0.00 0.00
S-II-8

Classes KU, KW, Classes DP and DQ Classes QA and QP UH and ZU
Distribution Date (in the aggregate) (in the aggregate) (in the aggregate)
Initial Balance . . . . . . . . . . . . . . . . . . . . . . . . . . . . . . $5,265,000.00 $25,388,040.00 $47,094,000.00 June 2020 . . . . . . . . . . . . . . . . . . . . . . . . . . . . . . . . . 5,250,903.78 25,291,425.65 46,932,467.31 July 2020 . . . . . . . . . . . . . . . . . . . . . . . . . . . . . . . . . . 5,235,690.01 25,186,318.76 46,732,955.19 August 2020 . . . . . . . . . . . . . . . . . . . . . . . . . . . . . . . 5,219,363.80 25,072,752.63 46,495,541.80 September 2020 . . . . . . . . . . . . . . . . . . . . . . . . . . . . 5,201,930.92 24,950,765.97 46,220,389.49 October 2020 . . . . . . . . . . . . . . . . . . . . . . . . . . . . . . 5,183,397.76 24,820,402.96 45,907,745.42 November 2020 . . . . . . . . . . . . . . . . . . . . . . . . . . . . 5,163,771.33 24,681,713.15 45,557,941.95 December 2020 . . . . . . . . . . . . . . . . . . . . . . . . . . . . 5,143,059.27 24,534,751.49 45,171,396.66 January 2021 . . . . . . . . . . . . . . . . . . . . . . . . . . . . . . . 5,121,269.84 24,379,578.26 44,748,612.08 February 2021 . . . . . . . . . . . . . . . . . . . . . . . . . . . . . 5,098,411.89 24,216,259.02 44,290,175.11 March 2021 . . . . . . . . . . . . . . . . . . . . . . . . . . . . . . . . 5,074,494.91 24,044,864.63 43,796,756.10 April 2021 . . . . . . . . . . . . . . . . . . . . . . . . . . . . . . . . . 5,049,528.97 23,865,471.09 43,269,107.64 May 2021 . . . . . . . . . . . . . . . . . . . . . . . . . . . . . . . . . 5,023,524.72 23,678,159.59 42,708,063.00 June 2021 . . . . . . . . . . . . . . . . . . . . . . . . . . . . . . . . . 4,996,493.43 23,483,016.38 42,114,534.24 July 2021 . . . . . . . . . . . . . . . . . . . . . . . . . . . . . . . . . . 4,968,446.91 23,280,132.70 41,489,510.06 August 2021 . . . . . . . . . . . . . . . . . . . . . . . . . . . . . . . 4,939,397.55 23,069,604.76 40,834,053.24 September 2021 . . . . . . . . . . . . . . . . . . . . . . . . . . . . 4,909,358.32 22,851,533.59 40,149,297.88 October 2021 . . . . . . . . . . . . . . . . . . . . . . . . . . . . . . 4,878,342.71 22,626,025.01 39,436,446.25 November 2021 . . . . . . . . . . . . . . . . . . . . . . . . . . . . 4,846,364.76 22,393,189.51 38,696,765.42 December 2021 . . . . . . . . . . . . . . . . . . . . . . . . . . . . 4,813,439.03 22,153,142.15 37,931,583.55 January 2022 . . . . . . . . . . . . . . . . . . . . . . . . . . . . . . . 4,779,580.60 21,906,002.48 37,142,285.97 February 2022 . . . . . . . . . . . . . . . . . . . . . . . . . . . . . 4,744,805.06 21,651,894.43 36,330,310.97 March 2022 . . . . . . . . . . . . . . . . . . . . . . . . . . . . . . . . 4,709,128.48 21,390,946.17 35,497,145.38 April 2022 . . . . . . . . . . . . . . . . . . . . . . . . . . . . . . . . . 4,672,567.42 21,123,290.04 34,644,319.93 May 2022 . . . . . . . . . . . . . . . . . . . . . . . . . . . . . . . . . 4,635,138.89 20,849,062.38 33,773,404.39 June 2022 . . . . . . . . . . . . . . . . . . . . . . . . . . . . . . . . . 4,596,860.37 20,568,403.46 32,886,002.58 July 2022 . . . . . . . . . . . . . . . . . . . . . . . . . . . . . . . . . . 4,557,749.75 20,281,457.31 31,983,747.19 August 2022 . . . . . . . . . . . . . . . . . . . . . . . . . . . . . . . 4,517,825.37 19,988,371.60 31,068,294.48 September 2022 . . . . . . . . . . . . . . . . . . . . . . . . . . . . 4,477,105.96 19,689,297.51 30,141,318.87 October 2022 . . . . . . . . . . . . . . . . . . . . . . . . . . . . . . 4,435,610.64 19,384,389.56 29,204,507.45 November 2022 . . . . . . . . . . . . . . . . . . . . . . . . . . . . 4,394,371.53 19,073,805.52 28,292,208.62 December 2022 . . . . . . . . . . . . . . . . . . . . . . . . . . . . 4,353,387.05 18,765,363.07 27,403,776.00 January 2023 . . . . . . . . . . . . . . . . . . . . . . . . . . . . . . . 4,312,655.60 18,459,047.03 26,538,580.07 February 2023 . . . . . . . . . . . . . . . . . . . . . . . . . . . . . 4,272,175.64 18,154,842.33 25,696,007.82 March 2023 . . . . . . . . . . . . . . . . . . . . . . . . . . . . . . . . 4,231,945.59 17,852,733.99 24,875,462.21 April 2023 . . . . . . . . . . . . . . . . . . . . . . . . . . . . . . . . . 4,191,963.92 17,552,707.14 24,076,361.86 May 2023 . . . . . . . . . . . . . . . . . . . . . . . . . . . . . . . . . 4,152,229.08 17,254,747.02 23,298,140.57 June 2023 . . . . . . . . . . . . . . . . . . . . . . . . . . . . . . . . . 4,112,739.54 16,958,838.95 22,540,246.95 July 2023 . . . . . . . . . . . . . . . . . . . . . . . . . . . . . . . . . . 4,073,493.78 16,664,968.36 21,802,144.05 August 2023 . . . . . . . . . . . . . . . . . . . . . . . . . . . . . . . 4,034,490.29 16,373,120.79 21,083,308.95 September 2023 . . . . . . . . . . . . . . . . . . . . . . . . . . . . 3,995,727.57 16,083,281.85 20,383,232.43 October 2023 . . . . . . . . . . . . . . . . . . . . . . . . . . . . . . 3,957,204.11 15,795,437.27 19,701,418.59 November 2023 . . . . . . . . . . . . . . . . . . . . . . . . . . . . 3,918,918.44 15,509,572.86 19,037,384.51 December 2023 . . . . . . . . . . . . . . . . . . . . . . . . . . . . 3,880,869.07 15,225,674.55 18,390,659.92 January 2024 . . . . . . . . . . . . . . . . . . . . . . . . . . . . . . . 3,843,054.54 14,943,728.34 17,760,786.86 February 2024 . . . . . . . . . . . . . . . . . . . . . . . . . . . . . 3,805,473.38 14,663,720.34 17,147,319.37 March 2024 . . . . . . . . . . . . . . . . . . . . . . . . . . . . . . . . 3,768,124.15 14,385,636.75 16,554,118.58
S-II-9

Classes KU, KW, Classes DP and DQ Classes QA and QP UH and ZU
Distribution Date (in the aggregate) (in the aggregate) (in the aggregate)
April 2024 . . . . . . . . . . . . . . . . . . . . . . . . . . . . . . . . . $3,731,005.40 $14,109,463.86 $15,981,286.43 May 2024 . . . . . . . . . . . . . . . . . . . . . . . . . . . . . . . . . 3,694,115.70 13,835,188.06 15,428,127.79 June 2024 . . . . . . . . . . . . . . . . . . . . . . . . . . . . . . . . . 3,657,453.63 13,562,795.82 14,893,971.15 July 2024 . . . . . . . . . . . . . . . . . . . . . . . . . . . . . . . . . . 3,621,017.75 13,292,273.72 14,378,167.78 August 2024 . . . . . . . . . . . . . . . . . . . . . . . . . . . . . . . 3,584,806.67 13,023,608.42 13,880,090.99 September 2024 . . . . . . . . . . . . . . . . . . . . . . . . . . . . 3,548,818.98 12,756,786.66 13,399,135.40 October 2024 . . . . . . . . . . . . . . . . . . . . . . . . . . . . . . 3,513,053.29 12,491,795.29 12,934,716.18 November 2024 . . . . . . . . . . . . . . . . . . . . . . . . . . . . 3,477,508.21 12,228,621.24 12,486,268.36 December 2024 . . . . . . . . . . . . . . . . . . . . . . . . . . . . 3,442,182.37 11,967,251.52 12,053,246.18 January 2025 . . . . . . . . . . . . . . . . . . . . . . . . . . . . . . . 3,407,074.40 11,707,673.25 11,635,122.45 February 2025 . . . . . . . . . . . . . . . . . . . . . . . . . . . . . 3,372,182.94 11,449,873.62 11,231,387.88 March 2025 . . . . . . . . . . . . . . . . . . . . . . . . . . . . . . . . 3,337,506.64 11,193,839.90 10,841,550.49 April 2025 . . . . . . . . . . . . . . . . . . . . . . . . . . . . . . . . . 3,303,044.14 10,939,559.47 10,465,135.06 May 2025 . . . . . . . . . . . . . . . . . . . . . . . . . . . . . . . . . 3,268,794.12 10,687,019.78 10,101,682.49 June 2025 . . . . . . . . . . . . . . . . . . . . . . . . . . . . . . . . . 3,234,755.24 10,436,208.36 9,750,749.35 July 2025 . . . . . . . . . . . . . . . . . . . . . . . . . . . . . . . . . . 3,200,926.19 10,187,112.84 9,411,907.24 August 2025 . . . . . . . . . . . . . . . . . . . . . . . . . . . . . . . 3,167,305.65 9,939,720.92 9,084,742.38 September 2025 . . . . . . . . . . . . . . . . . . . . . . . . . . . . 3,133,892.31 9,694,020.40 8,768,855.06 October 2025 . . . . . . . . . . . . . . . . . . . . . . . . . . . . . . 3,100,684.88 9,449,999.15 8,463,859.17 November 2025 . . . . . . . . . . . . . . . . . . . . . . . . . . . . 3,067,682.06 9,207,645.12 8,169,381.74 December 2025 . . . . . . . . . . . . . . . . . . . . . . . . . . . . 3,034,882.58 8,966,946.34 7,885,062.52 January 2026 . . . . . . . . . . . . . . . . . . . . . . . . . . . . . . . 3,002,285.15 8,727,890.94 7,610,553.51 February 2026 . . . . . . . . . . . . . . . . . . . . . . . . . . . . . 2,969,888.51 8,490,467.12 7,345,518.58 March 2026 . . . . . . . . . . . . . . . . . . . . . . . . . . . . . . . . 2,937,691.40 8,254,663.15 7,089,633.02 April 2026 . . . . . . . . . . . . . . . . . . . . . . . . . . . . . . . . . 2,905,692.57 8,021,750.42 6,842,583.22 May 2026 . . . . . . . . . . . . . . . . . . . . . . . . . . . . . . . . . 2,873,890.76 7,795,319.27 6,604,066.24 June 2026 . . . . . . . . . . . . . . . . . . . . . . . . . . . . . . . . . 2,842,284.75 7,575,191.26 6,373,789.47 July 2026 . . . . . . . . . . . . . . . . . . . . . . . . . . . . . . . . . . 2,810,873.30 7,361,192.84 6,151,470.27 August 2026 . . . . . . . . . . . . . . . . . . . . . . . . . . . . . . . 2,779,655.18 7,153,155.21 5,936,835.64 September 2026 . . . . . . . . . . . . . . . . . . . . . . . . . . . . 2,748,629.19 6,950,914.14 5,729,621.89 October 2026 . . . . . . . . . . . . . . . . . . . . . . . . . . . . . . 2,717,794.10 6,754,309.92 5,529,574.33 November 2026 . . . . . . . . . . . . . . . . . . . . . . . . . . . . 2,687,148.72 6,563,187.18 5,336,446.94 December 2026 . . . . . . . . . . . . . . . . . . . . . . . . . . . . 2,656,691.86 6,377,394.80 5,150,002.12 January 2027 . . . . . . . . . . . . . . . . . . . . . . . . . . . . . . . 2,626,422.31 6,196,785.80 4,970,010.36 February 2027 . . . . . . . . . . . . . . . . . . . . . . . . . . . . . 2,596,338.91 6,021,217.20 4,796,249.99 March 2027 . . . . . . . . . . . . . . . . . . . . . . . . . . . . . . . . 2,566,440.48 5,850,549.93 4,628,506.91 April 2027 . . . . . . . . . . . . . . . . . . . . . . . . . . . . . . . . . 2,536,725.84 5,684,648.73 4,466,574.33 May 2027 . . . . . . . . . . . . . . . . . . . . . . . . . . . . . . . . . 2,507,193.85 5,523,382.04 4,310,252.51 June 2027 . . . . . . . . . . . . . . . . . . . . . . . . . . . . . . . . . 2,477,843.33 5,366,621.90 4,159,348.54 July 2027 . . . . . . . . . . . . . . . . . . . . . . . . . . . . . . . . . . 2,448,673.16 5,214,243.82 4,013,676.12 August 2027 . . . . . . . . . . . . . . . . . . . . . . . . . . . . . . . 2,419,682.19 5,066,126.77 3,873,055.29 September 2027 . . . . . . . . . . . . . . . . . . . . . . . . . . . . 2,390,869.27 4,922,152.98 3,737,312.25 October 2027 . . . . . . . . . . . . . . . . . . . . . . . . . . . . . . 2,362,233.30 4,782,207.94 3,606,279.13 November 2027 . . . . . . . . . . . . . . . . . . . . . . . . . . . . 2,333,773.14 4,646,180.26 3,479,793.83 December 2027 . . . . . . . . . . . . . . . . . . . . . . . . . . . . 2,305,487.68 4,513,961.60 3,357,699.76 January 2028 . . . . . . . . . . . . . . . . . . . . . . . . . . . . . . . 2,277,375.82 4,385,446.58 3,239,845.70 February 2028 . . . . . . . . . . . . . . . . . . . . . . . . . . . . . 2,249,436.45 4,260,532.74 3,126,085.60
S-II-10

Classes KU, KW, Classes DP and DQ Classes QA and QP UH and ZU
Distribution Date (in the aggregate) (in the aggregate) (in the aggregate)
March 2028 . . . . . . . . . . . . . . . . . . . . . . . . . . . . . . . . $2,221,668.48 $ 4,139,120.38 $ 3,016,278.42 April 2028 . . . . . . . . . . . . . . . . . . . . . . . . . . . . . . . . . 2,194,070.82 4,021,112.57 2,910,287.92 May 2028 . . . . . . . . . . . . . . . . . . . . . . . . . . . . . . . . . 2,166,776.95 3,906,415.03 2,807,982.56 June 2028 . . . . . . . . . . . . . . . . . . . . . . . . . . . . . . . . . 2,139,792.42 3,794,936.05 2,709,235.26 July 2028 . . . . . . . . . . . . . . . . . . . . . . . . . . . . . . . . . . 2,113,113.89 3,686,586.45 2,613,923.33 August 2028 . . . . . . . . . . . . . . . . . . . . . . . . . . . . . . . 2,086,738.06 3,581,279.49 2,521,928.27 September 2028 . . . . . . . . . . . . . . . . . . . . . . . . . . . . 2,060,661.67 3,478,930.82 2,433,135.62 October 2028 . . . . . . . . . . . . . . . . . . . . . . . . . . . . . . 2,034,881.49 3,379,458.38 2,347,434.88 November 2028 . . . . . . . . . . . . . . . . . . . . . . . . . . . . 2,009,394.33 3,282,782.39 2,264,719.29 December 2028 . . . . . . . . . . . . . . . . . . . . . . . . . . . . 1,984,197.02 3,188,825.26 2,184,885.79 January 2029 . . . . . . . . . . . . . . . . . . . . . . . . . . . . . . . 1,959,286.43 3,097,511.51 2,107,834.84 February 2029 . . . . . . . . . . . . . . . . . . . . . . . . . . . . . 1,934,659.47 3,008,767.75 2,033,470.30 March 2029 . . . . . . . . . . . . . . . . . . . . . . . . . . . . . . . . 1,910,313.07 2,922,522.60 1,961,699.35 April 2029 . . . . . . . . . . . . . . . . . . . . . . . . . . . . . . . . . 1,886,244.20 2,838,706.64 1,892,432.33 May 2029 . . . . . . . . . . . . . . . . . . . . . . . . . . . . . . . . . 1,862,449.86 2,757,252.37 1,825,582.68 June 2029 . . . . . . . . . . . . . . . . . . . . . . . . . . . . . . . . . 1,838,927.08 2,678,094.14 1,761,066.80 July 2029 . . . . . . . . . . . . . . . . . . . . . . . . . . . . . . . . . . 1,815,672.93 2,601,168.09 1,698,803.96 August 2029 . . . . . . . . . . . . . . . . . . . . . . . . . . . . . . . 1,792,684.49 2,526,412.14 1,638,716.20 September 2029 . . . . . . . . . . . . . . . . . . . . . . . . . . . . 1,769,958.89 2,453,765.92 1,580,728.23 October 2029 . . . . . . . . . . . . . . . . . . . . . . . . . . . . . . 1,747,493.28 2,383,170.69 1,524,767.38 November 2029 . . . . . . . . . . . . . . . . . . . . . . . . . . . . 1,725,284.85 2,314,569.36 1,470,763.43 December 2029 . . . . . . . . . . . . . . . . . . . . . . . . . . . . 1,703,330.81 2,247,906.40 1,418,648.60 January 2030 . . . . . . . . . . . . . . . . . . . . . . . . . . . . . . . 1,681,628.40 2,183,127.81 1,368,357.45 February 2030 . . . . . . . . . . . . . . . . . . . . . . . . . . . . . 1,660,174.89 2,120,181.07 1,319,826.76 March 2030 . . . . . . . . . . . . . . . . . . . . . . . . . . . . . . . . 1,638,967.58 2,059,015.12 1,272,995.51 April 2030 . . . . . . . . . . . . . . . . . . . . . . . . . . . . . . . . . 1,618,003.80 1,999,580.30 1,227,804.76 May 2030 . . . . . . . . . . . . . . . . . . . . . . . . . . . . . . . . . 1,597,280.91 1,941,828.33 1,184,197.61 June 2030 . . . . . . . . . . . . . . . . . . . . . . . . . . . . . . . . . 1,576,796.29 1,885,712.25 1,142,119.12 July 2030 . . . . . . . . . . . . . . . . . . . . . . . . . . . . . . . . . . 1,556,547.35 1,831,186.39 1,101,516.23 August 2030 . . . . . . . . . . . . . . . . . . . . . . . . . . . . . . . 1,536,531.53 1,778,206.36 1,062,337.70 September 2030 . . . . . . . . . . . . . . . . . . . . . . . . . . . . 1,516,746.29 1,726,728.97 1,024,534.09 October 2030 . . . . . . . . . . . . . . . . . . . . . . . . . . . . . . 1,497,189.13 1,676,712.25 988,057.63 November 2030 . . . . . . . . . . . . . . . . . . . . . . . . . . . . 1,477,857.57 1,628,115.37 952,862.20 December 2030 . . . . . . . . . . . . . . . . . . . . . . . . . . . . 1,458,749.15 1,580,898.63 918,903.28 January 2031 . . . . . . . . . . . . . . . . . . . . . . . . . . . . . . . 1,439,861.43 1,535,023.44 886,137.88 February 2031 . . . . . . . . . . . . . . . . . . . . . . . . . . . . . 1,421,192.02 1,490,452.26 854,524.49 March 2031 . . . . . . . . . . . . . . . . . . . . . . . . . . . . . . . . 1,402,738.54 1,447,148.59 824,023.03 April 2031 . . . . . . . . . . . . . . . . . . . . . . . . . . . . . . . . . 1,384,498.63 1,405,076.95 794,594.81 May 2031 . . . . . . . . . . . . . . . . . . . . . . . . . . . . . . . . . 1,366,469.97 1,364,202.83 766,202.47 June 2031 . . . . . . . . . . . . . . . . . . . . . . . . . . . . . . . . . 1,348,650.24 1,324,492.69 738,809.94 July 2031 . . . . . . . . . . . . . . . . . . . . . . . . . . . . . . . . . . 1,331,037.17 1,285,913.89 712,382.40 August 2031 . . . . . . . . . . . . . . . . . . . . . . . . . . . . . . . 1,313,628.51 1,248,434.73 686,886.21 September 2031 . . . . . . . . . . . . . . . . . . . . . . . . . . . . 1,296,422.02 1,212,024.37 662,288.93 October 2031 . . . . . . . . . . . . . . . . . . . . . . . . . . . . . . 1,279,415.49 1,176,652.80 638,559.21 November 2031 . . . . . . . . . . . . . . . . . . . . . . . . . . . . 1,262,606.73 1,142,290.89 615,666.79 December 2031 . . . . . . . . . . . . . . . . . . . . . . . . . . . . 1,245,993.59 1,108,910.28 593,582.47 January 2032 . . . . . . . . . . . . . . . . . . . . . . . . . . . . . . . 1,229,573.92 1,076,483.42 572,278.04
S-II-11

Classes KU, KW, Classes DP and DQ Classes QA and QP UH and ZU
Distribution Date (in the aggregate) (in the aggregate) (in the aggregate)
February 2032 . . . . . . . . . . . . . . . . . . . . . . . . . . . . . $1,213,345.60 $ 1,044,983.49 $ 551,726.27 March 2032 . . . . . . . . . . . . . . . . . . . . . . . . . . . . . . . . 1,197,306.55 1,014,384.46 531,900.89 April 2032 . . . . . . . . . . . . . . . . . . . . . . . . . . . . . . . . . 1,181,454.68 984,660.98 512,776.51 May 2032 . . . . . . . . . . . . . . . . . . . . . . . . . . . . . . . . . 1,165,787.95 955,788.44 494,328.64 June 2032 . . . . . . . . . . . . . . . . . . . . . . . . . . . . . . . . . 1,150,304.33 927,742.88 476,533.64 July 2032 . . . . . . . . . . . . . . . . . . . . . . . . . . . . . . . . . . 1,135,001.81 900,501.03 459,368.67 August 2032 . . . . . . . . . . . . . . . . . . . . . . . . . . . . . . . 1,119,878.41 874,040.25 442,811.69 September 2032 . . . . . . . . . . . . . . . . . . . . . . . . . . . . 1,104,932.15 848,338.54 426,841.43 October 2032 . . . . . . . . . . . . . . . . . . . . . . . . . . . . . . 1,090,161.09 823,374.51 411,437.36 November 2032 . . . . . . . . . . . . . . . . . . . . . . . . . . . . 1,075,563.31 799,127.36 396,579.64 December 2032 . . . . . . . . . . . . . . . . . . . . . . . . . . . . 1,061,136.91 775,576.87 382,249.13 January 2033 . . . . . . . . . . . . . . . . . . . . . . . . . . . . . . . 1,046,879.99 752,703.38 368,427.37 February 2033 . . . . . . . . . . . . . . . . . . . . . . . . . . . . . 1,032,790.71 730,487.79 355,096.52 March 2033 . . . . . . . . . . . . . . . . . . . . . . . . . . . . . . . . 1,018,867.20 708,911.51 342,239.36 April 2033 . . . . . . . . . . . . . . . . . . . . . . . . . . . . . . . . . 1,005,107.66 687,956.49 329,839.28 May 2033 . . . . . . . . . . . . . . . . . . . . . . . . . . . . . . . . . 991,510.26 667,605.16 317,880.23 June 2033 . . . . . . . . . . . . . . . . . . . . . . . . . . . . . . . . . 978,073.24 647,840.47 306,346.74 July 2033 . . . . . . . . . . . . . . . . . . . . . . . . . . . . . . . . . . 964,794.81 628,645.81 295,223.86 August 2033 . . . . . . . . . . . . . . . . . . . . . . . . . . . . . . . 951,673.23 610,005.06 284,497.17 September 2033 . . . . . . . . . . . . . . . . . . . . . . . . . . . . 938,706.77 591,902.54 274,152.73 October 2033 . . . . . . . . . . . . . . . . . . . . . . . . . . . . . . 925,893.72 574,323.00 264,177.12 November 2033 . . . . . . . . . . . . . . . . . . . . . . . . . . . . 913,232.38 557,251.63 254,557.35 December 2033 . . . . . . . . . . . . . . . . . . . . . . . . . . . . 900,721.09 540,674.02 245,280.92 January 2034 . . . . . . . . . . . . . . . . . . . . . . . . . . . . . . . 888,358.18 524,576.18 236,335.72 February 2034 . . . . . . . . . . . . . . . . . . . . . . . . . . . . . 876,142.00 508,944.49 227,710.11 March 2034 . . . . . . . . . . . . . . . . . . . . . . . . . . . . . . . . 864,070.95 493,765.72 219,392.81 April 2034 . . . . . . . . . . . . . . . . . . . . . . . . . . . . . . . . . 852,143.41 479,027.01 211,372.98 May 2034 . . . . . . . . . . . . . . . . . . . . . . . . . . . . . . . . . 840,357.79 464,715.87 203,640.11 June 2034 . . . . . . . . . . . . . . . . . . . . . . . . . . . . . . . . . 828,712.53 450,820.13 196,184.09 July 2034 . . . . . . . . . . . . . . . . . . . . . . . . . . . . . . . . . . 817,206.06 437,328.00 188,995.14 August 2034 . . . . . . . . . . . . . . . . . . . . . . . . . . . . . . . 805,836.85 424,227.99 182,063.85 September 2034 . . . . . . . . . . . . . . . . . . . . . . . . . . . . 794,603.38 411,508.94 175,381.12 October 2034 . . . . . . . . . . . . . . . . . . . . . . . . . . . . . . 783,504.14 399,160.00 168,938.15 November 2034 . . . . . . . . . . . . . . . . . . . . . . . . . . . . 772,537.65 387,170.64 162,726.48 December 2034 . . . . . . . . . . . . . . . . . . . . . . . . . . . . 761,702.42 375,530.61 156,737.94 January 2035 . . . . . . . . . . . . . . . . . . . . . . . . . . . . . . . 750,997.00 364,229.94 150,964.62 February 2035 . . . . . . . . . . . . . . . . . . . . . . . . . . . . . 740,419.94 353,258.96 145,398.91 March 2035 . . . . . . . . . . . . . . . . . . . . . . . . . . . . . . . . 729,969.83 342,608.26 140,033.47 April 2035 . . . . . . . . . . . . . . . . . . . . . . . . . . . . . . . . . 719,645.24 332,268.70 134,861.19 May 2035 . . . . . . . . . . . . . . . . . . . . . . . . . . . . . . . . . 709,444.78 322,231.38 129,875.23 June 2035 . . . . . . . . . . . . . . . . . . . . . . . . . . . . . . . . . 699,367.07 312,487.67 125,068.99 July 2035 . . . . . . . . . . . . . . . . . . . . . . . . . . . . . . . . . . 689,410.74 303,029.18 120,436.10 August 2035 . . . . . . . . . . . . . . . . . . . . . . . . . . . . . . . 679,574.44 293,847.74 115,970.39 September 2035 . . . . . . . . . . . . . . . . . . . . . . . . . . . . 669,856.82 284,935.43 111,665.95 October 2035 . . . . . . . . . . . . . . . . . . . . . . . . . . . . . . 660,256.57 276,284.53 107,517.03 November 2035 . . . . . . . . . . . . . . . . . . . . . . . . . . . . 650,772.37 267,887.57 103,518.12 December 2035 . . . . . . . . . . . . . . . . . . . . . . . . . . . . 641,402.93 259,737.26 99,663.88
S-II-12

Classes KU, KW, Classes DP and DQ Classes QA and QP UH and ZU
Distribution Date (in the aggregate) (in the aggregate) (in the aggregate)
January 2036 . . . . . . . . . . . . . . . . . . . . . . . . . . . . . . . $ 632,146.97 $ 251,826.52 $ 95,949.16 February 2036 . . . . . . . . . . . . . . . . . . . . . . . . . . . . . 623,003.21 244,148.49 92,369.01 March 2036 . . . . . . . . . . . . . . . . . . . . . . . . . . . . . . . . 613,970.41 236,696.48 88,918.63 April 2036 . . . . . . . . . . . . . . . . . . . . . . . . . . . . . . . . . 605,047.31 229,464.00 85,593.39 May 2036 . . . . . . . . . . . . . . . . . . . . . . . . . . . . . . . . . 596,232.70 222,444.74 82,388.85 June 2036 . . . . . . . . . . . . . . . . . . . . . . . . . . . . . . . . . 587,525.36 215,632.58 79,300.69 July 2036 . . . . . . . . . . . . . . . . . . . . . . . . . . . . . . . . . . 578,924.08 209,021.54 76,324.77 August 2036 . . . . . . . . . . . . . . . . . . . . . . . . . . . . . . . 570,427.67 202,605.84 73,457.07 September 2036 . . . . . . . . . . . . . . . . . . . . . . . . . . . . 562,034.97 196,379.87 70,693.74 October 2036 . . . . . . . . . . . . . . . . . . . . . . . . . . . . . . 553,744.80 190,338.14 68,031.05 November 2036 . . . . . . . . . . . . . . . . . . . . . . . . . . . . 545,556.01 184,475.34 65,465.39 December 2036 . . . . . . . . . . . . . . . . . . . . . . . . . . . . 537,467.47 178,786.33 62,993.31 January 2037 . . . . . . . . . . . . . . . . . . . . . . . . . . . . . . . 529,478.05 173,266.07 60,611.44 February 2037 . . . . . . . . . . . . . . . . . . . . . . . . . . . . . 521,586.63 167,909.69 58,316.57 March 2037 . . . . . . . . . . . . . . . . . . . . . . . . . . . . . . . . 513,792.10 162,712.46 56,105.57 April 2037 . . . . . . . . . . . . . . . . . . . . . . . . . . . . . . . . . 506,093.39 157,669.78 53,975.43 May 2037 . . . . . . . . . . . . . . . . . . . . . . . . . . . . . . . . . 498,489.41 152,777.18 51,923.27 June 2037 . . . . . . . . . . . . . . . . . . . . . . . . . . . . . . . . . 490,979.09 148,030.30 49,946.28 July 2037 . . . . . . . . . . . . . . . . . . . . . . . . . . . . . . . . . . 483,561.37 143,424.94 48,041.77 August 2037 . . . . . . . . . . . . . . . . . . . . . . . . . . . . . . . 476,235.21 138,956.98 46,207.12 September 2037 . . . . . . . . . . . . . . . . . . . . . . . . . . . . 468,999.58 134,622.45 44,439.83 October 2037 . . . . . . . . . . . . . . . . . . . . . . . . . . . . . . 461,853.46 130,417.47 42,737.48 November 2037 . . . . . . . . . . . . . . . . . . . . . . . . . . . . 454,795.83 126,338.28 41,097.73 December 2037 . . . . . . . . . . . . . . . . . . . . . . . . . . . . 447,825.69 122,381.22 39,518.33 January 2038 . . . . . . . . . . . . . . . . . . . . . . . . . . . . . . . 440,942.05 118,542.75 37,997.10 February 2038 . . . . . . . . . . . . . . . . . . . . . . . . . . . . . 434,143.93 114,819.41 36,531.95 March 2038 . . . . . . . . . . . . . . . . . . . . . . . . . . . . . . . . 427,430.37 111,207.86 35,120.85 April 2038 . . . . . . . . . . . . . . . . . . . . . . . . . . . . . . . . . 420,800.40 107,704.83 33,761.85 May 2038 . . . . . . . . . . . . . . . . . . . . . . . . . . . . . . . . . 414,253.08 104,307.17 32,453.08 June 2038 . . . . . . . . . . . . . . . . . . . . . . . . . . . . . . . . . 407,787.47 101,011.80 31,192.72 July 2038 . . . . . . . . . . . . . . . . . . . . . . . . . . . . . . . . . . 401,402.64 97,815.74 29,979.01 August 2038 . . . . . . . . . . . . . . . . . . . . . . . . . . . . . . . 395,097.68 94,716.08 28,810.27 September 2038 . . . . . . . . . . . . . . . . . . . . . . . . . . . . 388,871.67 91,710.01 27,684.87 October 2038 . . . . . . . . . . . . . . . . . . . . . . . . . . . . . . 382,723.72 88,794.80 26,601.25 November 2038 . . . . . . . . . . . . . . . . . . . . . . . . . . . . 376,652.94 85,967.78 25,557.88 December 2038 . . . . . . . . . . . . . . . . . . . . . . . . . . . . 370,658.46 83,226.37 24,553.31 January 2039 . . . . . . . . . . . . . . . . . . . . . . . . . . . . . . . 364,739.39 80,568.06 23,586.13 February 2039 . . . . . . . . . . . . . . . . . . . . . . . . . . . . . 358,894.89 77,990.42 22,654.98 March 2039 . . . . . . . . . . . . . . . . . . . . . . . . . . . . . . . . 353,124.10 75,491.08 21,758.55 April 2039 . . . . . . . . . . . . . . . . . . . . . . . . . . . . . . . . . 347,426.18 73,067.74 20,895.59 May 2039 . . . . . . . . . . . . . . . . . . . . . . . . . . . . . . . . . 341,800.30 70,718.17 20,064.86 June 2039 . . . . . . . . . . . . . . . . . . . . . . . . . . . . . . . . . 336,245.64 68,440.19 19,265.20 July 2039 . . . . . . . . . . . . . . . . . . . . . . . . . . . . . . . . . . 330,761.38 66,231.71 18,495.48 August 2039 . . . . . . . . . . . . . . . . . . . . . . . . . . . . . . . 325,346.71 64,090.67 17,754.60 September 2039 . . . . . . . . . . . . . . . . . . . . . . . . . . . . 320,000.84 62,015.08 17,041.52 October 2039 . . . . . . . . . . . . . . . . . . . . . . . . . . . . . . 314,722.98 60,003.02 16,355.21 November 2039 . . . . . . . . . . . . . . . . . . . . . . . . . . . . 309,512.36 58,052.62 15,694.69
S-II-13

Classes KU, KW, Classes DP and DQ Classes QA and QP UH and ZU
Distribution Date (in the aggregate) (in the aggregate) (in the aggregate)
December 2039 . . . . . . . . . . . . . . . . . . . . . . . . . . . . $ 304,368.19 $ 56,162.04 $ 15,059.03 January 2040 . . . . . . . . . . . . . . . . . . . . . . . . . . . . . . . 299,289.73 54,329.53 14,447.32 February 2040 . . . . . . . . . . . . . . . . . . . . . . . . . . . . . 294,276.20 52,553.36 13,858.67 March 2040 . . . . . . . . . . . . . . . . . . . . . . . . . . . . . . . . 289,326.88 50,831.87 13,292.25 April 2040 . . . . . . . . . . . . . . . . . . . . . . . . . . . . . . . . . 284,441.01 49,163.44 12,747.23 May 2040 . . . . . . . . . . . . . . . . . . . . . . . . . . . . . . . . . 279,617.87 47,546.49 12,222.83 June 2040 . . . . . . . . . . . . . . . . . . . . . . . . . . . . . . . . . 274,856.73 45,979.49 11,718.30 July 2040 . . . . . . . . . . . . . . . . . . . . . . . . . . . . . . . . . . 270,156.89 44,460.96 11,232.90 August 2040 . . . . . . . . . . . . . . . . . . . . . . . . . . . . . . . 265,517.64 42,989.47 10,765.92 September 2040 . . . . . . . . . . . . . . . . . . . . . . . . . . . . 260,938.27 41,563.61 10,316.70 October 2040 . . . . . . . . . . . . . . . . . . . . . . . . . . . . . . 256,418.09 40,182.02 9,884.57 November 2040 . . . . . . . . . . . . . . . . . . . . . . . . . . . . 251,956.43 38,843.39 9,468.91 December 2040 . . . . . . . . . . . . . . . . . . . . . . . . . . . . 247,552.61 37,546.42 9,069.11 January 2041 . . . . . . . . . . . . . . . . . . . . . . . . . . . . . . . 243,205.94 36,289.89 8,684.57 February 2041 . . . . . . . . . . . . . . . . . . . . . . . . . . . . . 238,915.79 35,072.58 8,314.75 March 2041 . . . . . . . . . . . . . . . . . . . . . . . . . . . . . . . . 234,681.48 33,893.32 7,959.08 April 2041 . . . . . . . . . . . . . . . . . . . . . . . . . . . . . . . . . 230,502.38 32,750.97 7,617.05 May 2041 . . . . . . . . . . . . . . . . . . . . . . . . . . . . . . . . . 226,377.84 31,644.42 7,288.16 June 2041 . . . . . . . . . . . . . . . . . . . . . . . . . . . . . . . . . 222,307.23 30,572.60 6,971.90 July 2041 . . . . . . . . . . . . . . . . . . . . . . . . . . . . . . . . . . 218,289.92 29,534.47 6,667.83 August 2041 . . . . . . . . . . . . . . . . . . . . . . . . . . . . . . . 214,325.30 28,529.02 6,375.47 September 2041 . . . . . . . . . . . . . . . . . . . . . . . . . . . . 210,412.75 27,555.26 6,094.40 October 2041 . . . . . . . . . . . . . . . . . . . . . . . . . . . . . . 206,551.66 26,612.24 5,824.19 November 2041 . . . . . . . . . . . . . . . . . . . . . . . . . . . . 202,741.44 25,699.04 5,564.45 December 2041 . . . . . . . . . . . . . . . . . . . . . . . . . . . . 198,981.49 24,814.75 5,314.77 January 2042 . . . . . . . . . . . . . . . . . . . . . . . . . . . . . . . 195,271.23 23,958.51 5,074.79 February 2042 . . . . . . . . . . . . . . . . . . . . . . . . . . . . . 191,610.07 23,129.46 4,844.14 March 2042 . . . . . . . . . . . . . . . . . . . . . . . . . . . . . . . . 187,997.45 22,326.78 4,622.47 April 2042 . . . . . . . . . . . . . . . . . . . . . . . . . . . . . . . . . 184,432.79 21,549.68 4,409.44 May 2042 . . . . . . . . . . . . . . . . . . . . . . . . . . . . . . . . . 180,915.54 20,797.39 4,204.74 June 2042 . . . . . . . . . . . . . . . . . . . . . . . . . . . . . . . . . 177,445.14 20,069.13 4,008.05 July 2042 . . . . . . . . . . . . . . . . . . . . . . . . . . . . . . . . . . 174,021.04 19,364.20 3,819.06 August 2042 . . . . . . . . . . . . . . . . . . . . . . . . . . . . . . . 170,642.69 18,681.88 3,637.49 September 2042 . . . . . . . . . . . . . . . . . . . . . . . . . . . . 167,309.57 18,021.48 3,463.06 October 2042 . . . . . . . . . . . . . . . . . . . . . . . . . . . . . . 164,021.14 17,382.33 3,295.49 November 2042 . . . . . . . . . . . . . . . . . . . . . . . . . . . . 160,776.88 16,763.79 3,134.54 December 2042 . . . . . . . . . . . . . . . . . . . . . . . . . . . . 157,576.26 16,165.22 2,979.94 January 2043 . . . . . . . . . . . . . . . . . . . . . . . . . . . . . . . 154,418.77 15,586.03 2,831.47 February 2043 . . . . . . . . . . . . . . . . . . . . . . . . . . . . . 151,303.91 15,025.60 2,688.88 March 2043 . . . . . . . . . . . . . . . . . . . . . . . . . . . . . . . . 148,231.17 14,483.38 2,551.96 April 2043 . . . . . . . . . . . . . . . . . . . . . . . . . . . . . . . . . 145,200.06 13,958.80 2,420.49 May 2043 . . . . . . . . . . . . . . . . . . . . . . . . . . . . . . . . . 142,210.08 13,451.31 2,294.25 June 2043 . . . . . . . . . . . . . . . . . . . . . . . . . . . . . . . . . 139,260.75 12,960.40 2,173.07 July 2043 . . . . . . . . . . . . . . . . . . . . . . . . . . . . . . . . . . 136,351.58 12,485.56 2,056.73 August 2043 . . . . . . . . . . . . . . . . . . . . . . . . . . . . . . . 133,482.11 12,026.29 1,945.05 September 2043 . . . . . . . . . . . . . . . . . . . . . . . . . . . . 130,651.86 11,582.10 1,837.87 October 2043 . . . . . . . . . . . . . . . . . . . . . . . . . . . . . . 127,860.37 11,152.54 1,735.00
S-II-14

Classes KU, KW, Classes DP and DQ Classes QA and QP UH and ZU
Distribution Date (in the aggregate) (in the aggregate) (in the aggregate)
November 2043 . . . . . . . . . . . . . . . . . . . . . . . . . . . . $ 125,107.18 $ 10,737.15 $ 1,636.28 December 2043 . . . . . . . . . . . . . . . . . . . . . . . . . . . . 122,391.83 10,335.49 1,541.55 January 2044 . . . . . . . . . . . . . . . . . . . . . . . . . . . . . . . 119,713.87 9,947.14 1,450.66 February 2044 . . . . . . . . . . . . . . . . . . . . . . . . . . . . . 117,072.87 9,571.69 1,363.46 March 2044 . . . . . . . . . . . . . . . . . . . . . . . . . . . . . . . . 114,468.37 9,208.73 1,279.81 April 2044 . . . . . . . . . . . . . . . . . . . . . . . . . . . . . . . . . 111,899.95 8,857.87 1,199.57 May 2044 . . . . . . . . . . . . . . . . . . . . . . . . . . . . . . . . . 109,367.17 8,518.74 1,122.61 June 2044 . . . . . . . . . . . . . . . . . . . . . . . . . . . . . . . . . 106,869.61 8,190.98 1,048.80 July 2044 . . . . . . . . . . . . . . . . . . . . . . . . . . . . . . . . . . 104,406.85 7,874.22 978.03 August 2044 . . . . . . . . . . . . . . . . . . . . . . . . . . . . . . . 101,978.48 7,568.12 910.17 September 2044 . . . . . . . . . . . . . . . . . . . . . . . . . . . . 99,584.07 7,272.36 845.11 October 2044 . . . . . . . . . . . . . . . . . . . . . . . . . . . . . . 97,223.23 6,986.59 782.74 November 2044 . . . . . . . . . . . . . . . . . . . . . . . . . . . . 94,895.56 6,710.52 722.96 December 2044 . . . . . . . . . . . . . . . . . . . . . . . . . . . . 92,600.65 6,443.84 665.66 January 2045 . . . . . . . . . . . . . . . . . . . . . . . . . . . . . . . 90,338.11 6,186.24 610.75 February 2045 . . . . . . . . . . . . . . . . . . . . . . . . . . . . . 88,107.56 5,937.45 558.14 March 2045 . . . . . . . . . . . . . . . . . . . . . . . . . . . . . . . . 85,908.60 5,697.19 507.74 April 2045 . . . . . . . . . . . . . . . . . . . . . . . . . . . . . . . . . 83,740.87 5,465.18 459.45 May 2045 . . . . . . . . . . . . . . . . . . . . . . . . . . . . . . . . . 81,603.97 5,241.16 413.20 June 2045 . . . . . . . . . . . . . . . . . . . . . . . . . . . . . . . . . 79,497.55 5,024.89 368.90 July 2045 . . . . . . . . . . . . . . . . . . . . . . . . . . . . . . . . . . 77,421.23 4,816.11 326.49 August 2045 . . . . . . . . . . . . . . . . . . . . . . . . . . . . . . . 75,374.65 4,614.58 285.87 September 2045 . . . . . . . . . . . . . . . . . . . . . . . . . . . . 73,357.44 4,420.08 246.99 October 2045 . . . . . . . . . . . . . . . . . . . . . . . . . . . . . . 71,369.27 4,232.38 209.78 November 2045 . . . . . . . . . . . . . . . . . . . . . . . . . . . . 69,409.76 4,051.27 174.16 December 2045 . . . . . . . . . . . . . . . . . . . . . . . . . . . . 67,478.58 3,876.52 140.08 January 2046 . . . . . . . . . . . . . . . . . . . . . . . . . . . . . . . 65,575.39 3,707.94 107.47 February 2046 . . . . . . . . . . . . . . . . . . . . . . . . . . . . . 63,699.83 3,545.33 76.27 March 2046 . . . . . . . . . . . . . . . . . . . . . . . . . . . . . . . . 61,851.58 3,388.50 46.43 April 2046 . . . . . . . . . . . . . . . . . . . . . . . . . . . . . . . . . 60,030.30 3,237.25 17.90 May 2046 . . . . . . . . . . . . . . . . . . . . . . . . . . . . . . . . . 58,235.67 3,091.42 0.00 June 2046 . . . . . . . . . . . . . . . . . . . . . . . . . . . . . . . . . 56,467.36 2,950.82 0.00 July 2046 . . . . . . . . . . . . . . . . . . . . . . . . . . . . . . . . . . 54,725.05 2,815.28 0.00 August 2046 . . . . . . . . . . . . . . . . . . . . . . . . . . . . . . . 53,008.41 2,684.65 0.00 September 2046 . . . . . . . . . . . . . . . . . . . . . . . . . . . . 51,317.15 2,558.75 0.00 October 2046 . . . . . . . . . . . . . . . . . . . . . . . . . . . . . . 49,650.94 2,437.44 0.00 November 2046 . . . . . . . . . . . . . . . . . . . . . . . . . . . . 48,009.48 2,320.57 0.00 December 2046 . . . . . . . . . . . . . . . . . . . . . . . . . . . . 46,392.46 2,207.98 0.00 January 2047 . . . . . . . . . . . . . . . . . . . . . . . . . . . . . . . 44,799.59 2,099.55 0.00 February 2047 . . . . . . . . . . . . . . . . . . . . . . . . . . . . . 43,230.57 1,995.13 0.00 March 2047 . . . . . . . . . . . . . . . . . . . . . . . . . . . . . . . . 41,685.10 1,894.59 0.00 April 2047 . . . . . . . . . . . . . . . . . . . . . . . . . . . . . . . . . 40,162.90 1,797.80 0.00 May 2047 . . . . . . . . . . . . . . . . . . . . . . . . . . . . . . . . . 38,663.68 1,704.64 0.00 June 2047 . . . . . . . . . . . . . . . . . . . . . . . . . . . . . . . . . 37,187.15 1,614.99 0.00 July 2047 . . . . . . . . . . . . . . . . . . . . . . . . . . . . . . . . . . 35,733.04 1,528.73 0.00 August 2047 . . . . . . . . . . . . . . . . . . . . . . . . . . . . . . . 34,301.06 1,445.75 0.00 September 2047 . . . . . . . . . . . . . . . . . . . . . . . . . . . . 32,890.94 1,365.93 0.00
S-II-15

Classes KU, KW, Classes DP and DQ Classes QA and QP UH and ZU
Distribution Date (in the aggregate) (in the aggregate) (in the aggregate)
October 2047 . . . . . . . . . . . . . . . . . . . . . . . . . . . . . . $ 31,502.42 $ 1,289.18 $ 0.00 November 2047 . . . . . . . . . . . . . . . . . . . . . . . . . . . . 30,135.22 1,215.39 0.00 December 2047 . . . . . . . . . . . . . . . . . . . . . . . . . . . . 28,789.08 1,144.47 0.00 January 2048 . . . . . . . . . . . . . . . . . . . . . . . . . . . . . . . 27,463.73 1,076.30 0.00 February 2048 . . . . . . . . . . . . . . . . . . . . . . . . . . . . . 26,158.93 1,010.81 0.00 March 2048 . . . . . . . . . . . . . . . . . . . . . . . . . . . . . . . . 24,874.40 947.90 0.00 April 2048 . . . . . . . . . . . . . . . . . . . . . . . . . . . . . . . . . 23,609.90 887.48 0.00 May 2048 . . . . . . . . . . . . . . . . . . . . . . . . . . . . . . . . . 22,365.19 829.46 0.00 June 2048 . . . . . . . . . . . . . . . . . . . . . . . . . . . . . . . . . 21,140.00 773.78 0.00 July 2048 . . . . . . . . . . . . . . . . . . . . . . . . . . . . . . . . . . 19,934.10 720.34 0.00 August 2048 . . . . . . . . . . . . . . . . . . . . . . . . . . . . . . . 18,747.24 669.07 0.00 September 2048 . . . . . . . . . . . . . . . . . . . . . . . . . . . . 17,579.19 619.89 0.00 October 2048 . . . . . . . . . . . . . . . . . . . . . . . . . . . . . . 16,429.71 572.74 0.00 November 2048 . . . . . . . . . . . . . . . . . . . . . . . . . . . . 15,298.56 527.54 0.00 December 2048 . . . . . . . . . . . . . . . . . . . . . . . . . . . . 14,185.52 484.22 0.00 January 2049 . . . . . . . . . . . . . . . . . . . . . . . . . . . . . . . 13,090.35 442.72 0.00 February 2049 . . . . . . . . . . . . . . . . . . . . . . . . . . . . . 12,012.84 402.98 0.00 March 2049 . . . . . . . . . . . . . . . . . . . . . . . . . . . . . . . . 10,952.75 364.93 0.00 April 2049 . . . . . . . . . . . . . . . . . . . . . . . . . . . . . . . . . 9,909.86 328.51 0.00 May 2049 . . . . . . . . . . . . . . . . . . . . . . . . . . . . . . . . . 8,883.97 293.68 0.00 June 2049 . . . . . . . . . . . . . . . . . . . . . . . . . . . . . . . . . 7,874.85 260.36 0.00 July 2049 . . . . . . . . . . . . . . . . . . . . . . . . . . . . . . . . . . 6,882.29 228.51 0.00 August 2049 . . . . . . . . . . . . . . . . . . . . . . . . . . . . . . . 5,906.08 198.08 0.00 September 2049 . . . . . . . . . . . . . . . . . . . . . . . . . . . . 4,946.00 169.01 0.00 October 2049 . . . . . . . . . . . . . . . . . . . . . . . . . . . . . . 4,001.87 141.25 0.00 November 2049 . . . . . . . . . . . . . . . . . . . . . . . . . . . . 3,073.46 114.77 0.00 December 2049 . . . . . . . . . . . . . . . . . . . . . . . . . . . . 2,160.59 89.50 0.00 January 2050 . . . . . . . . . . . . . . . . . . . . . . . . . . . . . . . 1,263.04 65.42 0.00 February 2050 . . . . . . . . . . . . . . . . . . . . . . . . . . . . . 380.64 42.47 0.00 March 2050 . . . . . . . . . . . . . . . . . . . . . . . . . . . . . . . . 0.00 20.61 0.00 April 2050 and thereafter . . . . . . . . . . . . . . . . . . . . . 0.00 0.00 0.00
S-II-16

Ex
hib
it A
Un
der
lyin
g C
erti
fica
tes
Ori
gin
alP
rin
cip
al
Pri
nci
pal
Tru
st A
sset
Fi
nal
o
r N
oti
on
al
Un
der
lyin
g o
r N
oti
on
al
Per
cen
tage
G
inn
ie
Gro
up
C
USI
P
Inte
rest
In
tere
st
Dis
trib
uti
on
P
rin
cip
al
Bal
ance
of
Cer
tifi
cate
B
alan
ce
of
Cla
ss
Mae
o
r Su
bgr
ou
p
Issu
er
Seri
es
Cla
ss
Issu
e D
ate
Nu
mb
er
Rat
e T
ype(
1)
Dat
e T
ype(
1)
Cla
ss
Fact
or(
2)
in T
rust
in
Tru
st
Io
rII
2 G
inni
e M
ae
2017
-098
Q
I(3)
(5)
June
30,
201
7 38
380C
7A5
3.5%
FI
X/I
O
June
204
7 N
TL(
PAC
I/A
D)
$ 81
,266
,000
0.
6049
3177
$
4,40
7,36
0 8.
9652
6714
74%
II
2
Gin
nie
Mae
20
17-1
18
JI(3
)(5)
Aug
ust 30
, 201
7 38
380G
QP2
3.
5 FI
X/I
O
July
204
7 N
TL(
PAC/A
D)
90,5
19,4
28
0.59
5823
77
21,9
68,8
74
40.7
3316
6144
2 II
2
Gin
nie
Mae
20
17-1
32
DI(
5)
Septe
mbe
r 29
, 201
7 38
380G
ZJ6
3.
5 FI
X/I
O
Septe
mbe
r 20
47
NTL(
PAC/A
D)
9,07
4,00
0 0.
5892
7185
5,
347,
052
100.
0000
0000
00
II
2 G
inni
e M
ae
2017
-147
IA
(5)
Septe
mbe
r 29
, 201
7 38
380G
4K7
3.5
FIX/I
O
Septe
mbe
r 20
47
NTL(
PAC/A
D)
12,0
42,2
85
0.60
5069
12
7,28
6,41
5 10
0.00
0000
0000
II
2
Gin
nie
Mae
20
17-1
50
IO(3
)(5)
(6)
Oct
ober
30,
201
7 38
380G
7S7
3.5
FIX/I
O
Oct
ober
204
7 N
TL(
SC/P
T/P
AC
I)
82,3
13,1
27
0.56
6010
86
46,5
90,1
24
100.
0000
0000
00
II
2 G
inni
e M
ae
2018
-022
ID
(5)
Febr
uary
28,
201
8 38
380K
A21
3.
5 FI
X/I
O
Febr
uary
204
8 N
TL(
PAC/A
D)
10,2
63,8
57
0.62
0231
50
6,36
5,96
7 10
0.00
0000
0000
II
5
Gin
nie
Mae
20
19-0
16
A
Febr
uary
28,
201
9 38
381R
GM
5 3.
5 FI
X
Febr
uary
204
9 PT
24
,091
,480
0.
9388
3498
22
,617
,924
10
0.00
0000
0000
II
6A
G
inni
e M
ae
2019
-061
JS
(7)
May
30,
201
9 38
381V
QU
7 (4
) IN
V/I
O
Janu
ary
2044
N
TL(
SC/P
T)
19,7
86,1
75
0.81
6227
12
16,1
50,0
12
100.
0000
0000
00
II
6B
Gin
nie
Mae
20
16-0
04
SK
Janu
ary
29, 2
016
3837
9TV71
(4
) IN
V/I
O
Janu
ary
2046
N
TL(
PT)
26,1
23,9
94
0.36
3928
03
9,50
7,25
3 10
0.00
0000
0000
II
6C
G
inni
e M
ae
2010
-047
SL
April 3
0, 2
010
3837
6YD
81
(4)
INV/I
O
April 2
040
NTL(
PT)
200,
000,
000
0.09
6126
35
19,2
25,2
70
100.
0000
0000
00
II
6D
Gin
nie
Mae
20
18-1
22
SH(8
) Se
pte
mbe
r 28
, 201
8 38
380Y
P25
(4)
INV/I
O
May
204
0 N
TL(
SC/P
T)
57,3
68,3
83
0.72
7973
97
41,7
62,6
89
100.
0000
0000
00
II
6E
Gin
nie
Mae
20
10-0
58
AI
May
28,
201
0 38
377F
ZW
4 (4
) IN
V/I
O
May
204
0 N
TL(
PT)
200,
000,
000
0.10
1455
08
20,2
91,0
16
100.
0000
0000
00
II
6F
Gin
nie
Mae
20
17-1
60
SK(3
)(9)
O
ctob
er 3
0, 2
017
3838
0HY
S5
(4)
INV/I
O
June
204
0 N
TL(
SC/P
T)
36,4
20,6
52
0.60
1387
29
21,9
02,9
17
100.
0000
0000
00
II
6G
Gin
nie
Mae
20
18-1
51
ST(1
0)
Nov
embe
r 30
, 201
8 38
381A
D52
(4
) IN
V/I
O
July
204
3 N
TL(
SC/P
T)
24,4
22,4
69
0.74
6690
29
18,2
36,0
20
100.
0000
0000
00
II
6H
Gin
nie
Mae
20
10-0
62
SD
May
28,
201
0 38
377F
JA0
(4)
INV/I
O
May
204
0 N
TL(
PT)
100,
000,
000
0.09
6352
65
5,41
3,51
7 56
.184
4220
000
II
6I
Gin
nie
Mae
20
17-0
60
SM(1
1)
April 2
8, 2
017
3837
6UFB
0 (4
) IN
V/I
O
May
204
0 N
TL(
SC/P
T)
17,4
30,4
93
0.52
8753
84
9,21
6,44
0 10
0.00
0000
0000
II
6I
G
inni
e M
ae
2019
-048
S(
12)
April 3
0, 2
019
3838
1R6T
1 (4
) IN
V/I
O
April 2
041
NTL(
SC/P
T)
40,3
21,2
33
0.79
6879
88
32,1
31,1
79
100.
0000
0000
00
II
6J
Gin
nie
Mae
20
11-0
75
SJ
May
27,
201
1 38
377W
EW0
(4)
INV/I
O
May
204
1 N
TL(
PT)
115,
000,
000
0.10
0207
95
11,5
23,9
14
100.
0000
0000
00
II
6K
Gin
nie
Mae
20
11-0
51
DS
April 2
9, 2
011
3837
7VCH
7 (4
) IN
V/I
O
April 2
041
NTL(
PAC/A
D)
100,
284,
666
0.12
8727
92
9,82
3,18
4 76
.093
0549
442
II
6L
Gin
nie
Mae
20
13-1
47
CS(
13)
Oct
ober
30,
201
3 38
378U
PC5
(4)
INV/I
O
Dec
embe
r 20
39
NTL(
SC/P
AC)
66,8
85,5
61
0.24
7225
24
16,5
35,7
98
100.
0000
0000
00
II
8 G
inni
e M
ae
2018
-013
D
B
Janu
ary
30, 2
018
3838
0UVR1
3.0
FIX
Ja
nuar
y 20
48
PT
176,
915,
551
0.66
3735
50
117,
425,
131
100.
0000
0000
00
II
13A
G
inni
e M
ae
2010
-109
SB
Aug
ust 30
, 201
0 38
377J
AV5
(4)
INV/I
O
Aug
ust 20
40
NTL(
PT)
83,3
33,3
33
0.11
4935
15
9,50
8,96
8 99
.279
9999
971
II
13B
G
inni
e M
ae
2010
-107
N
S Aug
ust 30
, 201
0 38
377J
GE7
(4
) IN
V/I
O
Aug
ust 20
40
NTL(
PT)
33,3
33,3
33
0.11
4564
74
3,81
8,82
4 10
0.00
0000
0000
II
13
C
Gin
nie
Mae
20
10-1
67
SL(3
) D
ecem
ber 29
, 201
0 38
377N
XM
1 (4
) IN
V/I
O
Dec
embe
r 20
40
NTL(
PT)
75,2
34,8
80
0.19
1700
53
12,9
17,7
17
89.5
6600
9808
2 II
13
C
Gin
nie
Mae
20
11-1
28
SA
Septe
mbe
r 30
, 201
1 38
377Y
BD
1 (4
) IN
V/I
O
Septe
mbe
r 20
41
NTL(
PT)
51,2
40,9
26
0.26
2066
77
13,4
28,5
43
100.
0000
0000
00
II
13C
G
inni
e M
ae
2013
-099
SA
Ju
ly 3
0, 2
013
3837
8VQ
H1
(4)
INV/I
O
July
204
3 N
TL(
PT)
142,
857,
142
0.21
7017
64
31,0
02,5
19
100.
0000
0000
00
II
13D
G
inni
e M
ae
2013
-099
PS
Ju
ly 3
0, 2
013
3837
8VQ
G3
(4)
INV/I
O
July
204
3 N
TL(
PAC
I)
81,6
94,0
00
0.27
1068
34
22,1
44,6
56
100.
0000
0000
00
II
14A
G
inni
e M
ae
2018
-066
SY
(5)(
14)
May
30,
201
8 38
380W
5X3
(4)
INV/I
O
June
204
4 N
TL(
SC/P
T)
23,8
33,9
41
0.71
7991
48
17,1
12,5
66
100.
0000
0000
00
I 14
B
Gin
nie
Mae
20
15-1
37
SK(3
)(15
) Se
pte
mbe
r 30
, 201
5 38
379Q
CN
3 (4
) IN
V/I
O
Mar
ch 2
044
NTL(
SC/P
T/S
EQ/A
D)
21,4
85,6
31
0.66
0277
09
14,1
86,4
69
100.
0000
0000
00
I 14
C
Gin
nie
Mae
20
15-1
61
LS
Nov
embe
r 30
, 201
5 38
379F
UT4
(4)
INV/I
O
Nov
embe
r 20
45
NTL(
PT)
36,0
00,0
00
0.34
6217
17
12,4
63,8
18
100.
0000
0000
00
I 15
G
inni
e M
ae
2013
-172
S(
16)
Nov
embe
r 27
, 201
3 38
378Y
CJ6
(4
) IN
V/I
O
Oct
ober
204
3 N
TL(
SC/P
T)
44,6
19,6
18
0.31
9392
04
14,2
51,1
50
100.
0000
0000
00
I 15
G
inni
e M
ae
2014
-096
ST
Ju
ly 3
0, 2
014
3837
9CZ66
(4
) IN
V/I
O
July
204
4 N
TL(
PT)
35,8
79,9
09
0.26
1717
60
7,36
2,09
3 78
.400
1681
833
I 15
G
inni
e M
ae
2015
-099
CS(
17)
July
30,
201
5 38
379N
S45
(4)
INV/I
O
April 2
040
NTL(
SC/P
T)
38,3
20,9
66
0.31
8095
05
12,1
89,7
09
100.
0000
0000
00
I 15
G
inni
e M
ae
2018
-066
SX
(3)(
18)
May
30,
201
8 38
380W
7F0
(4)
INV/I
O
July
204
5 N
TL(
SC/P
T)
29,1
46,9
86
0.69
9236
99
20,3
80,6
50
100.
0000
0000
00
I 16
A
Gin
nie
Mae
20
19-0
18
QS
Febr
uary
28,
201
9 38
381B
2K9
(4)
INV/I
O
Febr
uary
204
9 N
TL(
PT)
40,8
73,5
12
0.60
1958
98
24,6
04,1
78
100.
0000
0000
00
II
16A
G
inni
e M
ae
2019
-018
SP
Fe
brua
ry 2
8, 2
019
3838
1BZ72
(4
) IN
V/I
O
Febr
uary
204
9 N
TL(
PT)
51,6
66,6
66
0.66
9798
29
34,6
06,2
44
100.
0000
0000
00
II
16A
G
inni
e M
ae
2019
-023
CS
Febr
uary
28,
201
9 38
381R
NL9
(4
) IN
V/I
O
Febr
uary
204
9 N
TL(
PT)
74,0
80,5
93
0.71
3174
75
52,8
32,4
08
100.
0000
0000
00
II
16A
G
inni
e M
ae
2019
-023
SV
(3)
Febr
uary
28,
201
9 38
381R
VJ5
(4
) IN
V/I
O
Febr
uary
204
9 N
TL(
PAC/A
D/P
T)
68,3
51,8
01
0.86
1692
51
58,8
98,2
35
100.
0000
0000
00 II
16
A
Gin
nie
Mae
20
19-0
29
HS
Mar
ch 2
9, 2
019
3838
1TFD
2 (4
) IN
V/I
O
Mar
ch 2
049
NTL(
PT)
48,3
04,8
42
0.79
9684
73
38,6
28,6
44
100.
0000
0000
00
II
16A
G
inni
e M
ae
2019
-031
CS
Mar
ch 2
9, 2
019
3838
1RY
B9
(4)
INV/I
O
Mar
ch 2
049
NTL(
PT)
75,3
18,1
22
0.75
4062
76
56,7
94,5
91
100.
0000
0000
00
II
16A
G
inni
e M
ae
2019
-038
K
S M
arch
29,
201
9 38
381R
U56
(4
) IN
V/I
O
Mar
ch 2
049
NTL(
PT)
20,8
00,0
00
0.79
8521
55
16,6
09,2
48
100.
0000
0000
00
II
16A
G
inni
e M
ae
2019
-052
SE
April 3
0, 2
019
3838
1VAY
6 (4
) IN
V/I
O
April 2
049
NTL(
PT)
86,3
00,6
74
0.75
6448
76
65,2
82,0
38
100.
0000
0000
00
II
16A
G
inni
e M
ae
2019
-054
SA
April 3
0, 2
019
3838
1R7F
0 (4
) IN
V/I
O
April 2
049
NTL(
PAC/A
D)
47,2
61,8
47
0.78
5618
19
37,1
29,7
67
100.
0000
0000
00
II
16B
G
inni
e M
ae
2019
-061
G
S(3)
(5)(
19)
May
30,
201
9 38
381V
ST8
(4)
INV/I
O
Janu
ary
2049
N
TL(
SC/P
T)
13,4
82,6
98
0.79
5004
95
10,7
18,8
11
100.
0000
0000
00
II
16B
G
inni
e M
ae
2019
-069
SD
Ju
ne 2
8, 2
019
3838
1WQ
N1
(4)
INV/I
O
June
204
9 N
TL(
PT)
129,
381,
716
0.81
5254
71
105,
479,
053
100.
0000
0000
00
II
16B
G
inni
e M
ae
2019
-096
AS
Aug
ust 30
, 201
9 38
381X
B88
(4
) IN
V/I
O
Aug
ust 20
49
NTL(
PT)
45,6
00,0
00
0.88
4919
46
40,3
52,3
27
100.
0000
0000
00
II
16B
G
inni
e M
ae
2019
-096
SP
Aug
ust 30
, 201
9 38
381X
C46
(4
) IN
V/I
O
Aug
ust 20
49
NTL(
PAC/A
D)
44,6
97,1
42
0.96
0524
10
42,9
32,6
82
100.
0000
0000
00
II
16C
G
inni
e M
ae
2018
-091
Q
S(20
) Ju
ly 3
0, 2
018
3838
0XXP7
(4
) IN
V/I
O
July
204
8 N
TL(
SC/P
T)
23,7
38,6
89
0.68
0870
07
16,1
62,9
62
100.
0000
0000
00
II
16C
G
inni
e M
ae
2018
-137
SN
O
ctob
er 3
0, 2
018
3838
1AQ
L3
(4)
INV/I
O
Oct
ober
204
8 N
TL(
PT)
103,
800,
103
0.74
2941
05
39,9
70,3
05
51.8
3049
0958
2 II
16
D
Gin
nie
Mae
20
18-0
72
SB
May
30,
201
8 38
380W
G29
(4
) IN
V/I
O
May
204
8 N
TL(
PT)
28,7
83,0
00
0.73
0688
77
21,0
31,4
15
100.
0000
0000
00
II
16D
G
inni
e M
ae
2018
-083
SN
Ju
ne 2
9, 2
018
3838
0XBK
2 (4
) IN
V/I
O
June
204
8 N
TL(
PT)
13,7
90,6
19
0.71
5158
99
9,86
2,48
5 10
0.00
0000
0000
II
16
D
Gin
nie
Mae
20
18-0
92
AS
July
30,
201
8 38
380X
SX6
(4)
INV/I
O
July
204
8 N
TL(
PT)
25,0
00,0
00
0.72
3205
00
18,0
80,1
25
100.
0000
0000
00
II
16D
G
inni
e M
ae
2018
-103
SY
Aug
ust 30
, 201
8 38
380Y
GY
5 (4
) IN
V/I
O
Aug
ust 20
48
NTL(
PT)
31,1
18,9
97
0.75
3466
64
23,4
47,1
26
100.
0000
0000
00
II
16D
G
inni
e M
ae
2018
-104
JS
Aug
ust 30
, 201
8 38
380X
3Z8
(4)
INV/I
O
Aug
ust 20
48
NTL(
PT)
41,6
66,6
66
0.76
3345
20
31,8
06,0
50
100.
0000
0000
00
II
16D
G
inni
e M
ae
2018
-104
SL
Aug
ust 30
, 201
8 38
380X
5R4
(4)
INV/I
O
Aug
ust 20
48
NTL(
PT)
80,1
30,9
49
0.74
4259
58
59,6
38,2
26
100.
0000
0000
00
II
16D
G
inni
e M
ae
2018
-115
SE
(3)
Aug
ust 30
, 201
8 38
380X
Y35
(4
) IN
V/I
O
Aug
ust 20
48
NTL(
PT)
33,5
29,6
24
0.78
8850
73
26,4
49,8
68
100.
0000
0000
00
II
16D
G
inni
e M
ae
2018
-125
JS
(3)
Septe
mbe
r 28
, 201
8 38
380Y
8J7
(4)
INV/I
O
Septe
mbe
r 20
48
NTL(
PT)
40,4
79,0
00
0.70
2412
24
17,8
96,7
61
62.9
4374
8610
4 II
16
D
Gin
nie
Mae
20
18-1
38
SB
Oct
ober
30,
201
8 38
381A
CP9
(4
) IN
V/I
O
Oct
ober
204
8 N
TL(
PT)
85,8
92,4
53
0.74
9183
73
49,3
65,5
54
76.7
1506
7155
0 II
16
E G
inni
e M
ae
2018
-053
SB
April 3
0, 2
018
3838
0V6M
8 (4
) IN
V/I
O
April 2
048
NTL(
PT)
41,5
26,7
60
0.75
8245
42
17,4
93,0
42
55.5
5555
5020
4 II
16
E G
inni
e M
ae
2018
-054
SA
April 3
0, 2
018
3838
0WBX6
(4)
INV/I
O
April 2
048
NTL(
PT)
90,0
00,0
00
0.69
5582
58
3,13
0,12
1 5.
0000
0000
00
II
21
Gin
nie
Mae
20
16-1
49
IG
Nov
embe
r 30
, 201
6 38
380B
VW
2 4.
0 FI
X/I
O
Nov
embe
r 20
46
NTL(
PT)
14,2
40,6
25
0.55
6914
66
7,93
0,81
3 10
0.00
0000
0000
II
21
G
inni
e M
ae
2018
-011
PI
(3)
Janu
ary
30, 2
018
3838
0UXS7
4.
0 FI
X/I
O
Dec
embe
r 20
47
NTL(
PAC/A
D)
84,8
89,2
50
0.72
8894
33
8,48
6,01
5 13
.714
7071
037
II
A-1

Ori
gin
alP
rin
cip
al
Pri
nci
pal
Tru
st A
sset
Fi
nal
o
r N
oti
on
al
Un
der
lyin
g o
r N
oti
on
al
Per
cen
tage
G
inn
ie
Gro
up
C
USI
P
Inte
rest
In
tere
st
Dis
trib
uti
on
P
rin
cip
al
Bal
ance
of
Cer
tifi
cate
B
alan
ce
of
Cla
ss
Mae
o
r Su
bgr
ou
p
Issu
er
Seri
es
Cla
ss
Issu
e D
ate
Nu
mb
er
Rat
e T
ype(
1)
Dat
e T
ype(
1)
Cla
ss
Fact
or(
2)
in T
rust
in
Tru
st
Io
rII
A-2
21
Gin
nie
Mae
20
20-0
04
HI(
3)
Janu
ary
30, 2
020
3838
2B4A
8 4.
0%
FIX/I
O
Oct
ober
204
9 N
TL(
PAC)
$ 16
,600
,425
0.
9930
1149
$
3,48
0,25
9 21
.112
4233
265%
II
21
G
inni
e M
ae
2020
-047
IC
April 3
0, 2
020
3838
2ECF2
4.
0 FI
X/I
O
April 2
050
NTL(
PT)
18,6
84,9
21
0.99
8515
41
18,6
57,1
81
100.
0000
0000
00
II
22
Gin
nie
Mae
20
07-0
25
KS(
3)
May
30,
200
7 38
375J
2E4
(4)
INV/I
O
May
203
7 N
TL(
PT)
49,2
75,0
00
0.06
8233
40
3,36
2,20
1 10
0.00
0000
0000
I
22
Gin
nie
Mae
20
09-0
85
SJ
Septe
mbe
r 30
, 200
9 38
376F
2M3
(4)
INV/I
O
Septe
mbe
r 20
39
NTL(
PAC/A
D)
75,0
00,0
00
0.04
1098
11
3,08
2,35
8 10
0.00
0000
0000
I
22
Gin
nie
Mae
20
10-0
11
SE
Janu
ary
29, 2
010
3837
6TZJ4
(4
) IN
V/I
O
Janu
ary
2040
N
TL(
PT)
35,2
60,0
92
0.07
3626
71
2,59
6,08
5 10
0.00
0000
0000
I
22
Gin
nie
Mae
20
16-0
31
BI(
21)
Mar
ch 3
0, 2
016
3837
9VVQ
4 5.
0 FI
X/I
O
Oct
ober
204
4 N
TL(
SC/P
T)
31,0
35,1
58
0.25
8758
23
8,03
0,60
3 10
0.00
0000
0000
II
22
G
inni
e M
ae
2016
-075
IO
(5)
May
27,
201
6 38
379Y
ET1
6.0
FIX/I
O
Septe
mbe
r 20
40
NTL(
PT)
28,8
25,6
40
0.35
2941
78
1,05
8,82
5 10
.407
4011
887
II
22
Gin
nie
Mae
20
17-0
88
DI
June
30,
201
7 38
380F
RC2
6.0
FIX/I
O
Janu
ary
2040
N
TL(
PT)
4,48
2,17
9 0.
3874
6385
1,
736,
682
100.
0000
0000
00
II
22
Gin
nie
Mae
20
18-0
65
IE
May
30,
201
8 38
380W
P94
6.5
FIX/I
O
May
204
8 N
TL(
PT)
4,26
1,94
3 0.
5661
1840
2,
412,
764
100.
0000
0000
00
II
25
Gin
nie
Mae
20
18-1
20
ED(3
) Se
pte
mbe
r 28
, 201
8 38
380Y
XM
2 3.
5 FI
X
Oct
ober
204
7 SE
Q
124,
150,
000
0.71
6282
03
11,4
60,5
12
12.8
8763
5924
3 II
(1)
As
defin
ed u
nder
“Cla
ss T
ypes
” in
Appen
dix
I to
the
Bas
e O
ffer
ing
Circu
lar.
(2
) U
nder
lyin
g Cer
tific
ate
Fact
ors
are
as o
f M
ay 2
020.
(3
) M
X C
lass
. (4
) The
Int
eres
t Rat
e w
ill b
e ca
lcul
ated
as
desc
ribe
d un
der
“Ter
ms
Shee
t —
Int
eres
t Rat
es”
in t
he r
elat
ed U
nder
lyin
g Cer
tific
ate
Discl
osur
e D
ocum
ent.
(5)
Mor
e th
an 1
0% o
f th
e M
ortg
age
Loan
s un
derlyi
ng thi
s U
nder
lyin
g Cer
tific
ate
may
be
high
er b
alan
ce M
ortg
age
Loan
s. S
ee “
Ris
k Fa
ctor
s” i
n
this
Su
pple
men
t. (6
) Cla
ss IO
is b
acke
d by
pre
viou
sly
issu
ed G
inni
e M
ae M
X c
ertif
icat
es, a
s ou
tline
d be
low
: �
MX
Cla
ss D
I from
201
7-09
6 �
MX
Cla
ss D
I from
201
7-11
0 �
MX
Cla
ss IL
from
201
7-13
7 (7
) Cla
ss JS
is b
acke
d by
pre
viou
sly
issu
ed G
inni
e M
ae R
EMIC
cer
tific
ates
, as
outli
ned
belo
w:
� R
EMIC
Cla
ss A
S from
201
0-01
5 �
REM
IC C
lass
TS
from
201
4-00
3 (8
) Cla
ss S
H is
back
ed b
y pre
viou
sly
issu
ed G
inni
e M
ae R
EMIC
and
MX
cer
tific
ates
, w
hich
are
fur
ther
bac
ked
by p
revi
ously
issu
ed G
inni
e M
ae R
EMIC
and
MX
cer
tific
ates
, as
outli
ned
belo
w:
� M
X C
lass
SJ from
201
7-16
0, fur
ther
bac
ked
by:
� R
EMIC
Cla
ss S
A fro
m 2
010-
045
� R
EMIC
Cla
ss S
B fro
m 2
010-
058
� R
EMIC
Cla
ss S
A fro
m 2
010-
062
� R
EMIC
Cla
ss S
B fro
m 2
010-
062
� R
EMIC
Cla
ss S
E from
201
0-06
2 �
REM
IC C
lass
SA
fro
m 2
018-
036,
fur
ther
bac
ked
by:
� M
X C
lass
SK
fro
m 2
010-
042
� R
EMIC
Cla
ss S
B fro
m 2
010-
053

(9)
Cla
ss S
K is
bac
ked
by p
revi
ously
issu
ed G
inni
e M
ae R
EMIC
cer
tific
ates
, as
outli
ned
belo
w:
� R
EMIC
Cla
ss S
K fro
m 2
010-
041
� R
EMIC
Cla
ss A
S from
201
0-04
7 �
REM
IC C
lass
PS
from
201
0-06
2 �
REM
IC C
lass
SB
fro
m 2
010-
067
� R
EMIC
Cla
ss S
A fro
m 2
010-
076
(10)
Cla
ss S
T is
bac
ked
by p
revi
ously
issu
ed G
inni
e M
ae R
EMIC
cer
tific
ates
, as
outli
ned
belo
w:
� R
EMIC
Cla
ss S
A fro
m 2
010-
059
� R
EMIC
Cla
ss S
E from
201
0-06
7 �
REM
IC C
lass
SB
fro
m 2
013-
111
(11)
Cla
ss S
M is
back
ed b
y pre
viou
sly
issu
ed G
inni
e M
ae R
EMIC
and
MX
cer
tific
ates
, w
hich
are
fur
ther
bac
ked
by p
revi
ously
issu
ed G
inni
e M
ae R
EMIC
and
MX
cer
tific
ates
, as
outli
ned
belo
w:
� R
EMIC
Cla
ss S
C fro
m 2
010-
056
� M
X C
lass
SW
fro
m 2
013-
027,
fur
ther
bac
ked
by:
� M
X C
lass
CS
from
201
0-04
2 �
REM
IC C
lass
JS
from
201
0-08
5, fur
ther
bac
ked
by:
� R
EMIC
Cla
ss A
F from
201
0-04
7 �
REM
IC C
lass
AS
from
201
0-04
7 (1
2) C
lass
S is
bac
ked
by p
revi
ously
issu
ed G
inni
e M
ae R
EMIC
and
MX
cer
tific
ates
, as
outli
ned
belo
w:
� M
X C
lass
SG
fro
m 2
010-
055
� M
X C
lass
QS
from
201
0-05
7 �
REM
IC C
lass
SE
from
201
0-08
5 �
MX
Cla
ss H
S from
201
0-09
8 �
REM
IC C
lass
DS
from
201
1-05
1 (1
3) C
lass
CS
is b
acke
d by
pre
viou
sly
issu
ed G
inni
e M
ae M
X c
ertif
icat
es, a
s ou
tline
d be
low
: �
MX
Cla
ss U
A fro
m 2
009-
121
� M
X C
lass
UI from
200
9-12
1 (1
4) C
lass
SY
is b
acke
d by
pre
viou
sly
issu
ed G
inni
e M
ae R
EMIC
cer
tific
ates
, as
outli
ned
belo
w:
� R
EMIC
Cla
ss G
S from
201
3-18
6 �
REM
IC C
lass
SA
fro
m 2
014-
091
A-3

(15)
Cla
ss S
K is
bac
ked
by p
revi
ously
issu
ed G
inni
e M
ae R
EMIC
and
MX
cer
tific
ates
, as
outli
ned
belo
w:
� R
EMIC
Cla
ss H
B fro
m 2
010-
146
� M
X C
lass
DY
fro
m 2
014-
006
� M
X C
lass
PY
fro
m 2
014-
006
� R
EMIC
Cla
ss B
L from
201
4-04
1 �
REM
IC C
lass
CL
from
201
4-04
1 �
REM
IC C
lass
CW
fro
m 2
014-
041
� R
EMIC
Cla
ss W
H fro
m 2
014-
041
(16)
Cla
ss S
is b
acke
d by
pre
viou
sly
issu
ed G
inni
e M
ae R
EMIC
cer
tific
ates
, as
outli
ned
belo
w:
� R
EMIC
Cla
ss A
F from
201
3-15
1 �
REM
IC C
lass
AS
from
201
3-15
1 (1
7) C
lass
CS
is b
acke
d by
a p
revi
ously
issu
ed G
inni
e M
ae R
EMIC
cer
tific
ate,
as
outli
ned
belo
w:
� R
EMIC
Cla
ss T
B fro
m 2
010-
045
(18)
Cla
ss S
X is
back
ed b
y pre
viou
sly
issu
ed G
inni
e M
ae R
EMIC
and
MX
cer
tific
ates
, w
hich
are
fur
ther
bac
ked
by a
pre
viou
sly
issu
ed G
inni
e M
ae M
X c
ertif
icat
e, a
s ou
tline
d be
low
: �
REM
IC C
lass
SX
fro
m 2
014-
107
� M
X C
lass
ES
from
201
5-10
5, fur
ther
bac
ked
by:
� M
X C
lass
JA
fro
m 2
010-
026
(19)
Cla
ss G
S is
bac
ked
by p
revi
ously
issu
ed G
inni
e M
ae R
EMIC
cer
tific
ates
, w
hich
are
fur
ther
bac
ked
by a
pre
viou
sly
issu
ed G
inni
e M
ae
REM
IC c
ertif
icat
e, a
s ou
tline
d be
low
: �
REM
IC C
lass
SM
fro
m 2
018-
147
� R
EMIC
Cla
ss S
L from
201
9-00
6 �
REM
IC C
lass
SL
from
201
9-02
3, fur
ther
bac
ked
by:
� R
EMIC
Cla
ss A
S from
201
8-16
4 Cla
ss(2
0)
QS
is b
acke
d by
REM
IC C
lass
SB
fro
m G
inni
e M
ae 2
018-
091
and
by a
pre
viou
sly
issu
ed G
inni
e M
ae R
EMIC
cer
tific
ate,
as
outli
ned
belo
w:
� R
EMIC
Cla
ss Q
S from
201
8-06
5
A-4

(21)
Cla
ss B
I is
bac
ked
by p
revi
ously
issu
ed G
inni
e M
ae R
EMIC
and
MX
cer
tific
ates
, w
hich
are
fur
ther
bac
ked
by p
revi
ously
issu
ed G
inni
e M
ae R
EMIC
and
MX
cer
tific
ates
, as
outli
ned
belo
w:
� R
EMIC
Cla
ss L
I from
201
3-05
4, fur
ther
bac
ked
by:
� M
X C
lass
IA
fro
m 2
010-
058
� M
X C
lass
PI from
201
1-11
5, fur
ther
bac
ked
by:
� M
X C
lass
PC
fro
m 2
009-
121
� R
EMIC
Cla
ss IG
fro
m 2
012-
104,
fur
ther
bac
ked
by:
� M
X C
lass
IC
fro
m 2
010-
046
� M
X C
lass
IA
fro
m 2
010-
058
� R
EMIC
Cla
ss IJ from
201
1-11
2, fur
ther
bac
ked
by:
� M
X C
lass
JL
from
200
9-11
6 �
MX
Cla
ss P
C fro
m 2
009-
121
� M
X C
lass
DH
fro
m 2
011-
050
� M
X C
lass
DI from
201
1-05
0 �
MX
Cla
ss D
K fro
m 2
011-
050
� R
EMIC
Cla
ss D
I from
201
3-03
7 �
MX
Cla
ss IP
from
201
4-15
4
A-5

$2,964,597,232
Government National Mortgage Association
GINNIE MAE®
Guaranteed REMIC Pass-Through Securities
and MX Securities Ginnie Mae REMIC Trust 2020-061
OFFERING CIRCULAR SUPPLEMENT May 22, 2020
Wells Fargo Securities Tribal Capital Markets