25th ANNUAL STATE OF LOGISTICS REPORT It’s complicated · small steps big strides Business is...
92
® Page 28 SPECIAL REPORT Panama Canal Expansion Update: Questions mount as time draws near 60S 25 th ANNUAL STATE OF LOGISTICS REPORT It’s complicated 3PL WEBCAST: FINDING A HEALTHY BALANCE July 10, 2:00 p.m. ET Go to: www.logisticsmgmt.com/20143pl Exclusive Study: The HOS rule change 40 Do you really need to replace your WMS? 48 Cargo security update 52 6 steps to effective labor standards 56 logisticsmgmt.com July 2014
Transcript of 25th ANNUAL STATE OF LOGISTICS REPORT It’s complicated · small steps big strides Business is...

®
®
Page 28
SPECIAL REPORTPanama Canal Expansion Update:Questions mount as time draws near 60S
25th ANNUAL STATE OF LOGISTICS REPORT
It’s complicated
3PL WEBCAST: FINDING A HEALTHY BALANCEJuly 10, 2:00 p.m. ETGo to: www.logisticsmgmt.com/20143pl
Exclusive Study: The HOS rule change 40Do you really need to replace your WMS? 48Cargo security update 526 steps to effective labor standards 56
logisticsmgmt.com
July 2014

LEGACY utilizes the latest Tier 1 Technology, a dedicated customer service team, and a Top 15 global forwarding network to give you insight into your supply chain, and keep your cargo moving.
LEGACY is a full-service 3PL with 38 years of experience in providing International and North American Transportation, Customs & Compliance, Warehousing & Distribution, and Installation Services.
LEGACYscs.com | 800.361.5028 ext. 6
LEGACY’s Managed Transportation Serviceprovides 24/7 supply chain visibility.
Your cargo is somewhere “in transit”
Now what?
.
LEGACY SCS supports sustainable best practices.

WWW.LOGISTICSMGMT.COM JULY 2014 | LOGISTICS MANAGEMENT 1
Get your daily fix of industry news on logisticsmgmt.com
AN EXECUTIVE SUMMARY OF INDUSTRY NEWS
managementUPDATE
Continued, page 2
New Century Transportation closes its doors. Last month, New Century Transportation, a provider of trucking and warehousing services, shuttered operations and filed for Chapter 7 bankruptcy liquidation. New Century CEO Ter-rence Gilbert wrote in a June 9 letter to company employees that the need to shut down operations arose when the company’s lender unexpectedly declined to continue funding regular business operations. According to Satish Jindel, president of trucking analyst firm SJ Consulting, New Cen-tury had about $145 million in revenue “which should be absorbed fairly easily.” The company deployed a hybrid TL/LTL model, also known as “load-to-deliver,” with average shipment weight more than 3,000 pounds. Jindel said that was more than double the LTL industry average, add-ing that New Century was moving about 10,000 shipments per week.
Capacity to be tight for foreseeable future. Freight transportation forecasting firm FTR issued data in June showing that while over-the-road capacity availability remains tight, the outlook is not quite as dire as it was earlier this year. But even though things may be slowly improving, FTR said that current truck utilization capacity is in the 98 percent to 99 percent range and shows little sign of abating until another recession takes hold. FTR President Eric Starks said that the shipping situa-tion is not as critical as it was just a few months ago when weather-related issues disrupted the supply chain. “However, we are still near a tipping point,” he said. “If the economy starts to accelerate as we move through the summer months, additional strain would be put on an already fragile capacity situa-tion. Shippers should expect carriers to push rates higher as we move through the year.”
Change at the top for UPS. Transportation and logistics giant UPS said in June that Chief Operating Officer David Abney will replace Scott Davis as CEO effective September 1. Davis, who has been in his role as CEO since 2008, will retire and serve as non-executive Chairman. Abney will become the 11th UPS CEO. Abney started out at the company in 1974 as a part-time package loader and has since served in several operating positions prior to overseeing UPS logistics, sustainability,
and engineering in his current role as COO. UPS also announced that Chief Sales, Marketing, and Strategy Officer Alan Gershenhorn has been named executive vice president and chief commercial offi-cer, the latter of which is a newly-created position. In this role, UPS said Gershenhorn will oversee the development and implementation of “broad stra-tegic growth and innovation initiatives focused on creating distinctive customer value, including new market development, and innovative future prod-ucts and solutions.”
West Coast port volumes trending up. Volumes for the month of May at the Port of Los Angeles (POLA) and the Port of Long Beach (POLB) offer more signs of positive news for the overall economic picture. POLA reported that total volumes were up 8.2 percent annually at 689,141 TEU. “The volumes seem to be returning to the port following the downturn of 2008-2009,” a POLA spokesper-son told Logistics Management. “We’re seeing retailers replenish their inventory, consumer confi-dence tracking up, imports climbing, and gains in exports as well due to the U.S. dollar.” Total POLB volumes for May were up 2.7 percent at 599,509 TEU for its busiest May performance since 2007. Imports at POLB were up 2.3 percent and exports were down 0.3 percent.
Ranking risk. The 2014 FM Global Resilience Index finds Norway, Switzerland, and Canada at the top of the list of nations most resilient to sup-ply chain disruption—one of the leading causes of business volatility. The index, commissioned by property insurer FM Global, is an online, data-driven tool and repository ranking the business resilience of 130 countries. The index finds Kyrgyzstan, Ven-ezuela, and the Dominican Republic as nations least resilient to supply chain disruption. “Natural disasters, political unrest, and a lack of global uni-formity in safety codes and standards all can have an impact on business continuity, competitiveness, and reputation,” said Jonathan Hall, executive vice president at FM Global. “As supply chains become more global, complex and interdependent, it’s essential for decision makers to have concrete facts and intelligence about where their facilities and their suppliers’ facilities are located.”

2 LOGISTICS MANAGEMENT | JULY 2014 WWW.LOGISTICSMGMT.COM
Get your daily fix of industry news on logisticsmgmt.com
managementUPDATE AN EXECUTIVE SUMMARY OF INDUSTRY NEWS
Concerns for brokers. In a recent letter to Fed-eral Maritime Commission (FMC) Chairman Mario Cordero, the National Customs Brokers and For-warders Association of America, (NCBFAA) asked the commission to consider procedures addressing port disruptions resulting from unusual occurrences such as major force majeure events or labor-related difficulties. Early last year the NCBFAA requested that Chairman Cordero’s predecessor, Richard Lidinsky, likewise consider procedures to mitigate challenges during maritime labor unrest and severe weather conditions. Motivated by the possibility of a strike at West Coast ports commencing in the near future, the NCBFAA determined to once again peti-tion the FMC for action on this issue. Among the suggestions was one to require carriers to develop and publicize their contingency plans concerning how they would provide service for cargo moving into or out of the various U.S. ports during periods of unusual disruption events
Security screening. According to reports, the International Air Cargo Association (TIACA) has welcomed the U.S. Transportation Security Administration’s (TSA) decision to lift requirements for air cargo screening reports less than a year after calling for the regulation to be axed. TSA has announced that it will no longer require the industry to provide air cargo screening volume reporting, a requirement that TIACA warned last fall was putting strain on the industry. “This will significantly relieve the reporting burden on industry, saving many labor and IT hours,” says Doug Brittin, secretary general of TIACA. “All passenger carriers, and over 1,200 certified freight forwarders and shippers in the U.S., have been required to measure and provide these reports monthly. We applaud this move as a posi-tive step towards adopting a risk-based approach versus forensic compliance.”
Brits praise postponement. The decision by U.S. authorities to postpone new rules on ocean container scanning was praised by our U.K. trading partners. The British International Freight Association (BIFA) has long maintained that the Department of Homeland Security has consistently underestimated the enormity of the task in hand relative to the costs both to the U.S. government and foreign govern-ments, as well as the limited ability of contemporary
screening technology to penetrate dense cargo. According to Peter Quantrill, BIFA’s director general, the use of systems available to scan containers would have a negative impact on trade capacity and the flow of cargo. “Media reports suggest that the U.S. government now doubts whether it would be able to implement the mandate of 100 percent scanning, even in the long term, and it would appear that it now shares BIFA’s opinion that it is not the best use of tax-payer resource.
Port of LA’s new chief. Gene Seroka, a top executive at APL, has been tapped to take over as executive director of the Port of Los Angeles this month. Seroka, formerly head of commercial in the Americas Region for APL, will lead a city department with a $1.1 billion budget and approximately 1,000 employees. Seroka joined APL in 1988 and has more than 26 years of experience in container ship-ping and logistics.
More online shopping. The 3rd annual UPS Pulse of the Online Shopper Study reveals that online shoppers want retailers to make it easier to purchase their goods and services. Consumers also want web-sites and stores to work better together. For now, they also prefer to evaluate and purchase products from their desktops rather than their mobile devices. And when it comes to shipping and returns, “free” is a driving factor to complete the sale. Respondents said that they want more options in searching for items, enhanced security, and alternate delivery loca-tions. While consumers prefer most of their packages delivered to their home (74 percent), there is a grow-ing trend for alternate delivery options. Only about 43 percent of shoppers were satisfied with the flexibility of changing delivery days or rerouting packages.
FEC set to debut new facility. In mid July, Florida East Coast Railway (FEC) will officially intro-duce its new Intermodal Container Transfer Facil-ity (ITCF) which the carrier said is adjacent to Port Everglades. The ITCF is comprised of 43 acres and will increase FEC’s intermodal capacity from 100,000 to 450,000 lifts per year. The ITCF is coupled with a near-dock facility that FEC said will augment the transfer of domestic and intermodal containers between ocean vessels and rail. FEC will hold an opening ceremony for the new facility on July 14. M

THE
THE
Skill is delivering the latest edition of a popular novel to frenzied fans.
Will is meeting a deadline everyone else considered pure fantasy.
When a publisher asked us to deliver millions of books to hundreds of stores – all on the same day – we didn’t hesitate. At ABF Freight,SM we’re not afraid to take on diffi cult or custom jobs. It’s what we specialize in. We’ll tailor our enterprise and LTL services to your specifi c shipping needs. We love the challenge. Our customers love the results. Call us with your challenge. 1-800-610-5544.
© 2014 ArcBest Corporation. All rights reserved. All service marks featured in this advertisement are the property of ArcBest Corporation and its subsidiaries.

small stepsbig strides
what happens when
meet
1.888.565.0052michiganbusiness.org/lm

small stepsbig strides
Business is growing by leaps and bounds in michigan. Welcome to one of the fastest-
growing economies in the nation. Ranked #1 in new manufacturing jobs by CNBC and home to one of
the world’s largest concentrations of industrial R&D, Michigan’s world-class research university system produces a
deep and growing pool of tech-skilled talent. In addition, Michigan offers a business tax reduction of over 80%
and an unsurpassed quality of life. It’s clear business is on the move in Pure Michigan.

But at Saia, our team isn’t looking back —
because we’re focused on one day in particular:
tomorrow.That’s when, once again, complex technology will
yield streamlined LTL solutions. And it’s when our
forward-looking approach will still be keeping
shippers ahead of the curve. That’s why we
innovate every day — because that’s what we
deliver tomorrow.
90years:that’s 32,850 days of transportation
excellence.
saia.com / 800.765.7242

WWW.LOGISTICSMGMT.COM JULY 2014 | LOGISTICS MANAGEMENT 7
Logistics Management® (ISSN 1540-3890) is published monthly by Peerless Media, LLC, a Division of EH Publishing, Inc., 111 Speen St, Suite 200, Framingham, MA 01701. Annual subscription rates for non-qualified subscribers: USA $119, Canada $159, Other International $249. Single copies are available for $20.00. Send all subscription inquiries to Logistics Management, 111 Speen Street, Suite 200, Framingham, MA 01701 USA. Periodicals postage paid at Framingham, MA and additional mailing offices. POSTMASTER: Send address changes to: Logistics Management, PO Box 1496 Framingham MA 01701-1496. Reproduction of this magazine in whole or part without written permission of the publisher is prohibited. All rights reserved. ©2014 Peerless Media, LLC.
VOL. 53, NO. 7
CONTENTSLogistics Management
25th ANNUAL STATE OF LOGISTICS REPORT
It’s complicated28 Rollercoaster demand levels and uneven freight volumes
in 2013 created havoc in one of the more volatile years on record. In 2014, shippers will need to manage with all the savvy and experience that they can muster to get the capacity they need at a rate that’s fair.
TRANSPORTATION AND BEST PRACTICES/TRENDS
Exclusive Study: The HOS rule change and trucking operations 40Varying estimates from positive to pragmatic existed before the new rule became effective in July 2013. However, the grim reality is that trucking stakeholders are now experiencing substantial losses in productivity due to the change—and in many cases it’s much worse than was predicted.
SUPPLY CHAIN & LOGISTICS TECHNOLOGY
Do you really need to replace your WMS? 48Despite the benefits of more modern supply chain software, many firms have resisted the call to upgrade or replace their warehouse management systems (WMS). We look at the reasons that companies have avoided a WMS upgrade and some of the creative alternatives delivering value.
GLOBAL LOGISTICS
Cargo Security: Defining the fine print 52While not all proposed global cargo security solutions have been practical or enforceable, our analysts suggest that there are a few fundamentals every global shipper needs to accept. Here’s how cargo stakeholders are working in unison to gain clarity.
WAREHOUSE/DC MANAGEMENT
Improving Labor Management: 6 steps to effective labor standards 56One of the best ways for logistics professionals to start chipping away at labor costs while achieving productivity gains inside the four walls is by setting up labor standards. Here are six surefire ways to start doing this today.
WMS 48
HOS 40
Cover illustration: John Pirman
Labor Management 56
July 2014 logisticsmgmt.com

DELIVER YOUR BUSINESS TO THE WORLD WITH THE
INTERNATIONAL SPECIALISTS. ∙ ∙ ∙ ∙ ∙ ∙ ∙
Our local expertise, customs clearance experience and international network are unparalleled.That´s why when it comes to express shipping we‘re the International Specialists. And why we
can guarantee delivery to and from more places around the world than anyone else.
That‘s the Speed of Yellow.
www.dhl-usa.com

WWW.LOGISTICSMGMT.COM JULY 2014 | LOGISTICS MANAGEMENT 9
DEPARTMENTS+ONLINEWWW.LOGISTICSMGMT.COM
1 Management update
11 Viewpoint
12 Price trends
15 News & analysis
22 Newsroom notes
24 Moore on pricing
26 Pearson on excellence
88 Pacific Rim report
The much anticipated Panama Canal expansion has promised a great many enhancements for U.S. shippers waiting to book cargo on the new generation of “mega” container vessels. But a few lingering questions are also troubling some industry analysts who question U.S. port readiness to accommodate these huge loads. Page 60S
SPECIAL REPORT
Panama Canal Expansion:Questions mount as time draws near
NOW ON DEMAND 2014 Technology Roundtable
Register now:logisticsmgmt.com/2014tech
The great convergenceThe supply chain technology market is evolving toward platforms and equipment that optimize end-to-end processes and help managers better integrate people into a more streamlined workflow. In our 2014 Technology Roundtable
Webcast, four top technology analysts offer their unique insight into how the convergence of automation, data, and labor is moving us toward this utopian vision.
Moderator:Michael Levans, Group Editorial Director
Speakers:Dwight Klappich, GartnerBelinda Griffin, CapgeminiNorm Saenz, St. Onge CompanySteve Banker, ARC Advisory Group
Everything you need, every way you need it.Visit supplychain247.com.
Top 50 3PLs: Finding a healthy balanceJoin LM’s Executive Editor Patrick Burnson in this webcast designed to bring shippers up to date on the gains to be made by properly leveraging 3PLs for optimized service both domesticly and internationally. Evan Armstrong, president of Armstrong & Associates, and Steve Banker of ARC Advisory Group join Burnson in this special event. logisticsmgmt.com/3pl14
2014 State of the 3PL Market WebcastThursday, July 10 at 2:00 p.m. ET
logisticsmgmt.com/3pl14

Truckload - LTL - Heavy Haul/Specialized - Expedited - Air - Ocean Rail Intermodal - Transportation Management Solutions
[email protected] www.landstar.com 877-696-4507
THAT’S WHAT THAT’S WHAT THAT’S WHAT WE DO!WE DO!WE DO!WE DO!WE DO!WE DO!
This Landstar agent’s story is just one of thousands at Landstar. Contact us today
to find out how we can help you too.
WHAT WE DOWHAT WE DOWHAT WE DOHELPS YOU DOHELPS YOU DOHELPS YOU DOWHAT YOU DO... WHAT YOU DO... WHAT YOU DO... BETTER!BETTER!BETTER!
“Landstar owner/operators are truly professionals. They make my agency look good and the customer feel secure in knowing their freight is being handled properly,” says Landstar Agent Trevor Hagerman. “If not for Landstar owner/operators and the whole Landstar system I would not have had the confidence to take on our first large scale, multi-load project.”
Hagerman’s agency transported 11 Caterpillar 795F AC trucks – each almost 26’ high, 50’ long and 30’ wide. The off-highway ultra-class haul trucks are so big they had to be moved in segments. The chassis alone weighs in at 135,000 pounds and the dump portion of the truck had to be moved in four pieces.

WWW.LOGISTICSMGMT.COM JULY 2014 | LOGISTICS MANAGEMENT 11
VIEWPOINTEDITORIAL STAFFMichael A. Levans Group Editorial Director
Francis J. Quinn Editorial Advisor
Patrick Burnson Executive Editor
Sarah E. Petrie Managing Editor
Jeff Berman Group News Editor
John Kerr Contributing Editor, Global Logistics
Bridget McCrea Contributing Editor, Technology
Maida Napolitano Contributing Editor, Warehousing & DC
John D. Schulz Contributing Editor, Transportation
Mike Roach Creative Director
Wendy DelCampo Art Director
COLUMNISTSDerik Andreoli Oil + Fuel
Elizabeth Baatz Price Trends
Mark Pearson Excellence
Peter Moore Pricing
PEERLESS MEDIA, LLCBrian Ceraolo President and Group Publisher
Kenneth Moyes President and CEO EH Publishing, Inc.
EDITORIAL OFFICE111 Speen Street, Suite 200 Framingham, MA 01701-2000 Phone: 1-800-375-8015
MAGAZINE SUBSCRIPTIONSStart, renew or update your magazine subscription at www.logisticsmgmt.com/subscribe. Contact customer service at: Web: www.logisticsmgmt.com/subscribe Email: [email protected] Phone: 1-800-598-6067 Mail: Peerless Media P.O. Box 1496 Framingham, MA 01701
ENEWSLETTER SUBSCRIPTIONSSign up or manage your FREE eNewsletter subscriptions at www.logisticsmgmt.com/enewsletters.
REPRINTSFor reprints and licensing please contact Tom Wilbur at Wright’s Media, 877-652-5295 ext. 138 or [email protected].
if you’re searching for a good summer read, look no further than the issue of Logistics Management (LM) that you’re holding—especially if you like mysteries.
As we have for two decades, we’ve devot-ed a large portion of our July issue to putting the Annual State of Logistics Report into con-text for logistics professionals. The report, which encapsulates the cost of the U.S. business logistics system during the previous year, represents the clearest snapshot avail-able of how economic conditions will mold the logistics and transportation landscape.
The release of the report—which took place on June 17th at the National Press Club in Washington, D.C.—sparks our annual investigation into the details of the findings and sends our entire editorial staff on a quest to summarize where each transportation mode currently stands in terms of service, capacity, and rates.
This year marks the 25th year of the report and the 11th year that it’s been authored by Rosalyn Wilson, a 32-year industry veteran who’s now a senior business analyst with Delcan Consulting where she focuses on the progress of the overall supply chain industry. Wilson has been working on the report since 1994 and assumed full responsibility in 2004 following the passing of the report’s creator, Robert Delaney.
Beginning on page 28, Contributing Edi-tor John Schulz—who was in attendance at the Press Club last month—kicks off our comprehensive coverage with his analysis of the report.
So, what is the state of logistics coming out of 2013? “It’s complicated,” says Schulz. “After a slow start to 2013, mid-year ship-ments were strong before a very deep dive at the end of the year—with not much move-ment in rates across the modes.”
He adds that those rollercoaster demand levels and uneven volumes wreaked havoc on the U.S. freight network last year, causing a whiplash effect on both shippers and carriers as they tried to balance their
capacity with uneven surges in demand. As we rolled into 2014, we were still feel-
ing that whiplash, but it was compounded as freight shipments for the first five months of the year were up 13.1 percent year-over-year, marking the strongest freight performance period since the end of the recession.
Certainly, growing shipment levels are a bright sign for the nation’s economy, however shippers are beginning to see rates rise, and capacity—most notably on the nation’s highways—move from tight to what can now be called the industry’s most pressing anxiety.
“The single biggest concern com-ing out the report is trucking’s ability to recruit and retain drivers,” says Schulz. “That’s what’s keeping trucking execu-tives up at night—and should be causing shippers to stir in their sleep.”
Add rising fuel costs, soaring equip-ment costs, grueling compliance, and tough federal regulations, and you have one of the most challenging operating envi-ronments trucking has ever seen. As a result, trucking bankruptcies increased in seven straight quarters and are currently at a three-year high. According to the report, 21,775 trucks were idled in 2013 due to company shutdowns, which is larger than 2010 and 2011 combined.
“The bottom line,” says Schulz, “is that demand is going to increase and capac-ity is going to decrease, adding even more complexity than ever. Shippers are going to need every ounce of savvy and experience in 2014 to solve this complicated puzzle.”
State of Logistics: It’s complicated
Michael A. Levans, Group Editorial DirectorComments? E-mail me at [email protected] me on Twitter: @MikeLeva
12 LOGISTICS MANAGEMENT | JULY 2014 WWW.LOGISTICSMGMT.COM
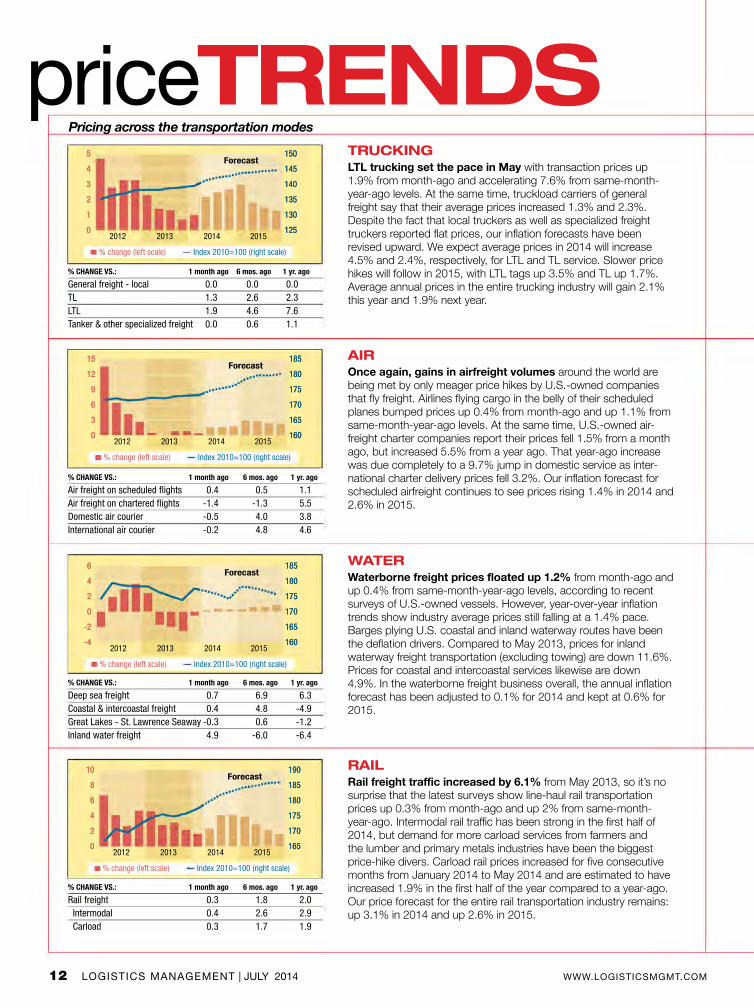
priceTRENDSTRUCKINGLTL trucking set the pace in May with transaction prices up 1.9% from month-ago and accelerating 7.6% from same-month-year-ago levels. At the same time, truckload carriers of general freight say that their average prices increased 1.3% and 2.3%. Despite the fact that local truckers as well as specialized freight truckers reported flat prices, our inflation forecasts have been revised upward. We expect average prices in 2014 will increase 4.5% and 2.4%, respectively, for LTL and TL service. Slower price hikes will follow in 2015, with LTL tags up 3.5% and TL up 1.7%. Average annual prices in the entire trucking industry will gain 2.1% this year and 1.9% next year.
Pricing across the transportation modes
AIROnce again, gains in airfreight volumes around the world are being met by only meager price hikes by U.S.-owned companies that fly freight. Airlines flying cargo in the belly of their scheduled planes bumped prices up 0.4% from month-ago and up 1.1% from same-month-year-ago levels. At the same time, U.S.-owned air-freight charter companies report their prices fell 1.5% from a month ago, but increased 5.5% from a year ago. That year-ago increase was due completely to a 9.7% jump in domestic service as inter-national charter delivery prices fell 3.2%. Our inflation forecast for scheduled airfreight continues to see prices rising 1.4% in 2014 and 2.6% in 2015.
WATERWaterborne freight prices floated up 1.2% from month-ago and up 0.4% from same-month-year-ago levels, according to recent surveys of U.S.-owned vessels. However, year-over-year inflation trends show industry average prices still falling at a 1.4% pace. Barges plying U.S. coastal and inland waterway routes have been the deflation drivers. Compared to May 2013, prices for inland waterway freight transportation (excluding towing) are down 11.6%. Prices for coastal and intercoastal services likewise are down 4.9%. In the waterborne freight business overall, the annual inflation forecast has been adjusted to 0.1% for 2014 and kept at 0.6% for 2015.
RAILRail freight traffic increased by 6.1% from May 2013, so it’s no surprise that the latest surveys show line-haul rail transportation prices up 0.3% from month-ago and up 2% from same-month-year-ago. Intermodal rail traffic has been strong in the first half of 2014, but demand for more carload services from farmers and the lumber and primary metals industries have been the biggest price-hike divers. Carload rail prices increased for five consecutive months from January 2014 to May 2014 and are estimated to have increased 1.9% in the first half of the year compared to a year-ago. Our price forecast for the entire rail transportation industry remains: up 3.1% in 2014 and up 2.6% in 2015.
2012 2013 2014 2015
% change (left scale) Index 2010=100 (right scale)
5
4
3
2
1
0
5
4
3
2
1
0
150
145
140
135
130
125
150
145
140
135
130
125
Forecast
2012 2013 2014 2015
% change (left scale) Index 2010=100 (right scale)
15
12
9
6
3
0
15
12
9
6
3
0
185
180
175
170
165
160
185
180
175
170
165
160
Forecast
2012 2013 2014 2015
% change (left scale) Index 2010=100 (right scale)
6
4
2
0
-2
-4
6
4
2
0
-2
-4
185
180
175
170
165
160
185
180
175
170
165
160
Forecast
2012 2013 2014 2015
% change (left scale) Index 2010=100 (right scale)
10
8
6
4
2
0
10
8
6
4
2
0
190
185
180
175
170
165
190
185
180
175
170
165
Forecast
% CHANGE VS.: 1 month ago 6 mos. ago 1 yr. ago
General freight - local 0.0 0.0 0.0TL 1.3 2.6 2.3LTL 1.9 4.6 7.6Tanker & other specialized freight 0.0 0.6 1.1
% CHANGE VS.: 1 month ago 6 mos. ago 1 yr. ago
Air freight on scheduled flights 0.4 0.5 1.1Air freight on chartered flights -1.4 -1.3 5.5Domestic air courier -0.5 4.0 3.8International air courier -0.2 4.8 4.6
% CHANGE VS.: 1 month ago 6 mos. ago 1 yr. ago
Deep sea freight 0.7 6.9 6.3Coastal & intercoastal freight 0.4 4.8 -4.9Great Lakes - St. Lawrence Seaway -0.3 0.6 -1.2Inland water freight 4.9 -6.0 -6.4
% CHANGE VS.: 1 month ago 6 mos. ago 1 yr. ago
Rail freight 0.3 1.8 2.0 Intermodal 0.4 2.6 2.9 Carload 0.3 1.7 1.9

1-866-409-9759UNYSONLOGISTICS.COM
Unyson Logistics is an award-winning 3PL that specializes in customizing solutions to fit our clients’ needs. We o�er
multi-modal capabilities that guarantee supply chain savings through our services, technology and expertise.
Simply put, our logistics managers are the best at what they do. Unyson deploys dedicated account
management, continuous improvement programs and business intelligence that combines innovative reporting
with cutting-edge technology.

www.lynden.com 1-888-596-3361
At Lynden, we understand that plans change but deadlines don’t. That’s why we proudly offer
our exclusive Dynamic Routing system. Designed to work around your unique requirements,
Dynamic Routing allows you to choose the mode of transportation — air, sea or land — to
control the speed of your deliveries so they arrive just as they are needed. With Lynden, you
only pay for the speed you need!
Only pay for the speed you need... Dynamic Routing!SM

WWW.LOGISTICSMGMT.COM JULY 2014 | LOGISTICS MANAGEMENT 15
NEWS analysisAlso:
• Pro-roads legislators urge do-nothing Congress to prevent Highway Trust Fund meltdown, Page 16
• UPS rolls out dimensional pricing changes set to take effect in December, Page 18
• Volumes see gains as West Coast port labor talks continue, reports Port Tracker, Page 20
• The FMC acknowledges China’s objection to P3 Network, Page 21
Water Resources Reform and Development Act signed into lawLegislation is first water resources bill since 2007 and “green lights” 34 water infrastructure projects across the country.
By Jeff Berman, Group News Editor
WASHINGTON, D.C.––After a long wait, the U.S. finally has new water resources legislation, with President Barack Obama officially signing H.R. 3080: The Water Resources Reform & Development Act (WRRDA) of 2014 into law.
WRRDA was initially introduced by the Senate in October 2013 and then passed the House later that month, with the Conference report of the bill filed in the House in May. It was then passed by the House and Sen-ate prior to being signed off on by President Obama, marking the first water resources bill signed into law since 2007.
“As more of the world’s cargo is transported on these massive ships, we’ve got to make sure that we’ve got bridges high enough and ports that are big enough to hold them and accommodate them so that our businesses can keep selling goods made in America to the rest of the world,” Obama said prior to signing the bill.
Through WRRDA, Con-gress authorizes the U.S. Army Corps of Engineers to carry out its missions to devel-op, maintain, and support the nation’s vital port and water-ways infrastructure needs and support effective and targeted
flood protection and environmental restoration needs.
House T&I Chairman Rep. Bill Shuster (R-Pa.) said in September 2013 that U.S. ports and waterways are highly essential, especially when considering that 99 percent of the goods the U.S. trades, sells, and imports from around the world go through U.S. ports, rep-resenting $1.4 trillion worth of goods every year. But he stressed that this comes with a caveat, considering that
the nation’s critical infrastructure is aging and the process for updating it is slow, costly, and filled with red tape.
Various components of the bill are directly tied to the nation’s ports, with language focused on: authorizing need-ed investment in America’s ports; sup-porting underserved, emerging ports; deauthorizing $12 billion of old, inac-tive projects that were funded prior to its 2007 bill; reforming and preserv-ing the Inland Waterways Trust Fund;

16 LOGISTICS MANAGEMENT | JULY 2014 WWW.LOGISTICSMGMT.COM
NEWS analysis
WASHINGTON, D.C.––There’s an old saying in Washington that there are nei-ther “Republican roads or Democratic roads,” merely roads used by all Ameri-cans to speed themselves and commerce throughout our 50 states.
That axiom is being severely tested dur-ing this contentious legislative session as lawmakers struggle to head off a pending crisis in the Highway Trust Fund (HTF). That fund is scheduled to run out of money around July 18, causing another bailout of the HTF from the General Treasury—something that has happened at least six times in the past decade.
“This is important for our quality of life so we don’t spend 40 hours stuck in traffic jams,” said Sen. David Vitter (R-La.) at the recent “Rally for Roads” at the foot of the U.S. Capitol before about 200 members of unions, construction, and busi-ness interests. “The good news is that there’s a growing recogni-tion of that in Congress.”
Vitter is a member of the Senate Envi-ronment and Public Works (EPW) Com-mittee that has approved a six-year, $265 billion highway bill to replace current leg-islation that expires Sept. 30. Included in that $265 billion is $6 billion that would go to freight-related projects.
Senate EPW Chairman Barbara Boxer (D-Calif.) said that “there’s no excuse” for not funding what she called a “robust”
multi-year highway bill. The trick is how to pay for it, with most Republicans eschewing any talk of raising the federal fuel tax (18.4 cents a gallon on gasoline, 24.4 cents on diesel, unchanged since 1993) in an election year.
A hoarse-sounding Boxer asked at the rally: “Isn’t this the greatest country on earth?” She then wondered aloud why the U.S. still has 70,000 structurally defi-cient bridges and as many as 50 percent of Interstate highways in less-than-pris-tine condition.
She added that there’s “no earthly excuse” for not passing a well-funded, multi-year highway bill and then ripped Republican proposals to kick the can down the road through a short-term, three-to-six-month continuing resolution to extend the current law.
“I don’t want to see gimmicks, and I don’t want to see short-term fixes,” Boxer implored. “I don’t want to see patches. We need a long-term solution. If David Vitter and I can see eye-to-eye on this, everybody can.”
Sen. Chris Murphy (D-Conn.), one of the speakers at the rally, has introduced a bill that would raise the fuel tax six cents a year for the next two years. “Money is not going to fall off trees to fund this,” Murphy said. “It’s time people put their ideas on the table. If you don’t have any ideas, go home.”
On the House side, Rep. Earl Blume-nauer (D-Ore.) said that he has a sound idea to fix the HTF. Wearing a gold bow-tie, he said that the solution is “going for
and authorizing priority water resources infrastructure improvements recom-mended by the Chief of the Army Corps of Engineers to improve navigation and commerce.
WRRDA also addresses the Harbor Maintenance Trust Fund (HMTF) that is comprised of revenues collected annually from importers and domestic shippers for deep-draft navigation maintenance dredging and the operation and mainte-nance of large and small ports.
The bill’s authors cited the American Society of Civil Engineers’ projection that, at current funding levels, there will be a $28 billion dredging shortfall by 2040, adding that each year half of the $1.8 billion collected by the HMTF is being used for its intended purposes.
In the bill, WRRDA has target HMTF expenditures expanding annually so that
by 2020 and beyond at least 80 percent of collected funds are allocated for port operations and maintenance. It also allo-cates 10 percent of annual HMTF expen-ditures for 2015 and 2016 on harbors with less than one million annual tons of throughput so that emerging ports are able to receive an equitable share to improve their harbors and be more competitive.
The signing of WRRDA was welcomed by the U.S. Chamber of Commerce. “In a year in which compromise has been difficult, the House, the Senate, and the administration have come together to enact critical, reform-focused water resources leg-islation that will not only enable strategic investment in our ports and waterways, but also increase American competitiveness and support well-paying U.S. jobs,” said Bruce Josten, vice president for government affairs for the U.S. Chamber of Commerce. M
INFRASTRUCTURE
Pro-roads legislators urge do-nothing Congress to prevent Highway Trust Fund meltdown

Are my customers shopping online with someone else?
Your customers know exactly what they’re looking for when they order online. And they need it at exactly the right time. If your website doesn’t offer features like real-time availability, firm delivery dates and easy returns, they’ll shop with someone who does.
34% of industrial products buyers have made an online purchase outside of their supply base.
Make Buying Easier
UPS can help you create a more competitive customer experience online by helping to integrate and streamline your inventory, shipping, billing and returns processes. And, with expertise from UPS Ready® Program
providers, you can accelerate your e-commerce strategy and stay ahead of your customers’ needs.
Make Returns Easier
Returns policies are an important factor in a customer’s purchase decision. With UPS Returns® solutions, you can improve customer satisfaction and your bottom line through improved tracking, less handling and better billing and reconciliation.
Get insights into your customers’ needs with the UPS B2B Purchasing Insights study. Download a copy at ups.com/insights.
UPS® can help deliver the integrated online experience your customers want.
Copyright ©2014 United Parcel Service of America, Inc.

18 LOGISTICS MANAGEMENT | JULY 2014 WWW.LOGISTICSMGMT.COM
NEWS analysis
ATLANTA––Following the lead of its chief competitor, FedEx, Atlanta-based transportation and logistics bellwether UPS said that effective December 29 it will also adopt dimensional pricing in the U.S.
Company officials said that dimen-sional weight will be used to calculate the billable weight of a shipment on all UPS Ground services and UPS Standard to Canada packages. This type of pricing is already deployed by UPS for both its domestic and international air services, as well as its UPS Standard to Mexico ground services, UPS Ground pack-ages, and UPS Standard to Canada for packages that are 3 cubic feet or larger.
“UPS has been research-ing the potential expansion of dimensional-weight pric-ing for a number of years because it enables us to more appropriately align rates with costs that are influenced by both the size and weight of packages,” said Alan Gershenhorn, UPS executive vice presi-dent and chief commercial officer.
FedEx made its decision to go with dimensional pric-ing in early May for its FedEx Ground and FedEx Freight offerings, with the changes
taking effect on January 1, 2015.For FedEx Ground, the company said
it will apply dimensional weight pric-ing to all shipments moved via FedEx Ground, as opposed to its current meth-od of applying dimensional weight pric-ing to packages that measure three cubic feet or more. FedEx defines dimensional weight pricing as “a common indus-try practice that sets the transporta-tion price based on package volume–the amount of space a package occupies in
relation to its actual weight.”When FedEx and UPS announced
rate changes for 2011 in late 2010, they both announced that they would be implementing a change to the dimen-sional weight volumetric divisor, which is used to tally the amount of space allo-cated to a specific shipment.
Parcel industry experts told Logistics Management that when these changes were made they would be a major hit to shippers, explaining it’s strictly margin improvement as the carriers do not pro-vide additional work or additional capac-ity investments while receiving more incremental revenue on the same ship-ments handled.
In explaining its rationale for making the decision to go with dimensional pric-ing for these respective product offer-ings, UPS officials noted that recent e-commerce shipping trends have brought about a decrease in package density, citing how the package weight compared to the physical exterior dimen-sion is declining.
UPS added that this trend, in turn, causes cargo space to be less efficiently utilized and results in a higher cost per package. Through dimensional pricing, UPS said shippers will seek to optimize
their packaging practices, which will reduce excess packaging materials and overall package sizes, lead-ing to related reductions in fuel use, vehicle emissions, and transportation costs.
“This is a very big change in pricing,” said Jerry Hempstead, presi-dent of parcel consultancy Hempstead Consulting. “There’s no additional cost for the carrier. There’s no additional service they’re adding. They are just going to charge more for that which they have been doing for years. This is a pure yield improvement move and all the revenue should drop to the bottom line as profits.”
––Jeff Berman, Group News Editor
PARCEL SHIPPING
UPS rolls out dimensional pricing changes set to take effect in December
the gold” by raising the fuel tax by a nickel a year for the next three years to help restore the HTF and at least help keep the tax indexed to inflation.
“For the first time in 21 years, let’s raise the gas tax,” Blumenauer said. “We have environmentalists, trucks, the AAA, and some bicyclists all saying that. Let’s not throw another Band-Aid on this.”
Fearing a July bust of the HTF would wreak havoc with states’ ability to build
roads in the short term, Blumenhauer is calling for a “short-term fix” to get through the summer construction sea-son. Then he said he wants the fuel tax measure brought up during a special lame duck session of Congress after the November elections.
“Congress should not be able to go home without passing a robust six-year bill,” Blumenhauer added.
—John D. Schulz, Contributing Editor
(n)X+(n)Y+(n)Z=$

Old Dominion Freight Line, the Old Dominion logo and Helping The World Keep Promises are service marks or registered service marks of Old Dominion Freight Line, Inc. All other trademarks and service marks identifi ed herein are the intellectual property of their respective owners. © 2014 Old Dominion Freight Line, Inc., Thomasville, N.C. All rights reserved.
®
If you’re in the skates and sticks business, so are we.
HELPING THE WORLD KEEP PROMISES.®
OD•DOMESTIC OD•EXPEDITED OD•PEOPLE OD•TECHNOLOGYOD•GLOBAL
We may be in shipping, but your business is our business. Our team works with you to develop affordable Expedited strategies to fi t your time-sensitive schedule. We deliver promises to help you meet your goals. odfl .com/expedited

NEWS analysis
WASHINGTON, D.C.—With contract talks for West Coast dockworkers between the Pacific Maritime Association and the International Longshore and Warehouse Union (ILWU) ongoing, import activity at U.S.-based retail container ports is expected to see ear-lier than usual gains for this time of year, according to the most recent edition of the Port Tracker report by the National Retail Federation (NRF) and Hackett Associates.
The report observed that a projected 7.5 percent annual gain in June volumes could occur due to retailers bringing in higher than usual amounts of merchandise in an effort
to avoid any issues related to the ILWU and PMA negotiations, especially in the event that negotiations were to extend past June 30.
“We don’t want to see disruptions at
the ports, but retailers are making sure that they’re prepared in case that hap-pens,” said Jonathan Gold, vice president for supply chain and customs policy at the NRF. “Whether it’s bringing cargo in early or other contingency plans, retail-ers will keep the shelves stocked for the back-to-school and holiday seasons.”
Preparation for prolonged negotia-tions of a labor stoppage of any duration at West Coast ports is key.
In 2002, a labor strike at West Coast ports, which handle more than two-thirds of all U.S. retail container cargo, resulted in ports being closed for 10 days and creating a backlog that took several months to be cleared. Estimates show that the cost to the U.S. economy was more than $15 billion in report-ed losses.
The NRF’s Gold told
OCEAN SHIPPING
Volumes see gains as West Coast port labor talks continue, reports Port Tracker
We deliver distribution solutions... for any shipping
need... Creating value for our
clients…
with asset-based transportation
services…
freight brokerage solutions…
and full transportation
management and network optimization
services...

NEWS analysis
providing you with options…
to meet your diverse
requirements…On budget…
And on time, all the time.
Not a weak link in the chainMeet some of the thousands of supply chain professionals at
UTi with the experience and professionalism to handle any and all of your North America distribution. Our single-source
solutions enable you to deliver to your customers while we
deliver savings to your bottom line and the assurance that on our team, there’s never a weak link.
To � nd out more about which UTi Distribution solution best suits your needs, and view our Team UTi videos and visit us at go2uti.com.
Logistics Management that if negotiations go longer than expected, one option for importers in terms of contingency plans is to ship early so there is sufficient inven-tory on hand—although that comes with additional costs to carry inventory longer than usual. Another option is shifting cargo to East and Gulf coast ports as well as Canada and Mexico, with air cargo as an option for last minute orders.
The recent Port Tracker said that April was up 10.3 percent annually and 9.3 percent ahead of March. May was expected to hit 1.47 million TEU for a 5.8 percent increase, and June is expect-ed to be up 7.5.
The May and June forecasts are “unusually high” and typically are not expected until later in the summer or the fall the report said, adding that it’s a clear indication that retailers are actively bring-ing merchandise in earlier than normal because of the uncertainty regarding the West Coast labor talks.
––Jeff Berman, Group News Editor
OCEAN
The FMC acknowledges China’s objection to P3 NetworkWASHINGTON, D.C.—Having given the P3 Network its blessing some time ago, The Federal Maritime Commission (FMC) has acknowledged China’s objec-tion to the alliance.
At the same time, however, the FMC says future carrier collaborations should not be ruled out. “Ocean carrier vessel space alliances offer the potential ben-efit of cost savings and environmental efficiencies that come from coordinated deployment of newer, larger vessels,” says FMC chairman, Mario Cordero.
As LM reported late last month, the FMC’s Chinese regulatory counterpart, the Ministry of Commerce (MOFCOM), nixed the P3 Network Vessel Sharing Agreement, calling it “uncompetitive.” The agreement between A. P. Moller-
Maersk, CMA CGM S.A., and MSC Mediterranean Shipping Company would have authorized the parties to share vessels and engage in related cooperative operating activities in the trades between the U.S. and Asia, North Europe, and the Mediterranean.
In March 2014, the FMC concluded an extensive review of the transpacific and transatlantic effects of the P3 Agreement and determined that the agreement was not likely at that time, by a reduction in competition, to produce an unreasonable increase in transportation cost or an unrea-sonable reduction in transportation service under section 6(g) of the Shipping Act.
The Commission’s decision remains in effect absent a withdrawal of the agree-ment by the parties.
—Patrick Burnson, Executive Editor

22 LOGISTICS MANAGEMENT | JULY 2014 WWW.LOGISTICSMGMT.COM
Jeff Berman is Group News Editor for the Supply Chain Group
publications. If you want to contact Jeff with a news tip or idea,
please send an e-mail to [email protected].
Newsroom Notes with Jeff Berman
It’s fair to say that the new rules were unwelcome by the trucking industry and in all likelihood are even less popular now.
HOS restart amendments are front and center in never-ending debate
Since the new motor carrier driver hours-of-service (HOS) regulations took effect in July 2013, there’s been quite a bit of criticism aimed at these revised regulations, specifically its restart provision.
The restart rules require that truckers who maximize their weekly work hours must take at least two nights’ rest when their 24-hour body clock demands sleep the most—from 1:00 a.m. to 5:00 a.m. This rest requirement allows drivers to restart the clock on their workweek by taking at least 34 con-secutive hours off-duty. The final rule allows drivers to use the restart provision only once during a seven-day period.
In the year since the new HOS rules have been live, trucking stakeholders have cited lost productivity due to the restart. They claim that the rule has clearly crimped capacity—which was already tight during the first quarter and into the second quarter of this year.
It’s fair to say that the new rules were unwelcome by the trucking industry and in all likelihood are even less popular now.
With that it mind, it was hardly surprising that an amendment from Senator Susan Collins (R-Maine) was recently approved by the Senate Appropriations Com-mittee by a 21-9 vote ahead of signing off on a $54.4 billion fiscal year 2015 federal transportation bill. The goal of the amendment is to suspend the new HOS restart rules for one year and have the Federal Motor Carrier Safety Administration study them to analyze the safety benefits and provide a better understanding how the restart makes an impact on trucking productivity.
The amendment was soundly endorsed by the American Trucking Associations (ATA). “Since these rules were proposed in 2010, ATA has main-tained that they were unsupported by science…and since they were imple-mented in 2013, the industry and economy have experienced substantial negative effects as a result,” said ATA president and CEO Bill Graves.
ATA said that the primary issue with the restart rules is that they push more trucks onto the road during daytime hours—a reality that
the group contends is a consequence the FMCSA failed to fully analyze from a safety standpoint.
While the Senate committee did sign off on the amendment, it’s now under considerable duress in the aftermath of a recent accident in New Jersey on June 7 in which a Wal-Mart truck hit a luxury limousine from behind, killing one passenger and injuring several others,
including comedian Tracy Morgan. Even though accidents are inevitable, this one
involved a high-profile person and has subsequently raised the call for the Senate HOS amendment to be stricken. And that’s exactly what’s happened in the form of an amendment proposed as part of the Senate appro-priations bill by Senator Cory Booker (D-N.J.) that aims to uphold the current HOS regulations.
Will that amendment get the needed votes and over-turn the effort from Senator Collins? It’s too soon to tell, but it’s clear that HOS and motor vehicle safety are getting national attention—and not for the right reasons.
Any trucking industry stakeholder will tell you that one death on the road in which a truck is involved is too many. But following the tragic New Jersey accident, reports
indicated that the Wal-Mart driver had not slept for 24 hours, although Wal-Mart officials said that was not the case and the driver was compli-ant with HOS guidelines.
So, where are things now? When it comes to HOS, it stands to reason that the situation remains in a state of flux, with things fixing to become more muddled and cantankerous in the meantime.
While these rules will never appease everyone, there needs to be a match in the middle some-where. Here is to hoping that the middle ground is reached sooner than later. M


24 LOGISTICS MANAGEMENT | JULY 2014 WWW.LOGISTICSMGMT.COM
Peter Moore is Adjunct Professor of Supply Chain at the University of Denver Daniels School of Business,
Program Faculty at the Center for Executive Education at the University of Tennessee, and Adjunct Professor
at the University of South Carolina Beaufort. Peter writes from his home
in Hilton Head Island, S.C., and can be reached at [email protected].
Moore on Pricing
The recent announcements by FedEx and other carriers of their intention to switch from a rating system based upon the antiquated National Motor Freight Classifications (NMFC) to a dimension based rate formula was not a surprise to industry insiders.
And while it was a bit of challenge for shippers and LTL carriers to start the revolution, this recent news should be seen as only a first step.
In previous columns, I’ve dared the carrier com-munity to start the process of disaggregating the many factors that make up LTL classified rate tables. Now that the ball is starting to roll, it’s the shippers’ turn to respond with collaborative contracting model offerings in their next RFP.
The NMFC rates are an average of averages that include dimension, weight, value, insurance, and market factors like volume of the type of commodity. The focus on dimension now solves two key problems for the carriers.
First, it gets them out of the ridiculous position of offering 90 percent discounts off of ever- increasing published rate tables. Second, it provides a rate table based on something shippers can manage. In fact, many leading shippers like Proctor and Gamble have demonstrated the savings that can be achieved by condensing product and packaging.
By breaking the NMFC paradigm, new opportuni-ties present themselves on many levels:
1) Insurance: All rates have an insurance compo-nent. Find out if you are self-insured or over-insured and ask for a discount value based on a lower release value.
2) Packaging: Work with your product manage-ment team on reducing dimension through product consolidation and package size reduction.
3) Optimize shipping days and times: Find out what day would be best for the carrier to move your loads. Ask for a rate discount for re-arranging schedul-ing to help fill trucks on “soft” days.
4) Fuel costs: Fuel costs are regional. Understand where your local market rates are and how they are indexed.
5) Driver hours of service: What can you do to speed driver loading and unloading times? Discuss
incentives for optimizing driver productivity.6) Pool distribution: Have you looked at your
network lately? Is there an opportunity for inbound or outbound pooling of loads? There are inexpensive web-based tools for modeling your orders and shipments, and we consistently see savings for shippers through a network optimization exercise.
7) Palletizing: As carriers change to dimensional/density rates, shippers need to negotiate the use of pallets and try new pallet configurations that will help consolidate and condense loads.
8) Collaboration: Instead of a standard RFP, try a collaborative conversation with existing carriers. They
can save on sales costs in re-competing for your busi-ness, and, if they’re smart, will share innovations and ideas to help shippers meet their business goals.
9) Upgrade your transportation management system (TMS): Make sure the shipper system can handle rates that are disaggregated and time sensitive. Can you handle real time quotes, day and time sensitive rates, accessorials and fuel hedging?
And finally, make sure that your carrier partner can handle the variables mentioned above and that their systems will support dynamic pricing under a contract. Can you both dump your subscriptions to expensive rate bureaus?
In the end, both shippers and carriers need to re-engineer the pricing models used for the past 80 years. They need to establish new contracts that are dynam-ic, continuously reviewed, and encourage innovation.
Some major carriers have thrown down the chal-lenge and they’re focused on dimensions—and this assumes all other rate factors are average. Shippers need to use this opportunity to open the dialog and begin collaborating on multiple levels to optimize service and cost. M
Both shippers and carriers need to re-engineer the pricing models used for the past 80 years. They need to establish new contracts that are dynamic, continuously reviewed, and encourage innovation.

Skill is moving inventory from here to there.Will is caring about your business enough to improve your bottom line.
Skill is flawlessly solving a client’s problem.Will is doing it before they ask.
Skill is knowing how to fix a truck.Will is doing it on a holiday. In an ice storm.
Skill is expediting a shipment.Will is getting it to a secret government location.
Skill is moving a family.Will is helping them start a new life.
Skill is what makes us a great shipping and logistics company.Will is what makes us ArcBest Corporation.SM
arcb.com
THE
THE
© 2014 ArcBest Corporation. All rights reserved. All service marks featured in this advertisement are the property of ArcBest Corporation and its subsidiaries.

26 LOGISTICS MANAGEMENT | JULY 2014 WWW.LOGISTICSMGMT.COM
Mark Pearson is the managing director of Accenture’s Supply Chain
Management practice. He has worked in supply chain for more than 20 years and has extensive
international experience, particularly in Europe, Asia, and Russia. Based in Munich, Mark can be reached at
Pearson on Excellence
Manufacturers need to address the talent supply chain
According to a recent Accenture survey of man-ufacturers, 82 percent plan to increase U.S.-based production, 75 percent report a significant shortage of skilled resources, and 11 percent say that they estimate an average percentage drop in earnings due to increased production costs and revenue losses resulting from skills shortages.
So yes, American manufacturing companies may have a people problem. Anticipated demand for goods is strong enough to drive optimistic produc-tion projections. But there may not be enough quali-fied people available to make those plans a reality.
Part of the problem is that an increasing per-centage of U.S. manufacturing roles require skilled workers who need months or even years of training. According to one survey respondent, “Eighty percent of the jobs in this company require a higher skill level, and the other 20 percent are probably semi-skilled. There are no unskilled jobs here anymore.”
Another concern is demo-graphic: The U.S. Department of Labor reports that the aver-age age of manufacturing labor was 44.1 years in 2011. In other words, a large number of work-ers are nearing retirement age.
It also should be noted that companies’ commitment to training is generally not the issue. More than 80 percent of survey respondents have train-ing programs that go beyond the informal. Nearly 10 per-cent spend more than $5,000 annually per employee on skills training.
So if manufacturers accept the importance of training, a lasting solution to the people problem must be more multi-faceted: Spend training dollars more wisely; support external skills-building programs; and
think differently about to ways to attract and retain the best people. Here are some specific strategies for tackling the skills gap.
Offer learning experiences anytime, any-where. More and more manufacturers are using remote, self-paced skills training, available 24/7, and delivered in ways that best suit the learner and the learning objective. A good resource is Tooling U, an online service that offers remote training for engineers, machinists, and press operators.
Take a certification approach to skills build-ing. There are many programs to help manufacturers build certifiable skills. The Manufacturing Institute’s Skills Certification System offers certification in 14 different manufacturing skills. The National Institute for Metalworking Skills offers nationally recognized certifications in key metalworking areas.
Use an apprenticeship training model. One interviewee noted that “quality and expertise play
an important role in the design and manufacture of [our] prod-ucts. What better way to ensure that quality and build that exper-tise internally than through an apprenticeship program? Our apprenticeship program gives us the opportunity to invest in and grow our own workforce.”
Partner with community colleges and high school voca-tional programs to train exist-ing talent and build a pipe-line of future skilled workers. Manufacturers also can collabo-rate with colleges and univer-sities to review curricula and provide ideas for revising them. Northeast Wisconsin Technical College, Lakeshore Technical College, and the University of Wisconsin Marinette collaborate with the area’s ship and yacht building industry to attract and
How severe is your shortageof qualified applicants?
Source: Accenture
Skilled resource shortage
Highly skilled resource shortage
Low 18%
Moderate 22%
Severe 60%
Low 21%
Moderate 40%
Severe 39%

Pearson on Excellence
train employees using a specialized curriculum. Help change perceptions. The clearest illustra-
tion is an existing program called “Dream It. Do It.” It’s sponsored by members of The Manufacturing Institute and seeks to influence young people’s per-ceptions about manufacturing careers. Working at the local, grassroots level, the organization educates high school students and others about opportunities in manufacturing.
Expand the candidate pool. Compa-nies with people problems may need to loos-en their “perfect candidate” objectives—lengthy lists of optimal skills, education or experience. Instead, they could look for more general skills (including those gleaned outside their industry) or for people with somewhat overlapping skill sets that might serve as good starting points. Employers also can identify their best performers and up-skill motivated employees from their pools of unskilled workers.
Lastly, companies may be able to minimize their people problems with technology by using data analyt-ics to correlate training and recruiting programs with key business and operational metrics. In effect, you’re addressing the people problem by taking an advanced
supply chain approach to talent management: the “talent supply chain.”
You’re looking at what you have today and what you need tomorrow, and then using advanced pro-cesses, programs, and technologies to address long- and short-term needs. M
In effect, you’re addressing the people problem by taking an advanced supply chain approach to talent management: the “talent supply chain.”
Adaptive Software. The Key to a Personalized WMS.D-LogPlus powered by steplogicWould your days be simpler and more productive if your WMS did more? Inside the four walls, your systems are evolving, your processes are fluid and your needs vary. Personalizing your WMS is the key to solving so many issues and creating efficiencies for your operation.
Take control. Make your systems work the way you want.
See the video at www.dmlogicllc.com/products or call us at 412.440.4490 to schedule a demo.
moving forward with you

28 LOGISTICS MANAGEMENT | JULY 2014 WWW.LOGISTICSMGMT.COM
EXCLUSIVE
It’s complicatedRollercoaster demand levels and uneven freight volumes in 2013 created havoc in one of the more volatile years on record. In 2014, shippers will need to manage with all the savvy and experience that they can muster to get the capacity they need at a rate that’s fair.
BY JOHN D. SCHULZ, CONTRIBUTING EDITOR
The state of logistics is complicated. Wearisome logisticians struggled with uneven 2013 freight demand levels and are now bracing for a capacity crisis that is becoming “more severe,” according to the findings of the 25th Annual State of Logistics
Report released late last month.The highly anticipated report, compiled by analyst
Rosalyn Wilson and sponsored by Penske Logistics and the Council of Supply Chain Management Professionals (CSCMP), describes last year’s logistics environment as “uneven.” After a slow start to 2013, mid-year shipments were strong before a very deep dive at the end of the year—with not much movement in freight rates across the modes.
However, the picture appears much brighter this year, with Wilson predicting 2014 to be “the best year in the past eight for freight transportation providers.” So far in the first five months of this year, freight shipments are up 13.1 per-cent year-over-year and payments are up 13 percent. For shippers, they’re seeing higher rates and capacity problems looming.
“The first five months of 2014 have been the strongest freight performance since the end of the Great Recession,” says Wilson. “I believe 2014 will be a banner year for the logistics industry.”
That would be welcome news if not for the whiplash effect it’s having on logistics management professionals as well as the transportation providers who are trying to bal-ance their available capacity with uneven surges in demand.
And while the reality for logistics managers feels more like a rollercoaster ride, the report’s raw numbers show the magnitude and importance of the U.S. logistics sector. Last year, U.S. business logistics costs rose to $1.39 tril-lion, slightly below the peak year of 2007 before the Great Recession. The $1.39 trillion spent last year was a 2.3 per-cent increase over 2012; however, that percentage gain was
25th Annual State of Logistics:
$1,385
The U.S. business logistics system cost isthe equivalent of 8.2% of current GDP in 2013($ billions)
Source: CSCMP's Annual State of Logistics Report
Up
2.8%
$469
TOTAL LOGISTICS COST
Carrying costs ($2.459 trillion all business inventory)
TAXES, OBSOLESCENCE,DEPRECIATION, INSURANCE
$330
WAREHOUSING$137
INTEREST$2
Up
2.0%
Up
2.3%
$657
Transportation costs (Motor carriers)
TRUCK (LOCAL)$204
TRUCK (INTERCITY)$453
Transportation costs (Other carriers)
$10Shipper related costs
$53Logistics administration
OIL PIPELINES$13
WATER *$37
AIR *$33
FORWARDERS$38
RAILROADS$74
* WATER: INTERNATIONAL 30, DOMESTIC 7 AIR: INTERNATIONAL 13, DOMESTIC 20
$195
Note: May not sum to total due to rounding

WWW.LOGISTICSMGMT.COM JULY 2014 | LOGISTICS MANAGEMENT 29
John Pirman
Logistics cost as a percent of GDP$ trillions
Source: CSCMP's Annual State of Logistics Report
2004
1.04
2005
1.20
2006
1.34
2007
1.42
2008
1.36
2009
1.12
2010
1.24
2011
1.31
2012
1.35
2013
1.39

30 LOGISTICS MANAGEMENT | JULY 2014 WWW.LOGISTICSMGMT.COM
EXCLUSIVE: 2014 State of Logistics
a significant drop from the 3.4 percent rise in 2012, according to the report.
Business logistics costs as a percent of the nominal Gross Domestic Product (GDP) declined to 8.2 percent, a tick below the 8.3 percent in 2012. This means that the freight logistics sector was growing at a slightly slower rate than GDP. Those figures compare very favorably to 1981, the first year after trucking was economically deregulated, when logistics consumed 15.8 percent of GDP.
The decline in logistics’ percent-age of GDP is traced to lower volumes and lower spending on transportation and services. “That is not good for our industry, but it’s becoming nor-mal since the recession,” Wilson said. “There are pockets that have managed to recover, but the entire logistics sec-tor has not.”
Inventory carrying costs and trans-portation costs rose slightly last year. Inventory carrying costs increased 2.8 percent, while transportation costs were up only 2 percent due to weaker shipment volumes and a lack of growth in rates.
Modal highlights from the State of Logistics Report include:
• Trucking, the largest component of transport costs, rose just 1.6 percent in 2013, which Wilson called “one of the weakest revenue years in recent history.” That was despite a 6.1 per-cent rise in truck tonnage.
• Rail transport costs rose 4.9 per-cent in 2013, with Class 1 freight rev-enue per ton-mile rising 5.3 percent. Overall rail traffic was up 9.2 percent.
• Cost of water transport rose 4.5 percent, reversing the previous year’s downward slide. Ocean carriage is “slowly improving” despite additional capacity.
• Airfreight revenue was unchanged in 2013, even though overall revenue tons carried by air fell 0.7 percent.
It’s still the economyPresident Bill Clinton based two suc-cessful presidential campaigns on a simple slogan: “It’s the economy,
stupid.” The same should be said for logistics managers, whose day-to-day activities are closely tied to the current overall economic climate that can be described as lackluster, complicated, and uneven.
“Last year was a much more com-plicated year from a purely economic point of view,” said Wilson during the release of the report on June 17 at the National Press Club in Washington, D.C. “It was not a stellar year for the economy, but freight did not always mirror the economy.”
Wilson described 2013 as a “roller-coaster.” After a very slow start, there was strong mid-year demand. But just as logistics managers got used to that, demand levels fell off into a void with what Wilson termed a “deep dive” by year’s end.
“If the year were to be looked at as individual quarters, there were defi-nitely some high points for the freight sector, but also some deep valleys,” said Wilson. “Freight shipment volume experienced five three-year lows during 2013, while freight payments hit three-year highs in eight of the 12 months.”
Freight volume in tonnage terms rose in 2013 more than the number of shipments and revenue figures suggest, but rates remained “stubbornly flat,” Wilson added. This left the trucking industry in a weaker position in 2013. In fact, the rising costs for drivers, equipment, and maintenance pushed marginal trucking companies over the edge, as the number of bankruptcies rose again last year.
Despite a surge in online retail growth, real GDP growth was a paltry 1.9
percent last year compared to 2.8 percent in 2012. That level of sub-par GDP may continue this year. Recently the International Monetary Fund revised its prediction downward to 2 percent from 2.8 percent for GDP growth this year.
However, factors behind this mediocre growth run mostly counter to the growth of freight volume, said Wil-son. These included increased inventory investment, a decel-eration in imports, and a
strengthened state and local government spending that were the strongest upward drivers of third quarter GDP.
In the meantime, U.S. exports to China have “dropped off significantly,” Wilson said. That’s because China is in the midst of its own economic prob-lems, she added, noting higher unem-ployment and falling domestic demand in that country.
Capacity crunch loomingTrucking capacity is becoming a “more severe” issue for shippers, according to Wilson, and the truck driver shortage is currently the top concern for trucking executives who are coping with higher costs for drivers as well as compliance with tougher government regulations.
“More and more drivers are walk-ing away from the industry because of increased regulatory burden and decreased wages,” said Wilson. “In 2012, capacity was tight sporadically through-out the year, and the truck driver short-age is currently having a dampening effect on freight movement.”
Exacerbating the capacity issue is the rising number of trucking bank-ruptcies. According to panelist Donald Broughton, an analyst at investment banking firm Avondale Partners, truck-ing bankruptcies increased for seven straight quarters last year and are at a three-year high. Some 21,775 trucks were idled in 2013 due to company shutdowns, which is larger than 2010 and 2011 combined.
Those bankruptcies have continued into this year. Just this month, Delanco, N.J.-based New Century Transporta-tion, a hybrid truckload carrier with
135130125120115110105100
2011 2012 2013
Truck tonnage indexIndex 2000 = 100
Source: American Trucking Associations
* Average index value
115.8*118.4*
125.7*

WWW.LOGISTICSMGMT.COM JULY 2014 | LOGISTICS MANAGEMENT 31
EXCLUSIVE: 2014 State of Logistics
The $35 billion less-than-truckload (LTL) market, benefitting from a rebound in the U.S. industrial sec-
tor, is enjoying a renaissance after five lean years. And leading LTL executives say it’s about time.
Chuck Hammel, president of regional LTL Pitt Ohio, labels the cur-rent overall market as “good, not great,” adding that “good” is surely a welcome
change from what it has been since 2009. “We’re see-ing solid tonnage growth from existing customers, and we’re asking for and getting fair increases on the rates,” he said. “Capacity is running between balanced and tight.”
LTL carriers enjoy a distinct market concentration advantage over the highly
less-than-truckload
Welcomed rebound
1,300 employees and 2,000 trucks and trailers, closed suddenly, filing for Chapter 7 liquidation. All of this capacity reduction in trucking likely means higher rates for shippers, said Wilson. “And carriers should be able to significantly raise truck rates this year, probably in the 5 percent to 8 percent range.”
That would be a sharp difference from last year, when intercity truck revenue rose 1.8 percent and local delivery revenue was up just 1.2 per-cent. “Rates have been relatively flat with the exception of spot rates when capacity is scarce,” Wilson said.
Shippers copingIn this complex logistics environment, logistic managers are coping with all of the savvy and experience that they can muster.
Increasingly, they are engaging third-party logistics providers (3PLs) to ensure capacity and handle com-plicated movements. Although 3PL growth has slowed internationally, domestic transportation management gross revenue was up 7.1 percent, slightly below 2012’s 9.2 percent surge. Dedicated contract carriage grew by 3.6 percent last year, Wilson said, par-tially because dedicated assures that enough drivers will be available when capacity is tight.
“Human capital is keeping me up at night,” said panelist Mark Althen, president of Penske Logistics, a 3PL that operates a fleet of 2,000 trucks and works with many multinational custom-ers. “If we could find 1,000 to 1,500 driv-ers we could put them to work immedi-ately. It’s a real strain on capacity.”
Overall, Althen said that he’s wit-nessed about a 3 percent drop in pro-ductivity, mostly because of restraints caused by reduced hours-of-service (HOS) regulations. In the food and beverage sector, Althen said, produc-tivity has dropped as much as 8 per-cent as the driver squeeze has caused much higher costs.
“Shippers really want to streamline their supply chains, but they want to increase their service levels as well,” Althen said.
Consumers are increasingly expecting next-day or even same-day deliveries; and
for some customers, Althen said Penske has arranged specific fleet deliveries to smaller distribution centers in order to speed products to customers.
“We have improved our end-to-end supply chain system,” said panelist John Herzig, vice president of distribu-tion and logistics for Bayer HealthCare’s consumer logistics service center, “We’re now taking additional steps in trimming inventories. We’re reacting quicker to changes, and we’ve re-engineered our entire demand forecasting business.”
Herzig said his supply chain is man-aging at a “decent pace.” But he said that he had concerns about capacity, HOS, and the driver shortage. To help achieve more efficient capacity, he said that Bayer HealthCare is currently shifting from a major LTL shipper to becoming more of a truckload ship-per—and capacity concerns are driv-ing that shift.
“We used to only be concerned about capacity at month-end and quar-ter end, but now it’s almost a daily occurrence,” said Herzig. “We have to get better at planning, and we have to get better at collaboration with our customers. We have to get better in that space.”
Panelist Richard Jackson, executive vice president of Mast Global Logis-tics, a subsidiary of Limited Brands Inc., said that his company is “mov-ing through some of the challenges” in moving products with speed and reli-ability. Even as fashion tastes change faster than ever, he said fashion has been held back because of restrictions in its supply chain.
“There are significant parts of our supply chain that are going slower,” said Jackson, a 16-year veteran of Mast Global Logistics. “The challenge for retail is that we want speed and we need reliability.” To help meet those challenges, Jackson said that he has increased the percentage of freight handled by dedicated contract car-riage in order to handle ever-higher demands from fashion retailers.
Specifically, Jackson said that the change in ocean carriage toward slower shipping speeds has caused headaches in his transpacific routes. “We’ve defi-nitely felt the impact in the slowdown in ocean carriage,” he said. “It’s not totally unexpected because ocean car-riers have struggled with profitability since the recession.”
That’s translated into higher water rates. Jackson added that over the last 12 months to 18 months he’s seen pressures on rates and also challenges on on-time service.
And this trend most likely will con-tinue across all modes, according to Wilson, as the capacity crunch wors-ens as freight demand increases. This will only hasten the need for nimble logistics managers who are increas-ingly asked to juggle more freight demands in a tightening capacity environment and higher costs for nearly every mode.
“All indications are that freight will grow moderately for the rest of the year and the economy should follow suit,” Wilson predicted.
—John D. Schulz, Contributing Editor

32 LOGISTICS MANAGEMENT | JULY 2014 WWW.LOGISTICSMGMT.COM
EXCLUSIVE: 2014 State of Logistics
fragmented truckload sector. The top five LTL carriers by revenue (FedEx Freight, YRC regional and long-haul, Con-way, UPS Freight, and Old Dominion Freight Line) have a 55 percent market share. By contrast, the top five carriers in the non-union TL market have less than 5 percent mar-ket share of that $300 billion market.
This differentiation is due to the fact that LTL carri-ers face significant barriers to entry. In order to oper-ate a typical LTL hub-and-spoke network operation, it takes hundreds of millions of capital costs to buy real estate, build terminals, and staff those facilities around the clock. By contrast, TL carriers operate largely point-to-point without much in terms of brick-and-mortar costs.
Statistics provided by SJ Consult-ing, a research firm that closely tracks the sector, show LTL’s renaissance. As the accompanying chart shows, LTL demand is accelerating and pricing has been gaining momentum over the past four quarters.
In the first quarter of this year, LTL tonnage rose by a robust 4.9 percent year over year. That followed 0.7 percent, 2.9 percent, and 4.8 percent year-over-year increases in tonnage for the second, third, and fourth quarters of 2013.
Not surprisingly, this tonnage surge has resulted in solid LTL rev-enue gains. In the first quarter of this year, LTL revenue per hundredweight (excluding fuel surcharges) rose 2.5 percent. This followed similar gains of 1.4 percent, 1.4 percent, and 1.5 per-cent in the second, third, and fourth quarters of last year.
“LTL pricing is fair,” said Satish Jin-del, principal of SJ Consulting. “It will vary by which part of the country and which lanes, with carriers in the Mid-west and Mid-Atlantic seeing good improvements.”
Several factors may be respon-sible for those geographic gains. The auto industry’s rebound is helping carriers in the upper Midwest keep
truckload
Capacity tight, drivers neededThe $300 billion for-hire truckload
(TL) sector is enjoying a fairly busy 2014, with most carriers
reporting a balanced picture of tighter-than-average capacity against decent if not spectacular demand levels.
“Demand for truckload capacity continues to be firm with some pock-ets of the country stronger than others, in particular the Texas market,” said Joe Dagnese, president of Con-way Truckload.
The biggest challenge for Con-way
Truckload and other leading TL carri-ers continues to be finding qualified drivers. Demographics, tighter drug and alcohol screening, the govern-ment’s Comprehensive Safety Analy-sis (CSA) crackdown, so-so pay, and the rigors of the job have combined to make the pool of available drivers smaller—and more expensive to find and retain.
“As an industry, we need to be more innovative in how we attract new driv-ers and develop the next generation,”
0.7%
1.4%
Q2 2013
Demand is acceleratingand pricing is gaining momentumLTL tonnage and yields (YOY % change)
Source: Company Reports, SJ Consulting Group, Inc. estimates
*adjusted for fluctuations in weight per shipment
2.9%
1.4%
Q3 2013
4.8%
1.5%
Q4 2013
4.9%
2.5%
Q1 2014
LTL tons/day LTL rev/cwt. excluding FSC*
their trucks filled. The Mid-Atlantic is gaining strength due to pent-up demand after a brutal winter caused first quarter freight levels to drop. And keep in mind that U.S. opera-tions of Toronto-based Vitran Express are basically being closed out and absorbed by Central Transport, caus-ing better results for other U.S. LTL carriers in those regions once served by Vitran’s units.
Most LTL carriers are routinely
seeking and getting 3 per-cent to 4 percent increases on some lanes of con-tract traffic. Most carriers announced a general rate increase in the 5.5 percent range the first of the year, and there is some talk about a second GRI later this year.
But increasingly, carriers are making rate adjustments on a customer-by-customer basis. Those shippers with the best freight character-istics—little waiting at the docks, ease of entry/exit, accurate weight shipments—are getting the best consider-ation when it comes to miti-gating higher costs.
Most LTL fleets are reporting difficulty in adding quality drivers, especially in
line-haul operations. In that area, the LTL industry is competing with the larger, mostly non-union, long-haul TL carriers that have been coping with a driver shortage for years.
The bottom line for shippers is to expect pass-through rate increases in the LTL industry to help cover for the higher costs in recruiting and obtain-ing qualified long-haul drivers.
—By John D. Schulz, Contributing Editor


34 LOGISTICS MANAGEMENT | JULY 2014 WWW.LOGISTICSMGMT.COM
EXCLUSIVE: 2014 State of Logistics
said Dagnese.The driver shortage,
described by one top TL exec-utive as “horrible” already, promises only to get worse as the economic recovery con-tinues and demand improves. The top TL carriers are work-ing closely with veterans orga-nizations, driving schools, and other outplacement resources to encourage military to con-sider truck driving as a career of choice after their service.
If they’re willing to learn how to drive a civilian 53-foot tractor-trailer, those vets will find an ample supply of jobs paying around $50,000 to start, jumping up to $60,000 in the second or third year. That’s because there are now more heavy trucks on the road than ever. The U.S. heavy-duty truck fleet grew to a record 3.66 million—the largest size on record during the first quarter and a 3.2 percent increase from a year earlier, according to market research firm IHS Automotive.
First time registrations surged 9.2 percent to just over 48,000 in the first quarter of this year, marking the stron-gest quarterly rise since the first quar-ter of 2007.
Eric Starks, president of transpor-
rail
Riding high While there are currently more
good signs than bad regarding the economy, it’s safe to say
that we may need to “curb our enthu-siasm,” as comedian Larry David may observe, until we see more sustained signs of growth and improvement. That is, of course, unless you follow the railroad and intermodal sectors.
It comes as little surprise to learn that both sectors are doing very well amid what has become the new nor-mal—fits and starts in terms of eco-nomic growth.
A look at year-to-date numbers on
the rails brings this into perspective. Domestic carload volumes are up 3.1 percent through the end of May, while intermodal vol-umes, which have returned to pre-recession levels, are up 5.8 percent for the same period.
What’s more, the weekly carload average for the month of May, at 296,759, stands as the high-est weekly average for any month, according to the Association of Ameri-can Railroads (AAR). To top it off, the intermodal weekly average for May is the third-best ever recorded. These are better than good growth numbers for this time of year, and are even more impressive when you consider what car-riers went through in the first quarter
as they endured one of the worst win-ters in years.
“Rail demand is real and is there,” said Tony Hatch, rail analyst and principal of ABH Consulting. “And ship-pers anticipate enough rail capacity to handle it. There is plenty of evidence out there supporting volume growth,
service improvement, and improving relationships between carriers and shippers.”
One prescient reason for this is the ability of the railroads to truly leverage its strengths in terms of ever-improving service quality. Due to these improve-ments, more shippers have jumped on board. In turn, the carriers have lever-aged these excellent returns and have
-1.6%
0.6%
Q2 2013
Capacity is tight and ishelping to improve pricing TL loaded miles and yields (YOY % change)
Source: Company Reports, SJ Consulting Group, Inc. estimates
-0.8%
1.2%
Q3 2013
0.1%1.0%
Q4 2013
-1.0%
3.3%
Q1 2014
Loaded miles Rev/loaded miles excluding FSC
tation forecasting for FTR Associates, said recently that the U.S. economy is showing mixed signals, and it’s dif-ficult to make a long-term call with confidence. But his preliminary analy-sis shows that between now and 2017, the TL sector will need to add an incremental 1.5 million drivers to stay at the current level of 2.7 million long-haul TL drivers.
The TL sector is also coping with what U.S. Chamber of Commerce President and CEO Thomas Donohue calls a “tsunami” of new regulations.
These include tweaks to hours of service, CSA, and requirements for elec-tronic on-board recorders. The bottom line for all this is higher costs, with pro-ductivity losses in the 3 percent to 5 percent range for most TL fleets.
In turn, TL shippers can expect carriers to be seeking that 3 percent to 5 percent back through rate hikes. Starks is predict-ing some TL carriers will seek as high as 6 percent rate hikes—but that will depend on geography.
“The West, Southwest, and Southeast are all tight
right now, while TL demand in the Northeast and Midwest has slackened a bit from the surge earlier this year,” said Starks.
Given the driver shortage situation, FTR is forecasting Class 8 deliver-ies to contract from 290,000 units this year to 260,000 next year. But keep in mind, most of that demand is replacement-only purchases, with few TL fleets actually adding brand new capacity.
—By John D. Schulz, Contributing Editor

At Saddle Creek Logistics Services, warehousing and transportation
are just the beginning. We offer a wide array of integrated logistics
services — cross-docking, product customization, packaging,
e-fulfillment and more. Leverage them to help streamline operations,
accommodate business fluctuations, and control supply chain costs.
We’ll do Whatever It Takes! to help meet your specific goals.
Whatever It Takes!
We go beyond the basics to deliver comprehensive logistics solutions.”
“
BILL BERG, SENIOR DIRECTOR -DEDICATED OPERATIONS
sclogistics.com | 888-878-1177
See our integrated logistics solutions in action. >

36 LOGISTICS MANAGEMENT | JULY 2014 WWW.LOGISTICSMGMT.COM
EXCLUSIVE: 2014 State of Logistics
reinvested into their networks and infrastructure to expand, upgrade, and enhance the U.S. freight rail.
Earlier this year, the AAR said that the seven North American-based Class I railroads plan to invest roughly $26 billion in 2014, adding that since 1980 freight railroads have anted up about $550 billion into their rail networks—with roughly $115 bil-lion alone being invested over the last five years.
“This year’s projected record invest-ments continue a decades-long trend of private railroad dollars that sustain America’s freight rail network so taxpay-er’s don’t have to,” said Edward Ham-berger, AAR’s president and CEO. “This massive private financial commitment is a demonstration of the industry’s resolve to never stop improving.”
The ability to make these investments comes with a caveat for shippers in the form of increased rates at an average annual clip of about 5 percent per year. This has resulted in what has ostensibly become an age-old dilemma between carriers and shippers, with carriers mak-ing the case that hikes are needed in order to make significant capital invest-ments—while rail shippers want more
ocean
Slow and steadyAnalysts and observers of global
ocean cargo movement see a number of emerging trends sur-
facing in the ocean carrier arena later this year. In one of the latest reports on the segment by international con-sulting firm JLL, ocean shippers are provided the following five trends to follow over the next five months:
Cascading of vessels. Watch for larger vessels that allow carriers to maximize efficiencies and therefore lower per-container expenditures by up to 35 percent, which has resulted in an industry-wide push to go big-ger. For instance, the Post-Panamax (8,000 TEU) vessels that were once commonplace at the Port of Los Angeles and Port of Long Beach have
gradually been replaced by New-Panamax (14,500 TEU) ships.
Slow-steaming the new norm. Fuel can account for 60 percent of aggregate shipping expenditures, and in a move to cut costs, carriers have engaged in slow-steaming at 15 knots to 20 knots, not the typical 24. By slow steaming, fuel consumption can be reduced by 53 percent, and also helps minimize carbon footprints. Although it can add up to one week to transpa-cific shipping times, carrier customers have grown more tolerant when ship-ping less time-sensitive items.
Big ships lead to port con-gestion. Bigger vessels and slow-steaming may further strain seaports
due to more concentrated, intermittent shipments at a time when overcapacity is a growing concern. By expand-ing berths, utilizing on-dock labor more proficiently, and investing in new cranes and automated operating systems,
terminals can go a long way towards boosting productivity and expediting the flow of goods.
Alliances reconfigure supply chain. Carrier alliances and consoli-dations are strategies to further control costs by sharing vessels and port facili-ties. While China nixed the proposed “P3 Network,” the G6 collaboration is moving forward with its plans. Ameri-can President Lines, Hapag Lloyd, Hyundai Merchant Marine, Mitsui, Nippon, and OOCL had agreed to join forces as a competitive alternative to P3 and will work as a team through 2016. Earlier this year, Hapag-Lloyd
Source: Association of American Railroads (AAR)
U.S. rail cargo volumes
Total carloads14,608,403
Total intermodal loadings12,831,692
2013
January-May
2014
decreasefrom 20120.5%
increasefrom 20124.6%
Total carloads6,270,639
Total intermodal loadings5,565,055
increase fromthe first fivemonths of 20135.8%
increase fromthe first fivemonths of 20133.1%
for their money. In recent years, there’s been shipper
momentum to re-regulate the indus-try in various forms, whether it be to address the lack of railroad antitrust, fuel surcharges applied by the rails, and reciprocal switching. But given the ten-uous culture in Congress, they’ve not
made meaningful forward progress. Despite the disconnect between rail
shippers and carriers at times, industry experts are quick to point out that even with current growth levels, railroads are not revenue adequate, even if it seems that way to shippers.
—Jeff Berman, Group News Editor

INSTAPAK® FOAM
• Expands on site by 200 times original volume, reducing freight energy.
• Custom-engineered, reduced package size and weight reduces shipping resources.
• Instapak® RC45 foam contains 25% renewable content.
www.instapakcomplete.com
FILL-AIR® INFLATABLE VOID FILL
• Expands on site, reducing freight energy.
• Loses 99.3% of its volume when deflated after use.
• Easy to recycle. Visit how2recycle.info.
www.fillaircyclone.com
BUBBLE WRAP® BRAND CUSHIONING
• Available in Recycled Grade, with 50% pre-consumer recycled content.
• Patented Barrier Bubble® layer retains air longer.
• Maintained performance promotes reusability.
www.bubblewrap.com
PAPER PACKAGING
• Can be recycled in mixed paper streams.
• 100% recycled fibers (85% post industrial, 15% post consumer).
• All production scrap is reclaimed.
www.fasfilsystem.com
ETHAFOAM® POLYETHYLENE FOAM
• Our Closed-Loop Recycling system reclaims nearly all fabrication scrap.
• Recycled Content foams contain 65%-100% pre-consumer recycled content.
• Can be recycled in LDPE recycling systems.
www.ethafoam.com
Corporate Office: Sealed Air Corporation, 200 Riverfront Boulevard, Elmwood Park, NJ 07407©Reg. U.S. Pat. Off. © Sealed Air Corporation 2014. All rights reserved. Printed in the U.S.A.
SC14360736
www.sealedairprotects.com
Packaging Should Protect More Than ProductsAt Sealed Air, when it comes to our products and the environment, we look at the entire lifecycle of our products—because it’s the right thing to do.
Our SmartLife™ initiative is designed to educate and demonstrate how packaging can enhance sustainability through technology, innovation and design. This approach helps our customers make smarter decisions about the entire lifecycle of their packaging materials.
We all share the responsibility of making informed choices about the products and materials we generate, with the ultimate goal being a better way for life.
Let us be your partner in packaging.
For More Info

38 LOGISTICS MANAGEMENT | JULY 2014 WWW.LOGISTICSMGMT.COM
EXCLUSIVE: 2014 State of Logistics
air
Slight improvement despite headwindsAs noted in the 25th Annual State
of Logistics report, the airfreight industry has been facing chronic
overcapacity and deteriorating yields. New details surfacing in similar new research reports mirror these findings.
Even though the overall airfreight logistics index has improved 4.4 points from June 2013, the June 2014 data
contained in the Stifel Logistics Confi-dence Index suggests that the airfreight market still remains fragile, declining 1.9 points to 53.8. The present situa-tion remained the same in May, with Europe to the U.S. the only lane to decline, down 2.0 points to 49.7.
The latest figures from the Interna-tional Air Transport Association (IATA)
The 25th Annual State of Logistics Report states that revenues for the
third-party logistics provider (3PL) sector rose 3.2 per-cent in 2013, much lower than the 5.9 percent growth the market saw in 2012.
“The industry has been faced with slow growth globally, and a general ret-icence to make new investments,” says analyst Rosalyn Wilson, the lead author of the annual report. “The exception has been the continued strength of the domestic 3PL market, where shippers are engaging 3PLs to ensure that they have the capacity when it’s needed.”
Citing the work of 3PL market analyst firm Armstrong & Associates, the annual report states that the 3PL sector can be sliced into four seg-ments, each representing a subset of the industry. While still the smallest segment, the domestic transportation management segment has been the fastest growing.
And last year was no exception, with gross revenues up 7.1 percent—just a little lower than 2012’s 9.2 percent. With capacity a rising issue, the dedicated contract carriage seg-ment continued to gain ground, ris-ing 3.6 percent in 2013. Freight for-warder revenue rose 4.2 percent as
AG and Compañía Sud Americana de Vapores signed a binding contract on merging CSAV’s entire container busi-ness with the German carrier.
Winners and losers. Larger ves-sels and the G6 collaboration suggest fewer ships in the water and less fre-quent port calls. It also means carriers can potentially pick the winners and losers. The haves will be those indus-trial corridors with excellent connec-tivity to inland ports and those seaports able to quickly and efficiently off-load
cargo. On the industrial real estate front, JLL believes that Atlanta and Baltimore will be notable beneficiaries.
Atlanta is a key population center and is connected by rail not only to the Port of Savannah, which is now ranked third in the nation in TEU volumes, but also to several other Southeast seaports—each of which is enhancing their infrastructure to accommodate larger ships. At this point, Baltimore is Post-Panamax ready, and CSX is build-ing a near-dock intermodal facility that
will be incorporated into its National Gateway double-stack network proj-ect, which could also help to drasti-cally reduce transportation costs for global shippers.
“In the end, this is not a zero-sum game, and established markets home to large consumer bases will continue to prosper,” says Richard Thompson, global head of supply chain and logis-tics solutions at JLL. “All will have to evolve to remain competitive.”
—Patrick Burnson, Executive Editor
well, adds Wilson.Meanwhile, Capgemini
Consulting, a prominent IT think tank and 3PL out-sourcing advisor, contends that omni-channel fulfill-ment challenges, especially in the retail sector, are
reshaping the current 3PL market-place. The distinction between for-warder and lead logistics provider, as a consequence, may become even more blurred over the course of this year.
“A customer-driven supply chain
3PL
Omni-channel fulfillment to reshape market
may eliminate some legacy roles,” says Shanton Wilcox, vice president at Capgemini. “Last-mile logistics now includes responsibility for the customer experience, shifting priorities, and attention across the supply chain.”
Likewise, Wilcox says, customer demand is pushing delivery interfaces up the supply chain and nearer to the point of manufacturing. Retailers are moving to virtual inventory manage-ment, accounting for product at all phases of movement as opposed to limiting sales by physical warehouse inventory rules.
“Overall, fulfillment is being driven by the savviest consumer, with cre-ative and diverse solutions entering the third-party logistics market space to meet those omni-channel needs,” says Wilcox.
—Patrick Burnson, Executive Editor

WWW.LOGISTICSMGMT.COM JULY 2014 | LOGISTICS MANAGEMENT 39
EXCLUSIVE: 2014 State of Logistics
for April indicate that while the freight market improved 3.2 percent above previous year levels, demand has not. Traffic levels in April were slightly
below those of January and 1.1 percent lower than what was recorded in March.
IATA indicated that European air-lines saw demand
for air cargo fall by 0.7 percent com-pared to April 2013, marking a slower start for carriers as they entered second quarter—particularly as GDP growth in the Eurozone was just 0.2 percent in the first quarter.
However, a slightly different and more encouraging story for airfreight seems to be playing out in Asia, where preliminary traffic figures for the month of April showed some growth in international air cargo markets.
According to the Association of Asia Pacific Airlines (AAPA), international air cargo demand in freight ton kilo-meters (FTK) increased for regional carriers by 4.7 percent in April, on the back of sustained demand for Asian exports. However, freight load fac-tors remained under pressure due to capacity expansion.
With offered freight capacity expanding by 5.3 percent, the interna-tional freight load factor averaged 64.3 percent in April, 0.4 percentage points lower than the same month last year.
“International passenger traffic demand continued to grow, with the region’s carriers registering a 5.2 per-cent increase in international pas-senger numbers during the first four months of the year,” says Andrew Herdman, AAPA director general. “This was on the back of an improve-ment in business and consumer sen-timent in most economies worldwide. During the same period, air cargo demand for the region’s carriers grew by 4.2 percent, thanks to an improve-ment in global trade conditions.”
Analyst Rosalyn Wilson makes a similar observation in her report, not-ing that passenger jets are carrying growing volumes of cargo in their bel-lies, taking market share from cargo freighters.
TURN YOUR WAREHOUSE INTO A POWERHOUSE, WITHOUT SOFTWARE OR INFRASTRUCTURE CHANGES.
Converting a stationary workplace to a mobile one is the easiest, most economical way to increase productivity of your current workers and infrastructure. Make your employees’ workplace mobile and free from stationary power sources and data cabling with a Mobile Workplace System by Newcastle Systems.
Mobile Workplace Systems Enable You To:
• Quickly obtain measurable productivity gains without months of planning and implementation
• Integrate with your current equipment
• Instantly scale your employees’ current operations to handle increased throughput
• Streamline processes in shipping/receiving, inventory management and more
Learn more at www.newcastlesys.com/powerhouse
MOBILE WORKPLACE SYSTEM
15B Sylvan St. Middleton, MA 01949 USA 781.935.3450
www.newcastlesys.com
“We’ve been using our mobile workplace system for over a year and I can’t even explain the difference it made in speed and accuracy when scanning/labeling goods coming in and out of the warehouse. You guys are life savers!” - Newcastle Systems Customer
The Power to Move Your Workplace
All cargo airlines carry more than 79 percent of revenue ton-miles of freight and commercial passenger car-ries account for the rest. The amount being carried by passenger jets has been increasing especially because there’s more room in the bellies of
these aircraft with the proliferation of baggage charges. According to Wilson, belly cargo in passenger planes is very profitable, estimated at close to 65 per-cent, so passenger airlines have been pursuing it more aggressively.
—Patrick Burnson, Executive Editor

40 LOGISTICS MANAGEMENT | JULY 2014 WWW.LOGISTICSMGMT.COM
Transportation Best Practices/Trends
Exclusive Study: The HOS rule change and trucking operations Varying estimates from positive to pragmatic existed before the new rule became effective in July 2013. However, the grim reality is that trucking stakeholders are now experiencing substantial losses in productivity due to the change—and in many cases it’s much worse than was predicted.
BY MARY C. HOLCOMB, PH.D., ASSOCIATE PROFESSOR, UNIVERSITY OF TENNESSEE; JOSEPH M. TILLMAN, CHIEF RESEARCHER, TSQUARED LOGISTICS
It’s become clear that trucking executives, logistics man-agers, and drivers feel that the federal government has created an environment that restrains the flow of freight following a year of living with the new hours-of-service rule (HOS) that became effective on July 1, 2013.
If you rewind 12 months, varying estimates from posi-tive to pragmatic existed before the new rule became effec-tive regarding the impact of the changes. However, the grim reality is that trucking stakeholders are now experiencing losses in productivity due to the rule change—and in many
cases it’s much worse than was predicted. The changes to the HOS rule were established to
increase transportation safety related to commercial motor vehicles (CMV). The regulation was aimed at decreasing the amount of CMV accidents due to driver fatigue.
As such, the most impactful change to the HOS rule that became law in 2013 is the use of the restart, which is lim-ited to one time per week—once every 168 hours from the beginning of the prior restart. A compounding effect was the requirement that a valid 34-hour off-duty restart period

WWW.LOGISTICSMGMT.COM JULY 2014 | LOGISTICS MANAGEMENT 41
Type of transportation moveaffected by the HOS rule change
Source: Mary C. Holcomb, Ph.D., associate professor, University of Tennessee;Joseph M. Tillman, chief researcher, TSquared Logistics
Long haul moves 40.5%
Short haul moves 18.9%
Dedicated moves 23.0%
One-way moves 17.6%
3 months after implementation
Long haul moves 40.6%
Short haul moves 23.4%
Dedicated moves 21.7%
One-way moves 14.4%
One year after the HOS rule change
How much productivity will be lost?
Source: Mary C. Holcomb, Ph.D., associate professor, University of Tennessee;Joseph M. Tillman, chief researcher, TSquared Logistics
10.1%14.1%
13.6%22.4%
26.8%26.3%
22.7%17.3%
26.8%20.0%
>10%
Between5% and 9%
Between3% and 4%
Between1% and 2%
<1%
20132014
must include two periods from 1 a.m. to 5 a.m. According to FMCSA, the costs and benefits of the
restart provisions would primarily affect the 15 percent of the 1.6 million over-the-road driving population with the most intense driving schedules.
To ascertain if this was indeed the case, and to gain a bet-ter understanding of the impact of the rule change on truck-ing operations, we conducted two studies. The first took place in October 2013, at approximately the three-month mark to see how well carriers and shippers were adjusting to

42 LOGISTICS MANAGEMENT | JULY 2014 WWW.LOGISTICSMGMT.COM
Transportation Best Practices/Trends: HOS
the new operating environment. The second study was con-ducted in June 2014 as a follow-up to see if a clearer picture had emerged regarding the impact.
It has indeed, and the news for shippers is not good. A year after the implementation, the shipper outlook has changed from one that projected a possible rate increase between 3 percent and 4 percent to a new projection that the increase could be much higher.
Added to this misery, data from the study show that only about one-third of shippers have experienced any success from working with their strategic carrier partners to mitigate the productivity loss from the rule change. To date, the larg-est percentage of shippers (34 percent) report a net-neutral position from these efforts.
Assessing the impactA total of 417 companies partici-pated in the first study and 474 companies, primarily representing the manufacturing sector, partici-pated in the second part of the study. The giants of shipping—companies with annual revenues greater than $3 billion—represented 22 percent of total study participants, and small size companies—annual revenues of $500 million or less—accounted for 52 percent of respondents.
The study participants reported that the type of truck transport
most affected by the rule change is long-haul moves, fol-lowed by dedicated and short-haul moves. An interesting change from early implementation to a year later is that short-haul moves are now also feeling more consequences.
It’s clear that the estimates of the impact on productivity were significantly under projected. Early in the implemen-tation of the HOS rule change, many shippers thought the impact would be in the 1 percent to 4 percent range. The reality is much more grim: The expected loss will be some-where between 3 percent and 9 percent, with many more shippers anticipating that the deficit to be in the upper end of that range.
Dire consequencesThe loss in productivity cannot, and will not, be absorbed by the carriers. The data from our earlier study indicated that
47 percent of shippers expected their rates to increase as a result of the HOS rule change. A year into the change and now 73 percent of shippers say they have experi-enced and anticipate further rate increases.
There’s much more certainty on the carrier side as to what the future holds. Some 90 percent of the carriers that participated in the second study reported that they foresee a rate increase for their customers.
So the question remains: How much are rates going to increase?
The data suggests that there’s some difference of opinion on this topic. Some 37 percent from the second study (2014) participants reported that the rate increases would be between 3 percent and 4 percent, while 35 percent stated that the increases would be between 5 percent and 9 percent. Through leverage of their freight
Efficiency efforts with strategic/corecarriers achieving limited success
Source: Mary C. Holcomb, Ph.D., associate professor, University of Tennessee;Joseph M. Tillman, chief researcher, TSquared Logistics
High success 4%
Some success 29%
Limited success 23%
Very limited success 10%
Neutral 34%
Anticipated success of help from core carriers>10%
Between5% and 9%
Between3% and 4%
Between1% and 2%
<1%
How much will rates increase?
Source: Mary C. Holcomb, Ph.D., associate professor, University of Tennessee;Joseph M. Tillman, chief researcher, TSquared Logistics
8.7%13.0%
25.0%34.6%
42.4%36.8%
23.9%14.1%
0%1.6%
20132014
There’s much more certainty on the carrier side as to what the future holds.
Some 90 percent of the carriers that participated
in the second study reported that they foresee
a rate increase for their customers.

For next-day delivery with a smooth finish.
Reliable next-day delivery from an industry leader. Reddaway is the full-bodied leader in
LTL transportation services for quality handling, on-time performance, more next-day lanes and delivery
options, and best-in-class customer care. So, when you want robust service to, from or within California,
visit reddawayregional.com/smooth or call 888.420.8960. You and Reddaway – it’s the perfect pairing.
Copyright ©2014 YRC Worldwide Inc.

44 LOGISTICS MANAGEMENT | JULY 2014 WWW.LOGISTICSMGMT.COM
Transportation Best Practices/Trends: HOS
volumes and other efficiency efforts, further analysis shows that the giants of shipping anticipate rate increases predom-inantly between 3 percent and 4 percent.
In the early stage of implementation, 58 percent of respondents reported that they would pass the rate increases on to their customers. That percentage has now risen dramatically to 76 percent. The fact is that the carri-ers or the shippers can’t entirely absorb the rate increases that have already been instituted along with the ones that will shortly become reality because the loss of productiv-ity is just too large.
How to stem the tide Many shippers are relying on their strategic and core carri-ers to help them minimize any rate increases. Indeed, in our first study, the data indicated that 66 percent of the shippers were actively working with their carrier partners to increase the efficiency of their operations. Some 50 percent of those shippers believed that these efforts would be successful.
Eight months later and the real-ity is a bit different. In our second study, only 21 percent of the ship-pers reported that their strategic and core carriers are actively work-ing with them to increase effi-ciency. There’s also awareness that shippers were too optimistic about what could be achieved. As our
data show, only 4 percent of shippers have realized high lev-els of success through improved partnering. For most, the results have been, at best, neutral.
There’s little doubt that shippers are aggressively working to mitigate the impact of the HOS rule change. In our first study, the top three initiatives being implemented by ship-pers indicated a strategic approach to the problem. They reported that they segmented their customers and deter-mined which ones could—or would—accept longer lead times and larger delivery windows.
It comes as no surprise that, nearly a year later, ship-pers are still utilizing the top two initiatives in an attempt to increase operating efficiency since those initiatives tar-get the two main cost drivers respondents reported in our first study.
Speed and distance have the biggest impact on cost. In a business environment where customers and consumers are anxious to have lead times reduced, it seems some-
what implausible that transit time requirements can be manipulated to any great extent. Perhaps a more viable solution, albeit more long-term in nature, is the distance fac-tor. The study data indicate that while 31 percent of shippers are considering a change to their net-work as a result of the change, a vast majority (69 percent) are not at this time.
Shipment consolidation, how-ever, has moved much further down the list in terms of actions. The use of drop and hook has con-tinued to be one of the top initia-tives and it has been joined with the use of dedicated transportation as a means to improve productivity.
Is intermodal the answer?Early in the implementation of the new HOS rule, 70.1 percent of the study participants reported
The fact is that the carriers or the shippers can’t
entirely absorb the rate increases that have already
been instituted along with the ones that will shortly
become reality.
Speed and distance are primary cost drivers
Source: Mary C. Holcomb, Ph.D., associate professor, University of Tennessee;Joseph M. Tillman, chief researcher, TSquared Logistics
Transit timerequirements
34.8%
Density ofvolume
9.6%
Distance ofshipments
30.8%
Shipmentweight
10.1%
Specialhandling
requirements
14.6%
Top 3 initiatives toincrease operating efficiency
Source: Mary C. Holcomb, Ph.D., associate professor, University of Tennessee;Joseph M. Tillman, chief researcher, TSquared Logistics
Anticipated success of help from core carriers
Improving shipmentconsolidation;increasing the useof drop and hook
Extending thelead time for some
customers Increasing deliverywindows for some
customer

© 2014 C
.H. Robinson W
orldwide, Inc. All Rights Reserved. w
ww.chrobinson.com
Make a Strategic Move You’re committed to success. So is C.H. Robinson. Your success that is. It’s easy to view your supply chain as a pawn rather than an essential advantage to your business. Turn your supply chain into the competitive edge you need to propel your success forward in today’s global market.
Accelerate Your Advantage® | accelerateyouradvantage.com

46 LOGISTICS MANAGEMENT | JULY 2014 WWW.LOGISTICSMGMT.COM
Transportation Best Practices/Trends: HOS
that they did not anticipate moving more freight to inter-modal, while 30 percent indicated that they would be shifting more volume to intermodal. That percentage has dropped some, however, and as transportation costs have increased the use of intermodal shows signs of rising.
In our second study, 37 percent of responding ship-pers now report that they will be moving more freight via intermodal. Just how much freight will be shifted to this
method? The data suggest that 3 percent to 4 percent of the current volume moving over-the-road will be shifted to rail.
What is not obvious is the railroads ability to absorb this volume of freight. Efforts to expand rail capacity to meet the growing demand for intermodal and other traffic have not kept pace with the demand. This suggests that shifting over-the-road freight to this other mode will not totally curtail rising transportation costs that will have resulted from the rule change.
A cautionary tale is unfolding for shippers and carri-ers. Carriers held the key prior to the HOS rule change. They continue to do so, as capacity continues to shrink and demand rises for their services.
In this position, carriers have the ability to raise rates beyond the cost increases caused by the rule change. How-ever, carriers would be wise to show restraint in the new operating environment, as history will almost certainly repeat itself and firm foundations will quickly turn to salt and sand.
Mary C. Holcomb, Ph.D., University of Tennessee; Joseph M. Tillman, TSquared Logistics
The authors would like to thank Dean Vavalides of Pilot Flying J Corporation for his contribution to Part 1 of this study.
When you’re ready to apply systems analysis to logistics. You are ready for American Public University.
With more than 90 degrees to choose from, there’s almost no end to what you can learn. Pursue a respected Transportation & Logistics Management degree online — at a cost that’s 20% less than the average published in-state rates at public universities.*
Visit StudyatAPU.com/logistics
2014
ONLINE PROGRAMSBEST
BACHELOR’S
*College Board: Trends in College Pricing, 2013
We want you to make an informed decision about the university that’s right for you. For more about our graduation rates, the median debt of students who completed each program, and other important information, visit www.apus.edu/disclosure.
>10%
Between5% and 9%
Between3% and 4%
Between1% and 2%
<1%
The growing importance ofintermodal in freight movement
Source: Mary C. Holcomb, Ph.D., associate professor, University of Tennessee;Joseph M. Tillman, chief researcher, TSquared Logistics
4.6%18.3%
9.8%22.6%
13.4%36.6%
14.4%
57.7%
17.2%
5.4%
20132014

Find everything you need when researching companies, trends, and industries.Supply Chain 24/7 is the ultimate online business resource for transportation, distribution, logistics and supply chain professionals.
Your best business resource for:• News• Best practices• Trends• Case studies• White papers• Webcasts• Research• Special reports• Blogsand much much more!
Visit supplychain247.com. Begin your experience today.
Featured companies that are relevant to the
specific topicTrending news and features
Search engine can search across content elements and by specific
companies
supplychain247.com

48 LOGISTICS MANAGEMENT | JULY 2014 WWW.LOGISTICSMGMT.COM
Do you really need to Despite the benefits of modern supply chain software, many firms have resisted the call to upgrade or replace their warehouse management systems (WMS). We look at the reasons that companies have avoided a WMS upgrade and some of the creative alternatives delivering value.
BY IAN HOBKIRK, COMMONWEALTH SUPPLY CHAIN ADVISORS
Structural changes to supply chains and demand patterns over the last two decades have created a host of new process requirements for distribu-tion centers.
Many companies’ WMS systems have failed to keep abreast of these new requirements, creating oper-ational inefficiencies that eat away at corporate profits. Despite the benefits of upgrading to more modern sup-ply chain software, many firms have resisted the call, and instead have sought less expansive solutions to address their needs. However, several technological advances, which have roots in the 1990s, have finally come of age and are offering alternatives to wholesale platform replacements.
Over the last 12 months, Commonwealth Supply Chain Advisors has conducted an ongoing poll of distribution com-panies in an effort to understand what factors are driving companies to upgrade their WMS software, or, alternatively to find some kind of a workaround. We have interviewed numerous companies at all three major stages of the supply chain: manufacturing, wholesale distribution, and retail.
Our interviews have encompassed both large and small companies as well as companies with a variety of current WMS solutions ranging from large best-of-breed solu-tions to basic, internally developed systems. Based on our research, Commonwealth has identified three primary driv-ers of technology replacement: Functionality needs; IT sim-plification; and changes to the ERP Landscape
Over the next few pages will dig into each of these drivers in more detail.
Functionality needs: A tale of two companiesFunctionality gaps are the top reason companies cite when asked why they are considering a WMS replacement. But the specific functionality in question varies widely based on the company’s present WMS maturity level.
Companies can be divided into two basic classes here: Firms that already have a mature WMS in place cite the need for slotting, labor management, and pick wave plan-ning; while companies without a WMS are struggling just to
achieve basic transaction conformation. Class A/Software from the last century: When For-
tune 500 companies began broadly implementing WMS systems in the 1990s, supply chains were very different than they are today. The standard features available in the software back then mirrored those supply chain require-ments. Consider some of the characteristics of the supply chain of the mid-1990s:
Fewer channels: The dominant sales channels for compa-nies manufacturing consumer goods were retail and whole-sale. Amazon.com had just been founded and was still lim-ited largely to books and CDs. This meant that warehouses were primarily picking full cases of product and shipping to stores or other distribution centers via truckload or LTL shipments.
Overall “cost per piece” was low, and pick methodologies did not need to be as complex. Additionally, inventory could be stored in simple tiered models, with a single, fixed pri-mary pick location for each SKU with additional overstock locations.
Fewer retail compliance requirements: Retailers were just beginning to discover the value of compliance programs
Supply Chain & Logistics Technology
Functionality Drivers by WMS Maturity LevelClass A
Companies that already havea moderately robust WMS
Source: Commonwealth Supply Chain Advisors, 2014
Class B
Companies that have little orno WMS capabilities
1 Voice Directed Warehousing
2 Slotting
3 Labor Management
4 More Sophisticated Pick Process
5 Pick Wave Planning
6 Lot Control Issues
7 Task Interleaving
8 Cartonization
1 Real-Time Transaction Con�rmation
2 More Sophisticated Pick Processes
3 Directed Put-Away
4 Receiving Improvements
5 Slotting
6 Improvement Integration to MHE

WWW.LOGISTICSMGMT.COM JULY 2014 | LOGISTICS MANAGEMENT 49
Do you really need to replace your WMS?
with their vendors, and WMS systems were not well tuned to accommodate these requirements.
Fewer security threats: In the pre-9/11 era, there was less need for visibility, traceability, and lot control in the distri-bution center.
Less competitive service level environment: Retailers required less time-specific deliveries, and consumers had far more modest expectations for when they would receive cata-log merchandise.
Slower rate of SKU proliferation: Craft beers, flavored water, and organic pet food weren’t on the radar.
More regional rather than global supply chains: The major shift of U.S. manufacturing to the Pacific Rim was just start-ing to occur. Trading partner collaboration was simpler.
Class B/Tied to paper: On the other side of the spectrum are companies that aren’t burdened with legacy systems. In fact, they aren’t burdened with any systems at all. A surpris-ing number of companies that have experienced rapid growth still do not have a true WMS in their distribution centers—one that features real-time inventory control, system-directed workflows with mobile devices, and automatic data capture.
Instead, these companies operate with paper-based pick-ing instructions, spreadsheets to track bin locations, and
manually keying confirmations back into the ERP system.
This phenomenon is not limited to Tier 3 and Tier 4 organizations or mom and pop operations. There are a surpris-ing number of companies in the $100 million dollar revenue range that still operate this way, including some house-hold name retailers.
Now, let’s take a more in-depth look at what specific functionality is pushing companies to upgrade or replace their WMS systems.
Functionality overview: Inventory and transactional controlThe inventory and transactional control category is one that is near and dear to the hearts of Class B companies. By far, the most important feature that they’re looking for is real-time transaction confirmation—that is the simple ability to confirm that a system-directed task like picking or put-away has been completed correctly.
This is generally done via a bar code scan of either a bin label or product label. Using automatic data capture for confirmation eliminates the need for paper logs, for clerks to enter the logged data into the software system, or for armies of “checkers” to manually verify that the proper goods have been picked.
There are other aspects of inventory and transaction con-trol that are also on the minds of supply chain executives. As traceability throughout the supply chain becomes more important, the ability to use a bar code scanner to capture lengthy lot numbers during a number of warehousing opera-tions will become more and more important.
Functionality overview: Receiving and put-awayOn the inbound side, having more sophisticated directed put-away was high on the functionality wish list for many companies interviewed as part of this project. Receiving and put-away are simple if every SKU has a fixed home location.
But it quickly gets complicated: What happens if the SKU resides in more than one bin? Where does the new product get put-away? What if there isn’t room in one of the current bins for the new product? How can FIFO rota-tion be maintained? Questions like these—and many, many more—make it challenging to execute the put-away pro-

50 LOGISTICS MANAGEMENT | JULY 2014 WWW.LOGISTICSMGMT.COM
cess without the benefit of enabling software.
Functionality overview: Picking, order management, and shippingThe need for more sophisticated pick processes featured promi-nently on the wish lists of both Class A and Class B companies. Paper-based warehouses often have a significant need to clus-ter pick effectively.
Transitioning from dis-crete order picking to cluster picking is one of the biggest single warehouse efficiency gains that a company can ever make. Simply put, it can enable a worker to pick 10 orders in a single trip through the warehouse rather than 10 trips, drastically reducing walking. WMS is a major enabling technology that makes cluster picking possible.
A related methodology, batch pick-ing, is also facilitated with a modern WMS. Batch picking involves picking the entire amount of a SKU required for multiple orders at once, and then separating the batch into individual orders in a secondary step.
Functionality overview: High performance warehousingA handful of additional functionality items can be considered “high perfor-mance warehousing” and may only have applicability in operations with certain volume levels or complexity levels.
Slotting improvements are likely on the wish list of every warehouse man-ager, but only require complex solutions in certain circumstances. Simple opera-tions with few changes in SKU demand patterns can often slot their distribution centers using spreadsheet-based tools.
However, for operations with extreme seasonality, high rates of new product introductions, or fashion-based distribution, slotting becomes a more frequent and complex requirement. These companies require the sort of dynamic, integrated slotting module that is available from a top tier WMS provider, or from a handful of best-of-breed slotting developers.
Improved integration to materials handling systems is another wish list item for many high-performance ware-
houses. In facilities with conveyor-based picking systems, this functional-ity can include improved zone-routing to ensure that cartons are only sent to zones where there are picks required, and the capability to induct new orders at multiple points in the system.
IT simplificationIn addition to functionality require-ments, the need for IT simplification is another major factor behind the desire to upgrade or replace WMS sys-tems. The levels of IT complexity that exist at many companies today can be attributed to four factors:
Macroeconomic changes: For the most part, companies have responded to macroeconomic changes in a piecemeal fashion, implementing individual soft-ware “fixes,” small software sub-systems, and manual workarounds as needs arise. This approach leads to an incredibly com-plex array of software systems at many companies, with many supply chain applications such all stitched together in ways that no one person at the company can easily explain.
Merger and acquisition activity: Many large companies that have made mergers or acquisitions have found it simpler to leave the new company’s existing supply chain applications in place. For evidence, just look at the large number of companies that run different WMS systems and even ERP systems in different facilities or busi-ness divisions.
Multi-channel silos: As multi-channel commerce began develop-ing in the late 1990s, WMS provid-ers emerged with strengths in specific channels. Many companies, for exam-ple, implemented one WMS to man-
age a retail distribution center and a different one to manage their e-com-merce DCs. Many WMS providers have now developed strong capabili-ties across multiple channels, but the siloed software infrastructure still exists among their customers.
Regionalization: Many global enterprises have implemented different WMS and ERP solutions in each region, often based on the strengths of one pro-vider’s service and support in one region over another.
When combined, these factors have created a patchwork quilt of sup-ply chain software applications, and have swelled the ranks of the inter-nal IT departments required to main-tain these disparate ecosystems. This situation has led many companies to contemplate massive ERP or WMS replacement initiatives in an effort to simplify the architecture, reduce sup-port costs, and to make it easier to upgrade software in the future.
Changes to ERP landscapeA final factor leading companies to con-template WMS upgrades or replace-ments involves changes that have been driven by the software providers them-selves. For nearly three decades, the ERP vs. best-of-breed debate has raged in the business community.
Is it better to have a single ERP system controlling most major applications at a business, or is it better to have a number of best-of-breed solutions each managing what it does best? Proponents of the ERP solution tout the simpler interfaces and smaller IT footprint, while best-of-breed advocates cite the improved functionality available from having applications that are truly specialized.
Supply Chain & Logistics Technology: WMS
Supply Chain Transformation Over Two Decades
Source: Commonwealth Supply Chain Advisors, 2014
Supply Chain Aspect 1994 2014 Implications for the Distribution Center
Sales Channels
Retail Compliance
Security Threats
Service Level Expectations
SKU Proliferation
Supply Chain Network
Few
Loose
Low
Modest
Low
Regional
Omni-Channel
Stringent
High
High
High
Global
More need for piece picking, complex pick methodologies, etc.
More need for compliance labeling, ASNs, routing, andscheduling of shipments
Increased need for lot control, country of origin tracking, etc.
Pressure to turn around orders quickly
Increased need for re-slotting
Need for advanced trading partner collaboration tools

WWW.LOGISTICSMGMT.COM JULY 2014 | LOGISTICS MANAGEMENT 51
In the last five years, the lines have blurred. Oracle and SAP have both released new versions of their WMS that are significantly more functional than their predecessors. While still not on a par with best-of-breed solutions, ERP WMS systems are at last closing the gap. This has caused many user companies to revisit the debate, and in some cases to make changes to their software roadmaps.
Why companies avoid upgradesSo, with all of these compelling rea-sons to upgrade a WMS, one might expect nearly every distribution opera-tion to be engaged in some form of upgrade or software replacement to take advantage of new features and simplified IT infrastructure.
This is not the case. While many WMS companies are in fact report-ing strong sales as the U.S. economy rebounds, the vast majority of distribu-tion operations are not engaged in any major WMS replacement projects at the present time. Why is there so much reluctance to replace soft-ware in the face of so many apparent benefits?
Our research suggests that the major factor hold-ing companies back from undertaking WMS projects is fear of implementation issues that will outweigh all of the hoped for benefits.
“There is a general feeling that these projects take twice as long as proposed, the cost will probably double, and there will be major service disruptions along the way,” says the vice president of engineering at a wholesale distribu-tion company with $5 billion dollars in annual revenue. “There are plenty of stories out there of companies that struggled with these projects.”
Why is it that WMS software at times seems so much harder to implement than even ERP systems? Five major factors contribute to a disproportionate number of problems with WMS software: Lack of true process standardization in distri-bution; multiple exceptions to the rule in the warehouse; less business savvy users; materials handling interface require-ments; and a high rate of simultaneous active transaction volume.
These inherent challenges with implementing distribution software often result in cost overruns, resource monopolization, and risk of opera-tional disruption. To be sure, it’s cer-tainly possible to succeed with WMS replacements and upgrades, as numer-ous companies can attest. In fact, it is nearly impossible to run a warehouse that is both accurate and cost efficient without some form of WMS.
Alternatives to upgrades: Voice & WCSOne of the biggest alternative strate-gies in use today involves voice tech-nology in the warehouse. The primary driver behind speech-based warehous-ing in the past was the prospect of allowing workers to operate in a hands-free environment, especially in full-case picking operations, where picking involved lifting heavy, awkward items. Not having to juggle a piece of paper or a handheld computer can significantly
boost pick rates. That was then. Our unscientific sur-
vey of recent voice adopters reveals a startling reason why voice technology is in vogue at the moment. Rather than adopting voice for the traditional reasons ‘hands-free operation’ more and more companies are implementing it for three side benefits that voice software offers: more flexibility, less risk, and less cost than legacy software systems.
More flexibility: Voice software is often more flexible and easy to adapt. Most of the voice software systems today have been written in the last ten years, many of them utilizing the principles of Service Oriented Architecture (SOA). The result has been software that plugs functional gaps and is easily configured by the user to create new workflows.
Less risk: Voice deployments can be done in a piecemeal fashion—add-
ing layers of software on top of legacy WMS systems to address a few func-tionality areas. If the voice deployment fails, the underlying WMS hasn’t really been affected and the operation can continue as before. Thus, voice deploy-ments are less risky than a wholesale WMS upgrade or replacement.
Less cost: Even if a user has been on an annual maintenance agreement and can avoid new license fees, the professional services fees for a full scale WMS upgrade can be very high. To date, voice vendors still have a “new kid on the block” mentality and con-tinue to offer attractive pricing levels in an effort to build their client base.
Another alternative is applying ware-house control software (WCS). WCS supports large material handling sys-tems, providing a single communica-tion platform to conveyors, carousels, scanners, printers, and other devices. WCS systems have largely been devel-
oped by material han-dling manufactures or systems integrators.
Some are little more than development plat-forms, with each installa-tion differing vastly from the others. Some provid-ers, however, have devel-oped WCS systems that are true applications, with a common underly-
ing source-code from one deployment to the next and regular enhancements and upgrades.
However, some of today’s WCS sys-tems are exceeding their original man-dates of communicating with material handling systems, and, like voice sys-tems, are being deployed to achieve functionality that is too challenging or risky to develop in the company’s WMS. Some of the newer WCS systems have also been developed with flexible archi-tecture, and can be used to fill gaps without the resource drain and risk of a wholesale platform replacement.
Ian Hobkirk is the founder and manag-ing director of Commonwealth Supply Chain Advisors and has over 20 years experience in the supply chain indus-try. He can be reached at [email protected].
Supply Chain & Logistics Technology: WMS
Source: Commonwealth Supply Chain Advisors, 2014
Reasons Companies Avoid Replacing/Upgrading WMS(% of Respondents)
Fear of a “Bad” Implementation 44%
Minimal Perceived Bene�t 28%
Cost 28%

Since the tragic day of Sep-tember 11, 2001, our nation’s airports and seaports have been partners with the fed-eral government and local
communities in developing and imple-menting comprehensive security pro-grams. Unfortunately, not all the pro-posed solutions have been practical or enforceable. Shippers are now clamor-ing for clarity.
“Safe and secure seaports are fun-damental to protecting our borders and moving goods,” says Kurt Nagle, president of the American Associa-tion of Port Authorities (AAPA). “But there have been some significant prob-lems with concepts that are simply too expensive and unwieldy.”
Container scanning is without a
doubt the most outstanding example of this state of affairs, affirms Nagle. He joined 70 other shipping organization leaders in writing a letter of objection to U.S. Secretary of Homeland Security Jeh Johnson last month in an effort to postpone enactment indefinitely.
The Safe Port Act passed by Con-gress seven years ago mandates that all maritime containers being shipped to the U.S. must be scanned by non-intrusive inspection devices and radia-tion portal monitors at the foreign port prior to departure. The original goal for implementation of this require-ment was July 1, 2012. However, the Department of Homeland Security (DHS) invoked a two-year waiver cit-ing lack of resources and technology.
In 2009, then DHS Secretary Janet
Napolitano told a Senate Committee that a pilot program designed to test the feasibility of 100 percent scanning had revealed several serious problems including infrastructure, lack of tech-nology, and expense. At that time, DHS estimated that deploying scan-ning equipment would cost approxi-mately $8 million per lane for the more than 2,100 shipping lanes at the more than 700 ports around the world that ship to the U.S.
Johnson now maintains that the objective is “highly improbable, hugely expensive, and bound to impair trade.” Meanwhile, DHS will continue to use and improve existing programs and policies to ensure the veracity of inbound ocean containers.
These include the Container Security
BY PATRICK BURNSON, EXECUTIVE EDITOR
While not all proposed global cargo security solutions have been practical or enforceable, our analysts suggest that there are a few fundamentals every global shipper needs to accept. Here’s how cargo stakeholders are working in unison to gain clarity.
Cargo Security:Defining the fine print
Global Logistics
52 LOGISTICS MANAGEMENT | JULY 2014 WWW.LOGISTICSMGMT.COM

WWW.LOGISTICSMGMT.COM JULY 2014 | LOGISTICS MANAGEMENT 53
Initiative (CSI), which identifies and screens high-risk containers and is operational at nearly 60 ports around the world that handle about 80 per-cent of the maritime cargo containers destined for the U.S. DHS says that it will also refine its targeting algorithms and process to better monitor high-risk containers and cut the number of “false positives.”
Layered approachAt the same time, the AAPA continues to work with DHS on implementing the Transportation Worker Identifi-cation Credential (TWIC) program, including monitoring and comment-ing on U.S. Coast Guard (USCG) regulations for facility compliance with TWIC. AAPA would like to see a TWIC rule finalized.
“We have concerns with the USCG’s proposed TWIC reader rule for several reasons,” says Nagle. “These include the criteria used for determining which ports are subject to the reader require-ment, the inflexibility of the risk analysis methodology, and the lack of tailoring reader requirements for the individual circumstances of each port or facility. Most facilities under the proposal rule would not require a TWIC.”
The question then becomes why have such a costly card that few will use other than as a flash pass? AAPA believes more robust use of card read-ers would result in increased security.
“The current proposal only requires facilities that handle certain danger-ous cargos to use readers,” says Nagle. “AAPA believes that the requirement for readers is too narrow. In the mean-time, the delay in the final USCG regulations related to TWIC reader requirements has resulted in repro-gramming of some TWIC grants to other priorities.”
Nagle adds emphatically that once the new rules are finalized, DHS should make TWIC grants a priority. Security analysts agree that this “pri-ority” makes sense when “layering of risk” is properly employed.
This methodology consists of flexible methods like CSI and Importer Secu-rity Filing (ISF), or more commonly
called “10+2.” This requires shippers to provide containerized cargo infor-mation to be transmitted to the agency at least 24 hours before departure.
Finally, there’s Customs-Trade Part-nership Against Terrorism (C-TPAT), a voluntary supply chain security pro-gram led by U.S. Customs and Border Protection (CBP). Certification allows shippers to be considered low risk, resulting in expedited processing of their cargo, including fewer Customs examinations.
Cyber concernsU.S. maritime ports handle more than $1.3 trillion in cargo annually. The operations of these ports are supported by information and communication systems that are, of course, susceptible to cyber-related threats.
Failures in these systems could degrade or interrupt operations at ports, including the flow of commerce. Federal agencies—in particular the DHS—and industry stakeholders have specific roles in protecting maritime facilities and ports from physical and cyber threats. However, officials at the U.S. Government Accountability Office (GAO) say more has to be done.
Actions taken by two of DHS’ component agencies, the U.S. Coast Guard and Federal Emergency Man-agement Agency (FEMA), as well as other federal agencies, to address cyber security in the maritime port environment have been limited. While the Coast Guard initiated a number of activities and coordinating strategies to improve physical security in spe-cific ports, it has not conducted a risk assessment that fully addresses cyber-related threats, vulnerabilities, and consequences, says GAO.
Meanwhile, Coast Guard officials insist that they intend to conduct such an assessment in the future, but have yet to provide details to show how it would address cyber security. Until the Coast Guard completes a thor-ough assessment of cyber risks in the maritime environment, the ability of stakeholders to appropriately plan and allocate resources to protect ports and other maritime facilities will be limited.
Maritime security plans required by law and regulation generally did not identify or address potential cyber-related threats or vulnerabilities. This was because the guidance issued by Coast Guard for developing these plans did not require cyber elements to be addressed.
Officials stated that guidance for the next set of updated plans, due for update in 2014, will include cyber security requirements. However, in the absence of a comprehensive risk assessment, the revised guidance may not adequately address cyber-related risks to the maritime environment.
GAO now recommends that DHS direct the Coast Guard to assess cyber-related risks; use this assess-ment to inform maritime security guidance; and determine whether the sector coordinating council should be reestablished. GAO also suggests that DHS should direct FEMA to develop procedures to consult DHS cyber security experts for assistance in reviewing grant proposals and use the results of the cyber-risk assessment to inform its grant guidance.
Fortunately, DHS concurs with GAO’s conclusions, and is work-ing with the shipping community to address this growing concern.
Air risk assessmentA coalition of associations represent-ing airfreight forwarding companies is calling on the federal government to solicit input from small- and medium-sized forwarders before expanding the Air Cargo Advanced Screening (ACAS) program.
The program, which analyzes advance

54 LOGISTICS MANAGEMENT | JULY 2014 WWW.LOGISTICSMGMT.COM
Global Logistics: Cargo Security
data on inbound air shipments to the U.S. to assess risk, is currently in pilot phase, but CBP has signaled that they intend to expand it to apply to all inbound air cargo via a rulemaking.
The Airforwarders Association (AfA), the National Customs Brokers and Forwarders Association of Amer-ica (NCBFAA), The International Air Cargo Association (TIACA), and the Express Delivery and Logistics Asso-ciation (XLA) have jointly sent letters to CBP and the Transportation Secu-rity Administration (TSA) noting their support of the concept of the ACAS program’s risk-based analysis at the shipment level, but emphasize that “we are concerned about certain issues which we feel have not yet been fully resolved within the ACAS pilot.”
Brandon Fried, AfA’s president, says that all of the groups endorse the enhanced security initiatives, but wish “to have their voices heard” before implementation. “We’ve been telling our members for some time that this issue can be a real security enhance-ment if it’s done right,” he says.
In addition to detailing issues regarding potential negative impacts
on small- and medium-sized air forwarding businesses, the letters included requests to meet with both agencies and representatives from air carriers to discuss the concerns and try to resolve them.
The four associations—represent-ing non-asset companies that arrange for the shipment of goods by air—are concerned that the ACAS pilot pro-gram has involved only a handful of forwarders, mostly larger operations that already have integrated supply chains and an overseas infrastructure.
Their letters emphasized that the pilot has not included smaller forward-ing companies “that rely on an exten-sive network of independent agents at overseas airports” and for whom “the size and scope of their technology infrastructure…varies widely.”
Accordingly, the groups call for more work to be done to determine
how the ACAS program will be applied to small- and medium-sized forward-ers before they’re brought under its requirements. Furthermore, say these freight intermediaries, the ACAS rule should maintain a level playing field for all filers. “No requirement should create an unfair competitive business advantage for one filer over another,” says Fried.
The groups point to other issues of concern, including that ACAS may not take into account variances among U.S. trading partners in the applicabil-ity and procedures of their own screen-ing programs, most notably that not all countries of origination allow forward-ers to screen cargo.
On this issue, forwarders say that it’s important for ACAS to clarify what the process and verification procedures will be when an ACAS dual-filing is made at a foreign location—first by the forwarder and then by the carrier.
Another key area of concern, per-tinent to both TSA and CBP, has to do with the “targeting rule sets” for determining when additional high-risk screening will be performed. Spe-cifically, the letter requests that ACAS utilize only those risk analysis formulas that have been tested in the pilot.
The TSA letter further outlines con-cerns about operational procedures for forwarders’ screening of targeted ship-ments into the U.S., which have also not yet been fully tested. It also raises questions about the potential impact for screening of U.S. export shipments when other countries’ advance data programs take effect.
Patrick Burnson is Executive Editor of Logistics Management
“No requirement should create an unfair competitive business advantage for one
filer over another.”
—Brandon Fried, president, AfA
A supply chain security program recently initiated by the International
Air Transport Association (IATA) prom-ises to provide guidelines and tools for U.S. shippers operating overseas.
Titled “Secure Freight,” it promotes government standards and principles in which cargo is secured upstream early on in the supply chain and then pro-tected from unlawful interference until it reaches its destination.
“Secure Freight addresses deficien-cies in existing cargo security regimes and brings countries up to the level of International Civil Aviation Organization (ICAO) compliance,” says Tony Tyler, IATA’s director general and CEO.
The Secure Freight tools include:• The Secure Freight standards man-
ual that defines how Secure Freight oper-ators in that state comply with standards that allow shipments to be transported
securely across supply chains.• The Secure Freight operational pro-
cedures that provide practical guidance on how to move cargo and its associated information through the secure supply chain.
• Security programs template for Se-cure Freight operators.
• Validation and certification check lists for Secure Freight operators, among others.
Secure Freight pilot programs are currently running in a range of coun-tries on different continents. “Following completion of a pilot, authorities are expected to implement quality assur-ance processes that ensure adherence to the standards outlined in the program as well as to undertake the necessary changes to national law for full imple-mentation,” says Tyler.
—Patrick Burnson, Executive Editor
International Standards: IATA launches “Secure Freight”

CORNERSTONES & CONNECTIONS
CSCMP’s Annual Global Conference September 21-24, 2014 • San Antonio, Texas, USA
Henry B. Gonzalez Convention Center
Regardless of your supply chain role, you’re an entrepreneur. You seek out and capitalize on opportunities for the ben-efi t of your company, your customers, and yourself. But in today’s business environment, words like “virtual,” “fragment-ed,” and “empowered” can also mean “alone.” That’s precisely why you belong at CSCMP’s Annual Global Confer-ence. Connect with the brightest minds and discover the latest thinking at the supply chain industry’s premier event.
Introducing a Whole New Way to LearnIn our continual quest to enhance and maximize your conference experience, we’ve organized our sessions into six disciplinary specialties we call “Cornerstones.” These six cornerstones represent the foundation upon which supply chain management and logistics were built. They are designed to quickly direct you to the conference tracks and ses-sions most pertinent to your area of operation, and are uniquely tailored to the professional development of both you and your team.
Cornerstone I: Talent and Career Cornerstone II: Economic Forecasts, Benchmarks, and SurveysCornerstone III: Thought Leadership and Innovation
Cornerstone IV: Manufacturing, Planning, and SourcingCornerstone V: Transportation, Distribution, and WarehousingCornerstone VI: The Customer
Register today at cscmpconference.org.
MONDAY KEYNOTE SPEAKERGuy KawasakiSpecial Advisor to the Motorola Business Unit of GoogleFormer Chief Evangelist of AppleThe Art of Innovation
TUESDAY MAJOR SESSION SPEAKERDaymond JohnStar of ABC Television’s Hit Reality Business Show, Shark TankTake the Plunge: You Can Swim with the Sharks
WEDNESDAY CLOSING SESSION SPEAKERJudy CarterMotivational Humorist, AuthorBig Laughs, Big Message

56 LOGISTICS MANAGEMENT | JULY 2014 WWW.LOGISTICSMGMT.COM
BY BRIDGET MCCREA, CONTRIBUTING EDITOR
One of the best ways for logistics professionals to start chipping away at labor costs while achieving productivity gains inside the four walls is by setting up labor standards. Here are six surefire ways to start doing this today.
For most logistics professionals, labor represents both a valu-able asset and a high recur-ring expense. Costs soar when labor is over-scheduled, for
example, but productivity lags when there aren’t enough warm bodies in the distribution center (DC) to cover all of the tasks at hand.
Achieving a balanced state between these two extremes is an ongoing chal-lenge for most logistics organizations, yet one that can be effectively tackled through the use of established labor standards. According to top labor man-agement practitioners, managers that take the time to assess their current operations, analyze their labor goals, set up labor standards, and leverage
technology during the process can reduce the amount of budgeted funds spent on labor.
“Variable labor can make up more than 50 percent of an organization’s spend,” says Jim Chamberlain, senior director of industrial engineering and continual improvement at DSC Logis-tics and Supply Chain Management. “To get their arms around that expense, companies need a disciplined way of predictably managing and delivering results with their labor forces.”
One of the best ways for logistics management professionals to start chipping away at labor costs while achieving productivity gains is by set-ting up labor standards—or, those principles that will drive their labor
management strategy within the ware-house and DC. There are six ways to start doing this today.
1. Be a silent observer. Get out onto the warehouse floor and look at how people do their jobs. Come up with a “Version A” (the existing pro-cesses) and a “Version B” (how you would like the job to be done) for each employee. Do this with an eye on building standards towards the best practice for that particular job, says Chamberlain. “Keep an open mind during this process,” he adds, knowing that the different behaviors observed will pave the way for the establishment of new behaviors, best practices, and standards.” Ultimately, the goal will be to provide employees with engineered
Improving Labor Management Warehouse/DC Management
6steps to effective labor standards

WWW.LOGISTICSMGMT.COM JULY 2014 | LOGISTICS MANAGEMENT 57
standards that match the tasks that they perform on a daily basis.
2. Transform your firm’s culture of accountability. Once you have a baseline for both current and desired labor standards, focus on transforming your organization’s culture of account-ability. In other words, everyone from the lift truck operator to the frontline supervisor to the building owner should be—or should become—consciously accountable of the contribution being made to the overall organization. In return, Chamberlain estimates that companies can save anywhere from 10 percent to 20 percent on variable labor spend over time.
3. Let employees know what they’re going to get out of it. By
nature, humans don’t like to change—nor do they like their activities tracked and documented. To overcome these challenges, Don Cook, president of workforce management consultancy Cook & Associates, says shippers should take the time to tell workers exactly what they’re going to get out of the process.
“Be transparent and tell them what benefits they can expect,” says Cook. Let them know that they’re going to be objectively appraised, he adds, and that everyone is going to be operat-ing under the same set of standards. And remember that you’re managing humans here, not equipment. “It’s not like making sure a machine is operat-ing at 80 percent capacity versus 60
percent, or that system response times are two seconds instead of 12,” Cook points out. “Managing a labor force is a lot more complex.”
4. Figure out individual employee productivity. Use a flow-chart to identify the key tasks that are performed by your organization’s employees on a daily, weekly, monthly, and quarterly basis. Next, set time standards for every one of these tasks and then use those standards as the common denominator for employee performance and compensation. For example, says Cook, if one warehouse worker is paid for an 8-hour shift, ask yourself just how many standard hours that person worked in return for payment for that 8-hour shift.

58 LOGISTICS MANAGEMENT | JULY 2014 WWW.LOGISTICSMGMT.COM
Warehouse/DC Management: Labor Management
“If the answer is six hours,” he says, “then his or her productiv-ity index would be 75 percent (6 divided by 8).”
5. Let your warehouse management system (WMS) play detective. Tasked with overseeing and orchestrating the movement of freight and people within the four walls of the ware-house and DC, WMS can play a valuable role in an initial labor standards roll out. “On a job-by-job basis, examine what the best practices are for the task at hand,” Chamberlain advises, “and then deter-mine how each of those practices can be supported by your WMS.”
Look at current processes and the role that the WMS plays in those pro-cesses, Chamberlain adds, and then make changes to the system in a way that drives the behaviors that you’re looking for. “Throughout this exercise, aim to minimize the number of steps that can’t be tracked or driven by your systems,” he says. “That’s where the real savings will come into play.”
6. Get management on board early in the process. For labor stan-dards to be most effective, manage-ment must be on board early in the game. That’s because management
skills play a critical role in the overall success of a labor standards initiative. Put simply, management should be able to objectively take action on the evaluations that are being produced by the new approach to labor standards. “Management has to be able to step up and reward employees via incen-tives or encouragement,” says Cook. “These team members also have to be able to identify poor performers and get them trained and up to speed—or dismissed.”
Managers aren’t the only ones who should be introduced to the labor standards initiative early in the game. In fact, Chamberlain says that every department within the organization should be included in the process.
“When you roll out this kind of a program, it touches every corner of your operation—from human resources to engineering to sales and everything in between. There’s no area of your business that isn’t going to be affected, and everyone will play a role in the success of the program.”
And remember, Chamberlain adds, that labor management isn’t just about rolling out a new set of rules and expecting your employees to fall in and start following them. “It’s about how everyone looks at their day-to-day activities and how they go about doing their business.”
Bridget McCrea is a Contributing Editor to Logistics Management
“ Management has to be able to step up and reward employees via incentives or encouragement. These team members also have to be able to identify poor performers and get them trained and up to speed—or dismissed.”
—Don Cook, president, workforce management consultancy Cook & Associates
When it comes to managing one of the most expensive aspects of
any company’s operations, shippers attack the task from several different angles. Some use manual systems, oth-ers turn to traditional time clock track-ing, and still others rely on labor man-agement systems (LMS) to help rein in their labor costs.
Defined by Gartner as a system that provides labor productivity reporting and planning capabilities, LMS helps companies analyze workforce require-ments based on a certain amount of work to be performed and a standard unit of time to perform each element of work.
Recently, third-party logistics pro-vider Kane Is Able worked with Logistics Management and Peerless Research Group (PRG) to explore how companies
are managing labor productivity within the four walls of their warehouses as well as the benefits that come from employing solid labor management practices.
The results of the Labor Management Strategies in Logistics survey were tell-ing—particularly when it comes to how companies are leveraging to get the job done.
When asked what challenges they face relating to the management of a workforce for warehouse and DC opera-tions, 62 percent of respondents cited finding and keeping qualified/skilled/dependable workers as their largest hurdle. Fifty-seven percent said it was increasing workforce productivity, and 45 percent cited controlling labor costs.
When it comes to labor manage-ment systems (LMS) usage, only 18
percent of respondents report that they currently have a system in place, while 26 percent say they use non-LMS technology software to manage labor productivity. Presently, 23 percent of respondents say they’re planning to adopt and evaluate an LMS within the next two years.
Of those companies that are not considering an LMS, 44 percent consider their operations to be too small to warrant such an investment, 28 percent said that their current processes—although manual—meet their needs, and 22 percent said prior-ity is being given to other IT projects. In most cases (56 percent), companies use time recording/time clocks to man-age their workforces.
—Bridget McCrea, Contributing Editor
LMS Research: Tackling workforce management with technology

Critical Topic areas help you develop strategies and expand your knowledge. Each topic provides you with the news, information, and resources you need — each day.
• Air Freight
• Motor Freight
• Rail Freight
• TMS
• WMS
• Mobile and Wireless
• Ocean Freight
• Third Party Logistics
• Warehouse &Distribution
• Sustainability
• Global Trade
Critical Industry News at Your Fingertips!
CritiCal topiCs
Modern Materials Logistics Management Supply Chain Management
Modern Materials Logistics Management Supply Chain Management
www.logisticsmgmt.com/criticaltopicswww.logisticsmgmt.com/criticaltopics
®
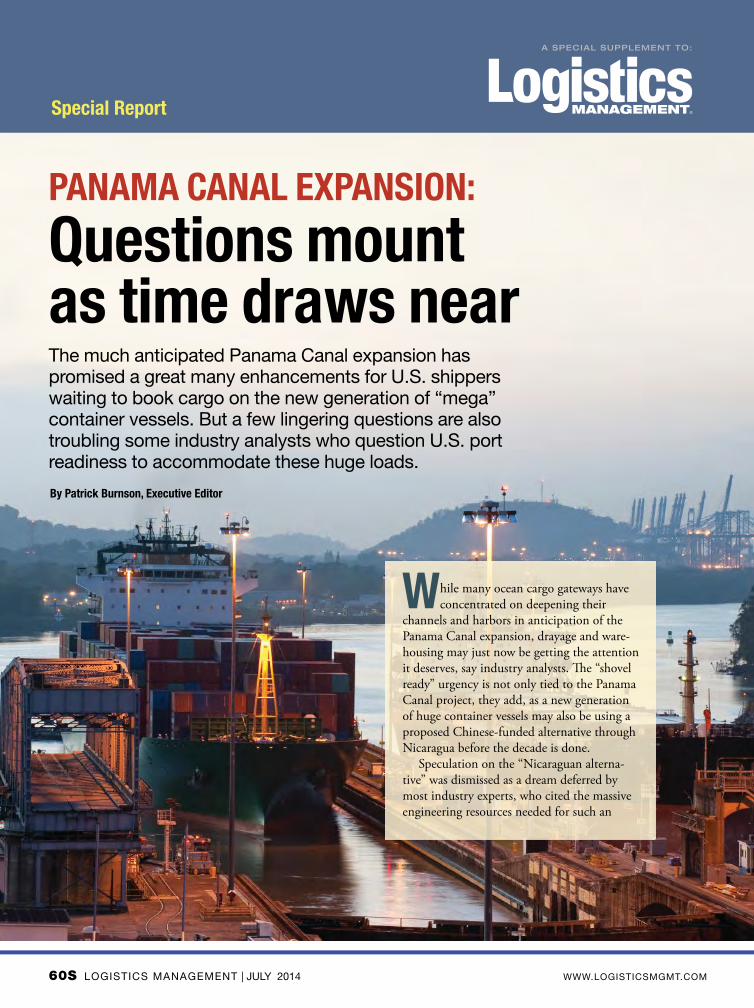
60S LOGISTICS MANAGEMENT | JULY 2014 WWW.LOGISTICSMGMT.COM
Special Report
A SPECIAL SUPPLEMENT TO:
®
The much anticipated Panama Canal expansion has promised a great many enhancements for U.S. shippers waiting to book cargo on the new generation of “mega” container vessels. But a few lingering questions are also troubling some industry analysts who question U.S. port readiness to accommodate these huge loads.
PANAMA CANAL EXPANSION:
Questions mount as time draws near
While many ocean cargo gateways have concentrated on deepening their
channels and harbors in anticipation of the Panama Canal expansion, drayage and ware-housing may just now be getting the attention it deserves, say industry analysts. � e “shovel ready” urgency is not only tied to the Panama Canal project, they add, as a new generation of huge container vessels may also be using a proposed Chinese-funded alternative through Nicaragua before the decade is done.
Speculation on the “Nicaraguan alterna-tive” was dismissed as a dream deferred by most industry experts, who cited the massive engineering resources needed for such an
By Patrick Burnson, Executive Editor

Port of GalvestonAN EFFICIENT PART OF YOUR SUPPLY CHAIN
• Served by Wallenius WilhelmsenLogistics, ARC, "K" Line Ro-Ro, HöeghAutoliners, CSAV Ro-Ro & NYK Ro-Ro
• 30 minutes to Open Sea• Efficient Labor and Competitive Rates• Foreign Trade Zone No. 36
• Roll-On / Roll-Off, Break Bulk and ProjectCargo Terminals
• Direct Connection to BNSF Railway andUnion Pacific Railroad
• Immediate Access to the Interstate HighwaySystem and Gulf Intracoastal Waterway
Texas Gulf Coast Gateway to the Midwest, Southwest and the Greater Galveston/Houston Region
Roll-On / Roll-Off terminal - New vehicle imports Imported wind turbine towers departing the port by rail
P.O. Box 328 • Galveston, TX 77553Phone 409-766-6112 • Fax 409-766-6171
Website: www.portofgalveston.comContact: Capt. John G. Peterlin III
Sr. Director of Marketing & AdministrationEmail: [email protected]

62S LOGISTICS MANAGEMENT | JULY 2014 WWW.LOGISTICSMGMT.COM
Special Report: Panama Canal Expansion A SPECIAL SUPPLEMENT TO LOGISTICS MANAGEMENT
undertaking. But new details on the proposal now have the world’s largest ocean cargo shipping company endors-ing the idea.
According to Keith Svendsen, head of daily operations at Maersk Line in Copenhagen: “It all makes good sense.”
Svendsen notes that Maersk has al-ready ordered super sized post-Panamax vessels that will not be able to transit the Panama Canal, even when it has been expanded and opens in January 2016, the newly projected date. Analysts at the London-based consultancy, Drewry Supply Chain Advisors concur, noting that Maersk’s Triple-E series currently on order will measure over a quarter of a mile in length. Only a Nicaragua Canal—configured at three times the length of Panama—will be able to ac-commodate such massive dimensions.
Hong Kong-based HKND Group was given a 50-year concession by Nicara-gua’s Congress last year, and the Group’s owner, Wang Jing, says that the project will be completed before 2020. The wa-terway connects the Caribbean with the Pacific via Lake Nicaragua or Cocibolca, Central America’s largest freshwater lake. Its length is estimated at 190 miles.
Neil Davidson, senior analyst of ports and terminals at Drewry, says that ultimately the viability of the proposed Nicaragua Canal will depend on a host of factors, rather than solely on its abil-
ity to handle container ships beyond new-Panamax size.
“What would be the level of Nicaragua Canal tolls relative to the Panama Canal tolls for example?” Davidson asks. “Also, while con-tainer ships are a key source of activity, the potential development of the Nicaragua Canal would also be strongly influenced by flows of
liquid and dry bulks and specialist sec-tors like car carriers.”
Furthermore, says Davidson, there would appear to be numerous environ-mental hurdles, which would have to be overcome, along with financing estimat-ed to exceed $40 billion. “And it might be a moot point,” he adds, “because the very largest ships won’t serve North America in the foreseeable future.”
Port productivityIrrespective of which canal eventually comes to dominate the Caribbean Basin, the question for many U.S. ports is whether they’ll be able handle the tremendous surge of cargo tonnage. Because the transpacific remains the most robust global trade lane, the West Coast should be well-positioned to continue to attract the most fully-loaded vessels on direct calls from Asia.
The ports of Long Beach and Los Angeles are the deepest of 29 ports on the U.S. West Coast. Seattle and Tacoma can provide the draft needed, and Oakland has been dredging to remain competitive. However, analysts are concerned about how dockside labor will deal with more volumes once the onslaught begins.
Port productivity—measured by the number of container moves handled per hour of port stay—has failed to keep pace with the rise in vessel sizes, say analysts at the Paris-based think
tank Alphaliner. “The higher volumes handled on each mega ship require longer port stays, with every 1,000 TEU increase in vessel size estimated to add about 1 day to 2 days to the total round trip duration,” notes Stephen Fletcher, Alphaliner’s commercial director
Fletcher says that although ports can increase the number of cranes deployed to handle larger vessels, productivity gains are limited because ships grow “beamier” with taller stacks. “Despite the introduction of faster cranes work-ing more intensively, the increase in the volumes that each crane has to handle within a given time offset the crane productivity gains,” he adds.
West Coast defenseWithout addressing productivity issues, new Port of Oakland Director of Mari-time John Driscoll (see profile in Pacific Rim Report, page 88) admits that some shippers may choose to take the slower route through the expanded Panama Canal if they can find a way that works for them both financially and operation-ally. But import cargo favors inland point connections.
“We will continue to move a lot of exports as well,” says Driscoll, “in particular time-sensitive goods such as agricultural and reefer cargo. We are al-ready seeing some containerships at the Oakland seaport that are too large for the expanded Panama Canal to handle.”
Additionally, Oakland reconfigured some of its terminals last year and cre-ated operationally the third-largest marine terminal on the U.S. West Coast. This enhances its ability to handle the trend toward larger con-tainerships on the transpacific routes. Driscoll joins others is concluding that, ultimately, beneficial cargo owners will be asking themselves some critical ques-tions when considering moving their goods through the Panama Canal.
Driscoll asks: “Would the route through the Panama Canal require
Photo courtesy of P
anama C
anal Authority


64S LOGISTICS MANAGEMENT | JULY 2014 WWW.LOGISTICSMGMT.COM
Special Report: Panama Canal Expansion A SPECIAL SUPPLEMENT TO LOGISTICS MANAGEMENT
a beneficial cargo owner to provide significantly more inventory due to the longer amount of time the goods are on the water? Would more time on the water drive up supply chain costs due to more vessel fuel consumption?”
Others doubt that shipping routes would change that drastically, be-cause many shippers would still place a premium on speed. Typically, East Coast-bound goods arrive faster on trains from the West Coast than by being shipped across the canal. Finally, shippers may wonder if Gulf Coast and East Coast ports will be able to finance and construct the infrastruc-ture needed to support large import volumes.
Leveling the playing fieldThat question may have been answered last month when President Obama signed the 2014 Water Resources Reform and Development Act (WRRDA) into law. This culminates a series of port visits by the President, Vice President, and other top Administration officials over the past year, as well as statements about the vital importance of investing in port
related infrastructure. Port experts agree that WRRDA
legislation will produce a more efficient maritime infrastructure timed to the Panama Canal expansion, and will enable expedited navigation project studies. Furthermore, it will create more flexibility for capital investment and es-
tablishes a means for donor port equity. Analysts further note that by estab-
lishing targets for full use of the Harbor Maintenance Tax revenues for their in-tended purposes, Congress has achieved a major milestone by setting the bar for putting the “trust” back into the Harbor Maintenance Trust Fund.
The Port of New York and New Jersey can accommodate post-Panamax ships, but the container terminals on Newark Bay have height restrictions due to the Bayonne Bridge. The port is planning to raise the bridge 64 feet, which will cost $1 billion and take five years.
In another step forward for the Panama Canal Expansion Program, the second shipment of four rolling gates for the third set of locks arrived last month from the port of Trieste, Italy, to the waterway’s Atlantic side. The locks made the journey on board the semi-submersible heavy lift vessel Sun Rise.
“This is another milestone, as it completes half of the 16 gates that will be used in the new locks,” says Jorge Luis Quijano, the administrator of the Panama Canal Authority. Following a nearly one month long journey, the ship completed its second trip that be-gan in mid-May in the Port of Trieste, crossing the Mediterranean Sea and the Atlantic Ocean.
Differing from the first shipment, these gates have two different dimen-
sions, according to their final position in the lock chambers. The taller ones, or “Type C,” were fabricated for lock head No. 3 in the middle chamber of the Pacific locks. They weigh approxi-mately 3,900 tons, with all internal appurtenances installed.
The shorter ones or, “Type A,” will be located in lock head No. 1 in the Atlantic site’s upper chamber, adjacent to the lake. The four rolling gates will be disembarked in the dock especially built for this purpose on the Atlantic side.
While the two gates destined for the Atlantic complex will remain in the staging area until the time of their installation, the other two will be transferred to the Pacific site once the installation of the concrete supports are completed in the dock built for
their unloading.The new locks will operate with a
redundant rolling gate system, with a total of eight gates in each locks com-plex. The first shipment of rolling gates arrived in Panama on August 20, 2013. The third shipment of rolling gates is scheduled to arrive in Canal waters in October of this year.
Grupo Unidos por el Canal is the contractor responsible for the design and construction of the third set of Locks. Following an agreement signed between the contractor and the Panama Canal Authority, all rolling gates must be in Panama by February 2015. A total of 76.3 percent progress has been achieved under the Canal Expansion Program so far, according to the authority.
—Patrick Burnson, Executive Editor
Second shipment of new gates arrive at the Panama Canal


66S LOGISTICS MANAGEMENT | JULY 2014 WWW.LOGISTICSMGMT.COM
Special Report: Panama Canal Expansion A SPECIAL SUPPLEMENT TO LOGISTICS MANAGEMENT
To put this in perspective, one may wish to examine what Florida’s Port Manatee is doing. With the ongoing development of its “international trade hub,” it aspires to compete with much larger regional ports in advancing pro-duction, distribution, and other global supply chain activities.
“As the closest U.S. deepwa-ter seaport to the expanding Panama Canal, Port Manatee is drawing increased interest,” says Carlos Buqueras, Port Manatee’s executive director. “Companies from through-out Europe, Latin America, the Caribbean, and Asia are expected to be among those benefiting from the interna-tional trade hub, located in the Port Manatee Intermodal Center.”
Firms currently engaged in—or seeking to take part in—Cuba trade are to be a particular focus, adds Bu-queras. But the nation’s shippers are, for the most part, still trying to assess the logistical advantages of the largest U.S. East Coast ports poised to take on “real world” contingencies.
East Coast is for realThe best cargo transit time from China to the U.S. East Coast is by ocean carriage (12.3 days for a ship to go from China to the U.S. West Coast) and then by rail (6 days from the West Coast the East Coast) for a total of 18.3 days. For this reason, 75 percent of Asian imports opt
for this mode. Only 20 percent go through the Panama Canal because it’s longer, at 21.6 days. The rest goes through the Suez Canal di-rectly to the U.S. East Coast, which takes 21 days.
“There’s always a concern that the rail companies may jack up the prices to make intermodal more expensive,” says John Martin, principal of port consultant Martin Associates. “But large beneficial cargo owners like Wal-Mart and Target are banking that they won’t.
Photo courtesy of P
anama C
anal Authority
WE BRING YOU CLOSER TO YOUR CUSTOMERS
N O R T H A M E R I C A C A R I B B E A N C E N T R A L A M E R I C A S O U T H A M E R I C A
Facebook.com/SeaboardMarineTwitter.com/Seaboard_MarineLinkedin.com/company/Seaboard-Marine
HEADQUARTERS8001 NW 79th Avenue . Miami, FL 33166P 305.863.4444 . F 305.863.4400
w w w. s e a b o a r d m a r i n e. c o m
In today’s fast moving world, improving the
supply chain is the only way to bridge the gap
between you and your trading partners. To
accomplish this, you will need an innovative
team of dedicated professionals with over 30
years of experience in logistics and ocean
transportation. You will need more than a
positive customer experience. You will need a
company committed to improvement and
innovation. At Seaboard Marine, your customers
are closer because our customers are at the
center of everything we do.

WWW.LOGISTICSMGMT.COM JULY 2014 | LOGISTICS MANAGEMENT 67S
[email protected] www.portofcorpuschristi.com
The right partner, the right logistics.With a channel depth of 45 feet, authorized and permitted for 52', direct vessel-to-rail discharge, BNSF, KCS and UP on site, dockside truck access, union and non-union stevedore availability, FTZ #122 and the shortest ship mooring time in the Texas Gulf, we get straight to business. Call on your Texas partner.
And if the Panama Canal Authority wants to gouge these be shippers on new toll rates, there’s always the Suez Canal alternative.”
Indeed, the major load centers on the U.S. East Coast have been readying themselves for some time to capture tra� c from both the Suez and ex-panded Panama Canals in recent years. One thing that may make them even more attractive is the aforementioned labor problems on the Paci� c Rim. East Coast ports have also seemed to address many of the trucking issues still
plaguing the West—particularly with avoiding “wildcat” strikes and work slowdowns.
Ports at Charleston, Baltimore, Houston, Jacksonville, Savannah, and Miami are at various stages of expand-ing to accommodate the larger vessels. Scores of port projects are being studied for improvements by the U.S. Army Corps of Engineers. Still, analysts note that there are few East Coast ports with the depths required to handle post-Panamax ships.
� at may soon be changing, how-
ever. Norfolk, Va., has long been able to accommodate such ships. � e Port of New York and New Jersey can too, but its container terminals on Newark Bay have height restrictions due to the Bayonne Bridge. � e port is planning to raise the bridge 64 feet, which will cost $1 billion and take � ve years. Bal-timore has just completed its 50-foot dredging project.
Ports ranging from Virginia to Miami to Houston are determined to dig deeper channels and harbors to accommodate the in� ux of post-Panamax size vessels now on the order books. If successful, say industry experts, they may further erode the margins enjoyed by West Coast ports reliant on fast eastbound rail and intermodal service to the east.
Patrick Burnson is Executive Editor of Logistics Management
Special Report: Panama Canal Expansion A SPECIAL SUPPLEMENT TO LOGISTICS MANAGEMENT
The best cargo transit time from China to the U.S. East Coast
is by ocean carriage and then by rail for a total of 18.3 days.
For this reason, 75 percent of Asian imports opt for this mode.
Only 20 percent go through the Panama Canal because it’s
longer, at 21.6 days.

Advertisement
68 LOGISTICS MANAGEMENT | JULY 2014 WWW.LOGISTICSMGMT.COM
In it’s13th year, View From The Top offers terrifi c insight from top-level executives in
leading logistics companies as to the current state of the industry and how their companies
are meeting today’s challenges.
Read through these pages and see all of the new opportunities that are being offered
to help improve your company’s logistics network and keep costs in check.
View from the Top

WWW.LOGISTICSMGMT.COM JULY 2014 | LOGISTICS MANAGEMENT 69
Advertisement
View from the Top
The largest subsidiary of ArcBest CorporationSM,
ABF FreightSM has moved America’s freight since 1923.
Today, our customers know we’ll fi nd a way to deliver
superior regional and long-haul LTL solutions with easy
access to additional logistics services offered by our sister
companies through a single point of contact.
We provide high levels of personal service not only
through interaction with customers but also in the way we
handle your cargo—with care and precision. By focusing
on specifi c freight transportation needs, we serve as a
dedicated partner constantly seeking to enhance supply-
chain efficiencies and achieve optimum performance for
you and your customers.
An adherence to a proven Quality Process means you can
expect exceptional cargo care. In fact, over 99.4 percent
of shipments we handle are delivered claim free, setting a
high standard for quality and value. Our North American
network of local service centers means there is always
a nearby customer service representative to discuss
your freight transportation needs personally. Plus, our
centralized team of transportation professionals keeps an
end-to-end watch over your entire supply chain.
Best of all, our employees, particularly our account
managers, are trained to serve as business consultants
— enabling you to benefi t from a relationship with a
professional who helps you anticipate freight transportation
challenges and is empowered to respond with
advantageous solutions personalized to the tasks at hand.
abf.com
800-610-5544
Roy SlagleABF Freight President and Chief Executive Officer
“ Our customers tell us they value not just the skill we apply to each task but also the will we display in exceeding their expectations.
Let us show you how ABF Freight has The Skill and The WillSM to creatively solve your supply chain challenges.”

Advertisement
View from the Top
70 LOGISTICS MANAGEMENT | JULY 2014 WWW.LOGISTICSMGMT.COM
At American Public University (APU) we recognize that talent development, retention, and succession planning play a critical role in organizational strategy and success. Our collaborative approach to education, combined with our career and professional services, provide the critical support you and your employees need to help grow and retain top logistics talent while increasing employee job satisfaction and performance.
Key Highlights About APU:
• Part of the accredited American Public University System.
• Recipient of the Sloan Consortium (Sloan-C) Ralph E. Gomory Award for Quality Online Education. We were the first fully online university to achieve this distinction and the only three-time recipient of the Sloan-C Effective Practice Award.
• More than 180 career-relevant degree and certificate programs to help develop your employees in subjects ranging from transportation & logistics, reverse logistics, information technology, marketing, business administration, retail management, corporate sustainability, and more.
• Combined tuition, fees, and books are roughly 20% less for undergraduate and 33% less for graduate students than the average published in-state rates at a public university. Among 10 U.S. leading providers of online education, we are on average 42% lower for undergraduate and 33% lower for graduate students.*
Our curriculum addresses the applicability of global standards in public and private sector transportation and logistics management—and focuses on cutting edge processes and tools. Our goal is to provide students the foundational knowledge and real-world skill set to support global air, maritime, and intermodal systems.
*Tuition figures based on lowest possible tuition rates for 10 of the leading accredited providers of online education. Public in-state tuition information provided by the College Board 2013 Trends in College Pricing, National Center for Education Statistics (NCES) 2011 Digest of Education Statistics, and APUS estimates.
To learn more, visit StudyatAPU.com/logistics
COMPANY PROFILE

WWW.LOGISTICSMGMT.COM JULY 2014 | LOGISTICS MANAGEMENT 71
Advertisement
View from the Top
ArcBest CorporationSM is a multi-billion dollar transportation and logistics company with The Skill & The WillSM to creatively solve our customers’ challenges. From our roots as a less-than-truckload carrier based in Arkansas founded in 1923, we are now a much broader and diverse company with transportation services that span the globe.
We’ll find a way to deliver knowledge, expertise and a can-do attitude with every shipment and supply chain solution, household move or vehicle repair. As the transportation and logistics market changes rapidly, our company has adapted by offering an expanded array of services to meet our customers’ needs. The ArcBest family of companies includes:
ABF FreightSM operates the core less-than-truckload network for North American shippers of all sizes who value quality and the exceptional experience we provide every day. Our customers know we’ll find a way to deliver superior regional and long-haul LTL solutions and easy access to additional logistics services offered by our sister companies through a single point of contact.
ABF LogisticsSM is a sister company to ABF Freight and provides third-party logistics services including brokerage, intermodal and ocean transport, transportation management, warehousing and household moving. We deliver seamless, customized supply chain solutions powered by advanced technology with access through a single point of contact.
Panther Premium LogisticsSM is one of the best-known providers of premium logistics services including time-sensitive, mission-critical and white glove delivery. We solve the toughest shipping and logistics challenges our customers face through our global network of owner operators and partners specializing in ground, air and ocean shipping.
FleetNet America® excels in vehicle maintenance and repair solutions for commercial and private fleets. We are changing the direction of fleet maintenance by reducing downtime, providing data to help reduce maintenance events and delivering best-in-class preventive maintenance compliance at the lowest total cost.
ArcBest Technologies provides our operating companies with in-house, purpose-built digital solutions to complex shipping needs. As the transportation and logistics market continues to change rapidly, our constantly evolving solutions and robust support provide ABF Freight and ABF Logistics the innovative tools and software to better serve their customers’ total supply chain needs.
At ArcBest, our companies and brands are trusted, and our employees are recognized throughout the industry as going above and beyond every day.
Please visit arcb.com for more information.
Judy R. McReynoldsPresident and Chief Executive Officer
“We’ll find a way to deliver knowledge, expertise and a can-do attitude with every shipment and supply chain solution, household move or vehicle repair.”

Advertisement
View from the Top
72 LOGISTICS MANAGEMENT | JULY 2014 WWW.LOGISTICSMGMT.COM
How your supply chain can win over customersWhat makes your company different from all the rest? Every day, you do everything you can to please the people who buy your products. You try to stand out from the competition. It’s not easy.
What you may not realize is, you can turn your supply chain into a competitive weapon and win over buyers, gaining sales.
Set objectives—and meet themWhat roadblocks stand between you and your supply chain goals? With knowledgeable logistics experts on your side, you can create a customized solution to fit your business strategies. You’ll obtain the tools, resources, and guidance that can help you maximize supply chain efficiency.
The result: your products can get to market faster and more cost effectively than your competitors’.
Show why you’re the bestWhy should customers work with your company? You have the products they want. Now, make it even easier for them to do business with you.
Inject powerful people, processes, and technology into your supply chain, and watch what happens as your shipments are optimized. Using a single global technology platform called Navisphere®, you can see your products flow to market faster. Your customers can also see their order and delivery statuses on Navisphere, giving you smoother communications with them than ever before.
Use consistent processes to deliver inbound freight, gather business data, and analyze it to make more strategic decisions. That’s how you can leverage your supply chain muscles and leave competitors behind.
Explore how you can accelerate your advantage in the supply chain. Contact us at [email protected].
14701 Charlson Road, Eden Prairie, MN 55347 | 800.323.7587 | chrobinson.com© 2014 C.H. Robinson Worldwide, Inc. All Rights Reserved.
John WiehoffCEO & Chairman of the Board
STAND OUT IN AN EXTREMELY STAND OUT IN AN EXTREMELY COMPETITIVE MARKETCOMPETITIVE MARKET

WWW.LOGISTICSMGMT.COM JULY 2014 | LOGISTICS MANAGEMENT 73
Advertisement
View from the Top
COSCO moves the highest quality of goods and transportation services to every corner of the globe, with one of the largest, newest and ‘greenest’ fleets. COSCO’s extensive network of routes, ports, offices, representatives, and intermodal partners fast tracks your cargo to virtually any point on the globe. From ocean vessel to barge line to railroad to motor carrier, COSCO’s network is designed to move more cargo faster and more economically.
COSCO owns and operates more than 120 container ships with a current and growing capacity of roughly 600,000 TEUs, including 20- and 40-foot containers. COSCO vessels provide plug-ins for up to 1,000 refrigerated units ready to carry your chilled, frozen, or hard-frozen goods. Specialized containers include flat racks, open tops, and high-cube units. OOG or awkward cargo? COSCO is your carrier.
Enabling shippers to have access to more than 1000 ports around the globe, all serviced by 85 COSCO offices in 49 countries, with 1000 operational agencies located in 160 countries. We can assure our cus-tomers that it’s hard to find any point on the globe that is not serviced efficiently and economically by COSCO containerized cargo services.
Call or visit us today! 1-800-881-0211 www.cosco-usa.com
Your Logistics Partner
COSCO Truly is
One of the Largest Container Lines in the World
COSCO has Long Been
More than 25 Main Line Services
COSCO Currently Provides
COSCO’s Impressive Transportation Resources Immediately at Your Disposal
Your COSCO Representative Can Put the Power of
COSCO Container Lines Americas, Inc. 100 Lighting Way Secaucus NJ 07084
Howard Finkel, Executive Vice President, Cosco Container Lines America, Inc.
Tim Marsh,Executive Vice President,Cosco Container Lines America, Inc.

Advertisement
View from the Top
74 LOGISTICS MANAGEMENT | JULY 2014 WWW.LOGISTICSMGMT.COM
Walk into any warehouse operation and ask the person in charge howthey like their WMS. They may say overall that it works well. But theywill undoubtedly highlight the “only ifs;” those things that would maketheir lives a bit better; that would make their operation a bit more efficient. Every warehouse manager, no matter how big or how smallthe operation, keeps “THE LIST" of what they wish their WMS could do.That’s because at some point after implementation, any system will become taxed at keeping up with rapidly changing business requirements. Even after just a short time, the operation may find itself becoming constrained by what the software can’t support. Requests forhelp may go unanswered; there isn’t an IT organization in the world thatisn’t over allocated. And vendors? Their answer may be too rich or taketoo long. So, too often the operation is forced to continue to make due,knowing well that they could be running better and less expensively.There is an emerging new technology that is designed for exactly thissituation. Adaptive software. These products enable users to fill thegap themselves by enabling users to build their own programs (or Appsin today’s speak).
At DMLogic, our product is called stepLogic. Armed with an intelligenttemplate, a non-technical user can use stepLogic to plot out a processflow and then make it come to life. The user can create new screens,new reports, new dialogs and many other applications using the toolsavailable in the product. A more sophisticated user can insert scriptsand database triggers and integrate new enhancements with the WMS.Adaptive software holds the promise of changing the way WMS systems are delivered, maintained and evolved. Vendors will embracethese tools as a means of extending their offering. Vendors will focus onadvancing their products in concert with market trends and won’t haveto focus nearly as much on specific customer requests. It won’t be longbefore evaluations of WMS systems will include questions about the robustness of the vendor adaptive module. Companies will adopt theadaptive software products as a means of reducing costs and position-ing their business to make adaptations even faster than they are required to do today.
Whether extending the life of legacy system, making improvements inprocess or reporting, or simply freeing up the IT staff's time, AdaptiveSoftware is the future of the WMS industry.
Robert C. KennedyPartner/Vice President Business Development
For more than 30 years,Bob Kennedy has planned,
developed and implementedleading-edge supply chain
execution systems around theglobe. Bob has led more than100 large-scale implementa-
tions of WMS in more than 15countries and a variety of
industries. He has earned anindustry reputation for quality
and a track record of successes.Bob is a partner at DMLogic, a
team of WMS experts whoprovide services, support and
WMS products. He is amember of MHI and CSCMP,
and is a frequent presenter atconferences including ProMat,
MODEX and WERC and CSCMP.Bob has a BS in Industrial
Management fromCarnegie-Mellon University.
661 Andersen Dr. Foster Plaza 7
Pittsburgh, PA 15220www.dmlogicllc.com
The WMS ListHow adaptive software can change the way we think and work
LM Open Letter DMLogic July 2014:Layout 1 6/12/2014 5:28 PM Page 1

WWW.LOGISTICSMGMT.COM JULY 2014 | LOGISTICS MANAGEMENT 75
Advertisement
View from the Top
Transportation constraints have your business strapped? Landstar is your answer to tightening capacity and the broad based increase in overall demand that most customers are struggling with in today’s environment.
Capacity: Our customers have access to Landstar’s expansive array of capacity with 8,400 power units owned and operated by Landstar business capacity owners, and 14,000 pieces of trailing equipment, including 1,700 stepdecks and 1,400 fl atbed trailers, along with an extensive selection of specialized equipment. In addition, Landstar customers have access to more than 32,000 other approved third-party capacity providers.
Transportation Management: Landstar’s capacity sourcing tools provide coordination of bidding, freight optimization, scheduling, shipping, tracking, invoicing and reporting.
Multiple Modes: Sometimes a truck is not enough, even when you have the options that Landstar offers – truckload vans, less-than-truckload, heavy haul and specialized trailing equipment and reefers as well as cargo vans, straight trucks and tractor-trailers for expedited ground. That’s why Landstar also offers domestic and global air services; rail intermodal service throughout the U.S. and into Canada and Mexico; and ocean freight forwarding services.
One Contact: Let our network of independent sales agents fi nd the right mix of transportation logistics services for you. Just one call connects you with multiple transportation management solutions.
www.landstar.com | [email protected] | 877-696-4507
TRUCKLOAD | LTL | TRANSPORTATION MANAGEMENT SOLUTIONS | HEAVY HAUL/SPECIALIZED | EXPEDITED | AIR | OCEAN | RAIL INTERMODAL
Henry GerkensLandstar Chairman & Chief Executive Offi cer
LANDSTAR’STRANSPORTATION
MANAGEMENT SOLUTIONS

Advertisement
View from the Top
76 LOGISTICS MANAGEMENT | JULY 2014 WWW.LOGISTICSMGMT.COM
LEGACY Supply Chain Services is a third-party logistics provider with over 38 years of supply chain experience. Our expanded North American distribution footprint includes over 6,000,000 square feet of dedicated and multi-client space in 50 locations across 19 states and 3 Canadian provinces.
The LEGACY AdvantageJust like other logistics providers, we recognize design, technology, and infrastructure as integral parts of every supply chain. And we have the Tier 1 Technology and supply chain engineering, buildings, and contracts to prove it. What distinguishes us in the 3PL industry is our values-based LEGACY culture. We develop our people to be more than excellent supply chain professionals – we invest in their development as leaders who make a difference in the lives of co-workers, customers, and their local communities.
Values-Based Culture Drives Supply Chain PerformanceThrough our proprietary cultural development model, LEGACY helps clients increase supply chain performance. Aligning employees with core values, and intentionally developing the right culture drives employee engagement, reduction of waste, increased productivity and ultimately decreased costs. Our leadership culture is the engine that drives high-touch personal service and sustainable performance for our clients, year over year.
Full-service Solutions and High-touch ServiceWe specialize in providing customized supply chain solutions to several vertical markets including Consumer Goods, Technology, Industrial Manufacturing, Retail, Food & Beverage, Aftermarket Automotive, Life Sciences, and Government.
• Warehousing & Distribution: Dedicated contract and multi-client facilities, business-to-business and direct-to-consumer fulfillment models, Tier 1 WMS capabilities, and labor optimization
• International Transportation: Import & export freight forwarding, air cargo, NVOCC ocean freight, foreign-to-foreign services, project cargo, global agent network, and Tier 1 international TMS
• North American Transportation: LTL & full truckload brokerage, dedicated contract carriage, rail & intermodal, expedited services, specialized & project, last mile & white glove, and Tier 1 TMS
• Customs & Compliance: U.S. Customs brokerage, foreign entry services, compliance support, full documentation services, and foreign trade zone
• And Everything to Add Value in Between: Transportation analysis & planning, supply chain design, value-added services, and customized supply chain technology
Our full-service solutions and high-touch service make LEGACY one of the Top 3PLs in North America. To learn more, visit www.LEGACYscs.com or call 800.361.5028 ext. 6.
Ron Cain Chairman & CEO
www.LEGACYscs.com
LEGACY Supply Chain Services
Dedicated Logistics Partner
Mt. Juliet, TN

WWW.LOGISTICSMGMT.COM JULY 2014 | LOGISTICS MANAGEMENT 77
Advertisement
View from the Top

Advertisement
View from the Top
78 LOGISTICS MANAGEMENT | JULY 2014 WWW.LOGISTICSMGMT.COM
michiganbusiness.org/lm
Home to 61 of the top 100 North American automotive suppliers
Michigan State University ranks #1 in the country for their supply chain management program1
Detroit metropolitan area#4 in export value with more than $50 billion
As part of our state’s reinvention, and powered by relentless positive action, Michigan is developing a logistics and supply chain ecosystem that creates new opportunities for Michigan businesses and citizens. Through collaboration with public, private and educational sectors, the Michigan supply chain moves one of the world’s largest concentrations of manufacturers and suppliers and is poised for even greater success in the future.
1 U.S. News and World Report 2 As of 2009, Brookings Institute
Michigan Governor Rick Snyder
Located within 500 miles of almost half the U.S. and Canadian market
North America’s most active commercial surface crossing with $356 million daily between Detroit and Canada2
One of the largest U.S. air hubs to Asia
Michigan’s Supply Chain is in Demand
Michigan is the trade capital of the NAFTA corridor– with one of the largest foreign trade zones in the U.S.
S:6”
S:8”
T:6.5”
T:8.5”

WWW.LOGISTICSMGMT.COM JULY 2014 | LOGISTICS MANAGEMENT 79
Advertisement
View from the Top
HOW TO MAKE YOUR WAREHOUSE AND DC OPERATIONS MORE PRODUCTIVE
Converting a stationary workplace to a mobile one is the easiest, most economical way to increase productivity of your current warehouse workers and infrastructure. Make your employees’ workplace mobile and free from stationary power sources and data cabling.
MOBILE WORKPLACE SYSTEM
15B Sylvan St. l Middleton, MA l 01949 l USA l 781.935.3450 www.newcastlesys.com
The Power to Move Your Workplace
Implementing Mobile Workplace and Portable Power Systems will enable you to immediately...
• Generate Productivity - Achieve the same amount of volume with fewer pieces of equipment (i.e. printers, computers, etc.) by converting to mobile workstations.
• Improve Processes - Fully leverage your wireless facility by cut-ting the power cords and letting your workstations move to where they are needed - with your people.
• Enable People - Operators & managers now have access to data and real-time information anywhere in the facility because they can take their workstation with them.
Interested to see how much you can save throughout your orga-nization? Try our ROI Calculator (www.newcastlesys.com/ROI) to help you quantify inefficiencies and learn how a Mobile Powered Workstation can help.

Advertisement
View from the Top
80 LOGISTICS MANAGEMENT | JULY 2014 WWW.LOGISTICSMGMT.COM
There is so much to worry about these days when it comes to running a business, but whether a shipment arrives on time – and undamaged – shouldn’t even make the list.
Frankly, no one needs another freight and logistics company. What companies need is a partner, someone who understands the intricacies of the problems they are facing and who can offer the customized solutions to fit the situation.
People constantly ask us: How do you do it? What makes Old Dominion successful? Well, the answer is quite simple: We’ve not only set out to maintain pricing discipline and invest in our infrastructure so as to position ourselves for long-term growth, we’re constantly investing in our employees and focusing on our service.
Let’s focus on that last point for a moment. At Old Dominion, rather than saying we’re in the less than truckload (LTL) business, we say that we’re really in the business of keeping promises and whatever business you’re in, we’re in. Our consistent market share
gains reflect the value of our high-quality, integrated and comprehensive services.
Every shipment we deliver represents a promise each of our customers has made. With that in mind, we focus on the task at hand, and utilizing technology, up-to-date infrastructure and the best people possible, we’ve made it our goal – really, our commitment – to deliver every shipment on time and damage-free. When we fall short, we stand strong, take responsibility and learn from our mistakes.
By focusing our attention on our service, we’ve been able to achieve one of the best on-time records and one of the lowest claims ratios in the industry. But our work is never done, and we pledge to our customers that we will continue to strive for perfection, because we recognize we are only as good as our last shipment.
By offering best-in-class service at a fair and equitable price, we believe we have created a value proposition for shippers that should allow us to gain additional market share and create additional value for our shareholders.
Our people and our four product groups – OD-Domestic, OD-Expedited, OD-Global and OD-Technology – provide our customers with the complete range of products and services they need to deliver on our promise of simplified transportation solutions. We provide direct service to more than 48,000 points through
more than 215 service centers and expedited, drayage, and assembly and distribution services as well as container delivery services to and from North America, Central America, South America and the Far East.
Our hard work has paid dividends. Last year, Old Dominion was honored by Mastio & Company as the No. 1 national LTL carrier in the company’s 2011 Value and Loyalty Benchmarking Study for its outstanding use of technology. We were also selected as one of Forbes Top 100 Most Trustworthy Companies for 2012, an annual recognition awarded to publicly traded corporations that have consistently demonstrated transparent, conservative accounting practices and solid corporate governance and management.
Anyone can have all of the plans and strategies in the world. But, in the end, it’s about making our customers’ businesses our own and working to achieve a common vision:
“Helping the World Keep Promises.”
1.800.432.6335 | odfl.com
Old Dominion Freight Line, the Old Dominion logo and Helping The World Keep Promises are service marks or registered service marks of Old Dominion Freight Line, Inc. All other trademarks and service marks identified herein are the intellectual property of their respective owners. © 2013 Old Dominion Freight Line, Inc. Thomasville, N.C. All rights reserved.
David Congdon is president and CEO
of Old Dominion Freight Line, Inc.
With more than 35 years of experience
in the transportation industry,
Congdon has spent the majority of his
career continuing the legacy of his
grandparents, Old Dominion founders,
Earl and Lillian Congdon.
DaviD congDon:view from the top
®
S:6.5”
S:8
.5”
T:6.5”
T:8
.5”
B:6.5”
B:8
.5”
1812-49829_LogisticsMgmt_AViewfromtheTop_AD_R01d.indd 1 6/12/14 2:56 PM
There is so much to worry about these days when it comes to running a business, but whether a shipment arrives on time and undamaged shouldn’t make the list.
Companies don’t just need another freight and logistics provider. Companies need a freight and logistics partner, someone who understands the intricacies of the problems they face and who can offer the customized solutions to fit the situation.
People constantly ask our secret to success.
Over the course of our 80-year history, we’ve learned the answer is remarkably simple: it’s all about the people. While we set out to maintain pricing discipline and invest in our infrastructure so as to position ourselves for long-term growth, we’re constantly investing in our employees and focusing on providing premium service — it’s an investment that pays dividends.
That’s why we say we’re in the business of keeping promises, rather than saying we’re in the less than truckload (LTL) business. Our belief is: whatever business you’re in, we’re in.
Every shipment entrusted to OD represents a promise each of our customers have made. With that in mind, we focus on the task at hand, and utilizing technology, up-to-date infrastructure and the best people possible, we’ve made it our commitment to deliver every shipment on time and damage-free. It’s been our mantra for 80 years.
By focusing on our service, we’ve been able to achieve one of the best on-time records and one of the lowest claims ratios in the industry. But our work is never done, and we pledge to our customers that we will continue to strive for perfection, because we recognize we are only as good as our last shipment.
Our people and our four service offerings — OD-Domestic, OD-Expedited, OD-Global and OD-Technology — provide our customers with the complete range of products and services they need to deliver on our promise of simplified, reliable transportation solutions. We provide nationwide service through a network of 224 service centers
and international freight forwarding services throughout the world.
While our hard work has paid dividends, we remain as committed as ever to the task at hand.
In April, Forbes magazine again named Old Dominion one of “America’s Most Trustworthy Companies.” In November, Old Dominion was honored by Mastio & Company as the No. 1 national LTL carrier in the company’s 2013 Value and Loyalty Benchmarking Study, the fourth consecutive year Old Dominion has topped the list.
Anyone can have all of the plans and strate-gies in the world. But, in the end, it’s about making our customers’ businesses our own and working to achieve a common vision: “Helping the World Keep Promises. ”
DAVID CONGDON:VIEW FROM THE TOP

WWW.LOGISTICSMGMT.COM JULY 2014 | LOGISTICS MANAGEMENT 81
Advertisement
View from the Top
The transportation industry has undergone a lot of consolidation and change in the aftermath of the recent recession. I expect that the qualified driver shortage, the increased demand for supply chain analytics, and the growing interest in sustainable transportation solutions will drive even more change more quickly.
The transportation industry continues to suffer from a qualified driver shortage. Fewer eligible candidates are motivated to enter our industry as truck drivers. The recent recession, more stringent hours of service (HOS) regulations, and the implementation of the Comprehensive Safety Act (CSA) have further reduced the number of qualified driver applicants. The resulting trucking capacity shortage has caused freight rates to rise, which in turn has motivated shippers and carriers to find new ways to address distribution inefficiencies. For example, most shippers are now demonstrating a willingness to provide freight projections to their carriers. Planning is integral to an efficient freight operation. Projections allow carriers to efficiently allocate resources for their linehaul and next day delivery routes. Carriers and shippers are also finding ways to collaborate by using B2B integration tools to automate and speed the exchange of transactional shipment information resulting in lower administrative costs and improved customer service capabilities.
The trucking capacity crunch and rising freight rates have motivated some shippers and carriers to embrace the concept of co-opetition. In the face of shrinking capacity we see more carriers taking steps to collaborate with their competitors by redirecting business to another carrier’s network where it can be better handled and optimized. Similarly, shippers are starting to collaborate with other shippers to find ways to combine shipments and move them to market as full loads.
Well run businesses thrive on actionable information. More shippers recognize that supply chain data analytics can provide them with a means to improve service and to reduce their distribution costs. This is one of the major reasons that 3PLs continue to garner market share since they provide shippers with an inexpensive and easy way to access supply chain analytics. Savvy carriers understand that they need to partner with those 3 PLs that are able to provide shippers with this type of information.
Interest in best in class sustainable transportation practices also continues to grow. Several US based divisions of European owned firms have taken the lead by requiring their carriers to provide them with cost effective and sustainable transportation solutions. Carriers are being challenged to measure their carbon footprint and to document the steps that they are taking to reduce their carbon footprints.
PITT OHIO is responding to each of these emerging transportation trends. We are collaborating with customers to streamline the exchange of transactional information while seeking ways to take cost out of our of transportation network. We are focused on providing shippers with a high performance, high value sustainable transportation solutions that deliver reliable service while minimizing our network’s carbon emissions. PITT OHIO will be there to meet the needs in the marketplace of a continually evolving and ever-changing transportation industry.
Transportation Challenges and Trends
www.pittohio.com
Chuck Hammel - President

Advertisement
View from the Top
82 LOGISTICS MANAGEMENT | JULY 2014 WWW.LOGISTICSMGMT.COM
The year was 1919. Woodrow Wilson was in office. Prohibition went into effect. Dial telephones were introduced. And Reddaway, a humble truck line with a nine-mile route between Portland and Oregon City, Oregon was founded.
Fast Forward 95 Years
While a lot has changed, one thing has remained
the same: Reddaway’s commitment to our
customers. It’s a core value that’s been steadfast
throughout our history – through the depression,
through various owners and even through
generations of Reddaway employees.
Best in the West Now based in Tualatin, Oregon Reddaway
is the largest regional carrier with more than
3,000 employees, 50 terminals, 3,500 trailers
and 1,400 tractors. We’ve built a reputation for
next-day delivery, quality handling and on-time
performance across the Western United States,
Hawaii, Alaska and Western Canada.
Safety First Ensuring that we’re working and driving safely
serves as the foundation by which we deliver
confidence to our customers every day. Whether
it’s through training programs or driver supervision,
Reddaway is synonymous with safety.
Above and Beyond
Reddaway’s success wouldn’t be possible
without a strong culture and dedicated people.
Our team continually goes beyond the call of
duty to strengthen relationships and provide
best-in-class service.
Want to know more about the oldest continuously run trucking company in state of Oregon? Then get to know Reddaway – a company with resilience through 95 years of challenge and change. Call us at 888.420.8960 or visit reddawayregional.com today!
TJ O’Connor
Reddaway President and CEO reddawayregional.com
Copyright ©2014 YRC Worldwide Inc.

WWW.LOGISTICSMGMT.COM JULY 2014 | LOGISTICS MANAGEMENT 83
Advertisement
View from the Top
Strategic Supply Chain Support
Whatever It Takes!Warehousing • TransporTaTion • packaging • FulFillmenT
Cliff Otto president saddle creek logistics services
Leverage our wide array of logistics capabilities — warehousing, transportation, packaging and fulfillment — for an integrated solution that supports your business objectives.
3010 saddle creek road lakeland, Florida 33801 888-878-1177 [email protected] sclogistics.com
Download our whitepaper on distribution network optimization:
challenged to enhance service levels? increase efficiency? improve your bottom-line? We can help. at saddle creek, we offer strategic solutions to help you reach your business goals.
Optimizing distribution networksready to take a more strategic approach to network configuration? We can help guide your site selection process to ensure optimal efficiency. With access to our conveniently located facilities around the country, you can meet your needs without a major investment in infrastructure — whether you have a B-to-B distribution center model or a B-to-c fulfillment operation. as a result, you’ll improve service levels, better manage your inventory and reduce transportation costs.
Supporting postponement strategiesDelaying product configuration until the last possible minute can increase your flexibility and help you be more responsive to market demands. Take advantage of value-added services at our locations nationwide in order to move product customization closer to your customer. From rainbow pack assembly to hard drive formatting to mechanical alterations, we can accommodate a variety of special requirements to help streamline your supply chain.
Investing in e-fulfillmentWe’ve recently invested $3.5 million in automated fulfillment solutions and opened strategically located facilities to help customers increase efficiency and speed delivery times. operational solutions include pick-to-light technology, automated label application/manifesting, small-parcel banding and more. With our existing infrastructure, we can build a custom operation from the ground up in as little as six weeks.
We invite you to see how our integrated services can help you develop a stronger, more effective supply chain.

Advertisement
View from the Top
84 LOGISTICS MANAGEMENT | JULY 2014 WWW.LOGISTICSMGMT.COM

WWW.LOGISTICSMGMT.COM JULY 2014 | LOGISTICS MANAGEMENT 85
Advertisement
View from the Top
Corporate Office: Sealed Air Corporation, 200 Riverfront Boulevard, Elmwood Park, NJ 07407©Reg. U.S. Pat. Off. © Sealed Air Corporation 2014. All rights reserved. Printed in the U.S.A.
www.sealedairprotects.com
Packaging Should Protect More Than ProductsAt Sealed Air, when it comes to our products and the environment, we look at the entire lifecycle of our products — because it’s the right thing to do.
Our SmartLife™ initiative is designed to educate and demonstrate how packaging can enhance sustainability through technology, innovation and design. This approach helps our customers make smarter decisions about the entire lifecycle of their packaging materials.
We all share the responsibility of making informed choices about the products and materials we generate, with the ultimate goal being a better way for life.
Let us be your partner in packaging.
For More Info

Advertisement
View from the Top
86 LOGISTICS MANAGEMENT | JULY 2014 WWW.LOGISTICSMGMT.COM
Unyson Logistics is an award winning 3PL that specializes in customizing solutions to fit our clients’ needs. We o�er multi-modal capabilities that generate supply chain savings through our services, technology and industry expertise.
Simply put, our logistics managers are the best at what they do. Unyson deploys structured account management, continuous improvement programs and business intelligence that combines innovative reporting with cutting edge dashboard technology. Because we know that all of our customers have unique needs and performance measures, we provide a highly personalized approach to setting appropriate targets.
Unyson Logistics has an in-house information technology sta�. With our online resources, you’ll be able to streamline your entire supply chain, as well as manage your logistical needs remotely. The seamless dynamic between you, your suppliers and your customers provides the visibility and control you need for the peace of mind you deserve.
WE ARETHE STRONGESTLINK IN YOURSUPPLY CHAIN
1801 Park 270 Drive, Suite 500, St. Louis, MO 63146866-409-9759 unysonlogistics.com [email protected]
David MarshChief Supply Chain O�cer

WWW.LOGISTICSMGMT.COM JULY 2014 | LOGISTICS MANAGEMENT 87
Advertisement
View from the Top
Supply chain solutions that deliver.
UTi Worldwidec/o UTi, Services, Inc. 100 Oceangate, Suite 1500 Long Beach, CA 90802 +1 (562) 552 9400www.go2uti.com
UTi is one of the industry’s leading non-asset based, global third party logistics providers. We deliver competitive advantage to each of our client’s supply chains through innovative, integrated solutions. We are committed to delivering value that will help clients succeed in today’s uncertain economic environment. This means maintaining an external focus on the global marketplace, being alert to potential obstacles as well as opportunities, and having solutions ready that can eliminate complexity.
Our primary services include:
UTi FREIGHT FORWARDING
With 313 freight forwarding locations, in 59 countries, UTi believes freight transportation is about reducing costs while delivering goods when and where they are needed. Value is provided through inter-modal shipping at competitive rates, utilizing air, ocean, surface and specialty transportation services.
UTi CONTRACT LOGISTICS
Operating a global footprint of 245 logistics centers with more than 26 million square feet of warehousing worldwide, UTi can store, con� gure and deliver your products while maintaining the visibility and inventory management you need to effectively manage your business. Whether delivering goods to a global client base or managing complex inbound supply chains, our transportation and inventory optimization tools reduce network costs and improve product availability.
UTi SUPPLY CHAIN DESIGN AND INNOVATION
UTi leverages our global network, IT systems, relationships with transportation providers, and expertise in outsourcing to improve visibility and reduce costs. Our team can help you build a business case for change, innovation and cost reduction in your organization.
COMPETITIVE ADVANTAGE
At UTi, our people are the most important resource in keeping our commitments to clients. We nurture talent, providing an atmosphere conducive to performance excellence by each and every person. This is why we can say, at UTi, there’s not a weak link in the chain.
– Air and Ocean Freight Forwarding – Contract Logistics – Customs Brokerage
– Distribution – Managed Transportation Services – Supply Chain Consulting
ads4peerless.ehpub.com;WHERE TO SEND MATERIALS:Logistics Management
View From The Top Executive Open Letter Advertorial: 6-1/2” wide x
fully designed by the customer and sent as a complete and � nal ad; Send electronically as PDF
RDOM3677-12-Profile-ViewFromTop12-LM-r1f.indd 1 6/20/14 1:31 PM

88 LOGISTICS MANAGEMENT | JULY 2014 WWW.LOGISTICSMGMT.COM
Patrick Burnson is Executive Editor of Logistics Management. If you want to contact Patrick with feedback or a story idea, please send an e-mail to
Pacific Rim Report By Patrick Burnson
Port of Oakland defines its mission
Port of Oakland Director of Maritime John C. Driscoll has now been at his post for nearly a year. In this exclusive interview, he shares some of the lessons he’s learned so far and relates his vision for the future.
Logistics Management (LM): We see a trend toward more regional port cooperation in the Puget Sound and San Pedro Bay. Will Oakland begin to work more closely with San Francisco Bay Area ports in the future?
John Driscoll: Indeed, the Port of Oakland will continue to collaborate with regional and statewide ports. A good example is related to the port security grant program. The Ports of Oakland, Richmond, San Francisco, and Stockton are interdependent upon the same contiguous body of water. We worked together to develop a five-year plan to enhance mari-time security in our region.
Also, we’re a member of the California Asso-ciation of Port Authorities, an organization that’s dedicated to maintaining California’s leading role in the maritime industry. Even though our ports are competitors, together we can be more effective in addressing issues of common interest such as infra-structure and port security funding as well as sharing the latest innovations on environmentally friendly technology to enhance our operations.
LM: Industry analysts suggest that the new G6 alliance may have a negative impact on Oakland. What assurances can you give ship-pers that enough direct inbound calls will be sustained?
Driscoll: We anticipate that, as a result of this alliance, we’ll see larger vessels in the 8,000 to 10,000 twenty-foot equivalent units (TEU) range calling ports more frequently. We’re big-ship ready, with two mega-terminals, ample capacity, deep water at 50 feet, and post-Panamax cranes. We believe that the alliance could actually bring us new cargo.
The development of the G6 is clearly a focused effort on the part of the shipping lines to consolidate business and reduce costs. And because the Port
of Oakland has the capacity and infrastructure to handle bigger containerships, we’re in a good posi-tion to establish new inbound service calls. We’ve already had ship calls at the Oakland seaport in the near 14,000 TEU range, and we can accommodate some of the largest vessels in the world with our existing facilities.
LM: Starting early next year, the resurrected U.S. carrier, SeaLand, will be coming back under the auspices of Maersk Line to serve the existing Intra-Americas service network. Given your experience with both lines, will you be exploring the potential for more calls at Oakland?
Driscoll: We’re definitely interested in growing more business volume and we’re looking at every opportunity to do that, including Intra-Americas service. Not only do we have the capacity and infrastructure to build our maritime business, we have other advantages. The Port of Oakland has two Class I railroads—UP and BNSF—at the seaport, and that means rail access to inland points in the U.S. The other advantage the Port of Oakland has for Intra-Americas goods movement is the Marine Highway between the Ports of Oakland and Stock-ton. This is an opportunity to move heavy cargo on the new barging service and avoid the over-the-road weight restrictions.
LM: Finally, where does Oakland see the great-est growth? Will reefer or e-commerce be sig-nificant drivers?
Driscoll: Our goal is to outperform the existing market share, and we see expanding imports through Oakland as an area of great opportunity. The Port of Oakland, in partnership with the City of Oakland, broke ground last year on a $500 million Phase 1 redevelopment of the former Oakland Army Base into Oakland Global, a modern, intermodal, trade and logistics center. Phase 1 includes new utilities across the entire site, a new bulk terminal, modern warehousing, cold storage facilities, and a new rail yard on the port side of the property. M

More ways to power your business than ever.
More than you imagine.
More Education. More Dialogue. More Connections.
Intermodal EXPO is the essential event for the entire intermodal supply chain. This year IANA has enhanced the entire experience to bring even more value to attendees. Sign up and don’t miss out on all of this year’s exciting opportunities.
Register now at IntermodalEXPO.com

WE HELP YOU FEEL THE WIND IN YOUR FUR.
What do many of the world’s top carmakers have in common? Penske Logistics. We manage the fl ow of thousands of parts, from hundreds of suppliers to dozens of manufacturing plants. We also facilitate the distribution of aftermarket parts to dealers. Penske’s there, at every stop along the automotive supply chain, from Point A to pointers, retrievers and terriers, too.
penskelogistics.com