2381 Su14 Lecture 1 Introduction
53
MAE 2381 Experimental Methods and Measurements Introduction, Graphing, and Report Writing
-
Upload
vamsi-krishna -
Category
Documents
-
view
40 -
download
1
description
Intro to mae 2381
Transcript of 2381 Su14 Lecture 1 Introduction
MAE 2381
Experimental Methods and
Measurements
Introduction, Graphing, and Report Writing
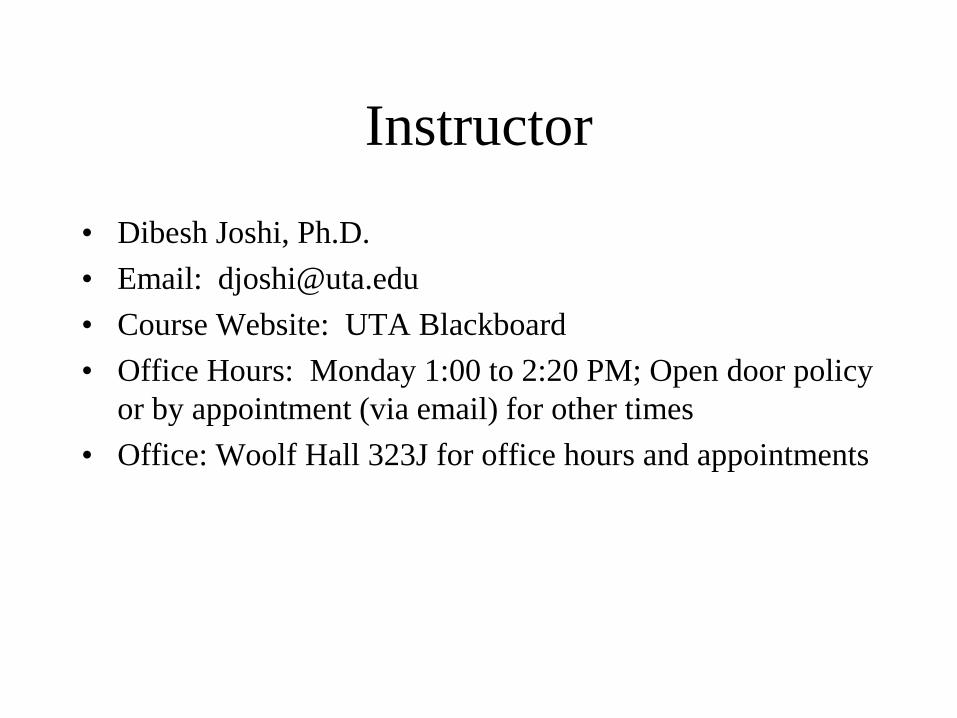
Instructor
• Dibesh Joshi, Ph.D.
• Email: [email protected]
• Course Website: UTA Blackboard
• Office Hours: Monday 1:00 to 2:20 PM; Open door policy
or by appointment (via email) for other times
• Office: Woolf Hall 323J for office hours and appointments
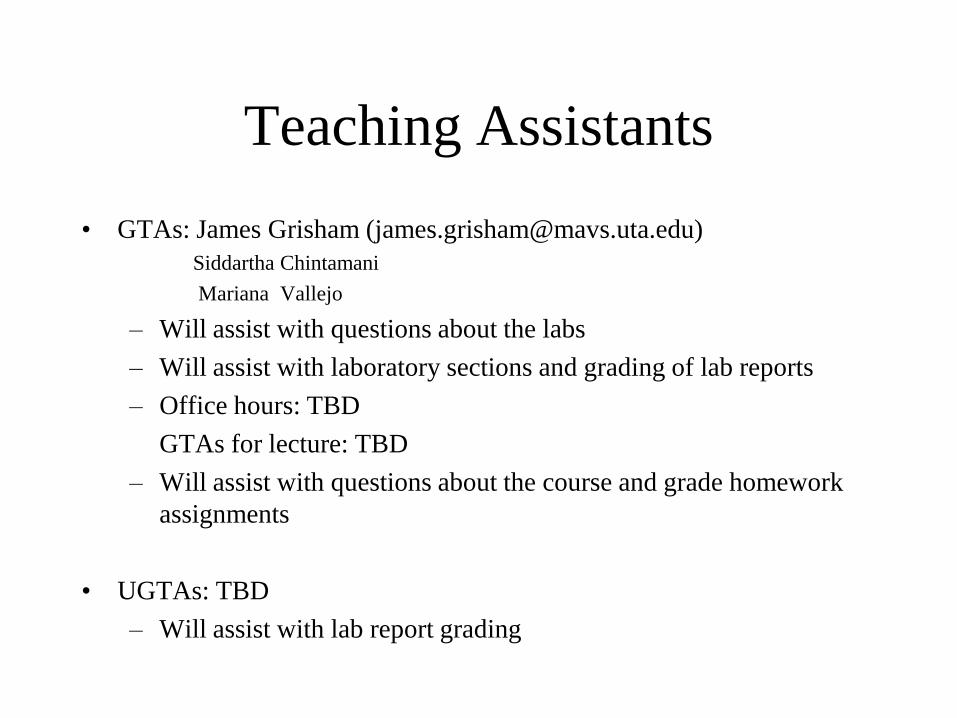
Teaching Assistants
• GTAs: James Grisham ([email protected])
Siddartha Chintamani
Mariana Vallejo
– Will assist with questions about the labs
– Will assist with laboratory sections and grading of lab reports
– Office hours: TBD
GTAs for lecture: TBD
– Will assist with questions about the course and grade homework
assignments
• UGTAs: TBD
– Will assist with lab report grading
Class Format
• Lectures: Tuesday and Thursday 1:00–2:20 PM WH 311
– Discuss theory and practical issues related to experimental measurements
and professional reporting of results
– Bring notebook for example problems not repeated on Blackboard notes
• Labs: Tuesday and Thursday at 2:30 – 5:30 PM in WH 319
– Measurement experiments in groups of 3–4 people
– Acquire data in < 3 hours and spend majority of time on analysis and
reporting of results
– Assists with understanding the topics discussed in the course, some
reading ahead is required
Requirements
• Prerequisite: C or higher in MATH 2425 (Calculus II)
• Familiarity with Excel/MATLAB is helpful
• R.S. Figliola and D.E. Beasley, Theory and Design for
Mechanical Measurements, 5th ed., Wiley, 2011.
(hardbound)
or you can choose to buy the less expensive abridged
version (softbound) available at the book store.
• Lectures will follow the book chapters somewhat
Course Objectives
• To provide a background in engineering measurements and
measurement system performance.
• To convey the principles and practice for the design of
measurement systems and measurement test plans,
including the role of statistics and uncertainty analyses in
design.
• To introduce data analysis, reduction, and reporting of
results through formal reports.
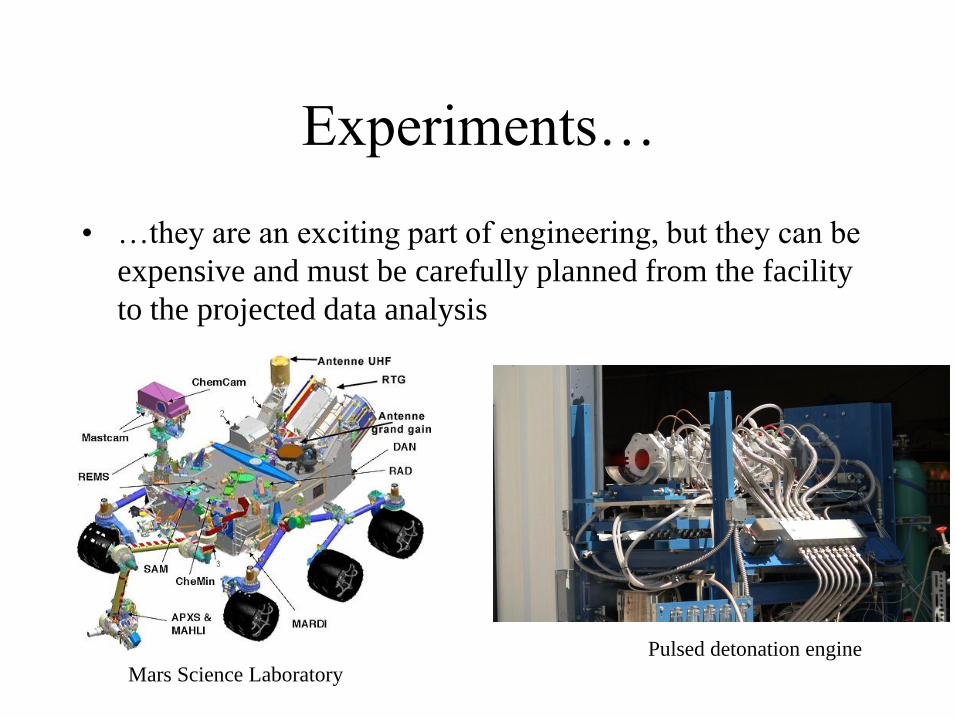
Experiments…
• …they are an exciting part of engineering, but they can be
expensive and must be carefully planned from the facility
to the projected data analysis
Mars Science Laboratory
Pulsed detonation engine
Outline of Lectures
• Technical report writing and presentation of data
• Measurement methods for hardware and software
• Signal characteristics
• Measurement system behavior
• Probability and statistics for measurement systems
• Uncertainty analysis
• Experimental planning and practical measurements
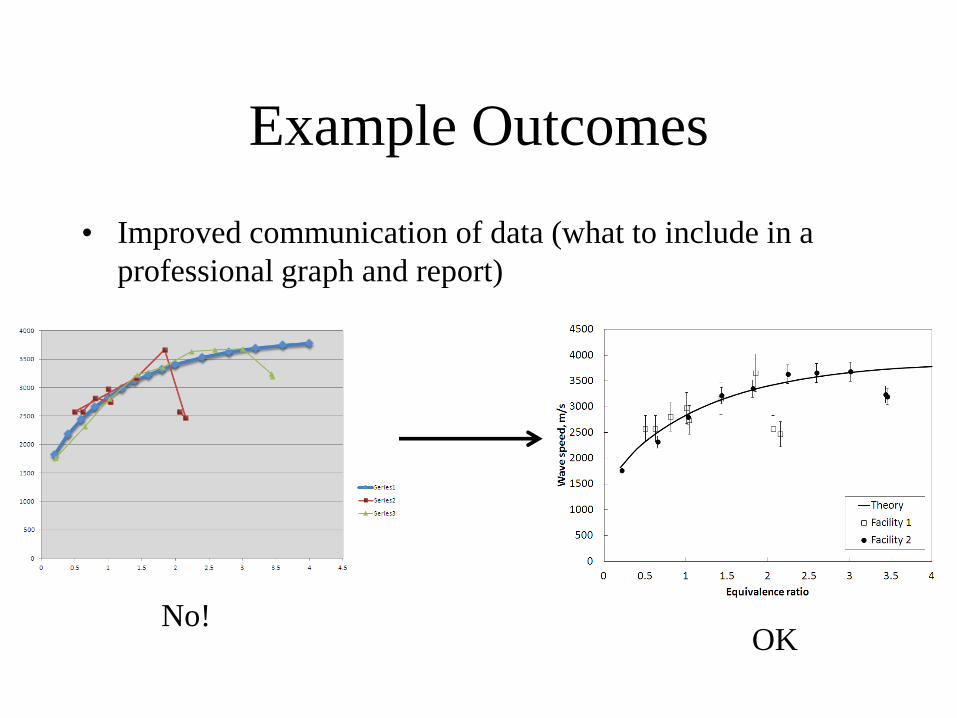
Example Outcomes
• Improved communication of data (what to include in a
professional graph and report)
No! OK
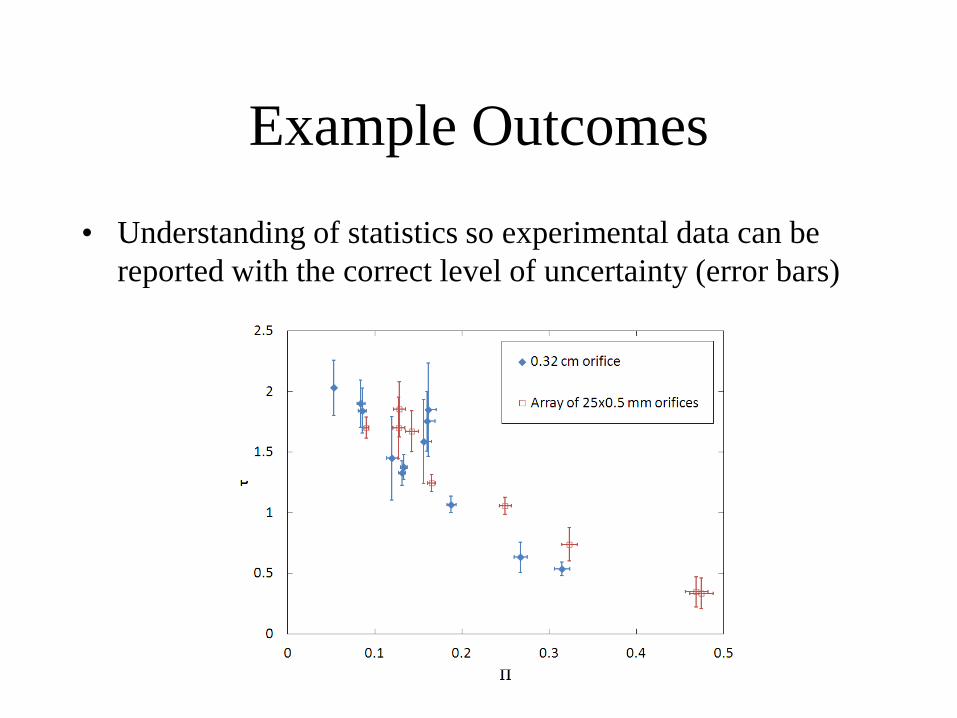
Example Outcomes
• Understanding of statistics so experimental data can be
reported with the correct level of uncertainty (error bars)
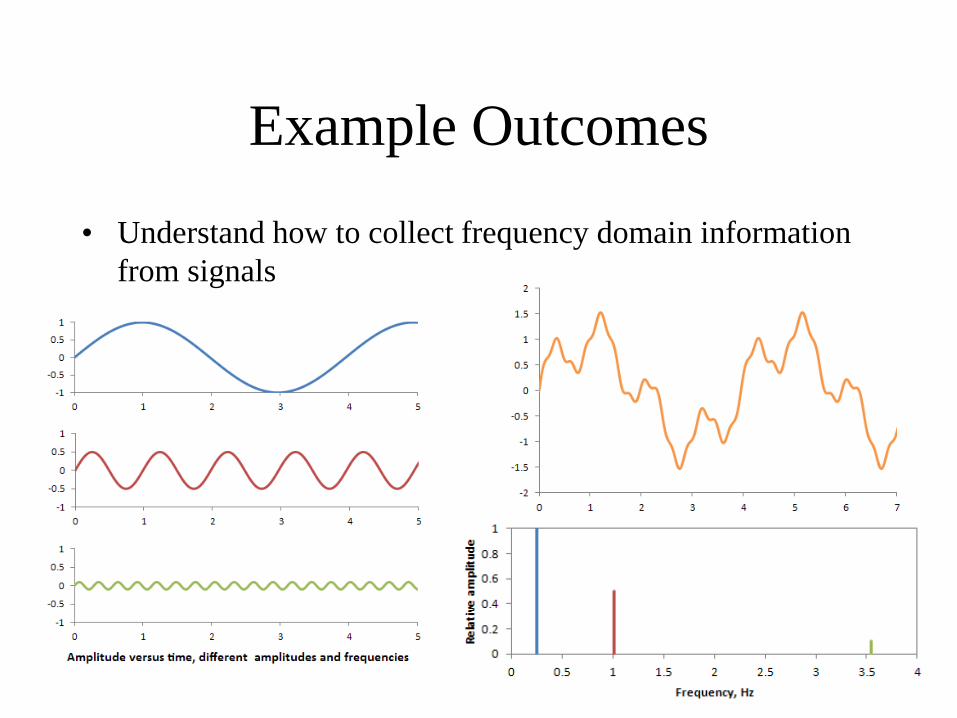
Example Outcomes
• Understand how to collect frequency domain information
from signals
Example Outcomes
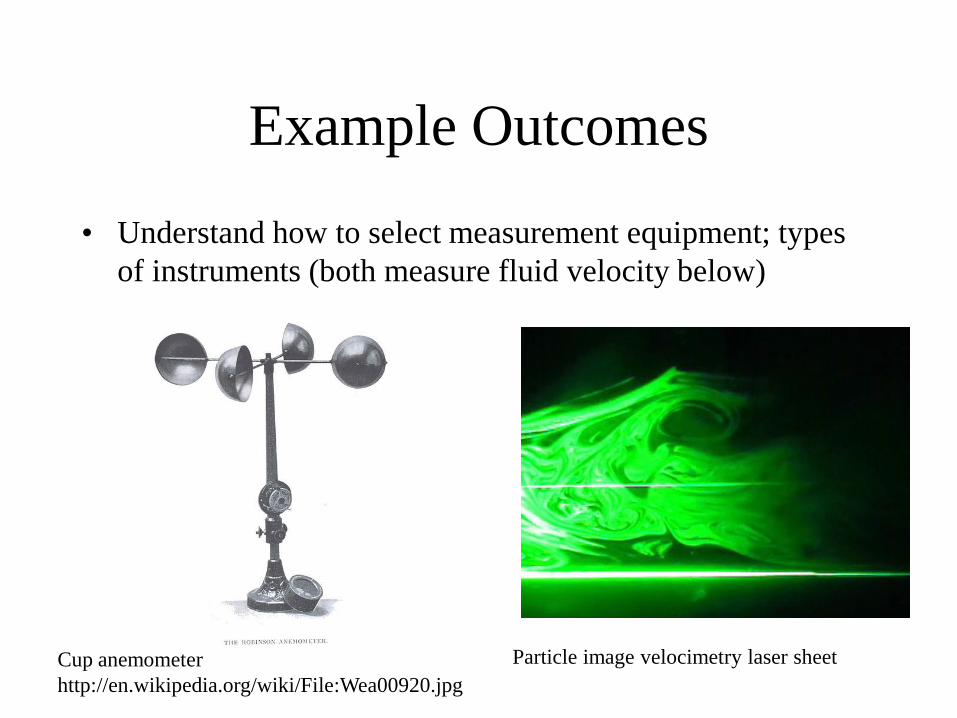
• Understand how to select measurement equipment; types
of instruments (both measure fluid velocity below)
Cup anemometer
http://en.wikipedia.org/wiki/File:Wea00920.jpg
Particle image velocimetry laser sheet

Outline of Labs
• A separate introduction to the measurement labs and the
required safety briefing will be given next week during the
lab time that you are enrolled in
• Labs begin next week and are performed every week until
completed
• Example labs: metrology, digital measurements, flow rates,
structural dynamics, heat transfer, LabVIEW programming
Assignments/Exams
• Homeworks (~ 6): Cover basic topics from the lecture
notes and textbook, mix of easy and more challenging
problems
• Lab reports (7): Formal reports of lab experiments
• Midterm and Final exam: Multiple choice questions and
short calculations
Grading
• ~6 homeworks 25%
• 7 labs 35%
• Midterm 20%
• Final 20%
• Total scores > 90% definitely receive an A. 80 to 90 B. 70
to 80 C. 60 to 70 D.
Late Assignment Policy
• Missed labs and exams must be made up immediately and
subjected to tardiness policy; – penalty for missing a lab
with no prior notice given to the TA. It is highly
recommended that you contact the instructor or TA if you
believe you will miss a lab or exam.
• One week given for grade appeals after an assignment is
handed back
• Late homework assignments will not be accepted. Grades
on assignments handed in one day late will be reduced by
20% of the total grade. Two days late, and the grade will
be zero.
Classroom Expectations
• Labs are performed after the lecture
– Lecture time ≠ time to complete lab report or homework in class
• Class participation is expected
– To attend class except for documented emergency
– Arrive on time and stay for the whole period
– I will take attendance
– 4 absences = grade reduction
– 9 absences = F
Expectations of Students
You alone are responsible for mastering the material presented in
this course for your own future use.
The instructor and teaching assistants are here to help you master
this material.
If you do not understand something presented in the class, it is
your responsibility to ask questions in class or seek help outside
of class.
A lab course offers the opportunity to witness and analyze
phenomena that you have studied or will study in other courses.
Successful completion of a lab course has always required a
student to spend significant time in the lab and writing reports.

Extra Notes
• Check Blackboard for additional handouts about report
writing, unit conversions, plagiarism cases, graphing, etc.

Americans With Disabilities Act
The University of Texas at Arlington is on record as being committed to
both the spirit and letter of federal equal opportunity legislation; reference
Public Law 93112-The Rehabilitation Act of 1973 as amended. With the
passage of new federal legislation entitled Americans with Disabilities Act
(ADA), pursuant to section 504 of The Rehabilitation Act, here is renewed
focus on providing this population with the same opportunities enjoyed by
all citizens.
As a faculty member, I am required by law to provide reasonable
accommodation to students with disabilities, so as not to discriminate on
the basis of that disability. Student responsibility primarily rests with
informing faculty at the beginning of the semester and in providing
authorized documentation through designated administrative channels.
Academic Dishonesty
It is the philosophy of The University of Texas at Arlington that academic
dishonesty is a completely unacceptable mode of conduct and will not
be tolerated in any form. All persons involved in academic dishonesty will
be disciplined in accordance with University regulations and procedures.
Discipline may include suspensions or expulsion from the University.
Scholastic dishonesty includes but is not limited to cheating, plagiarism
collusion, the submission for credit of any work or materials that are
attributable in whole or in part to another person, taking an examination
for another person, any act designed to give unfair advantage to a student
or the attempt to commit such acts. (Regents Rules and Regulations, Part
One, Chapter VI, Section 3, Subsection 3.2, Subdivision 3.22)
Presentation of Data in Graphs
Modified from “A pictorial guide to good graphing style” by Andrew Mizener, 2011
Introduction
• The objective of an experiment is to answer a question
(i.e., what does device A do at X, Y, Z conditions?)
• Answers to the question are usually in the form of data,
which must be graphically depicted and explained in a
technical report
• Excel graphs with default options are not acceptable for
professional communication of results
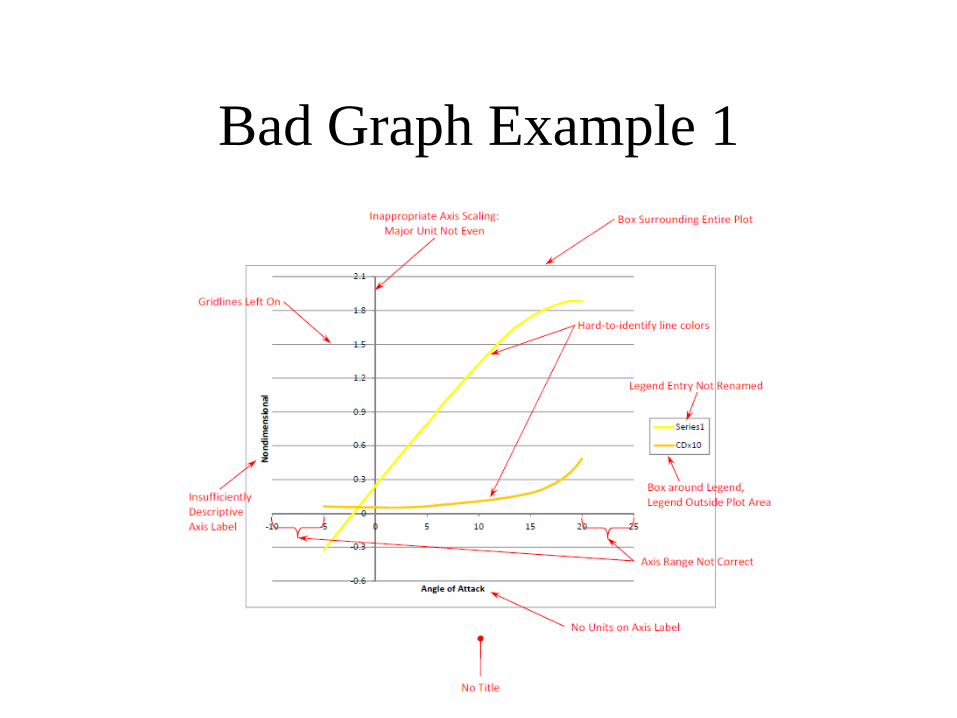
Bad Graph Example 1
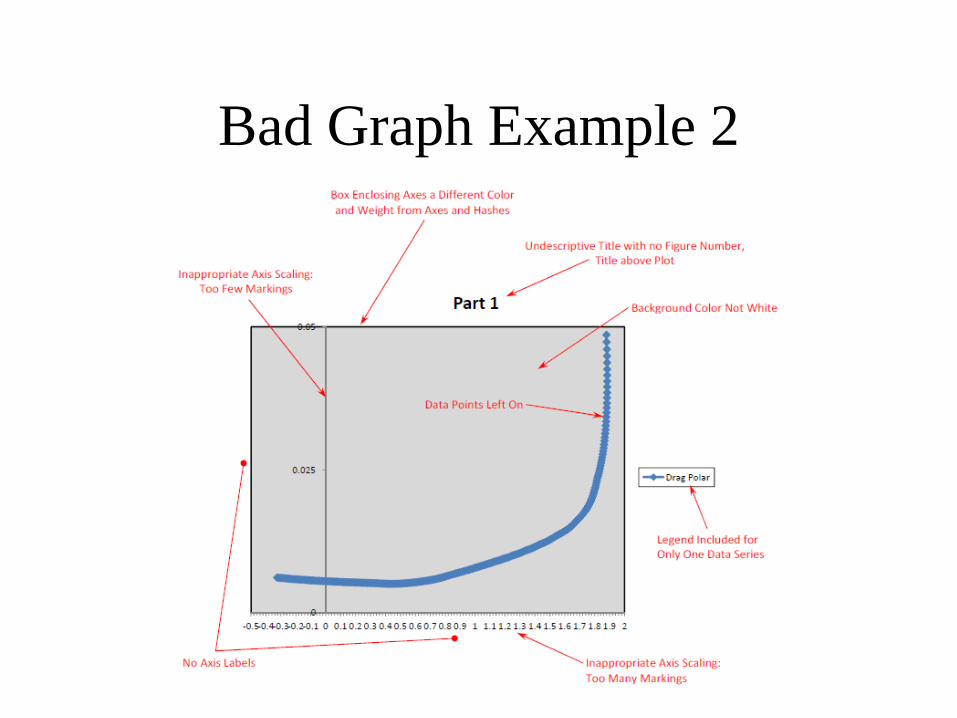
Bad Graph Example 2
Graphing Requirements
• Size - The plot must be large enough to read in a printed
report. Plots both on their own page and in line with text
are acceptable. The text size in the plot should be similar
to the text of a report.
• Labels for axes - Axis labels should be descriptive and
have the appropriate units included. Axis labels without
units will confuse the reader.
Graphing Requirements
• Titles – In a document, graph titles should be centered
below the graph and include a figure number.
• Ranges and scaling for axes - Limit the axes to the
minimum range necessary to display all the data.
– Add axis hatches so that the data can be reasonably read, but not so
many that they are unidentifiable.
– Select reasonable spacing for major and minor units
Graphing Requirements
• Symbols for data and lines for functions - symbols should
of a reasonable size and color so that they are easily
printed out to read
• Generally, symbols are included only when you are
plotting a scatter of data.
Graphing Requirements
• Lines for functions
– Dotted and dashed styles can be used to aid in
differentiating lines in close spacing, but should be
scaled such that no information is lost.
– Take care if printing in black and white since the color
doesn’t always translate to grayscale.
Graphing Requirements
• Grid lines – These are usually not necessary. They might
be used with a logarithmic plot.
• Legends – Legends should be included when you are
plotting two or more data sets on the same plot.
– Move the legend inside the plot area to a space where no data is
plotted
– Legend entries should be descriptive. For example, “α = 5°”,
“Adiabatic Case”, etc. are good. “Series1” is not acceptable.
Graphing Requirements
• Background color – There should not be a background
color.
• Borders – There should be no border around the entire
plot. A border can be put around the axes (see Good
Example 1), but that border should have the same color
and weight as the axes and hashes.
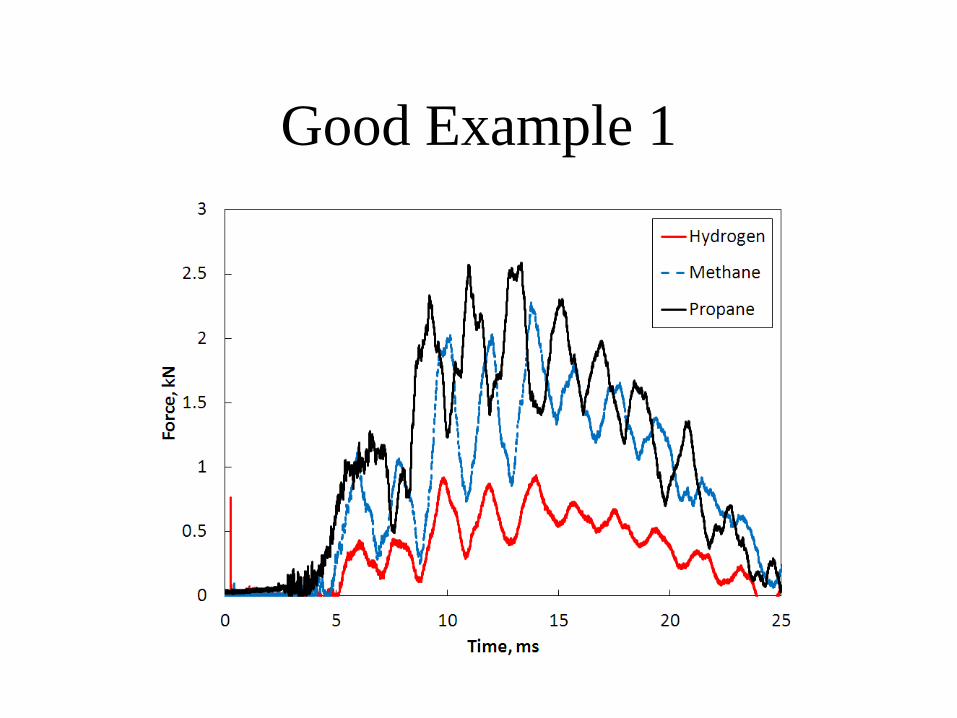
Good Example 1
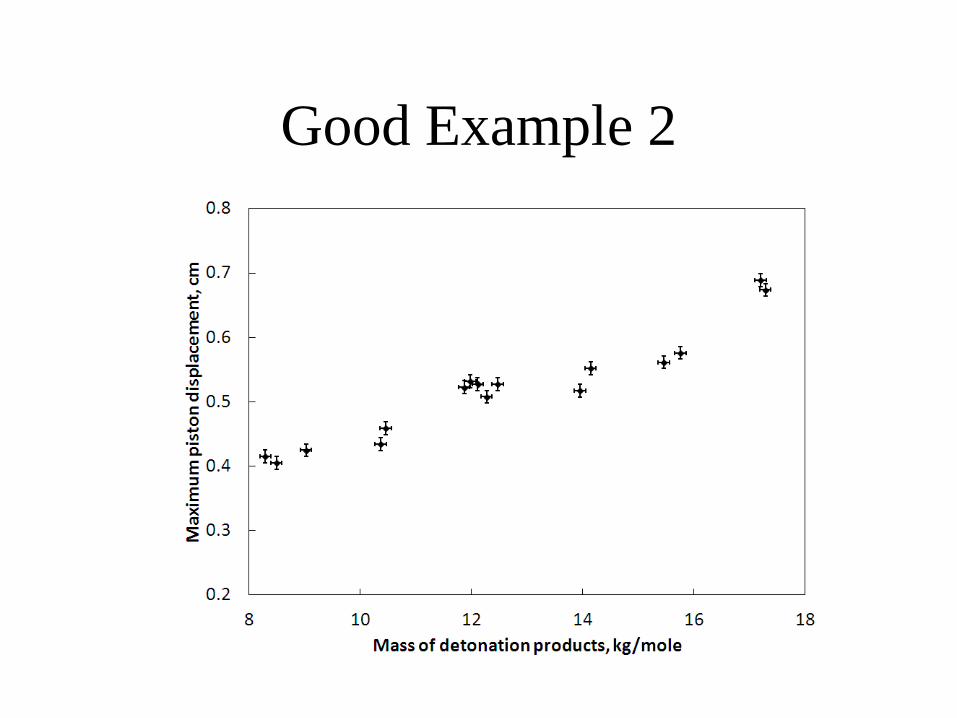
Good Example 2
Experiments and Models
• Experimental data are usually compared with a model
equation
• If so, it is customary in publications to plot the data in the
form of points while the model is plotted with a line
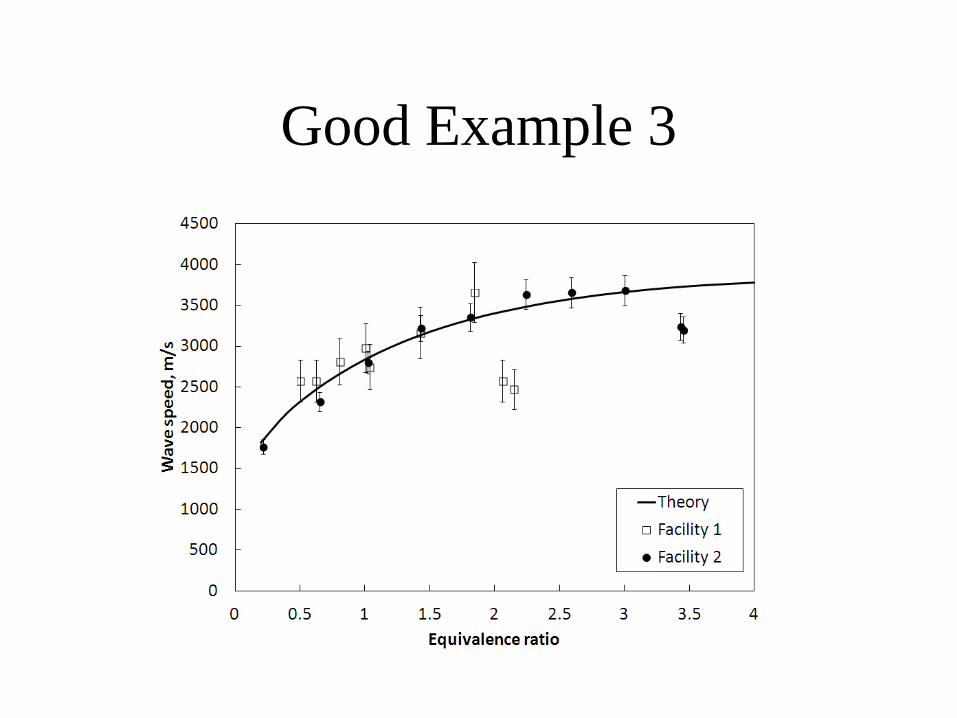
Good Example 3
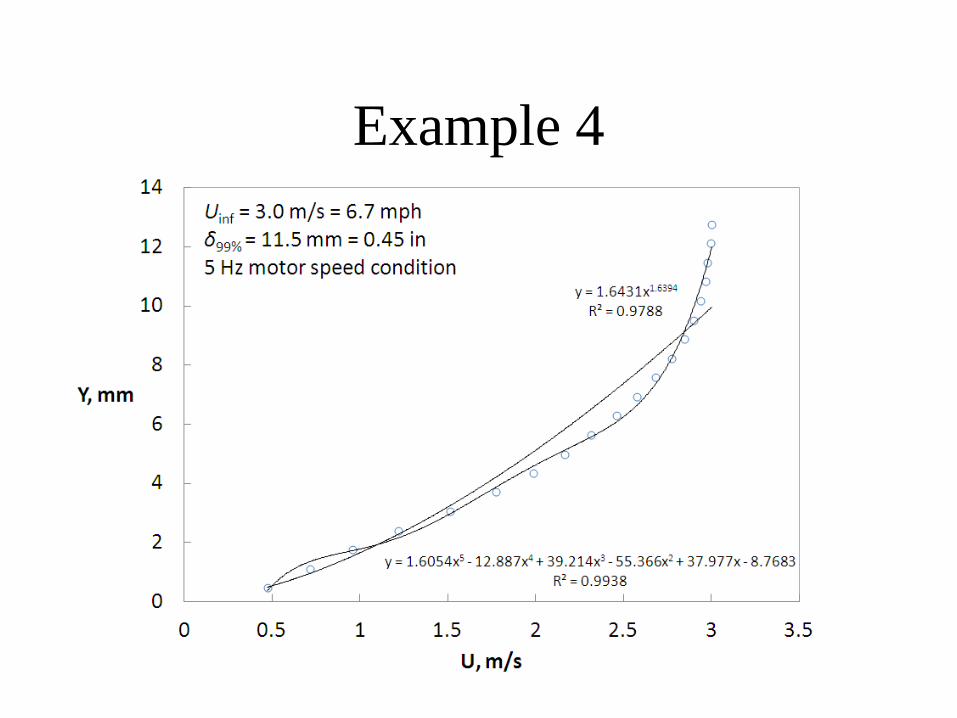
Data Points and Trend Lines
• Lines are often fit to scattered data to show the trends that
are occurring.
• If you fit a trend line, make sure that the line type chosen
(linear, quadratic, exponential, etc.) corresponds to theory.
• For instance, drag versus velocity points may have a
quadratic line fit since, in theory, D increases with u2.
Fitting an exponential line would be incorrect.
Example 4

Notes on Technical Report
Writing
This summarizes handouts online by Prof. Lu and Baker and Mizener
• A scientific experiment, no matter how
spectacular the results, is not completed until the
results are published.
• A cornerstone of the philosophy of science is
based on the fundamental assumption that
original research must be published.
• Only then can it be authenticated and added to
the existing database that we call scientific
knowledge (engineers use this knowledge to
design devices).
Report Structure
• In this course, report formatting is similar to
the conventions of academic journals.
• Most articles typically have an abstract,
introduction, methods, results and
discussion, and conclusions.
• These sections are followed by references
and, if needed, appendices for detailed
derivations of equations or data sets.

Title
• Should consist of the fewest possible words that
adequately describe the contents of the paper
– should be accurate, succinct but not vague.
– it is the first thing that is read and will
“make” or “break” the paper as a reader scans
through the pile of reading material that he or
she is inundated with daily.
Authorship
• Credit the persons performing and writing
up the work.
• Ranked in decreasing order of importance
to the work
• The inclusion of courtesy authors (i.e.,
adding a famous person) is strongly
disapproved by all professional societies.
• Usually no more than 10 authors in MAE
journals; some large projects generate
papers with hundreds of authors.
Abstract
• The abstract is typically 100–200 words and is
mostly written in the past tense.
• It assists the reader in assessing whether or not
he/she is interested in reading the paper
• 1) state the objectives and scope of the
investigation, 2) describe the method, 3)
summarize the results, and 4) state the major
conclusions.
Introduction
• Nature and scope of the problem investigated.
• Literature review of related work (also
establishes your work to be an original
contribution).
• Method of investigation and statement of work.
• Summarize the main results and conclusions.
Methods or Experimental Setup
• State methods used with applicable theory and
analysis.
• The goal is to give a reader enough information to
repeat the experiment to verify results (especially
if you report that neutrinos move faster than the
speed of light).
• Do not use an “instruction manual” language style.

Results and Discussion
• Present in a logical order with subsections if needed
• Don’t include results with no explanation. Discuss
graphs and tables as they are added to the report.
• Clearly explain the significance of the results.
• Discuss similarities and differences between current
observations and previous work that is referenced.
Conclusions
• Similar to an abstract, but not a copy of it.
• Make concrete statements that are supported by
results.
– “The Seebeck coefficient seems to be about 50
mV per kelvin for the metals starting around
300 K and ending around 1500 K.”
– “The Seebeck coefficient is 51 ± 2 mV per
kelvin for the metals over a temperature range
of 300–1500 K as indicated in Fig. 4.”
Acknowledgements
• Not needed in this course, but appears in
publications.
• Acknowledge co-workers that made
contributions, but not sufficient enough to
be co-authors.
• Acknowledge funding sources.
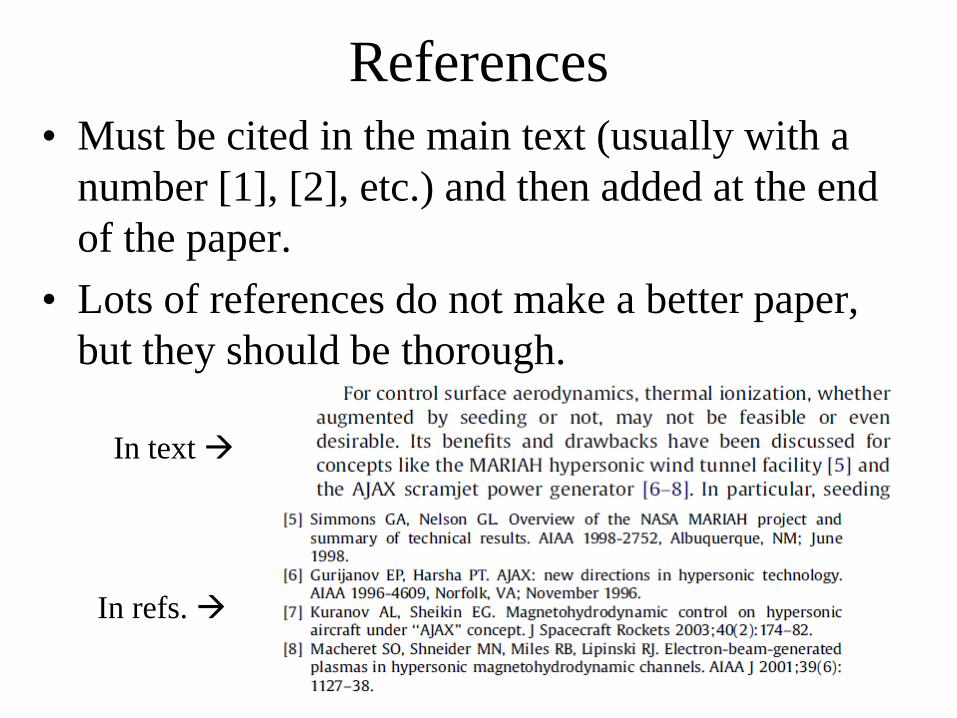
References
• Must be cited in the main text (usually with a
number [1], [2], etc.) and then added at the end
of the paper.
• Lots of references do not make a better paper,
but they should be thorough.
In text
In refs.
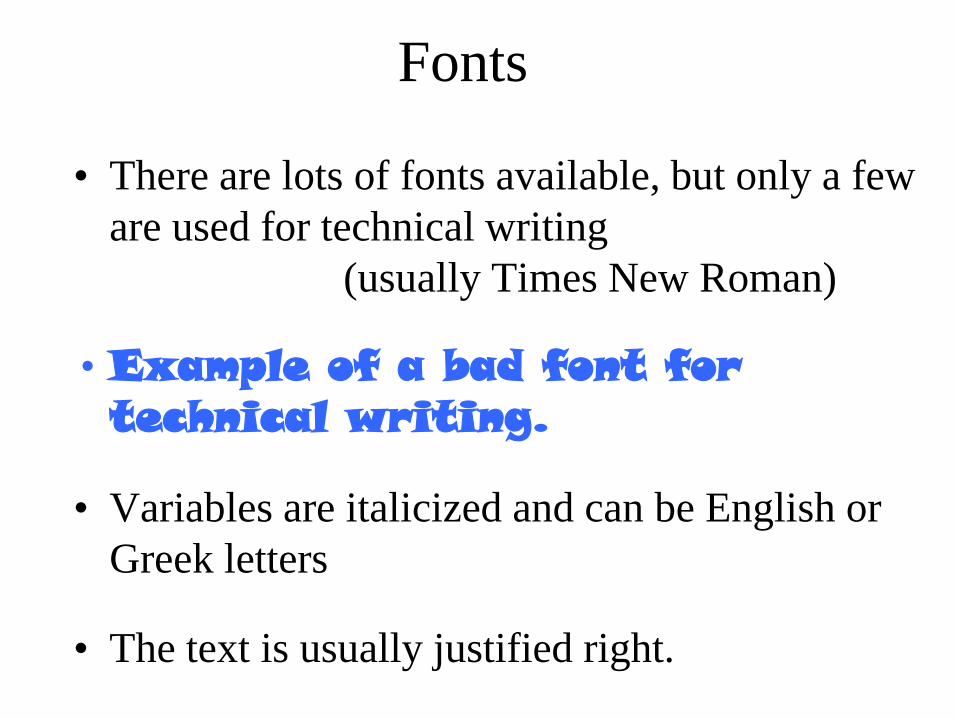
Fonts
• There are lots of fonts available, but only a few
are used for technical writing
(usually Times New Roman)
•Example of a bad font for technical writing.
• Variables are italicized and can be English or
Greek letters
• The text is usually justified right.
A Few Notes on Style
The handouts have many more details. Below
are common mistakes in lab reports.
• Tense: You DID perform the experiment.
You ARE presenting the results. The
procedure happened in the past.
• Use 3rd person tense. Don’t use “I,” “me,”
“we,” etc.
A Few Notes on Style
• Numbers less than 13 are typically spelled out.
• Put a space between the number and unit.
• Units named after a person are capitalized only
if they are abbreviated. All units are lower case
if spelled out. For example, the force is 1000 N
or 1000 newtons. (temperature units are an
exception).
• All equations should be centered with a number.
Paragraph Structure
• The main idea presented by a paragraph can be stated in the first or last sentence. Using first sentence main idea statements allows the reader to quickly determine what information is in the report.
• The last sentence is most effective as an introduction to the next paragraph (improves the “flow” of the writing).