228 North Lynnhaven Road Virginia Beach, Virginia 23452 Marketing... · 228 North Lynnhaven Road ....
18
228 North Lynnhaven Road Virginia Beach, Virginia 23452 Developed, Leased and Managed By: The Breeden Company 560 Lynnhaven Parkway Virginia Beach, Virginia 23452 Phone:757.486.1000 Fax:757.463.9164 Website: www.thebreedencompany.com
Transcript of 228 North Lynnhaven Road Virginia Beach, Virginia 23452 Marketing... · 228 North Lynnhaven Road ....

228 North Lynnhaven Road Virginia Beach, Virginia 23452
Developed, Leased and Managed By:
The Breeden Company
560 Lynnhaven Parkway Virginia Beach, Virginia 23452
Phone:757.486.1000 Fax:757.463.9164 Website: www.thebreedencompany.com

Over 220,000 potential customers within a five (5) mile radius. Strong accessibility from Interstate 264,
Lynnhaven Parkway, and Virginia Beach Boulevard. Private store front entrances with ample parking
in this “park like” setting. B-2 zoning allowing restaurants, retail, and office
users. The Breeden Company develops, leases, and
manages its properties and is locally operated. We take pride in our properties and constantly monitor all details because we have a vested interest.
WHY CHOOSE YORKTOWN COMMERCE
CENTER?
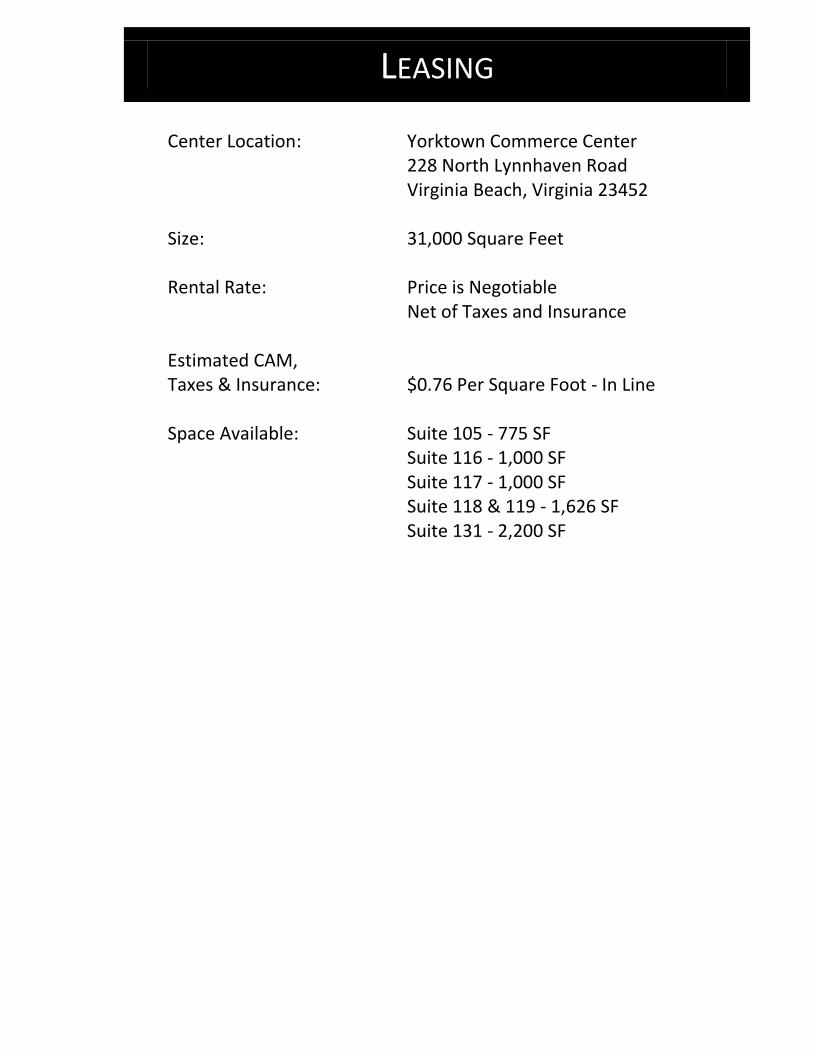
Center Location: Yorktown Commerce Center
228 North Lynnhaven Road Virginia Beach, Virginia 23452 Size: 31,000 Square Feet Rental Rate: Price is Negotiable Net of Taxes and Insurance Estimated CAM, Taxes & Insurance: $0.76 Per Square Foot - In Line Space Available: Suite 105 - 775 SF Suite 116 - 1,000 SF Suite 117 - 1,000 SF Suite 118 & 119 - 1,626 SF Suite 131 - 2,200 SF
LEASING

Suite# Tenant
101 Donald E. Lee, Jr. & Associates - Attorney At Law 102 Salon Chatta 103 - 104 Beehive Technologies 105 AVAILABLE 775 SF 106 Age Advantage Senior Care 107 Celestial Rain Massage & Wellness 108 - 109 Ludlow Group 110 Beach Therapy & Consulting 112 Old Dominion Security 114 Total Health 115 Lynnhaven Chiropractic 116 AVAILABLE 1,000 SF 117 AVAILABLE 1,000 SF 117A Anna’s Place 118 - 119 AVAILABLE 1,626 SF 120 Accounting & Appraisal Company 121 Voliva Enterprises, Inc. 122 - 123 Encore Dance Center 124 Tomstone Animation Art Gallery & Studios 125 - 126 Tomstone Animation Art Gallery & Studios 127 Success Studio 128 Salon One 129-130 Success Studio 131 AVAILABLE 2,200 SF
YORKTOWN COMMERCE CENTER

Yorktown Commerce Shopping Center228 North Lynnhaven Rd. • Virginia Beach VA 23452 • www.thebreedencompany.com
no
rt
h l
yn
nh
av
en
ro
ad
y o r k t o w n a v e n u e
101
102
103
104
105
106
107
108
109
110
111
112
114 115
116
117
117A 11
8
123
119
124
120
125
121
126
122
127
128
129
130
131


Demographic Comparison Report Page 1 of 4Virginia Beach, VA: 228 North Lynnhaven Rd 01/06/12
Yorktown
Population 2016 Projection 10,446 89,162 225,155 2011 Estimate 10,512 89,303 224,072 2000 Census 10,316 93,073 222,680 1990 Census 10,009 92,254 216,329
% Change 2011-2016 -0.6% -0.2% 0.5% % Change 2000-2011 1.9% -4.1% 0.6% % Change 1990-2000 3.1% 0.9% 2.9%
Households 2016 Projection 4,525 35,829 91,086 2011 Estimate 4,446 35,035 88,385 2000 Census 4,298 34,800 84,227 1990 Census 4,054 32,812 77,479
% Change 2011-2016 1.8% 2.3% 3.1% % Change 2000-2011 3.4% 0.7% 4.9% % Change 1990-2000 6.0% 6.1% 8.7%
Population by Age < 5 yrs 677 6.4% 6,280 7.0% 15,529 6.9% 5 - 9 yrs 660 6.3% 5,911 6.6% 14,797 6.6% 10 - 14 yrs 693 6.6% 5,999 6.7% 15,286 6.8% 15 - 24 yrs 1,572 15.0% 12,929 14.5% 32,969 14.7% 25 - 34 yrs 1,542 14.7% 13,702 15.3% 33,680 15.0% 35 - 44 yrs 1,512 14.4% 12,668 14.2% 31,975 14.3% 45 - 54 yrs 1,556 14.8% 13,076 14.6% 32,398 14.5% 55 - 64 yrs 1,197 11.4% 9,331 10.4% 23,528 10.5% 65 - 74 yrs 608 5.8% 5,203 5.8% 13,393 6.0% 75 - 84 yrs 363 3.5% 3,072 3.4% 7,749 3.5% 85+ yrs 131 1.2% 1,131 1.3% 2,765 1.2% Median Age 35.9 35.1 35.0
Male Population by Age 4,944 43,385 108,878 < 19 yrs 1,408 28.5% 12,532 28.9% 31,396 28.8% 20 - 34 yrs 1,149 23.2% 10,268 23.7% 25,598 23.5% 35 - 44 yrs 749 15.1% 6,156 14.2% 15,693 14.4% 45 - 64 yrs 1,176 23.8% 10,445 24.1% 26,128 24.0% 65 - 84 yrs 428 8.7% 3,630 8.4% 9,230 8.5% 85+ yrs 36 0.7% 354 0.8% 831 0.8% Median Age, Males 33.9 33.5 33.5
Female Population by Age 5,568 45,918 115,194 < 19 yrs 1,377 24.7% 11,863 25.8% 30,093 26.1% 20 - 34 yrs 1,211 21.7% 10,159 22.1% 25,174 21.9% 35 - 44 yrs 763 13.7% 6,513 14.2% 16,283 14.1% 45 - 64 yrs 1,578 28.3% 11,961 26.0% 29,797 25.9% 65 - 84 yrs 543 9.8% 4,645 10.1% 11,912 10.3% 85+ yrs 96 1.7% 777 1.7% 1,933 1.7% Median Age, Females 37.9 36.7 36.5
DecisionWhere, Inc. (949)365-0125 www.demographicreports.com Source:1990/2000/2010 Census2011/2016 ScanUS Est & Proj
1 MI RING 3 MI RING 5 MI RING

Demographic Comparison Report Page 2 of 4Virginia Beach, VA: 228 North Lynnhaven Rd 01/06/12
Yorktown
Total Aggregate Income ($Mil) $268.3 $2,424.5 $6,427.3Per Capita Income $25,528 $27,149 $28,684
Households By Income < $10,000 154 3.5% 1,480 4.2% 3,619 4.1% $10,000 - $14,999 142 3.2% 985 2.8% 2,578 2.9% $15,000 - $19,999 172 3.9% 1,073 3.1% 2,830 3.2% $20,000 - $24,999 225 5.1% 1,541 4.4% 3,744 4.2% $25,000 - $29,999 278 6.2% 2,001 5.7% 4,976 5.6% $30,000 - $34,999 213 4.8% 1,937 5.5% 4,704 5.3% $35,000 - $39,999 323 7.3% 2,284 6.5% 5,166 5.8% $40,000 - $49,999 617 13.9% 4,349 12.4% 10,402 11.8% $50,000 - $59,999 583 13.1% 3,700 10.6% 9,545 10.8% $60,000 - $74,999 567 12.8% 4,783 13.7% 11,892 13.5% $75,000 - $99,999 645 14.5% 4,979 14.2% 12,356 14.0% $100,000 - $124,999 225 5.1% 2,636 7.5% 6,537 7.4% $125,000 - $149,999 162 3.6% 1,367 3.9% 3,763 4.3% $150,000 - $199,999 65 1.5% 908 2.6% 3,101 3.5% $200,000 - $249,999 25 0.6% 281 0.8% 931 1.1% $250,000+ 50 1.1% 730 2.1% 2,235 2.5% Aggregate Household Income ($Mil) $262.7 $2,383.7 $6,328.0 Average Household Income $59,099 $68,039 $71,595 Median Household Income $52,102 $58,080 $59,931
Households by Disposable Income < $10,000 171 3.9% 1,603 4.6% 3,921 4.4% $10,000 - $14,999 147 3.3% 972 2.8% 2,566 2.9% $15,000 - $19,999 208 4.7% 1,302 3.7% 3,358 3.8% $20,000 - $24,999 295 6.6% 2,076 5.9% 5,083 5.8% $25,000 - $29,999 311 7.0% 2,516 7.2% 6,295 7.1% $30,000 - $34,999 374 8.4% 2,850 8.1% 6,482 7.3% $35,000 - $39,999 383 8.6% 2,831 8.1% 6,975 7.9% $40,000 - $49,999 835 18.8% 5,368 15.3% 13,313 15.1% $50,000 - $59,999 524 11.8% 4,370 12.5% 10,951 12.4% $60,000 - $74,999 624 14.0% 4,871 13.9% 11,942 13.5% $75,000 - $99,999 320 7.2% 3,382 9.7% 8,500 9.6% $100,000 - $124,999 140 3.1% 1,323 3.8% 3,977 4.5% $125,000 - $149,999 40 0.9% 526 1.5% 1,763 2.0% $150,000 - $199,999 33 0.7% 384 1.1% 1,273 1.4% $200,000 - $249,999 14 0.3% 159 0.5% 510 0.6% $250,000+ 28 0.6% 501 1.4% 1,472 1.7% Aggregate Disposable Income ($Mil) $224.4 $2,042.6 $5,387.1 Average Disposable Income $50,469 $58,302 $60,950 Median Disposable Income $44,002 $48,301 $49,472
Average Family Income $66,717 $78,258 $82,748Median Family Income $58,420 $66,924 $69,822
Average Non-family Income $49,182 $49,427 $51,157Median Non-family Income $43,588 $42,662 $43,805
DecisionWhere, Inc. (949)365-0125 www.demographicreports.com Source:1990/2000/2010 Census2011/2016 ScanUS Est & Proj
1 MI RING 3 MI RING 5 MI RING

Demographic Comparison Report Page 3 of 4Virginia Beach, VA: 228 North Lynnhaven Rd 01/06/12
Yorktown
Population by Race/Ethnicity White 7,318 69.6% 62,895 70.4% 153,508 68.5% Black 2,132 20.3% 16,452 18.4% 42,757 19.1% Asian 366 3.5% 3,651 4.1% 12,156 5.4% Pacific Islander 13 0.1% 147 0.2% 332 0.1% American Indian 34 0.3% 383 0.4% 919 0.4% Other/Multiple Races 648 6.2% 5,776 6.5% 14,400 6.4%
Hispanic Origin 742 7.1% 7,028 7.9% 16,955 7.6%
Education Population, Age 25+ 6,910 58,183 145,488 No High School Diploma 518 7.5% 4,731 8.1% 11,769 8.1% High School Graduate 1,883 27.2% 15,465 26.6% 38,195 26.3% College, No Degree 1,624 23.5% 14,357 24.7% 35,002 24.1% Associate's Degree 764 11.1% 5,904 10.1% 14,564 10.0% Bachelor's Degree 1,419 20.5% 11,575 19.9% 29,727 20.4% Graduate/Professional Degree 703 10.2% 6,151 10.6% 16,231 11.2%
Labor Force Male Population, Age 16+ 3,818 33,345 84,145 Employed 2,518 66.0% 20,992 63.0% 52,747 62.7% Unemployed 173 4.5% 1,529 4.6% 3,626 4.3% In Armed Forces 326 8.5% 4,005 12.0% 10,891 12.9% Not in Labor Force 800 21.0% 6,819 20.4% 16,882 20.1%
Female Population, Age 16+ 4,609 36,504 91,204 Employed 2,763 60.0% 21,263 58.2% 53,427 58.6% Unemployed 182 3.9% 1,528 4.2% 3,928 4.3% In Armed Forces 94 2.0% 652 1.8% 1,782 2.0% Not in Labor Force 1,570 34.1% 13,062 35.8% 32,067 35.2%
White Collar Workers (2000) 3,363 65.0% 27,627 63.6% 66,929 64.6%Blue Collar Workers (2000) 1,810 35.0% 15,802 36.4% 36,697 35.4%
Vehicles Available Total Vehicles 7,898 66,467 169,090 Households with No Vehicles 174 3.9% 1,238 3.5% 2,930 3.3% Households with 1 Vehicle 1,763 39.7% 11,500 32.8% 29,198 33.0% Households with 2 Vehicles 1,739 39.1% 14,739 42.1% 36,464 41.3% Households with 3 or More Vehicles 770 17.3% 7,557 21.6% 19,793 22.4% Average Vehicle per Household 1.8 1.9 1.9
Total Vehicles Owner Hshlds 4,744 60.1% 45,031 67.7% 118,733 70.2%Total Vehicles Renter Hshlds 3,232 40.9% 21,631 32.5% 51,301 30.3%
DecisionWhere, Inc. (949)365-0125 www.demographicreports.com Source:1990/2000/2010 Census2011/2016 ScanUS Est & Proj
1 MI RING 3 MI RING 5 MI RING

Demographic Comparison Report Page 4 of 4Virginia Beach, VA: 228 North Lynnhaven Rd 01/06/12
Yorktown
Households 4,446 35,035 88,385 Average Household Size 2.33 2.52 2.51Families 2,516 22,621 57,178 Average Family Size 3.06 3.19 3.16Non-Families 1,930 12,414 31,207 Average Non-Family Size 1.39 1.32 1.31Group Quarters 133 886 2,489
Household Type Families Married Couples 1,615 64.2% 16,305 72.1% 40,745 71.3% With Children 707 43.8% 7,390 45.3% 18,196 44.7% Male Hshlder, No Wife 216 8.6% 1,514 6.7% 3,899 6.8% With Children 132 61.0% 843 55.7% 2,309 59.2% Female Hshlder, No Husband 685 27.2% 4,802 21.2% 12,531 21.9% With Children 510 74.5% 3,338 69.5% 8,986 71.7% Non-Families Male Hshlder, 1 Person 691 35.8% 4,702 37.9% 11,507 36.9% Female Hshlder, 1 Persons 839 43.5% 5,394 43.5% 13,291 42.6% Male Hshlder, 2+ Person 211 10.9% 1,330 10.7% 3,691 11.8% Female Hshlder, 2+ Persons 189 9.8% 986 7.9% 2,713 8.7%
Household Size 1 Person 1,534 34.5% 10,093 28.8% 24,691 27.9% 2 Persons 1,347 30.3% 10,449 29.8% 27,305 30.9% 3-4 Persons 1,293 29.1% 11,068 31.6% 28,410 32.1% 5+ Persons 271 6.1% 3,424 9.8% 7,977 9.0%
Households by Age of Householder < 25 yrs 285 6.4% 2,111 6.0% 5,459 6.2% 25 - 34 yrs 818 18.4% 6,767 19.3% 16,678 18.9% 35 - 44 yrs 881 19.8% 7,094 20.2% 18,009 20.4% 45 - 54 yrs 974 21.9% 7,722 22.0% 19,243 21.8% 55 - 64 yrs 769 17.3% 5,609 16.0% 14,235 16.1% 65 - 74 yrs 398 8.9% 3,244 9.3% 8,440 9.5% 75-84 yrs 253 5.7% 1,961 5.6% 5,003 5.7% 85+ yrs 67 1.5% 527 1.5% 1,314 1.5%
Total Housing Units 4,700 36,775 94,030 Owned 2,361 50.2% 21,272 57.8% 55,530 59.1% Rented 2,085 44.4% 13,763 37.4% 32,855 34.9% Vacant 254 5.4% 1,740 4.7% 5,645 6.0%
Housing Value (2000) Average Home Value $136,301 $149,056 $156,291 Median Home Value $125,186 $136,172 $141,898 Average Contract Rent $599 $637 $638 Median Contract Rent $606 $647 $640
DecisionWhere, Inc. (949)365-0125 www.demographicreports.com Source:1990/2000/2010 Census2011/2016 ScanUS Est & Proj
1 MI RING 3 MI RING 5 MI RING

Business Comparison Report Page 1 of 1Virginia Beach, VA: 228 North Lynnhaven Rd 01/06/12Yorktown
Estab Emps Estab Emps Estab EmpsTOTAL ESTABLISHMENTS/EMPLOYEES 714 9,909 4,178 52,450 9,152 112,520
BUSINESS BY TYPE Industrial 79 1,017 507 5,762 1,171 11,710
Mining 0 0 4 25 9 54Construction 9 179 63 2,402 137 5,569Construction, Small Firms 43 130 281 832 632 1,838High-Tech & Research 3 40 10 88 26 453Transportation/Communications/Utilities 3 7 20 131 73 400Wholesale-Industrial 17 650 83 2,010 181 2,693Warehousing 3 12 33 221 76 416General Industrial 0 0 13 52 37 286
Manufacturing 12 291 87 3,166 170 4,328Heavy Manufacturing 1 60 4 352 7 521General Manufacturing 2 133 6 276 8 415Light Manufacturing 3 76 13 2,297 18 2,890Manufacturing, Small Module 6 22 64 241 137 503
Commercial 198 3,587 1,661 21,152 3,411 40,718Retail Trade 84 1,888 666 9,244 1,292 16,763Restaurants & Bars 21 211 264 4,923 593 10,987Personal/Rent/Repair Services 37 135 322 1,511 642 3,362Auto Repair Services 11 753 86 2,047 196 2,504Hotels & Motels 4 21 9 146 29 1,115Theaters & Retail Amusement 1 10 14 140 23 255Equipment Rental 4 7 30 101 76 283Wholesale-Commercial 4 66 40 369 79 615General Commercial 33 495 231 2,671 481 4,833
Office 365 3,690 1,573 14,246 3,491 35,881Business & Corporate Administration 1 10 5 398 10 942Finance/Insurance/Real Estate 42 1,253 117 2,995 248 8,813Finance/Insurance/Real Estate, Small Office 88 306 300 984 658 2,182Professional Services 106 1,139 331 3,491 804 8,287Business Services 20 203 129 1,315 306 4,115General Office 54 420 216 1,881 433 4,071Medical Services 55 359 476 3,183 1,033 7,471
Other 55 1,312 321 7,921 843 19,285Schools & Colleges 4 254 36 1,855 100 7,821Libraries 0 0 8 294 11 339Hospitals & Related Medical Services 0 0 17 3,398 35 4,321Museums, Art, & Gardens 1 5 1 5 4 32Outdoor Recreation & Amusements 11 46 56 355 145 1,318Public Administration 7 848 22 1,019 104 2,816Churches 14 84 64 371 138 711Other, Not Classified 19 75 117 623 307 1,927
Agricultural 4 12 30 203 66 600Agricultural Production 0 0 0 0 0 0Agriculture Services 4 12 30 203 66 600
DecisionWhere, Inc. (949)365-0125 www.demographicreports.com Source: 2011 ScanUS Estimate
1 MI RING 3 MI RING 5 MI RING

Consumer Expenditure Report Page 1 of 2Virginia Beach, VA: 228 North Lynnhaven Rd 01/06/12Yorktown
TOTAL HOUSEHOLDS 4,446 35,035 88,385 Owner Households 2,361 21,272 55,530 Renter Households 2,085 13,763 32,855 AVERAGE HOUSEHOLD INCOME $59,098 $68,038 $71,594AVERAGE ANNUAL HOUSEHOLD CEX $47,860 $52,740 $54,681
ANNUAL EXPENDITURE p/hshld Food, Alcohol, Tobacco
CEX, Food $6,276 $6,795 $6,996 Food Exp, At Home $3,716 $3,950 $4,038 Food Exp, Away $2,560 $2,845 $2,959CEX, Alcoholic Beverage $417 $465 $483CEX, Tobacco Products $370 $370 $370
Housing CEX, Housing $16,387 $17,860 $18,458 Shelter $9,695 $10,611 $10,985 Mortgage Interest/Charges $3,557 $4,056 $4,248
Property Tax $1,716 $1,911 $1,992Maintenance/Repair/Ins $1,096 $1,214 $1,264
Utilities/Fuels/Services $3,660 $3,857 $3,934 Household Operations $929 $1,053 $1,105 Home/Garden Supplies $645 $697 $717 Furnishings & Equip. $1,457 $1,643 $1,717
Apparel CEX, Apparel $1,668 $1,853 $1,928 Men, 16+ yrs $307 $350 $368 Boys, 2-15 yrs $73 $80 $82 Women, 16+ yrs $548 $610 $635 Girls, 2-15 yrs $124 $136 $140 Children <2 yrs $91 $98 $100 Footwear $314 $338 $348
Transportation CEX, Transportation $8,038 $8,793 $9,072 Vehicle Purchases $2,634 $2,907 $3,004
Cars/Trucks, New $1,258 $1,431 $1,497Cars/Trucks, Used $1,291 $1,373 $1,399Other Vehicles $85 $102 $108
Gas/Motor Oil $2,317 $2,512 $2,582 Finance/Ins/Lease/License $1,909 $2,055 $2,108 Maintenance/Repair $741 $804 $828 Public Transport $437 $516 $549
DecisionWhere, Inc. (949)365-0125 www.demographicreports.com Source: 2011 ScanUS Estimate
1 MI RING 3 MI RING 5 MI RING

Consumer Expenditure Report Page 2 of 2Virginia Beach, VA: 228 North Lynnhaven Rd 01/06/12Yorktown
ANNUAL EXPENDITURE p/hshld (Cont'd) Healthcare
CEX, Healthcare $3,073 $3,237 $3,304 Insurance $1,761 $1,838 $1,870 Medical Services $709 $767 $790 Drugs $485 $506 $514 Medical Supplies $118 $126 $130
Entertainment CEX, Entertainment $2,666 $2,966 $3,079 Fees/Admissions $546 $645 $687 TV/Radio/Sound Equipment $1,016 $1,094 $1,123 Pets/Toys/Play Equipment $697 $777 $804 Other Entertainment $407 $450 $466
Personal Care Products/Services $576 $635 $658
Reading $108 $119 $124
Education $821 $1,002 $1,080
Cash Contributions $1,565 $1,776 $1,868
Personal Insurance/Pensions $5,086 $5,973 $6,330
Misc Services $809 $896 $930
DecisionWhere, Inc. (949)365-0125 www.demographicreports.com Source: 2011 ScanUS Estimate
1 MI RING 3 MI RING 5 MI RING

Kempsville Rd/SR-190
I-64
Centerville Tpke N Indian River Rd/SR-603
S Independence Blvd
Ferrell Pkwy
Princess Anne Rd
Princess Anne Rd
S Rosemont Rd/SR-411
Lynnhaven Pkwy/SR-414
London Bridge Rd
Holland Rd/SR-410
Lynnhaven Pkwy/SR-414
Dam Neck Rd
Oceana Blvd/SR-615
General Booth Blvd
Providence Rd/SR-409
I-64
N Witchduck Rd/SR-190
Diamond Springs Rd
Va Bch Norfolk Expy/I-264/SR-44
E Virginia Beach Blvd/US-58
S Independence Blvd/SR-225
Northampton Blvd/US-13
Shore Dr/US-60
Edinburgh Dr
Shore Dr/US-60
S Birdneck Rd
N Great Neck Rd/SR-279/SR-632
Va Bch Norfolk Expy/I-264/SR-44
N Great Neck Rd/SR-279/SR-615
Shore Dr/US-60
Atlantic Ave/US-60
Virginia BeachVirginia BeachVirginia BeachVirginia BeachVirginia BeachVirginia BeachVirginia BeachVirginia BeachVirginia BeachVirginia BeachVirginia BeachVirginia BeachVirginia BeachVirginia BeachVirginia BeachVirginia BeachVirginia BeachVirginia BeachVirginia BeachVirginia BeachVirginia BeachVirginia BeachVirginia BeachVirginia BeachVirginia BeachVirginia BeachVirginia BeachVirginia BeachVirginia BeachVirginia BeachVirginia BeachVirginia BeachVirginia BeachVirginia BeachVirginia BeachVirginia BeachVirginia BeachVirginia BeachVirginia BeachVirginia BeachVirginia BeachVirginia BeachVirginia BeachVirginia BeachVirginia BeachVirginia BeachVirginia BeachVirginia BeachVirginia BeachVirginia BeachVirginia BeachVirginia BeachVirginia BeachVirginia BeachVirginia Beach
1 mi
3 mi
5 mi
Yorktown
Legend MicroGrids, ©2011 Scan/US
11 Population
Density per Sq.Mi
< 1,500 persons
1,500 - 3,000 persons
3,000 - 5,000 persons
5,000 - 7,000 persons
7,000+ persons
0 0.5 1 1.5 2
Scale: 1" = 1.68 miles
Virginia Beach, VA: 2011 Population Density
www.demographicreports.com (949)365-0125
Map produced w
ith Scan/U
S
01/06/12

Kempsville Rd/SR-190
I-64
Centerville Tpke N Indian River Rd/SR-603
S Independence Blvd
Ferrell Pkwy
Princess Anne Rd
Princess Anne Rd
S Rosemont Rd/SR-411
Lynnhaven Pkwy/SR-414
London Bridge Rd
Holland Rd/SR-410
Lynnhaven Pkwy/SR-414
Dam Neck Rd
Oceana Blvd/SR-615
General Booth Blvd
Providence Rd/SR-409
I-64
N Witchduck Rd/SR-190
Diamond Springs Rd
Va Bch Norfolk Expy/I-264/SR-44
E Virginia Beach Blvd/US-58
S Independence Blvd/SR-225
Northampton Blvd/US-13
Shore Dr/US-60
Edinburgh Dr
Shore Dr/US-60
S Birdneck Rd
N Great Neck Rd/SR-279/SR-632
Va Bch Norfolk Expy/I-264/SR-44
N Great Neck Rd/SR-279/SR-615
Shore Dr/US-60
Atlantic Ave/US-60
Virginia BeachVirginia BeachVirginia BeachVirginia BeachVirginia BeachVirginia BeachVirginia BeachVirginia BeachVirginia BeachVirginia BeachVirginia BeachVirginia BeachVirginia BeachVirginia BeachVirginia BeachVirginia BeachVirginia BeachVirginia BeachVirginia BeachVirginia BeachVirginia BeachVirginia BeachVirginia BeachVirginia BeachVirginia BeachVirginia BeachVirginia BeachVirginia BeachVirginia BeachVirginia BeachVirginia BeachVirginia BeachVirginia BeachVirginia BeachVirginia BeachVirginia BeachVirginia BeachVirginia BeachVirginia BeachVirginia BeachVirginia BeachVirginia BeachVirginia BeachVirginia BeachVirginia BeachVirginia BeachVirginia BeachVirginia BeachVirginia BeachVirginia BeachVirginia BeachVirginia BeachVirginia BeachVirginia BeachVirginia Beach
1 mi
3 mi
5 mi
Yorktown
Legend MicroGrids, ©2011 Scan/US
11 Avg hshld income
< $55,000
$55,000 - $70,000
$70,000 - $85,000
$85,000 - $110,000
$110,000+
0 0.5 1 1.5 2
Scale: 1" = 1.68 miles
Virginia Beach, VA: 2011 Average Household Income
www.demographicreports.com (949)365-0125
Map produced w
ith Scan/U
S
01/06/12

Kempsville Rd/SR-190
I-64
Centerville Tpke N Indian River Rd/SR-603
S Independence Blvd
Ferrell Pkwy
Princess Anne Rd
Princess Anne Rd
S Rosemont Rd/SR-411
Lynnhaven Pkwy/SR-414
London Bridge Rd
Holland Rd/SR-410
Lynnhaven Pkwy/SR-414
Dam Neck Rd
Oceana Blvd/SR-615
General Booth Blvd
Providence Rd/SR-409
I-64
N Witchduck Rd/SR-190
Diamond Springs Rd
Va Bch Norfolk Expy/I-264/SR-44
E Virginia Beach Blvd/US-58
S Independence Blvd/SR-225
Northampton Blvd/US-13
Shore Dr/US-60
Edinburgh Dr
Shore Dr/US-60
S Birdneck Rd
N Great Neck Rd/SR-279/SR-632
Va Bch Norfolk Expy/I-264/SR-44
N Great Neck Rd/SR-279/SR-615
Shore Dr/US-60
Atlantic Ave/US-60
Virginia BeachVirginia BeachVirginia BeachVirginia BeachVirginia BeachVirginia BeachVirginia BeachVirginia BeachVirginia BeachVirginia BeachVirginia BeachVirginia BeachVirginia BeachVirginia BeachVirginia BeachVirginia BeachVirginia BeachVirginia BeachVirginia BeachVirginia BeachVirginia BeachVirginia BeachVirginia BeachVirginia BeachVirginia BeachVirginia BeachVirginia BeachVirginia BeachVirginia BeachVirginia BeachVirginia BeachVirginia BeachVirginia BeachVirginia BeachVirginia BeachVirginia BeachVirginia BeachVirginia BeachVirginia BeachVirginia BeachVirginia BeachVirginia BeachVirginia BeachVirginia BeachVirginia BeachVirginia BeachVirginia BeachVirginia BeachVirginia BeachVirginia BeachVirginia BeachVirginia BeachVirginia BeachVirginia BeachVirginia Beach
1 mi
3 mi
5 mi
Yorktown
Legend MicroGrids, ©2011 Scan/US
11 Employees
Density per Sq.Mi
1 - 100 employees
100 - 250 employees
250 - 1,000 employees
1,000 - 3,000 employees
3,000+ employees
0 0.5 1 1.5 2
Scale: 1" = 1.68 miles
Virginia Beach, VA: 2011 Employee Density
www.demographicreports.com (949)365-0125
Map produced w
ith Scan/U
S
01/06/12

Kempsville Rd/SR-190
I-64
Centerville Tpke N Indian River Rd/SR-603
S Independence Blvd
Ferrell Pkwy
Princess Anne Rd
Princess Anne Rd
S Rosemont Rd/SR-411
Lynnhaven Pkwy/SR-414
London Bridge Rd
Holland Rd/SR-410
Lynnhaven Pkwy/SR-414
Dam Neck Rd
Oceana Blvd/SR-615
General Booth Blvd
Providence Rd/SR-409
I-64
N Witchduck Rd/SR-190
Diamond Springs Rd
Va Bch Norfolk Expy/I-264/SR-44
E Virginia Beach Blvd/US-58
S Independence Blvd/SR-225
Northampton Blvd/US-13
Shore Dr/US-60
Edinburgh Dr
Shore Dr/US-60
S Birdneck Rd
N Great Neck Rd/SR-279/SR-632
Va Bch Norfolk Expy/I-264/SR-44
N Great Neck Rd/SR-279/SR-615
Shore Dr/US-60
Atlantic Ave/US-60
Virginia BeachVirginia BeachVirginia BeachVirginia BeachVirginia BeachVirginia BeachVirginia BeachVirginia BeachVirginia BeachVirginia BeachVirginia BeachVirginia BeachVirginia BeachVirginia BeachVirginia BeachVirginia BeachVirginia BeachVirginia BeachVirginia BeachVirginia BeachVirginia BeachVirginia BeachVirginia BeachVirginia BeachVirginia BeachVirginia BeachVirginia BeachVirginia BeachVirginia BeachVirginia BeachVirginia BeachVirginia BeachVirginia BeachVirginia BeachVirginia BeachVirginia BeachVirginia BeachVirginia BeachVirginia BeachVirginia BeachVirginia BeachVirginia BeachVirginia BeachVirginia BeachVirginia BeachVirginia BeachVirginia BeachVirginia BeachVirginia BeachVirginia BeachVirginia BeachVirginia BeachVirginia BeachVirginia BeachVirginia Beach
1 mi
3 mi
5 mi
Yorktown
Legend MicroGrids, ©2011 Scan/US
11 Average hh annual CEX
< $45,000
$45,000 - $55,000
$55,000 - $62,000
$62,000 - $75,000
$75,000+
0 0.5 1 1.5 2
Scale: 1" = 1.68 miles
Virginia Beach, VA: 2011 Average Annual Household Consumer Expenditure
www.demographicreports.com (949)365-0125
Map produced w
ith Scan/U
S
01/06/12