22 APRIL 2015 FMU PRESENTATION Financial Market Update · PDF fileProduction growth in China...
41
Financial 22 APRIL 2015 FMU PRESENTATION Market Update FMU 2015
-
Upload
truonglien -
Category
Documents
-
view
213 -
download
1
Transcript of 22 APRIL 2015 FMU PRESENTATION Financial Market Update · PDF fileProduction growth in China...

Financial 22 APRIL 2015 FMU PRESENTATION
Market Update
FMU 2015


Summary
2014
Portfolio of
terminals Value creation Q1 2015
trading update
Financial Market Update 22 April 2015
Question &
answers
Forward-looking Statements
4
This presentation contains ‘forward-looking statements’, based on currently available plans
and forecasts. By their nature, forward-looking statements involve risks and uncertainties
because they relate to events and depend on circumstances that may or may not occur in the
future, and Vopak cannot guarantee the accuracy and completeness of forward-looking
statements.
These risks and uncertainties include, but are not limited to, factors affecting the realization of ambitions and financial
expectations, developments regarding the potential capital raising, exceptional income and expense items, operational
developments and trading conditions, economic, political and foreign exchange developments and changes to IFRS reporting
rules.
Vopak’s EBITDA outlook does not represent a forecast or any expectation of future results or financial performance.
Statements of a forward-looking nature issued by the company must always be assessed in the context of the events, risks and
uncertainties of the markets and environments in which Vopak operates. These factors could lead to actual results being materially
different from those expected, and Vopak does not undertake to publicly update or revise any of these forward-looking statements.

Summary
2014
Portfolio of
terminals Value creation Q1 2015
trading update
Financial Market Update 22 April 2015
Question &
answers
5
Summary 2014

Summary
2014
Portfolio of
terminals Value creation Q1 2015
trading update
Financial Market Update 22 April 2015
Question &
answers
6
Vopak’s ambition
Solid leadership position in the global independent tank storage market
Safety and
service
Our
values
Strong link
supply
chain
Presence
at prime
locations
Value
creation
Summary
2014
Portfolio of
terminals Value creation Q1 2015
trading update
Financial Market Update 22 April 2015
Question &
answers
7
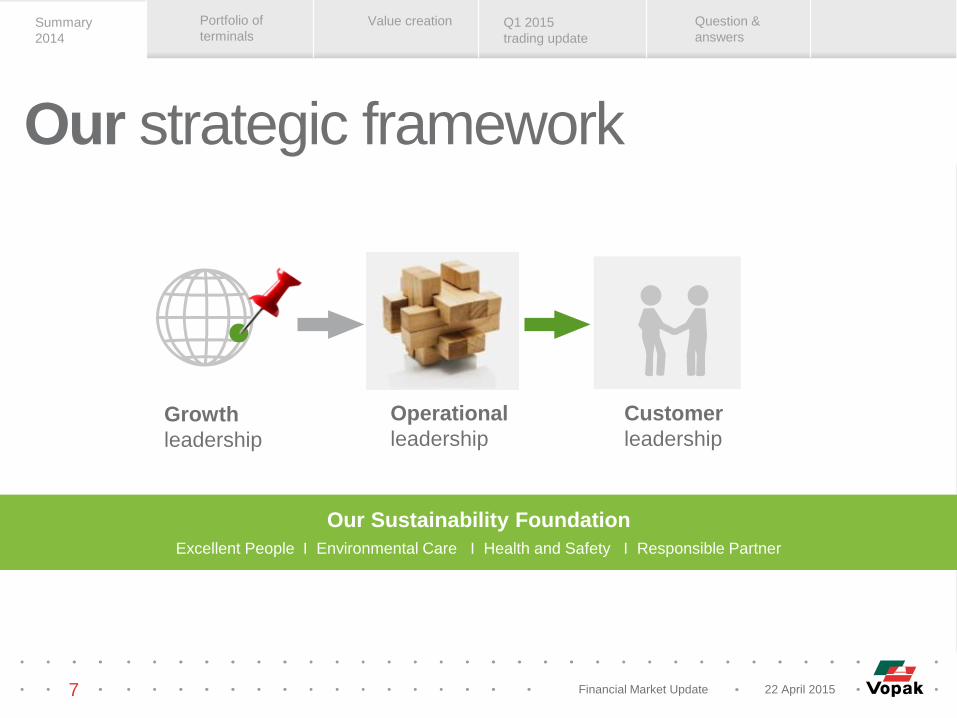
Our strategic framework
Growth
leadership
Operational
leadership
Customer
leadership
Our Sustainability Foundation
Excellent People I Environmental Care I Health and Safety I Responsible Partner

Summary
2014
Portfolio of
terminals Value creation Q1 2015
trading update
Financial Market Update 22 April 2015
Question &
answers
8
Strategy execution
Divestment Program
15 terminals
Strategic
Growth
4 categories
Reduce * Cost base
30 EUR million
Reduce * Capex
100 EUR million
* Up to and including 2016

Summary
2014
Portfolio of
terminals Value creation Q1 2015
trading update
Financial Market Update 22 April 2015
Question &
answers
9
Product developments 2014
Oil production exceeds
demand resulting in price
reduction. Lower oil prices
and interest rates, contango
decreases cost of holding
stock
Customer interest increased
to take positions.
Chemicals: North
America is investing in
petrochemicals benefiting
from prolonged advantaged
feedstock positions
Rationalization and
consolidation of production
capacity in Europe and
North East Asia as a result
of higher cost and lagging
demand
Production growth in China
and Middle-East continues
Biofuels demand is
stable in mature markets
and growing in non-OECD
countries. Duties limit flows
into EU. Intra EU at stable
levels
Vegoils demand grew
steadily due to growth in
population and wealth level
LNG trade grew with
more short-term contracts
and a larger diversity of
players
Asian and European LNG
prices decreased yet small
price differentials across
regions remained
Arbitration has closed

Summary
2014
Portfolio of
terminals Value creation Q1 2015
trading update
Financial Market Update 22 April 2015
Question &
answers
10
• We are grateful towards our employees, customers and all
stakeholders for their continued trust in our company
• Our dedicated staff has delivered solid results under dynamic
business circumstances
Summary 2014
• We will continue with the execution of our strategy, focus on
further aligning of our network and on improving our safe
service delivery
• We aim for increasing free cash flow generation supporting the
value creation ambitions

Financial Market Update 22 April 2015
Summary
2014
Value
creation Q1 2015
trading update
Question &
answers
Portfolio of
terminals
11
Portfolio of terminals
11 Gases Industrial terminals Hub terminals Distribution terminals

Financial Market Update 22 April 2015
Summary
2014
Value
creation Q1 2015
trading update
Question &
answers
Portfolio of
terminals
12
Hub terminals

Financial Market Update 22 April 2015
Summary
2014
Value
creation Q1 2015
trading update
Question &
answers
Portfolio of
terminals
Shipping Connections
Pricing Center
Trading Liquidity
Storage and Blending capabilities
Changing product Specifications
Strategic Location
Refining Centers
Intra & inter Regional imbalances
Resilient fundamentals for hubs serving a physical market
What is a hub?
13

Financial Market Update 22 April 2015
Summary
2014
Value
creation Q1 2015
trading update
Question &
answers
Portfolio of
terminals
Vopak well established at hub locations
14
21 terminals in different product markets with 19 million cbm
ARA region
All product groups
13 terminals
11 million cbm
Strait of Hormuz
Oil products
1 terminal
2.1 million cbm
Houston
US Gulf Coast
Chemicals & oil
1 terminal
1.1 million cbm
Singapore Straits
All product groups
6 terminals
5.0 million cbm
All hub locations will maintain their importance
• Combination of several demand drivers
• Growing imbalances and changing flows
• Impact US and Middle East developments significant

Financial Market Update 22 April 2015
Summary
2014
Value
creation Q1 2015
trading update
Question &
answers
Portfolio of
terminals
Enhancing market leadership
15
Expansion and improvement at hub locations (2012-2014)
ARA region
Midex expansion
Westpoort phase 2/3
Westpoort service improvement
Vlissingen gas storage
Eurotank 185/190
LBBR
Fujairah
Phase 6 CCP
Phase 7 Crude
OTB pipeline connections
Houston
US Gulf
Rail track expansion
Acquired land position
Singapore Straits
Banyan Chemicals and Base oils
Penjuru phase 3 Oil
Singapore Ammonia
Pengerang phase 1a-1c Refined products
Banyan LPG
Vopak enhances its market position at hub locations
• Capital disciplined improvements and expansion investments
• Land available for further selective growth

Financial Market Update 22 April 2015
Summary
2014
Value
creation Q1 2015
trading update
Appendix Question &
answers
Portfolio of
terminals
16
Industrial terminals

Financial Market Update 22 April 2015
Summary
2014
Value
creation Q1 2015
trading update
Appendix Question &
answers
Portfolio of
terminals
Experience with industrial terminals First industrial terminal dates back to 1973
Haiteng Gulei
(China)
2014
Sakra
(Singapore)
Thai Tank
(Thailand)
1992
Kertih
(Malaysia)
Caojing
(China)
Banyan
(Singapore)
2006
1971
Tarragona
(Spain)
1994
We are the leading independent operator of industrial terminals
1994
Chemiehaven
(Netherlands) 2008
Merak
(Indonesia)
1994
Engro
(Pakistan)
Ethylene Tianjin
(China)
2005
Al Jubail
(Saudi Arabia)
Yanbu
(Saudi Arabia)
Windmill
(UK)
1973
1978 Teesside
(UK)
Deer Park
(U.S.A.)
1994
1997
1998
2004
2000
…
17

Financial Market Update 22 April 2015
Summary
2014
Value
creation Q1 2015
trading update
Appendix Question &
answers
Portfolio of
terminals
1 2 3
Efficient and fit-for-purpose capital expenditure • Build customer-tailored infrastructure (design optimization)
Economies of scale and competitive cost position • Sharing resources and common facilities
4 5
6
Joint venture structure • Lasting commitment from the joint venture partner
7 High barriers to entry for competitors & newcomers
The case of the industrial terminal Industrial terminals have a robust risk return profile
Long-term contracts • Stability and guarantee of business
Doing things ‘the Vopak way’ • In charge of operations, Vopak standards
Supply chain • Increased efficiency via pooling of feedstock / comingled storage – lower operational costs
18

Financial Market Update 22 April 2015
Summary
2014
Value
creation Q1 2015
trading update
Appendix Question &
answers
Portfolio of
terminals
Scale of integration industrial terminals
Terminal
Full industrial terminal
Partial industrial terminal
Full industrial terminals concentrated in Asia and China
Deer Park
Chemiehaven
Tarragona
Windmill
Teesside
Yanbu
Al-Jubail
Engro
Thai Tank
Merak
Kertih
Sakra
Ethylene Tianjin
Haiteng
Caojing
19
Zhangjiagang
Aratu

Financial Market Update 22 April 2015
Summary
2014
Value
creation Q1 2015
trading update
Question &
answers
Portfolio of
terminals
20
Distribution terminals

Financial Market Update 22 April 2015
Summary
2014
Value
creation Q1 2015
trading update
Question &
answers
Portfolio of
terminals
21
Vopak operates distribution terminals
Hub
Import / export Industrial
Import, distribution and export
at a global meeting point for
trade.
Imports and exports for end-
users in a specific region.
Net short markets with a
sustainable business case and
flexible infrastructure
Logistical center integrated via pipelines serving
petrochemical facilities within an industrial
complex.
Example: Vopak Terminal Europoort (NL)
Example: Vopak Terminal London (UK)
Example: Vopak Terminal Sakra (Singapore)

Financial Market Update 22 April 2015
Summary
2014
Value
creation Q1 2015
trading update
Question &
answers
Portfolio of
terminals
22
Oil
Chemicals
Industrial
Divestments
Gasses
Note: This is only a selection of projects.
Canterm
Canada
ARA
Antwerp Durban
South Africa
Major import and distribution terminals
Sydney
Australia
Zhangjiagang
China
Jakarta
Indonesia

Financial Market Update 22 April 2015
Summary
2014
Value
creation Q1 2015
trading update
Question &
answers
Portfolio of
terminals
23
Gas markets

Financial Market Update 22 April 2015
Summary
2014
Value
creation Q1 2015
trading update
Question &
answers
Portfolio of
terminals
24
LNG market forecasted to gain momentum
Global gas market is expected to increase by around 30% by 2030
LNG is expected to increase its share of the global gas market
LNG production is rapidly increasing and will drive growth
Further globalization of the gas business through flexible supplies
New LNG markets (small scale market potential following environmental controls)
Gas price differentials (US, Europe, Asia) will narrow but not disappear

Financial Market Update 22 April 2015
Summary
2014
Value
creation Q1 2015
trading update
Question &
answers
Portfolio of
terminals
25
Vopak can provide value to customers
Hinterland downstream Primarily regasification
Small scale Regional distribution
(break-bulk services and
small-scale terminals)
LNG as a fuel
(bunkering and truck loading
services)
Other services
Strategic storage
Production satellite
Cool down
Ship to ship
(Small-scale) liquefaction
Value chain optimization
Trading (short-term contract)
Supply chain enhancement
(point-to-point deliveries)
Seasonal contango
1 2
3 4

Financial Market Update 22 April 2015
Summary
2014
Value
creation Q1 2015
trading update
Appendix Question &
answers
Portfolio of
terminals
26
Value creation
Gases Industrial terminals Hub terminals Distribution terminals

Financial Market Update 22 April 2015
Summary
2014
Value
creation Q1 2015
trading update
Appendix Question &
answers
Portfolio of
terminals
Capital disciplined growth
Clear strategic focus
Free cash flow and return on investment focus
Balanced risk-return profile of a well diversified portfolio of strategically
located assets providing essential infrastructure services
Entrepreneurial risk-return weighing
Leveraging on network synergies
Balancing contract duration, first mover advantage and option value
Value creation
27

Financial Market Update 22 April 2015
Summary
2014
Value
creation Q1 2015
trading update
Appendix Question &
answers
Portfolio of
terminals
Value creation in action
Terminal portfolio Business operations Organization
Capital disciplined allocation Know-how capitalization Alignment
1
2
3
Optimizing the CAPITAL ALLOCATION
Improving the RETURN PROFILE
Further Optimizing THE RISK PROFILE
- Terminal portfolio criteria
- Divestments of 15 terminals
- Optimizing capex programs
- Focus on free cash flow
- Cost reduction
- Contract duration management
- Effective execution of Terminal
Master Plans
28

Financial Market Update 22 April 2015
Summary
2014
Value
creation Q1 2015
trading update
Question &
answers
Portfolio of
terminals
Q1 2015 trading update

Financial Market Update 22 April 2015
Summary
2014
Value
creation Q1 2015
trading update
Question &
answers
Portfolio of
terminals
30
• We are on track in executing our updated strategy as announced
on July 2nd 2014
Key topics • In Q1 2015, we delivered improved financial results against a
background of a competitive and dynamic business
environment
• In line with our previous outlook and based on current market
insights, Vopak expects to realize an EBITDA -excluding
exceptional items- in excess of EUR 768 million in 2015

Financial Market Update 22 April 2015
Summary
2014
Value
creation Q1 2015
trading update
Question &
answers
Portfolio of
terminals
31
* Excluding exceptional items; including net result from joint ventures and associates; ** Net profit attributable to holders of ordinary shares -excluding exceptional items- ; *** Subsidiaries only.
EBIT* In EUR million
Occupancy rate*** In percent
Q1 2015
91%
Q1 2014
88%
Q1 2013
89%
-11% +16%
Q1 2015
143.3
Q1 2014
123.8
Q1 2013
138.4
EBITDA* In EUR million
-5% +15%
Q1 2015
206.2
Q1 2014
179.6
Q1 2013
188.9
+24% -15%
Q1 2015
84.9
Q1 2014
68.2
Q1 2013
79.9
Net profit** In EUR million
Q1 2015 summary

Financial Market Update 22 April 2015
Summary
2014
Value
creation Q1 2015
trading update
Question &
answers
Portfolio of
terminals
32
EBITDA development
EBITDA development In EUR million
183
Q3
185
Q2
196
Q1
189
Q3
202
Q2
187
Q4
206
194
Q1
180
Q4 Q1
2013 2014
Note: EBITDA in EUR million excluding exceptional items and including joint ventures and associates.
While expanding our worldwide storage capacity
we were able to increase the overall occupancy rates
2015

Financial Market Update 22 April 2015
Summary
2014
Value
creation Q1 2015
trading update
Question &
answers
Portfolio of
terminals
Netherlands
Note: EBITDA in EUR million excluding exceptional items and including net result of joint ventures and associates.
EMEA
Asia Americas
+2% +12%
Q1 2015
68.2
Q1 2014
60.9
Q1 2013
59.8
+14% -6%
Q1 2015
75.4
Q1 2014
66.4
Q1 2013
70.7
+26% -3%
Q1 2015
29.4
Q1 2014
23.3
Q1 2013
24.0
+18% -17%
Q1 2015
34.0
Q1 2014
28.9
Q1 2013
34.7
EBITDA*
+15%
Q1 2015
206.2
Q1 2014
179.6
Q1 2013
188.9
-5%
33
Non-allocated
Q1 2015
-0.8
Q1 2014
0.1
Q1 2013
-0.3
Q1 2015 EBITDA per division
Financial Market Update 22 April 2015
Summary
2014
Value
creation Q1 2015
trading update
Question &
answers
Portfolio of
terminals
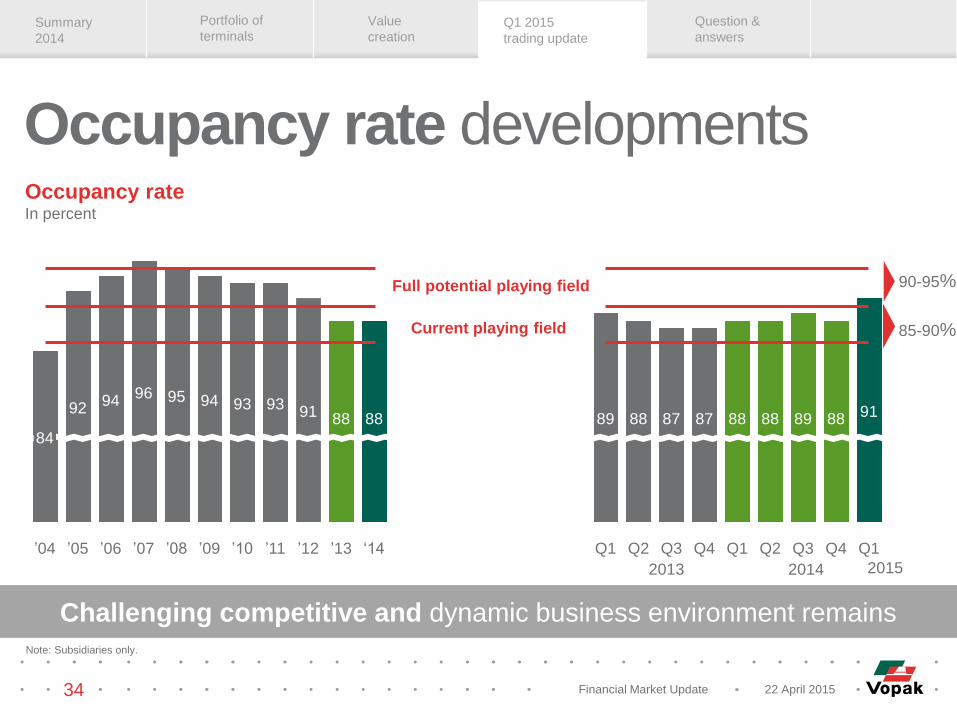
Occupancy rate In percent
2013 2014
90-95%
85-90%
Q1
91
Q4
88
Q3
89
Q2
88
Q1
88
Q4
87
Q3
87
Q2
88
Q1
89
‘14
88
’13
88
’12
91
’11
93
’10
93
’09
94
’08
95
’07
96
’06
94
’05
92
’04
84
Note: Subsidiaries only.
Current playing field
Full potential playing field
34
Occupancy rate developments
2015
Challenging competitive and dynamic business environment remains

Financial Market Update 22 April 2015
Summary
2014
Value
creation Q1 2015
trading update
Question &
answers
Portfolio of
terminals
Note: Including only announced projects under development estimated to be commissioned for the period 2015-2019 and excluding the to be realized divestments as announced in the business
review 2014.
Storage capacity In million cbm
3.7 4.0 3.8 4.0 3.78.2 8.7 9.0 6.6 8.1 8.1
9.9 10.3 12.1 12.6 12.6 12.6 14.715.1 15.1 15.5 15.8 16.7
17.5 18.1 18.319.7
20.3 20.821.7 21.4
21.7 21.8 21.8 21.821.8
3.33.33.32.32.32.21.61.51.51.51.51.41.41.41.11.11.1 2.3
2016
36.7
FY
2015
36.1
Q1
2015
34.1
2014
33.8
2013
30.5
2012
29.9
2011
27.8
2010
28.8
2009
28.3
2008
27.1
2007
21.8
2018
37.7
2017
37.7
+5.8
+14.2
2019
39.8
2006
21.2
2005
20.4
2004
20.2
2003
19.9
Subsidiaries Joint ventures and associates Only acting as operator
35
Selective growth opportunities
Vopak well positioned to further improve risk-return profile

Financial Market Update 22 April 2015
Summary
2014
Value
creation Q1 2015
trading update
Question &
answers
Portfolio of
terminals
Senior net debt : EBITDA ratio
For certain projects in joint ventures, additional limited guarantees have been provided, affecting the Senior net debt : EBITDA; * Based on Dutch GAAP.
Maximum ratio under
current US PP programs
Maximum ratio under other
PP programs and syndicated
revolving credit facility
0
1
2
3
4
5
2014
2.83
2013
2.53
2012
2.38
2011
2.65
2010
2.63
2009
2.23
2008
2.54
2007
1.71
2006
1.61
2005
1.76
2004
2.20
2003*
2.42 2.85
Q1
2015
36
2.75
3.0
3.75
Selective capital disciplined growth

Financial Market Update 22 April 2015
Summary
2014
Value
creation Q1 2015
trading update
Question &
answers
Portfolio of
terminals
Ordinary shares
Listed on Euronext
Market capitalization:
EUR 6.6 billion as per
April 2015
Subordinated loans
Subordinated USPP
loans: USD 101.8
million
Preference shares
Cancelled as per
1 January 2015
EUR 44 million
USD: 2.0 billion
SGD: 225 million and
JPY: 20 billion
Average remaining
duration ~ 8 years
EUR 1.0 billion
15 banks participating
Duration until
2 February 2018
Eur 250 million drawn
37
Vopak’s capital structure
* As per 31 March 2015
Private placement
program*
Syndicated
revolving
credit facility*
Equity(-like)*

Financial Market Update 22 April 2015
Summary
2014
Value
creation Q1 2015
trading update
Question &
answers
Portfolio of
terminals
38
Note: Width of the boxes does not represent actual percentages; company estimates; * Excluding exceptional items ;including net result from joint ventures and associates.
Oil products Chemicals Industrial terminals
& other pipeline
connected infra
Biofuels &
vegoils LNG
Solid
Mixed
Solid
Mixed
2015
2014
Different demand
drivers
Steady
Steady Solid
Solid
~x% Share of EBITDA*
Major Hubs supporting intercontinental product flows
Import/distr. in major markets with structural deficits
Other infra
Outlook assumptions
~50% ~20% 15% - 20% 2.5% - 5% 7.5% - 10%
Contract
duration ~0 - 5 years ~1 - 5 years ~5 - 15 years ~0 - 3 years ~10 - 20 years
Different demand
drivers

Financial Market Update 22 April 2015
Summary
2014
Value
creation Q1 2015
trading update
Question &
answers
Portfolio of
terminals
39
Outlook elements
In line with our previous outlook and based on current market insights,
Vopak expects to realize an EBITDA -excluding exceptional items- in excess
of EUR 768 million in 2015.
2014 Productivity and
organisations
efficiency
enhancements
Fx and
pension costs
Divestments Expansions
and
acquisitions
2015 Uncertainties incl.
phased build-up

Financial Market Update 22 April 2015
Summary
2014
Value
creation Q1 2015
trading update
Question &
answers
Portfolio of
terminals
40
Questions answers

Summary
2014
Portfolio of
terminals Value creation Q1 2015
trading update
Financial Market Update 22 April 2015
Question &
answers
• • • • • • • • • • • • • • • • • • • • • • • • • • • • • • • • • •
• • • • • • • • • • • • • • • • • • • • • • • • • • • • • • • • • •
• • • • • • • • • • • • • • • • • • • • • • • • • • • • • • • • • •
• • • • • • • • • • • • • • • • • • • • • • • • • • • • • • • • • •
• • • • • • • • • • • • • • • • • • • • • • • • • • • • • • • • • •
• • • • • •
• • • • • • • • • • • • • • • • • • • • • • • • • • • • • • • • • •
• • • • • • • • • • • • • • • • • • • • • • • • • • • • • • • • • •
Royal Vopak I Westerlaan 10 I 3016 CK Rotterdam I The Netherlands I Tel: +31 10 400 2911 I Fax: +31 10 413 9829 I www.vopak.com
We have built
our company
over 400 years on
trust and reliability